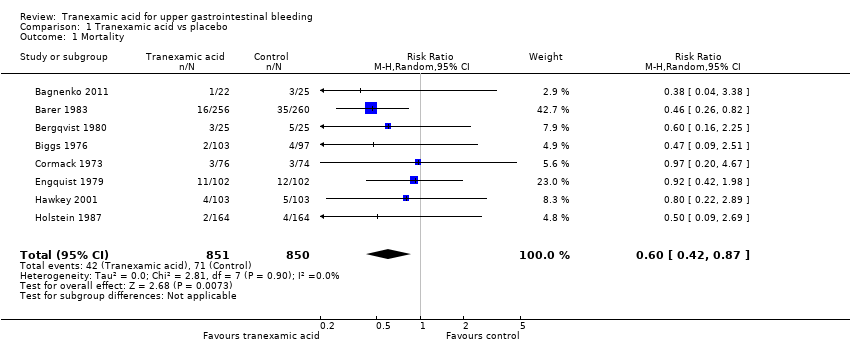
| 1 Mortality Show forest plot | 8 | 1701 | Risk Ratio (M‐H, Random, 95% CI) | 0.60 [0.42, 0.87] |
|
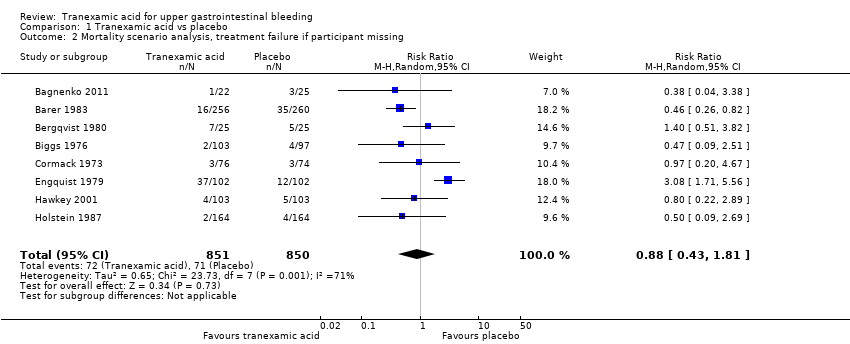
| 2 Mortality scenario analysis, treatment failure if participant missing Show forest plot | 8 | 1701 | Risk Ratio (M‐H, Random, 95% CI) | 0.88 [0.43, 1.81] |
|
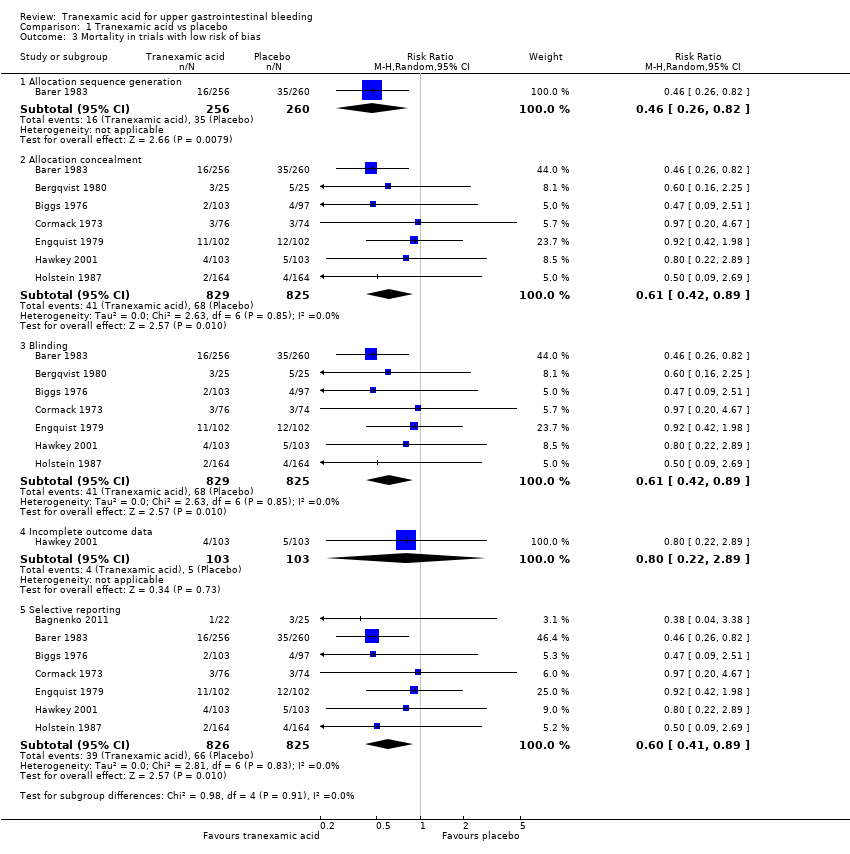
| 3 Mortality in trials with low risk of bias Show forest plot | 8 | | Risk Ratio (M‐H, Random, 95% CI) | Subtotals only |
|
| 3.1 Allocation sequence generation | 1 | 516 | Risk Ratio (M‐H, Random, 95% CI) | 0.46 [0.26, 0.82] |
| 3.2 Allocation concealment | 7 | 1654 | Risk Ratio (M‐H, Random, 95% CI) | 0.61 [0.42, 0.89] |
| 3.3 Blinding | 7 | 1654 | Risk Ratio (M‐H, Random, 95% CI) | 0.61 [0.42, 0.89] |
| 3.4 Incomplete outcome data | 1 | 206 | Risk Ratio (M‐H, Random, 95% CI) | 0.8 [0.22, 2.89] |
| 3.5 Selective reporting | 7 | 1651 | Risk Ratio (M‐H, Random, 95% CI) | 0.60 [0.41, 0.89] |
| 4 Mortality in relation to endoscopic therapy Show forest plot | 8 | 1701 | Risk Ratio (M‐H, Random, 95% CI) | 0.60 [0.42, 0.87] |
|
| 4.1 Endoscopic therapy not used | 6 | 1448 | Risk Ratio (M‐H, Random, 95% CI) | 0.60 [0.40, 0.88] |
| 4.2 Endoscopic therapy used to control bleeding | 2 | 253 | Risk Ratio (M‐H, Random, 95% CI) | 0.66 [0.22, 2.00] |
| 5 Mortality in relation to language of publication Show forest plot | 8 | 1701 | Risk Ratio (M‐H, Random, 95% CI) | 0.60 [0.42, 0.87] |
|
| 5.1 Trials published in English | 7 | 1654 | Risk Ratio (M‐H, Random, 95% CI) | 0.61 [0.42, 0.89] |
| 5.2 Trials translated from Russian | 1 | 47 | Risk Ratio (M‐H, Random, 95% CI) | 0.38 [0.04, 3.38] |
| 6 Rebleeding Show forest plot | 7 | 1651 | Risk Ratio (M‐H, Random, 95% CI) | 0.72 [0.50, 1.03] |
|
| 7 Rebleeding scenario analysis, treatment failure if participant missing Show forest plot | 7 | 1651 | Risk Ratio (M‐H, Random, 95% CI) | 0.80 [0.51, 1.27] |
|
| 8 Rebleeding in trials with low risk of bias Show forest plot | 7 | 5581 | Risk Ratio (M‐H, Random, 95% CI) | 0.78 [0.65, 0.93] |
|
| 8.1 Allocation sequence generation | 1 | 516 | Risk Ratio (M‐H, Random, 95% CI) | 1.16 [0.83, 1.61] |
| 8.2 Allocation concealment | 6 | 1604 | Risk Ratio (M‐H, Random, 95% CI) | 0.73 [0.50, 1.07] |
| 8.3 Blinding | 6 | 1604 | Risk Ratio (M‐H, Random, 95% CI) | 0.73 [0.50, 1.07] |
| 8.4 Incomplete outcome data | 1 | 206 | Risk Ratio (M‐H, Random, 95% CI) | 0.9 [0.38, 2.12] |
| 8.5 Selective reporting | 7 | 1651 | Risk Ratio (M‐H, Random, 95% CI) | 0.72 [0.50, 1.03] |
| 9 Rebleeding in relation to endoscopic therapy Show forest plot | 7 | 1651 | Risk Ratio (M‐H, Random, 95% CI) | 0.72 [0.50, 1.03] |
|
| 9.1 Endoscopic therapy not used | 5 | 1398 | Risk Ratio (M‐H, Random, 95% CI) | 0.70 [0.45, 1.08] |
| 9.2 Endoscopic therapy used to control bleeding | 2 | 253 | Risk Ratio (M‐H, Random, 95% CI) | 0.77 [0.36, 1.62] |
| 10 Rebleeding in relation to language of publication Show forest plot | 7 | 1651 | Risk Ratio (M‐H, Random, 95% CI) | 0.72 [0.50, 1.03] |
|
| 10.1 Trials published in English | 6 | 1604 | Risk Ratio (M‐H, Random, 95% CI) | 0.73 [0.50, 1.07] |
| 10.2 Trials translated from Russian | 1 | 47 | Risk Ratio (M‐H, Random, 95% CI) | 0.45 [0.10, 2.11] |
| 11 Myocardial infarction, pulmonary embolism and cerebral infarction Show forest plot | 3 | 1048 | Risk Ratio (M‐H, Random, 95% CI) | 1.37 [0.36, 5.28] |
|
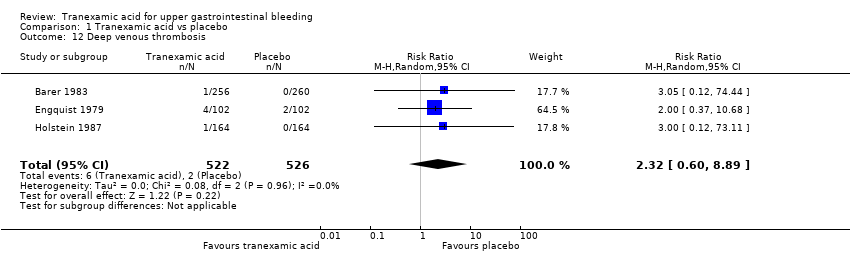
| 12 Deep venous thrombosis Show forest plot | 3 | 1048 | Risk Ratio (M‐H, Random, 95% CI) | 2.32 [0.60, 8.89] |
|
| 13 Any thromboembolic event Show forest plot | 4 | 1095 | Risk Ratio (M‐H, Random, 95% CI) | 1.86 [0.66, 5.24] |
|
| 14 Surgery Show forest plot | 7 | 1551 | Risk Ratio (M‐H, Random, 95% CI) | 0.61 [0.35, 1.04] |
|
| 15 Transfusion required Show forest plot | 5 | 931 | Risk Ratio (M‐H, Random, 95% CI) | 1.02 [0.94, 1.11] |
|