Ujian rintangan antiretroviral pada orang HIV‐positif
Appendices
Appendix 1. CENTRAL search strategy
| ID | Search |
| #1 | MeSH descriptor: [HIV Infections] explode all trees |
| #2 | MeSH descriptor: [HIV] explode all trees |
| #3 | hiv or hiv‐1* or hiv‐2* or hiv1 or hiv2 or (hiv near infect*) or (human immunodeficiency virus) or (human immunedeficiency virus) or (human immune‐deficiency virus) or (human immuno‐deficiency virus) or (human immune deficiency virus) or (human immuno deficiency virus) or (acquired immunodeficiency syndrome) or (acquired immunedeficiency syndrome) or (acquired immuno‐deficiency syndrome) or (acquired immune‐deficiency syndrome) or (acquired immun* deficiency syndrome) |
| #4 | MeSH descriptor: [Lymphoma, AIDS‐Related] this term only |
| #5 | MeSH descriptor: [Sexually Transmitted Diseases, Viral] this term only |
| #6 | #1 or #2 or #3 or #4 or #5 |
| #7 | [mh ^genotype] or genotype:ti,ab,kw or [mh "genotypic techniques"] or genotypic:ti,ab,kw or genotyping:ti,ab,kw or genotypical:ti,ab,kw (Word variations have been searched) |
| #8 | [mh ^phenotype] or phenotype:ti,ab,kw or phenotypic:ti,ab,kw or phenotyping:ti,ab,kw or phenotypical:ti,ab,kw (Word variations have been searched) |
| #9 | (resistance or resistant):ti,ab,kw (Word variations have been searched) |
| #10 | #7 or #8 or #9 |
| #11 | (test or tests or tested or testing or assay or assays):ti,ab,kw (Word variations have been searched) |
| #12 | #10 and #11 |
| #13 | [mh "drug resistance"] or resistance:ti,ab,kw or resistant:ti,ab,kw (Word variations have been searched) |
| #14 | #6 and #12 and #13 Publication Year from 1989 to xxx, in Trials |
Appendix 2. PubMed search strategy
| Search | Query |
| #11 | Search (((#1 AND #7 AND #8 AND #9))) AND ("1989/01/01"[Date ‐ Publication] : "xxxx/xx/xx"[Date ‐ Publication]) |
| #10 | Search (#1 AND #7 AND #8 AND #9) |
| #9 | Search (randomized controlled trial [pt] OR controlled clinical trial [pt] OR randomized [tiab] OR placebo [tiab] OR drug therapy [sh] OR randomly [tiab] OR trial [tiab] OR groups [tiab] OR cohort studies[mh:noexp] OR cohort[tiab] OR longitudinal studies[mh:noexp] OR longitudinal[tiab] OR follow‐up studies[mh:noexp] OR follow‐up[tiab] OR followup[tiab] OR prospective studies[mh:noexp] OR prospective[tiab] OR retrospective studies[mh:noexp] OR retrospective[tiab] OR epidemiologic studies[mh:noexp]) NOT (animals [mh] NOT humans [mh]) |
| #8 | Search (drug resistance[mh] OR resistance[tiab] OR resistant[tiab]) |
| #7 | Search (#5 AND #6) |
| #6 | Search (test[tiab] OR tests[tiab] OR testing[tiab] OR tested[tiab] OR assay[tiab] OR assays[tiab]) |
| #5 | Search (#2 OR #3 OR #4) |
| #4 | Search (resistance[tiab] OR resistant[tiab]) |
| #3 | Search (phenotype[mh:noexp] OR phenotype[tiab] OR phenotypic[tiab] OR phenotyping[tiab] OR phenotypical[tiab]) |
| #2 | Search (genotype[mh:noexp] OR genotypic techniques[mh] genotype[tiab] OR genotypic[tiab] OR genotyping[tiab] OR genotypical[tiab]) |
| #1 | Search (HIV Infections[MeSH] OR HIV[MeSH] OR hiv[tiab] OR hiv‐1*[tiab] OR hiv‐2*[tiab] OR hiv1[tiab] OR hiv2[tiab] OR hiv infect*[tiab] OR human immunodeficiency virus[tiab] OR human immunedeficiency virus[tiab] OR human immuno‐deficiency virus[tiab] OR human immune‐deficiency virus[tiab] OR ((human immun*[tiab]) AND (deficiency virus[tiab])) OR acquired immunodeficiency syndrome[tiab] OR acquired immunedeficiency syndrome[tiab] OR acquired immuno‐deficiency syndrome[tiab] OR acquired immune‐deficiency syndrome[tiab] OR ((acquired immun*[tiab]) AND (deficiency syndrome[tiab])) |
Appendix 3. Embase search strategy
| No. | Query |
| #17 | #1 AND #7 AND #8 AND #16 |
| #16 | #11 NOT #15 |
| #15 | #12 NOT #14 |
| #14 | #12 AND #13 |
| #13 | 'human'/de OR 'normal human'/de OR 'human cell'/de |
| #12 | 'animal'/de OR 'animal experiment'/de OR 'invertebrate'/de OR 'animal tissue'/de OR 'animal cell'/de OR 'nonhuman'/de |
| #11 | #9 OR #10 |
| #10 | 'randomized controlled trial'/de OR 'randomized controlled trial' OR random*:ab,ti OR trial:ti OR allocat*:ab,ti OR factorial*:ab,ti OR placebo*:ab,ti OR assign*:ab,ti OR volunteer*:ab,ti OR 'crossover procedure'/de OR 'crossover procedure' OR 'double‐blind procedure'/de OR 'double‐blind procedure' OR 'single‐blind procedure'/de OR 'single‐blind procedure' OR (doubl* NEAR/3 blind*):ab,ti OR (singl*:ab,ti AND blind*:ab,ti) OR crossover*:ab,ti OR cross+over*:ab,ti OR (cross NEXT/1 over*):ab,ti |
| #9 | 'prospective study'/de OR prospective:ab,ti OR 'cohort analysis'/de OR cohort:ab,ti OR 'longitudinal study' OR longitudinal:ab,ti OR 'experimental design'/de OR 'retrospective study'/de OR retrospective:ab,ti OR 'follow up'/de OR 'follow+up':ab,ti OR followup:ab,ti |
| #8 | 'drug resistance'/exp OR resistance:ab,ti OR resistant:ab,ti |
| #7 | #5 AND #6 |
| #6 | test:ab,ti OR tests:ab,ti OR testing:ab,ti OR tested:ab,ti OR assay:ab,ti OR assays:ab,ti |
| #5 | #2 OR #3 OR #4 |
| #4 | resistance:ab,ti OR resistant:ab,ti |
| #3 | 'phenotype'/de OR phenotype:ab,ti OR phenotypic:ab,ti OR phenotyping:ab,ti OR genotypical:ab,ti |
| #2 | 'genotyping technique'/de OR genotype:ab,ti OR genotypic:ab,ti OR genotyping:ab,ti OR genotypical:ab,ti |
| #1 | 'human immunodeficiency virus infection'/exp OR 'human immunodeficiency virus'/exp OR 'human immunodeficiency virus':ab,ti OR 'human immuno+deficiency virus':ab,ti OR 'human immunedeficiency virus':ab,ti OR 'human immune+deficiency virus':ab,ti OR hiv:ab,ti OR 'hiv‐1':ab,ti OR 'hiv‐2':ab,ti OR 'acquired immunodeficiency syndrome':ab,ti OR 'acquired immuno+deficiency syndrome':ab,ti OR 'acquired immunedeficiency syndrome':ab,ti OR 'acquired immune+deficiency syndrome':ab,ti |
Appendix 4. Cochrane ‘Risk of bias' tool
| Domain | Description | Review authors’ judgement |
| Sequence generation | Describe the method used to generate the allocation sequence in sufficient detail to allow an assessment of whether it should produce comparable groups. | Was the allocation sequence adequately generated? |
| Allocation concealment | Describe the method used to conceal the allocation sequence in sufficient detail to determine whether intervention allocations could have been foreseen in advance of, or during, enrolment. | Was allocation adequately concealed? |
| Blinding of participants, personnel, and outcome assessors | Describe all measures used, if any, to blind study participants and personnel from knowledge of which intervention a participant received. Provide any information related to whether the intended blinding was effective. | Was knowledge of the allocated intervention adequately prevented during the study? |
| Incomplete outcome data | Describe the completeness of outcome data for each main outcome, including attrition and exclusions from analysis. State whether attrition and exclusions were reported, the numbers in each intervention group (compared with total randomized participants), reasons for attrition/exclusions when reported, and any re‐inclusions in analyses performed by the review authors. | Were incomplete outcome data adequately addressed? |
| Selective outcome reporting | State how the possibility of selective outcome reporting was examined by the review authors and what was found. | Are reports of the study free of the suggestion of selective outcome reporting? |
| Other sources of bias | State any important concerns about bias not addressed in the other domains in the tool. If particular questions/entries were prespecified in the review protocol, responses should be provided for each question/entry. | Was the study apparently free of other problems that could put it at high risk of bias? |
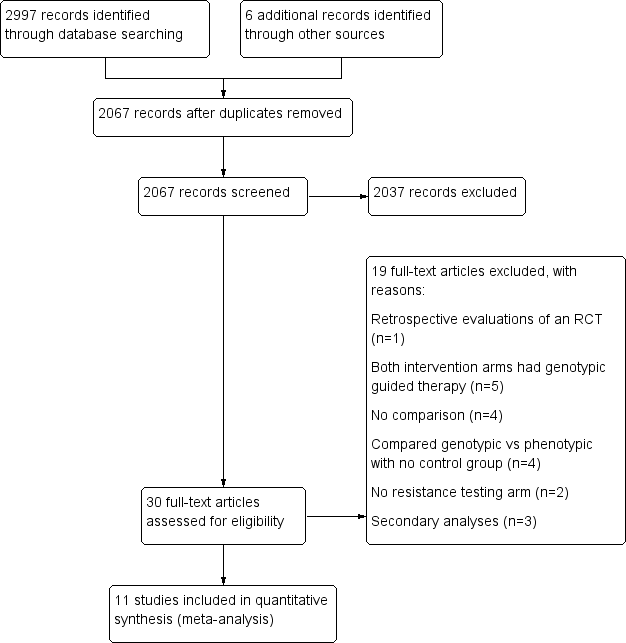
PRISMA study flow diagram.

‘Risk of bias' summary: review authors' judgements about each ‘Risk of bias' item for each included study.
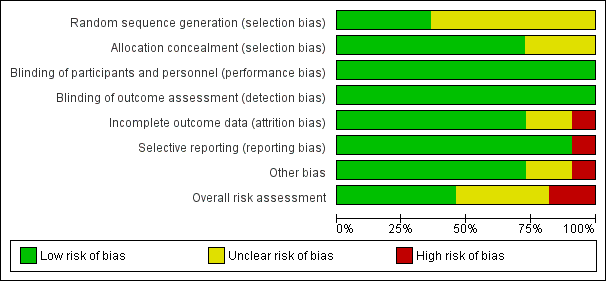
‘Risk of bias' graph: review authors' judgements about each ‘Risk of bias' item presented as percentages across all included studies.
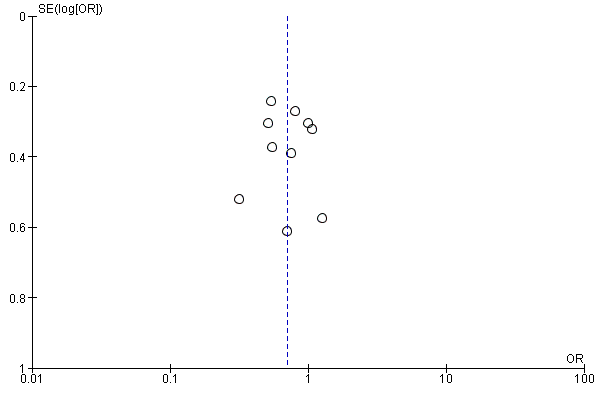
Funnel plot of comparison: 1 Resistance testing versus no resistance testing, outcome: 1.2 Virological failure.

Forest plot of comparison: 1 Resistance testing (RT) versus no RT, outcome: 1.1 Mortality.

Forest plot of comparison: 1 Resistance testing (RT) versus no RT, outcome: 1.2 Virological failure.

Forest plot of comparison: 1 Resistance testing (RT) versus no RT, outcome: 1.3 Change in CD4 cell count.

Forest plot of comparison: 1 Resistance testing (RT) versus no RT, outcome: 1.4 Progression to AIDS.
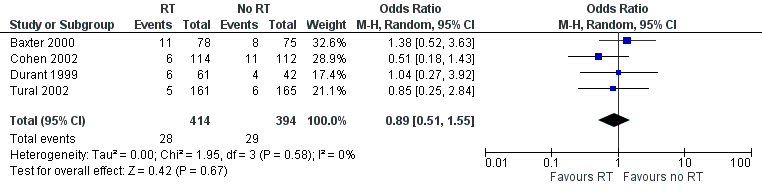
Forest plot of comparison: 1 Resistance testing (RT) versus no RT, outcome: 1.5 Adverse events.
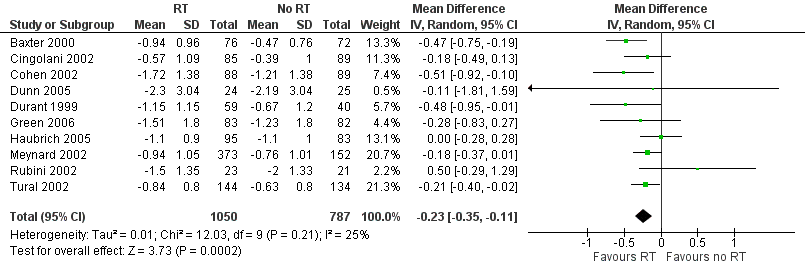
Forest plot of comparison: 1 Resistance testing (RT) versus no RT, outcome: 1.6 Change in viral load.

Comparison 1 Resistance testing (RT) versus no RT, Outcome 1 Mortality.

Comparison 1 Resistance testing (RT) versus no RT, Outcome 2 Virological failure.

Comparison 1 Resistance testing (RT) versus no RT, Outcome 3 Change in CD4 cell count.

Comparison 1 Resistance testing (RT) versus no RT, Outcome 4 Progression to AIDS.

Comparison 1 Resistance testing (RT) versus no RT, Outcome 5 Adverse events.

Comparison 1 Resistance testing (RT) versus no RT, Outcome 6 Change in viral load.

Comparison 2 RT versus no RT: subgroup analyses for type of RT, Outcome 1 Mortality.

Comparison 2 RT versus no RT: subgroup analyses for type of RT, Outcome 2 Virological failure.

Comparison 3 RT versus no RT: subgroup analyses for expert advice, Outcome 1 Mortality.

Comparison 3 RT versus no RT: subgroup analyses for expert advice, Outcome 2 Virological failure.

Comparison 4 RT versus no RT: subgroup analyses for age, Outcome 1 Mortality.

Comparison 4 RT versus no RT: subgroup analyses for age, Outcome 2 Virological failure.
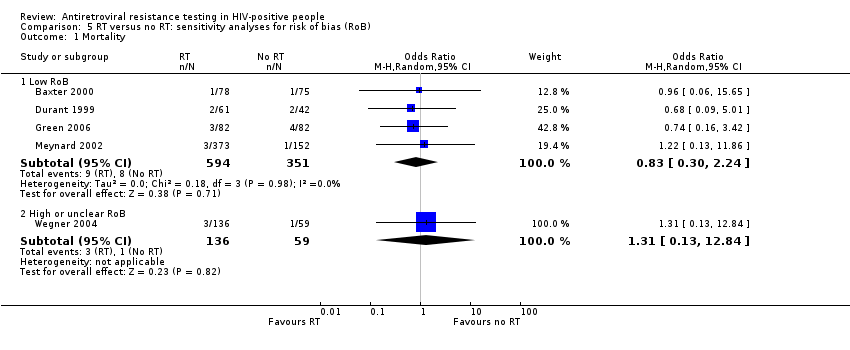
Comparison 5 RT versus no RT: sensitivity analyses for risk of bias (RoB), Outcome 1 Mortality.

Comparison 5 RT versus no RT: sensitivity analyses for risk of bias (RoB), Outcome 2 Virological failure.
| Resistance testing versus no resistance testing in HIV‐positive people | ||||||
| Patient or population: HIV‐positive people | ||||||
| Outcomes | Anticipated absolute effects* (95% CI) | Relative effect | Number of participants | Certainty of the evidence | Comments | |
| Risk with no resistance testing | Risk with resistance testing | |||||
| Mortality | Study population | OR 0.89 | 1140 | ⊕⊕⊕⊝ Due to imprecision | Resistance testing probably has little or no impact on mortality | |
| 22 per 1000 | 20 per 1000 | |||||
| Virological failure | Study population | OR 0.70 | 1728 | ⊕⊕⊝⊝ Due to risk of bias and publication bias | Resistance testing may reduce the risk of virological failure | |
| 660 per 1000 | 576 per 1000 | |||||
| Change in CD4 cell count | Mean change in CD4 cell count was 0. | MD 1 lower | ‐ | 1349 | ⊕⊕⊕⊝ Due to risk of bias | Resistance testing probably has little or no effect on change in CD4 cell count |
| Progression to AIDS | Study population | OR 0.64 | 809 | ⊕⊕⊕⊝ Due to indirectness | Resistance testing probably has little or no impact on progression to AIDS | |
| 67 per 1000 | 44 per 1000 | |||||
| Adverse events | Study population | OR 0.89 | 808 | ⊕⊕⊝⊝ Due to risk of bias and indirectness | Resistance testing may have little or no effect on adverse effects | |
| 74 per 1000 | 66 per 1000 | |||||
| Change in viral load | Mean change in viral load was 0. | MD 0.23 lower | ‐ | 1837 | ⊕⊕⊕⊝ Due to risk of bias | Resistance testing probably results in a lower viral load |
| Quality of life ‐ not reported | ‐ | ‐ | ‐ | ‐ | ‐ | ‐ |
| New opportunistic infection ‐ not reported | ‐ | ‐ | ‐ | ‐ | ‐ | ‐ |
| *The risk in the intervention group (and its 95% CI) is based on the assumed risk in the comparison group and the relative effect of the intervention (and its 95% CI). | ||||||
| GRADE Working Group grades of evidence | ||||||
| aRisk of bias: all studies included for this outcome were not blinded, but we did not downgrade for this, as lack of blinding is unlikely to introduce bias. | ||||||
| Trial ID (acronym) | Location | Exposure criteria | Definition of virological failure at entry | Type of resistance testing compared to control | Primary virological success cutoff point (copies/mL) | Expert opinion | Duration of follow‐up (weeks) |
| USA | A combination antiretroviral regimen containing a single PI (indinavir, nelfinavir, saquinavir, or ritonavir) and 2 NRTIs | Four conditions: (1) patient taking a current triple‐drug regimen for at least 16 weeks; (2) a locally determined screening HIV‐1‐RNA level > 20,000 copies/mL by the Roche Amplicor HIV‐1 assay or > 10,000 copies/mL by the Chiron branched chain (bDNA) assay within 6 weeks before a required baseline visit; (3) documentation that the screening HIV‐1‐RNA level was 3‐fold greater than the nadir HIV‐1‐RNA level while on the triple‐drug regimen, or that the nadir was < 500 copies/mL; and (4) a centrally determined HIV‐1‐RNA level > 5000 copies/mL by the Chiron 2.0 bDNA assay using plasma collected at the baseline visit | Genotype | NA | Yes | 12 | |
| Cingolani 2002 (ARGENTA) | Italy | At least 2 months on a highly active antiretroviral regimen | Two conditions: (1) plasma viral load > 2000 copies/mL in at least two consecutive determinations; or (2) < 1 log reduction in HIV RNA more than 2 months after the start of the last regimen | Genotype | < 500 | Yes | 12 |
| USA | At least 2 NRTIs and only one PI, taken for at least 1 month before screening | HIV‐1‐RNA plasma levels ≥ 2000 copies/mL | Phenotype | < 400 | No | 16 | |
| Dunn 2005 (ERA) | UK | On ART | Most recent HIV‐1‐RNA plasma viral load (VL) exceeding 2000 copies/mL | Genotype | < 50 | No | 52 |
| Durant 1999 (VIRADAPT) | France | At least 6 months of treatment with nucleoside analogues and at least 3 months of treatment with a protease inhibitor | Plasma HIV‐1‐RNA > 10,000 copies/mL | Genotype | < 200 | No | 24 |
| Green 2006 (PERA (PENTA 8)) | Italy, Brazil, UK, Spain, Germany, Portugal | Greater exposure than 2 or 3 nucleoside reverse transcriptase inhibitors (NRTIs) for < 2 years | Most recent HIV‐1‐RNA plasma viral load > 2000 copies/mL | Genotype | < 50 | No | 96 |
| Haubrich 2005 (CCTG) | USA | At least 6 months of previous ART, exposure to no more than 2 prior protease inhibitors (PIs) | HIV RNA > 400 copies/mL | Phenotype | < 400 | No | 52 |
| USA | Previous exposure to at least 1 protease inhibitor (PI) for at least 3 months | Plasma HIV‐1‐RNA > 1000 copies/mL | Genotype and Phenotype | < 200 | No | 36 | |
| Brazil | Previous exposure to at least 2 ART regimens, with failure of their current therapy | Not reported | Genotype | Not reported | No | 24 | |
| Tural 2002 (Havana) | Spain | Stable antiretroviral therapy combination for longer than 6 months | Plasma HIV‐1‐RNA ≥ 1000 copies/mL | Genotype | < 400 | Yes | 24 |
| USA | Receiving a stable ART regimen containing ≥ 2 drugs for at least 8 weeks before randomization | VL > 3.0 log₁₀ copies/mL concomitant with ≥ 1 of the following conditions: < 1.0 log₁₀ reduction in VL 4 weeks after start of a therapy regimen, failure to suppress VL to < 200 copies/mL 6 weeks after start of therapy, detection of plasma VL > 3.0 log₁₀ copies/mL after initial suppression to < 200 copies/mL, or increase of > 0.5 log₁₀ copies/mL (to > 3.0 log₁₀ copies/mL) from the nadir VL that could not be directly attributed to vaccination or intercurrent illness | Genotype and Phenotype | NA | No | 150 | |
| Abbreviations: ART: antiretroviral therapy; bDNA: branched DNA assay; NA: not applicable; NRTI: nucleoside reverse transcriptase inhibitor; PI: protease inhibitor; VL: viral load. | |||||||
| Outcome or subgroup title | No. of studies | No. of participants | Statistical method | Effect size |
| 1 Mortality Show forest plot | 5 | 1140 | Odds Ratio (M‐H, Random, 95% CI) | 0.89 [0.36, 2.22] |
| 2 Virological failure Show forest plot | 10 | 1728 | Odds Ratio (M‐H, Random, 95% CI) | 0.70 [0.56, 0.87] |
| 3 Change in CD4 cell count Show forest plot | 7 | 1349 | Mean Difference (IV, Random, 95% CI) | 1.00 [‐12.49, 10.50] |
| 4 Progression to AIDS Show forest plot | 3 | 809 | Odds Ratio (M‐H, Random, 95% CI) | 0.64 [0.31, 1.29] |
| 5 Adverse events Show forest plot | 4 | 808 | Odds Ratio (M‐H, Random, 95% CI) | 0.89 [0.51, 1.55] |
| 6 Change in viral load Show forest plot | 10 | 1837 | Mean Difference (IV, Random, 95% CI) | ‐0.23 [‐0.35, ‐0.11] |
| Outcome or subgroup title | No. of studies | No. of participants | Statistical method | Effect size |
| 1 Mortality Show forest plot | 5 | 1537 | Odds Ratio (M‐H, Random, 95% CI) | 0.86 [0.37, 1.99] |
| 1.1 Genotype | 5 | 890 | Odds Ratio (M‐H, Random, 95% CI) | 0.85 [0.33, 2.21] |
| 1.2 Phenotype | 2 | 647 | Odds Ratio (M‐H, Random, 95% CI) | 0.86 [0.14, 5.35] |
| 2 Virological failure Show forest plot | 10 | 1601 | Odds Ratio (M‐H, Random, 95% CI) | 0.68 [0.55, 0.85] |
| 2.1 Genotype | 8 | 1230 | Odds Ratio (M‐H, Random, 95% CI) | 0.67 [0.52, 0.87] |
| 2.2 Phenotype | 3 | 371 | Odds Ratio (M‐H, Random, 95% CI) | 0.72 [0.45, 1.17] |
| Outcome or subgroup title | No. of studies | No. of participants | Statistical method | Effect size |
| 1 Mortality Show forest plot | 5 | 1140 | Odds Ratio (M‐H, Random, 95% CI) | 0.89 [0.36, 2.22] |
| 1.1 Expert advice | 1 | 153 | Odds Ratio (M‐H, Random, 95% CI) | 0.96 [0.06, 15.65] |
| 1.2 No expert advice | 4 | 987 | Odds Ratio (M‐H, Random, 95% CI) | 0.88 [0.33, 2.32] |
| 2 Virological failure Show forest plot | 10 | 1728 | Odds Ratio (M‐H, Random, 95% CI) | 0.70 [0.56, 0.87] |
| 2.1 Expert advice | 3 | 600 | Odds Ratio (M‐H, Random, 95% CI) | 0.59 [0.41, 0.83] |
| 2.2 No expert advice | 7 | 1128 | Odds Ratio (M‐H, Random, 95% CI) | 0.77 [0.57, 1.04] |
| Outcome or subgroup title | No. of studies | No. of participants | Statistical method | Effect size |
| 1 Mortality Show forest plot | 5 | 1140 | Odds Ratio (M‐H, Random, 95% CI) | 0.89 [0.36, 2.22] |
| 1.1 Children | 1 | 164 | Odds Ratio (M‐H, Random, 95% CI) | 0.74 [0.16, 3.42] |
| 1.2 Adults | 4 | 976 | Odds Ratio (M‐H, Random, 95% CI) | 0.99 [0.31, 3.09] |
| 2 Virological failure Show forest plot | 10 | 1728 | Odds Ratio (M‐H, Random, 95% CI) | 0.70 [0.56, 0.87] |
| 2.1 Children | 2 | 209 | Odds Ratio (M‐H, Random, 95% CI) | 0.98 [0.56, 1.71] |
| 2.2 Adults | 8 | 1519 | Odds Ratio (M‐H, Random, 95% CI) | 0.66 [0.52, 0.84] |
| Outcome or subgroup title | No. of studies | No. of participants | Statistical method | Effect size |
| 1 Mortality Show forest plot | 5 | Odds Ratio (M‐H, Random, 95% CI) | Subtotals only | |
| 1.1 Low RoB | 4 | 945 | Odds Ratio (M‐H, Random, 95% CI) | 0.83 [0.30, 2.24] |
| 1.2 High or unclear RoB | 1 | 195 | Odds Ratio (M‐H, Random, 95% CI) | 1.31 [0.13, 12.84] |
| 2 Virological failure Show forest plot | 10 | Odds Ratio (M‐H, Random, 95% CI) | Subtotals only | |
| 2.1 Low RoB | 5 | 1106 | Odds Ratio (M‐H, Random, 95% CI) | 0.66 [0.47, 0.92] |
| 2.2 High or unclear RoB | 5 | 622 | Odds Ratio (M‐H, Random, 95% CI) | 0.76 [0.55, 1.07] |