Interventions to prevent occupational noise‐induced hearing loss
Information
- DOI:
- https://doi.org/10.1002/14651858.CD006396.pub4Copy DOI

- Database:
-
- Cochrane Database of Systematic Reviews
- Version published:
-
- 07 July 2017see what's new
- Type:
-
- Intervention
- Stage:
-
- Review
- Cochrane Editorial Group:
-
Cochrane Work Group
- Copyright:
-
- Copyright © 2019 The Cochrane Collaboration. Published by John Wiley & Sons, Ltd.
Article metrics
Altmetric:
Cited by:
Authors
Contributions of authors
All: Comment on drafts of protocol and review.
Christina Tikka: Searching, eligibility screening, quality assessment, data extraction, data analysis, update of the text. Christina Tikka is the guarantor of this review.
Jos Verbeek: Protocol development, searching, eligibility screening, quality assessment, data extraction, data analysis, writing and update of the text.
Erik Kateman: Protocol development, searching for trials, eligibility screening, quality assessment of studies, data extraction, review development.
Thais Morata: Searching for studies, eligibility screening, data extraction, and update of the text.
Wouter Dreschler: Eligibility screening and data extraction.
Silvia Ferrite: Eligibility screening and data extraction.
Sources of support
Internal sources
-
No sources of support supplied
External sources
-
Dutch Ministry of Social Affairs and Employment as part of the KIS programme, Netherlands.
Erik Kateman received a grant of EUR 5000 for the original (2009) version of this review.
-
Cochrane Work formerly known as Cochrane Occupational Safety and Health Review Group, Finland.
Provided support in kind.
-
Stichting Arbouw, Netherlands.
Provided EUR 5000 for Cochrane Work for the 2012 update of the review.
-
Cochrane Editorial Unit, UK.
Provided GBP 5000 to Christina Tikka for the 2017 update.
Declarations of interest
Christina Tikka: None known.
Jos Verbeek: None known.
Erik Kateman: None known.
Thais Morata: None known.
Wouter Dreschler: None known.
Silvia Ferrite: None known.
Acknowledgements
We would like to thank the Dutch Ministry of Social Affairs and Employment and the Cochrane Editorial Unit for the grants received to complete and update this review. In addition, we would like to thank Jani Ruotsalainen from Cochrane Work and Jenny Bellorini from Cochrane ENT for their support. We also thank Bas Sorgdrager who contributed to an earlier version of this review.
Version history
| Published | Title | Stage | Authors | Version |
| 2017 Jul 07 | Interventions to prevent occupational noise‐induced hearing loss | Review | Christina Tikka, Jos H Verbeek, Erik Kateman, Thais C Morata, Wouter A Dreschler, Silvia Ferrite | |
| 2012 Oct 17 | Interventions to prevent occupational noise‐induced hearing loss | Review | Jos H Verbeek, Erik Kateman, Thais C Morata, Wouter A Dreschler, Christina Mischke | |
| 2009 Jul 08 | Interventions to prevent occupational noise induced hearing loss | Review | Jos H Verbeek, Erik Kateman, Thais C Morata, Wout Dreschler, Bas Sorgdrager | |
| 2007 Jan 24 | Interventions to prevent occupational noise induced hearing loss | Protocol | Erik Kateman, Jos H Verbeek, Thais Morata, Bas Coolsma, Wout Dreschler, Bas Sorgdrager | |
Differences between protocol and review
For noise measurements, we intended to include only measurements executed according to a written national or international standard in which information on measurement method, time weighting etc. was given. However, this transpired to be an excessively strict criterion. We therefore included all reported noise measurements, with the permission of the editorial base.
For hearing loss measurements, we intended to include only hearing loss measured with a calibrated audiometer and defined by means of a written protocol, which was the case for most studies. However, in some cases this was found to be an excessively strict criterion so we also included audiometric measurements when there was no written protocol reported, with the consent of the editorial base.
We intended to use a qualitative analysis if the data could not be combined in a quantitative way. Instead of the proposed synthesis we used the GRADE approach to rate the quality of the evidence.
Notes
Disclaimer: The findings and conclusions in this report are those of the author(s) and do not necessarily represent the views of the National Institute for Occupational Safety and Health.
Keywords
MeSH
Medical Subject Headings (MeSH) Keywords
- Audiometry;
- Coal Mining [legislation & jurisprudence];
- Controlled Before-After Studies;
- *Ear Protective Devices;
- Engineering [methods];
- Health Education [standards];
- Hearing Loss, Noise-Induced [diagnosis, *prevention & control];
- Noise, Occupational [adverse effects, legislation & jurisprudence, *prevention & control];
- Occupational Diseases [diagnosis, etiology, *prevention & control];
- Program Evaluation;
- Randomized Controlled Trials as Topic;
Medical Subject Headings Check Words
Humans;
PICOs


Risk of bias graph: review authors' judgements about each risk of bias item presented as percentages across all included studies. Please note that the blank space corresponds to the studies that have an ITS study design.

Risk of bias summary: review authors' judgements about each risk of bias item for each included study. Please note that the blank spaces correspond to the studies that have an ITS study design.

Comparison 1 Legislation to decrease noise exposure (long‐term) ‐ ITS, Outcome 1 Immediate change in level.

Comparison 1 Legislation to decrease noise exposure (long‐term) ‐ ITS, Outcome 2 Change in slope.
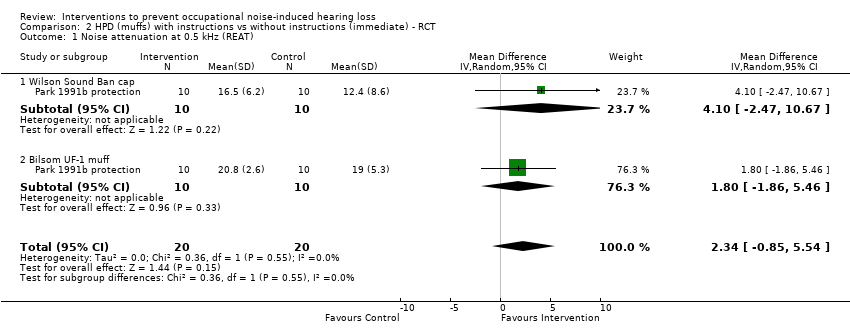
Comparison 2 HPD (muffs) with instructions vs without instructions (immediate) ‐ RCT, Outcome 1 Noise attenuation at 0.5 kHz (REAT).

Comparison 2 HPD (muffs) with instructions vs without instructions (immediate) ‐ RCT, Outcome 2 Noise attenuation at 1 kHz (REAT).

Comparison 2 HPD (muffs) with instructions vs without instructions (immediate) ‐ RCT, Outcome 3 Noise attenuation at 2 kHz (REAT).
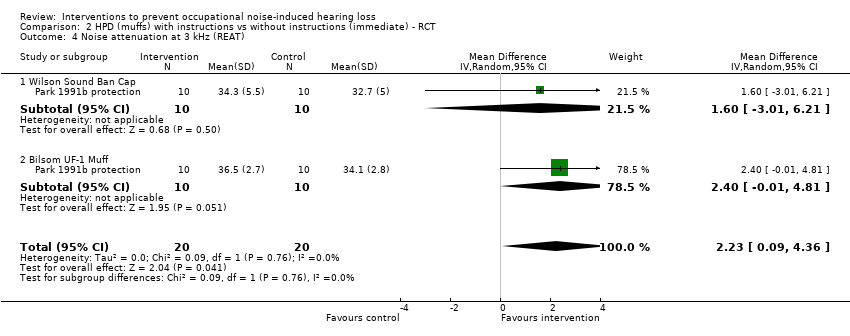
Comparison 2 HPD (muffs) with instructions vs without instructions (immediate) ‐ RCT, Outcome 4 Noise attenuation at 3 kHz (REAT).

Comparison 2 HPD (muffs) with instructions vs without instructions (immediate) ‐ RCT, Outcome 5 Noise attenuation at 4 kHz (REAT).

Comparison 2 HPD (muffs) with instructions vs without instructions (immediate) ‐ RCT, Outcome 6 Noise attenuation at 6 kHz (REAT).

Comparison 2 HPD (muffs) with instructions vs without instructions (immediate) ‐ RCT, Outcome 7 Noise attenuation at 8 kHz (REAT).

Comparison 3 HPD (plugs) with instructions vs without instructions (immediate) ‐ RCT, Outcome 1 Noise attenuation at 0.5 kHz (REAT).
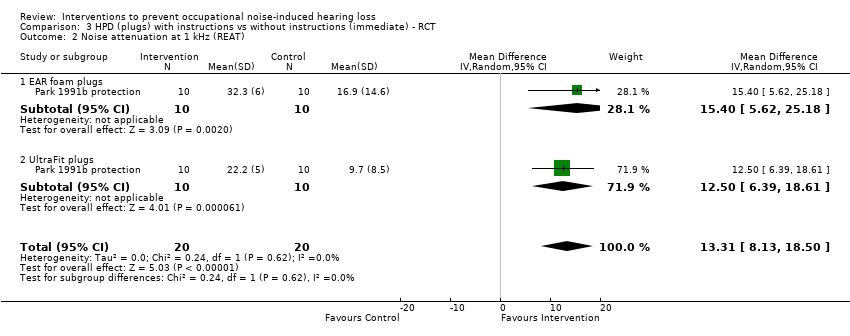
Comparison 3 HPD (plugs) with instructions vs without instructions (immediate) ‐ RCT, Outcome 2 Noise attenuation at 1 kHz (REAT).

Comparison 3 HPD (plugs) with instructions vs without instructions (immediate) ‐ RCT, Outcome 3 Noise attenuation at 2 kHz (REAT).

Comparison 3 HPD (plugs) with instructions vs without instructions (immediate) ‐ RCT, Outcome 4 Noise attenuation at 3 kHz (REAT).

Comparison 3 HPD (plugs) with instructions vs without instructions (immediate) ‐ RCT, Outcome 5 Noise attenuation at 4 kHz (REAT).
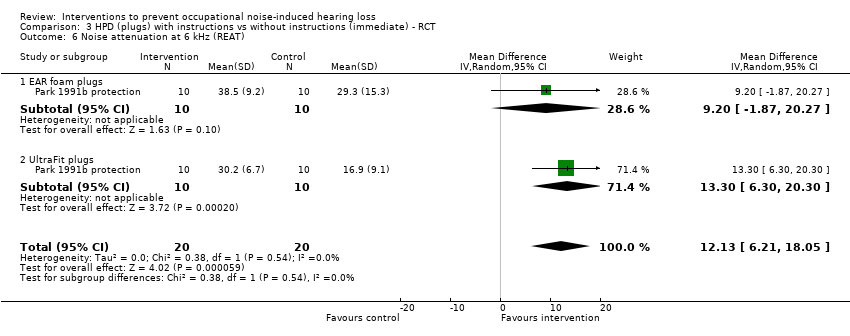
Comparison 3 HPD (plugs) with instructions vs without instructions (immediate) ‐ RCT, Outcome 6 Noise attenuation at 6 kHz (REAT).

Comparison 3 HPD (plugs) with instructions vs without instructions (immediate) ‐ RCT, Outcome 7 Noise attenuation at 8 kHz (REAT).

Comparison 3 HPD (plugs) with instructions vs without instructions (immediate) ‐ RCT, Outcome 8 Mean noise attenuation over 0.5, 1, 2, 3, 4, 6, 8 kHz (REAT).

Comparison 4 HPD (plugs) lower noise reduction rate (NRR) with instructions vs higher NRR without instructions (immediate) ‐ RCT, Outcome 1 Mean attenuation at 0.5, 1, 2, 3, 4, 6, 8 kHz.
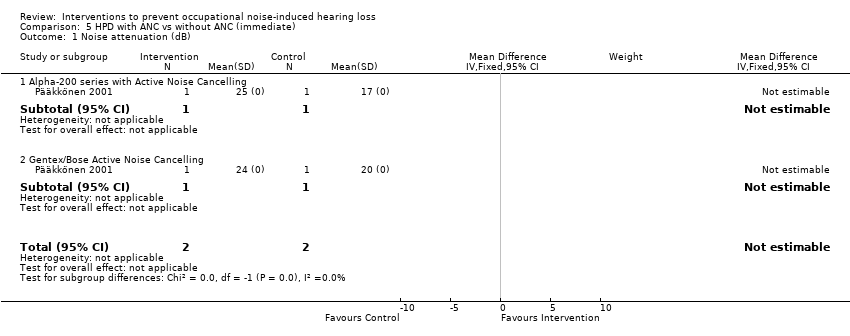
Comparison 5 HPD with ANC vs without ANC (immediate), Outcome 1 Noise attenuation (dB).

Comparison 5 HPD with ANC vs without ANC (immediate), Outcome 2 TTS at 1 kHz (before exposure ‐ after exposure ).

Comparison 5 HPD with ANC vs without ANC (immediate), Outcome 3 TTS at 2 kHz (before exposure ‐ after exposure ).

Comparison 5 HPD with ANC vs without ANC (immediate), Outcome 4 TTS at 4 kHz (before exposure ‐ after exposure ).
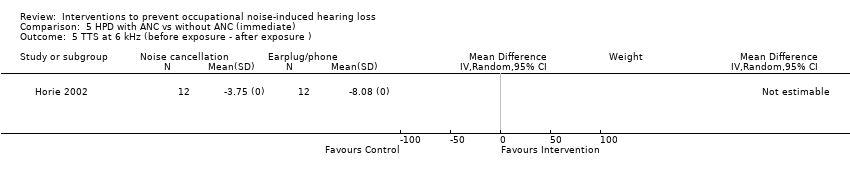
Comparison 5 HPD with ANC vs without ANC (immediate), Outcome 5 TTS at 6 kHz (before exposure ‐ after exposure ).

Comparison 5 HPD with ANC vs without ANC (immediate), Outcome 6 TTS at 8 kHz (before exposure ‐ after exposure ).

Comparison 6 Custom‐moulded musician HPD (plugs) with higher versus HPD (plugs) with lower noise attenuation, Outcome 1 Noise attenuation dB(A).

Comparison 7 HPD (various) noise attenuation (immediate), Outcome 1 Noise attenuation (dB).
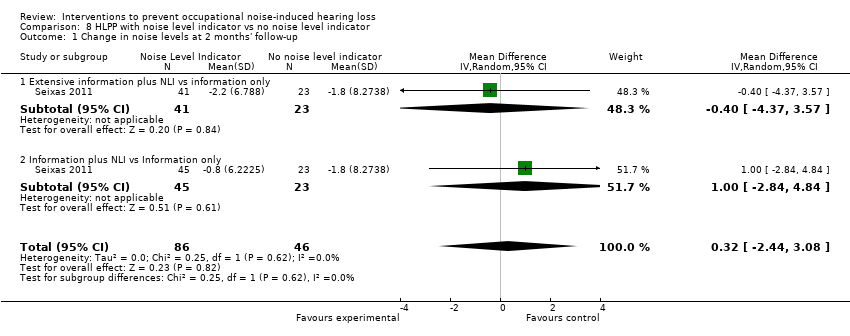
Comparison 8 HLPP with noise level indicator vs no noise level indicator, Outcome 1 Change in noise levels at 2 months' follow‐up.

Comparison 8 HLPP with noise level indicator vs no noise level indicator, Outcome 2 Change in noise levels at 4 months' follow‐up.

Comparison 9 HLPP with extensive information vs information only, Outcome 1 Change in noise levels at 2 months' follow‐up.

Comparison 9 HLPP with extensive information vs information only, Outcome 2 Change in noise levels at 4 months' follow‐up.
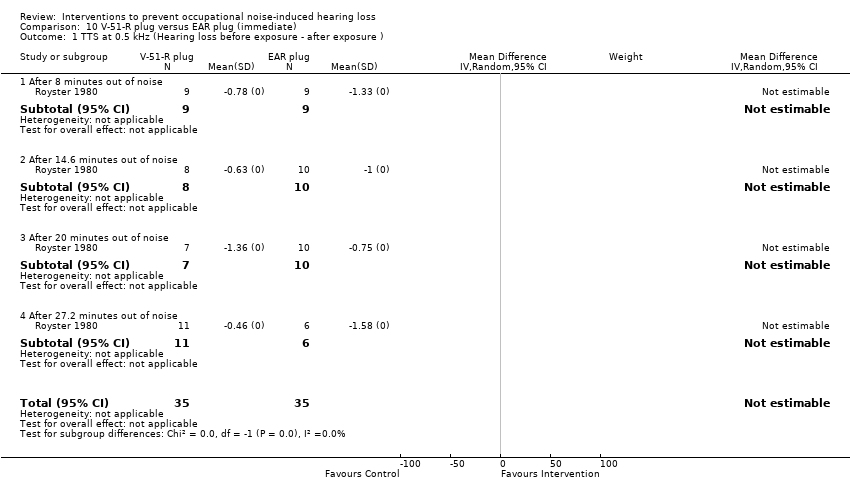
Comparison 10 V‐51‐R plug versus EAR plug (immediate), Outcome 1 TTS at 0.5 kHz (Hearing loss before exposure ‐ after exposure ).

Comparison 10 V‐51‐R plug versus EAR plug (immediate), Outcome 2 TTS at 1 kHz (before exposure ‐ after exposure ).

Comparison 10 V‐51‐R plug versus EAR plug (immediate), Outcome 3 TTS at 2 kHz (before exposure ‐ after exposure ).

Comparison 10 V‐51‐R plug versus EAR plug (immediate), Outcome 4 TTS at 3 kHz (before exposure ‐ after exposure ).
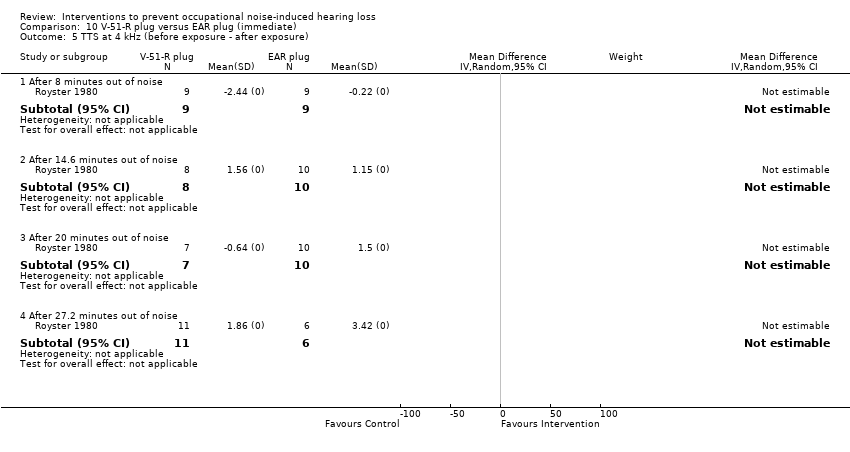
Comparison 10 V‐51‐R plug versus EAR plug (immediate), Outcome 5 TTS at 4 kHz (before exposure ‐ after exposure).

Comparison 10 V‐51‐R plug versus EAR plug (immediate), Outcome 6 TTS at 6 kHz (before exposure ‐ after exposure).

Comparison 11 Earmuffs vs earplugs (long‐term), Outcome 1 Hearing loss change over 3 years (4 kHz / STS).

Comparison 12 HLPP vs audiometric testing (agriculture students, long‐term, 3‐year and 16‐year follow‐up) ‐ RCT, Outcome 1 STS.

Comparison 13 HLPP with daily noise‐exposure monitoring with feedback vs annual audiometry (long‐term) ‐ ITS, Outcome 1 HL (dB/year at 2, 3 and 4 kHz) Δ level.
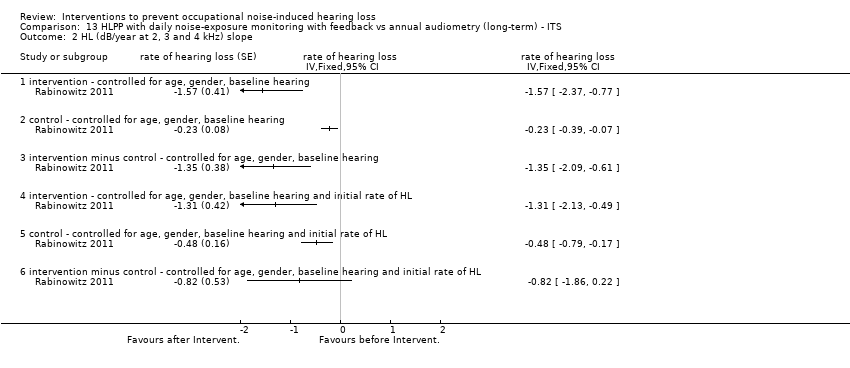
Comparison 13 HLPP with daily noise‐exposure monitoring with feedback vs annual audiometry (long‐term) ‐ ITS, Outcome 2 HL (dB/year at 2, 3 and 4 kHz) slope.

Comparison 14 Follow‐up exam after initial STS vs no exam (long‐term), Outcome 1 Hearing loss change (STS).

Comparison 15 Well‐implemented HLPP vs less well‐implemented (long‐term, 1‐year follow‐up), Outcome 1 STS.

Comparison 16 Well‐implemented HLPP vs less well‐implemented (long‐term > 5‐year follow‐up), Outcome 1 Hearing loss change STS/at 4 kHz.

Comparison 17 HLPP 12‐hour shift vs HLPP 8‐hour shift (long‐term 1‐year follow‐up), Outcome 1 Hearing loss change over 1 year at 4 kHz.

Comparison 18 HLPP vs non‐exposed workers (long‐term 1‐year follow‐up), Outcome 1 hearing loss STS.

Comparison 19 Improved HLPP vs non‐exposed workers (long‐term 1‐year follow‐up), Outcome 1 hearing loss STS.

Comparison 20 HLPP vs non‐exposed workers (long‐term > 5‐year follow‐up), Outcome 1 Hearing loss change at 4 kHz/STS (5‐year follow‐up).

Comparison 20 HLPP vs non‐exposed workers (long‐term > 5‐year follow‐up), Outcome 2 Hazard of STS.

Comparison 21 HLPP vs non‐exposed sensitivity analysis (long‐term, 5‐year follow‐up), Outcome 1 Hearing loss change at 4kHz / STS.
| Stricter legislation compared with existing legislation for noise exposure | |||||
| Patient or population: workers with noise exposure Settings: coal mines Intervention: stricter legislation Comparison: existing legislation | |||||
| Outcomes | Illustrative comparative risks* (95% CI) | No of observations (studies) | Quality of the evidence | Comments | |
| Assumed risk | Corresponding risk | ||||
| Existing legislation | Stricter legislation | ||||
| Immediate change in level in year 2000 (noise level at work as PEL dose in dB(A); range 0 to 6400, log scale) 1 year | The mean noise levels during pre‐intervention years were 56.9 PEL dose | The mean noise exposure level after introduction was 27.70 PEL dose lower (36.1 lower to 19.3 lower PEL dose) | 14 years pre‐intervention and 4 years post‐intervention (1 ITS) | ⊕⊝⊝⊝ | The reduction of 27.7 PEL dose translates to about 4.5 dB(A) |
| Change in slope after introduction (noise level at work as PEL dose in dB(A); range 0 to 6400, log scale) 4 years | The mean noise levels during pre‐intervention years were 56.9 PEL dose | The mean change in level of noise exposure per year after introduction was 2.10 PEL dose lower (4.90 lower to 0.70 PEL dose higher) | 14 years pre‐intervention and 4 years post‐intervention (1 ITS) | ⊕⊝⊝⊝ | |
| *The basis for the assumed risk (e.g. the median control group risk across studies) is provided in footnotes. The corresponding risk (and its 95% confidence interval) is based on the assumed risk in the comparison group and the absolute effect of the intervention (and its 95% CI). | |||||
| GRADE Working Group grades of evidence High quality: we are very confident that the true effect lies close to that of the estimate of the effect Moderate quality: we are moderately confident in the effect estimate; the true effect is likely to be close to the estimate of effect, but there is a possibility that it is substantially different Low quality: our confidence in the effect estimate is limited; the true effect may be substantially different from the estimate of the effect Very low quality: we have very little confidence in the effect estimate; the true effect is likely to be substantially different from the estimate of effect | |||||
| 1We downgraded by one level from low to very low because there is only one study and it has a high risk of bias. | |||||
| Earplugs with instruction compared with no instruction for noise reduction | |||||
| Patient or population: workers with exposure to noise Settings: industrial Intervention: instruction on how to insert earplugs Comparison: no instruction | |||||
| Outcomes | Illustrative comparative risks* (95% CI) | No of participants | Quality of the evidence | Comments | |
| Assumed risk | Corresponding risk | ||||
| Without instruction | With instruction | ||||
| Mean noise attenuation over 0.5, 1, 2, 3, 4, 6, 8 kHz (dB) Immediate follow‐up | The mean noise attenuation ranged across frequencies from 5.5 to 25.9 dB | The mean noise attenuation in the intervention groups was 8.59 dB higher (6.92 dB higher to 10.25 dB higher) | 140 participants | ⊕⊕⊕⊝ | |
| *The basis for the assumed risk (e.g. the median control group risk across studies) is provided in footnotes. The corresponding risk (and its 95% confidence interval) is based on the assumed risk in the comparison group and the relative effect of the intervention (and its 95% CI). | |||||
| GRADE Working Group grades of evidence High quality: we are very confident that the true effect lies close to that of the estimate of the effect Moderate quality: we are moderately confident in the effect estimate; the true effect is likely to be close to the estimate of effect, but there is a possibility that it is substantially different Low quality: our confidence in the effect estimate is limited; the true effect may be substantially different from the estimate of the effect Very low quality: we have very little confidence in the effect estimate; the true effect is likely to be substantially different from the estimate of effect | |||||
| 1We downgraded from high quality by one level because of imprecision due to small number of participants. | |||||
| Exposure information compared with training as usual for noise exposure | |||||
| Patient or population: workers exposed to noise Settings: construction industry Intervention: provision of noise level indicator Comparison: safety training as usual | |||||
| Outcomes | Illustrative comparative risks* (95% CI) | No of participants | Quality of the evidence | Comments | |
| Assumed risk | Corresponding risk | ||||
| Training as usual | Plus noise level indicator | ||||
| Change in noise levels at 4 months' follow‐up (dB(A)) | The mean noise level in the control group ranged from 87.1 to 89 dB(A) | The mean noise level in the intervention groups was | 176 | ⊕⊕⊝⊝ | |
| *The basis for the assumed risk (e.g. the median control group risk across studies) is provided in footnotes. The corresponding risk (and its 95% confidence interval) is based on the assumed risk in the comparison group and the relative effect of the intervention (and its 95% CI). | |||||
| GRADE Working Group grades of evidence High quality: we are very confident that the true effect lies close to that of the estimate of the effect Moderate quality: we are moderately confident in the effect estimate; the true effect is likely to be close to the estimate of effect, but there is a possibility that it is substantially different Low quality: our confidence in the effect estimate is limited; the true effect may be substantially different from the estimate of the effect Very low quality: we have very little confidence in the effect estimate; the true effect is likely to be substantially different from the estimate of effect | |||||
| 1We downgraded by two levels from high to low because of high risk of bias and imprecision. | |||||
| Earmuffs compared with earplugs for noise‐induced hearing loss | ||||||
| Patient or population: workers exposed to 88‐94 dB(A) Settings: shipyard Intervention: most wearing earmuffs Comparison: most wearing earplugs | ||||||
| Outcomes | Illustrative comparative risks* (95% CI) | Relative effect | No of participants | Quality of the evidence | Comments | |
| Assumed risk | Corresponding risk | |||||
| Earplugs | Earmuffs | |||||
| Hearing loss change over 3 years (4 kHz/STS) 2 to 3 years' follow‐up | High risk population | OR 0.8 (0.63 to 1.03 ) | 3242 | ⊕⊝⊝⊝ | At lower exposures the results were too heterogeneous to be combined | |
| 42 per 1000 | 34 per 1000 | |||||
| *The basis for the assumed risk (e.g. the median control group risk across studies) is provided in footnotes. The corresponding risk (and its 95% confidence interval) is based on the assumed risk in the comparison group and the relative effect of the intervention (and its 95% CI). | ||||||
| GRADE Working Group grades of evidence High quality: we are very confident that the true effect lies close to that of the estimate of the effect Moderate quality: we are moderately confident in the effect estimate; the true effect is likely to be close to the estimate of effect, but there is a possibility that it is substantially different Low quality: our confidence in the effect estimate is limited; the true effect may be substantially different from the estimate of the effect Very low quality: we have very little confidence in the effect estimate; the true effect is likely to be substantially different from the estimate of effect | ||||||
| 1We downgraded from low quality to very low quality because of high risk of bias in both studies. | ||||||
| Hearing loss prevention programme (HLPP) compared to audiometric testing | ||||||
| Patient or population: agricultural students without hearing loss Settings: agricultural schools | ||||||
| Outcomes | Illustrative comparative risks* (95% CI) | Relative effect | No of participants | Quality of the evidence | Comments | |
| Assumed risk | Corresponding risk | |||||
| Audiometric testing only | HLPP with information | |||||
| Hearing loss | 21 per 1000 | 18 per 1000 | OR 0.85 | 687 | ⊕⊕⊕⊝ | |
| Hearing loss | 149 per 1000 | 141 per 1000 | OR 0.94 | 355 | ⊕⊕⊕⊝ | |
| *The basis for the assumed risk (e.g. the median control group risk across studies) is provided in footnotes. The corresponding risk (and its 95% confidence interval) is based on the assumed risk in the comparison group and the relative effect of the intervention (and its 95% CI). | ||||||
| GRADE Working Group grades of evidence High quality: we are very confident that the true effect lies close to that of the estimate of the effect Moderate quality: we are moderately confident in the effect estimate; the true effect is likely to be close to the estimate of effect, but there is a possibility that it is substantially different Low quality: our confidence in the effect estimate is limited; the true effect may be substantially different from the estimate of the effect Very low quality: we have very little confidence in the effect estimate; the true effect is likely to be substantially different from the estimate of effect | ||||||
| 1We downgraded one level from high to moderate due to lack of information on randomisation and allocation concealment. | ||||||
| HLPP with exposure information compared with HLPP without exposure information for noise‐induced hearing loss | |||||
| Patient or population: workers exposed to noise Settings: aluminium smelter Intervention: exposure information as part of HLPP Comparison: no such information | |||||
| Outcomes | Illustrative comparative risks* (95% CI) | No of participants | Quality of the evidence | Comments | |
| Assumed risk | Corresponding risk | ||||
| Without exposure info | With exposure info | ||||
| Annual increase in hearing threshold (dB/year at 2,3 and 4 kHz) 4‐year follow‐up | The mean hearing loss rate in the control group was 1.0 dB per year | The mean hearing loss rate in the intervention groups was | 312 | ⊕⊝⊝⊝ | Matched for age, gender, baseline hearing loss and baseline hearing |
| *The basis for the assumed risk (e.g. the median control group risk across studies) is provided in footnotes. The corresponding risk (and its 95% confidence interval) is based on the assumed risk in the comparison group and the relative effect of the intervention (and its 95% CI). | |||||
| GRADE Working Group grades of evidence High quality: we are very confident that the true effect lies close to that of the estimate of the effect Moderate quality: we are moderately confident in the effect estimate; the true effect is likely to be close to the estimate of effect, but there is a possibility that it is substantially different Low quality: our confidence in the effect estimate is limited; the true effect may be substantially different from the estimate of the effect Very low quality: we have very little confidence in the effect estimate; the true effect is likely to be substantially different from the estimate of effect | |||||
| 1We downgraded by one level from low to very low because of high risk of bias. | |||||
| Well‐implemented hearing loss prevention programme (HLPP) compared to less well‐implemented HLPP for hearing loss | ||||||
| Patient or population: workers | ||||||
| Outcomes | Illustrative comparative risks* (95% CI) | Relative effect | No of participants | Quality of the evidence | Comments | |
| Assumed risk | Corresponding risk | |||||
| Less well‐implemented HLPP | Well‐implemented HLPP | |||||
| Hearing loss | 86 per 1000 | 36 per 1000 | OR 0.40 | 16,301 | ⊕⊝⊝⊝ | SMD 0.26 (0.14 to 0.47) |
| *The basis for the assumed risk (e.g. the median control group risk across studies) is provided in footnotes. The corresponding risk (and its 95% confidence interval) is based on the assumed risk in the comparison group and the relative effect of the intervention (and its 95% CI). | ||||||
| GRADE Working Group grades of evidence High quality: we are very confident that the true effect lies close to that of the estimate of the effect Moderate quality: we are moderately confident in the effect estimate; the true effect is likely to be close to the estimate of effect, but there is a possibility that it is substantially different Low quality: our confidence in the effect estimate is limited; the true effect may be substantially different from the estimate of the effect Very low quality: we have very little confidence in the effect estimate; the true effect is likely to be substantially different from the estimate of effect | ||||||
| 1STS used in two studies, change of mean 4 kHz threshold in one study. | ||||||
| Hearing loss prevention programme (HLPP) compared to non‐exposed workers | ||||||
| Patient or population: workers | ||||||
| Outcomes | Illustrative comparative risks* (95% CI) | Relative effect | No of participants | Quality of the evidence | Comments | |
| Assumed risk | Corresponding risk | |||||
| Non‐exposed workers | HLPP | |||||
| Hearing loss | The mean hearing loss in the control groups was | The mean hearing loss in the intervention groups was | 1846 | ⊕⊝⊝⊝ | pooled effect size 0.17 (95% CI ‐0.06 to 0.40) recalculated into dBs | |
| *The basis for the assumed risk (e.g. the median control group risk across studies) is provided in footnotes. The corresponding risk (and its 95% confidence interval) is based on the assumed risk in the comparison group and the relative effect of the intervention (and its 95% CI). | ||||||
| GRADE Working Group grades of evidence High quality: we are very confident that the true effect lies close to that of the estimate of the effect Moderate quality: we are moderately confident in the effect estimate; the true effect is likely to be close to the estimate of effect, but there is a possibility that it is substantially different Low quality: our confidence in the effect estimate is limited; the true effect may be substantially different from the estimate of the effect Very low quality: we have very little confidence in the effect estimate; the true effect is likely to be substantially different from the estimate of effect | ||||||
| 1Assumed increase of hearing threshold: median of three studies with respectively 3.4, 3.6 and 5.2 dB increase in hearing threshold at 4 kHz after five years' follow‐up. | ||||||
| Küpper 2013 (Outcome: Leq 8 h (dB)a) ‐ noise exposure of rescue helicopter personnel ‐ case study | ||||||||||
| Study data | Recalculation ‐ group mean, SD | |||||||||
| Helicopter type | Helicopter name | mean | SD | dB min | dB max | variance | mean | SD | ||
| with advanced technology | EC 135b | 85.80 | 4.00 | 73.00 | 97.00 | 16.00 | 87.9 | 4.16 | ||
| BK 117b | 87.20 | 4.60 | 74.00 | 101.00 | 21.16 | |||||
| Bell 206 B Jetrangerc | 88.80 | 4.00 | 76.00 | 100.00 | 16.00 | |||||
| Bell 206 Longranger IIc | 89.80 | 4.00 | 77.00 | 101.00 | 16.00 | |||||
| without advanced technology | UH 1Db | 86.80 | 4.00 | 74.00 | 98.00 | 16.00 | 98.41 | 4.49 | ||
| BO 105c | 91.80 | 4.00 | 79.00 | 103.00 | 16.00 | |||||
| Sea Kingc | 92.60 | 7.50 | 78.00 | 114.00 | 56.25 | |||||
| Ecureuil AS350Bb | 92.80 | 4.00 | 80.00 | 104.00 | 16.00 | |||||
| Alouette IIIbb | 98.40 | 4.80 | 85.00 | 113.00 | 23.04 | |||||
| Sikorsky H‐23/UH12c | 99.70 | 3.90 | 87.00 | 111.00 | 15.21 | |||||
| Alouette IIb | 100.10 | 4.40 | 87.00 | 113.00 | 19.36 | |||||
| Sikorsky H‐34c | 101.8 | 4.00 | 89.00 | 113.00 | 16.00 | |||||
| Mi‐4c | 109.10 | 3.50 | 97.00 | 117.00 | 12.25 | |||||
| Sikorsky H‐37 Mojavec | 111 | 3.40 | 99.00 | 119.00 | 11.56 | |||||
| Muhr 2016 (Outcome: STS) ‐ hearing loss Swedish military ‐ CBA | ||||||||||
| Study data | Recalculation | |||||||||
| group | follow up mean (month) | # Events | N | follow up (month/year) | per 100 person‐years | |||||
| event rate | lnRR | SE | ||||||||
| HLPP | 8 | 9 | 395 | 0.67 | 3.4 | 0.002 | 0.379 | |||
| non‐exposed | 13 | 31 | 839 | 1.08 | 3.4 | |||||
| Muhr 2006 (Outcome: STS) ‐ hearing loss Swedish military ‐ CBA | ||||||||||
| Study data | Recalculation | |||||||||
| group | follow up mean (month) | # Events | N | group | follow up (year) | # Events | N | per 100 person‐years | ||
| event rate | lnRR | SE | ||||||||
| HLPP (low‐exposed) | 9.25 | 11 | 291 | HLPP (low‐exposed) | 0.77 | 11 | 291 | 4.9 | 0.73 | 1.04 |
| HLPP (medium‐exposed) | 13 | 252 | non‐exposed (split 1) | 0.92 | 1 | 46 | 2.37 | |||
| HLPP (high‐exposed) | 35 | 204 | HLPP (medium‐exposed) | 0.77 | 13 | 252 | 6.69 | 1.04 | 1.04 | |
| non‐exposed | 11 | 4 | 138 | non‐exposed (split 2) | 0.92 | 1 | 46 | 2.37 | ||
| HLPP (high‐exposed) | 0.77 | 35 | 204 | 22.26 | 1.55 | 0.73 | ||||
| non‐exposed (split 3) | 0.92 | 2 | 46 | 4.74 | ||||||
| non‐exposed (all) | 0.92 | 4 | 138 | 3.16 | ||||||
| low‐exposed vs non‐exposed (all) | 0.439 | 0.584 | ||||||||
| medium‐exposed vs non‐exposed (all) | 0.750 | 0.572 | ||||||||
| high‐exposed vs non‐exposed (all) | 1.951 | 0.528 | ||||||||
| aBased on task analysis and helicopter noise data, task analysis is based on measurements of type and duration of tasks per rescue operation of four bases over 1 year (total, 2726 rescue operations). | ||||||||||
| Comparison | N Studies | 1. RoB? | 2. Inconsistent? | 3. Indirect? | 4. Imprecise? | 5. Pub bias? | 6. Large ES? | 7. DR? | 8. Opp Conf | Qualitya |
| Outcome noise | ||||||||||
| Legislation vs no legislation | 1 ITS | yes | 1 study | no | no | 1 study | yes | no | no | very low (1) |
| One HPD vs another HPD | 1 RCT 4 CBA | 2 yes | no | no | no | not shown | no | no | no | low (1) |
| HPD+Instruction vs HPD‐instruction | 2 RCT | 2 no | no | no | yes | not shown | na | na | na | moderate (4) |
| Information vs no information | 1 RCT (2 arms) | 1 yes | 1 study | no | yes | 1 study | na | na | na | low (1, 4) |
| Outcome hearing loss | ||||||||||
| One HPD vs another HPD (TTS) | 2 CBA | no data | ||||||||
| Muffs vs plugs | 2 CBA | 2 yes | no | no | yes | not shown | no | no | no | very low (1,4) |
| Frequent HPD vs less frequent use | 1 CBA | 1 yes | 1 study | no | yes | 1 study | no | no | no | very low (1) |
| HLPP vs audiometry | 1 RCT | 1 yes | 1 study | no | no | 1 study | na | na | na | moderate (1) |
| HLPP+exposure information vs HLPP‐information | 1 CBA | 1 yes | 1 study | no | yes | 1 study | no | no | no | very low (1,4) |
| Frequent HPD in HLPP vs less | 5 CBA | 5 yes | no | no | yes | not shown | no | no | no | very low (1,4) |
| HLPP vs no exposure | 7 CBA | 7 yes | no | no | yes | not shown | no | no | no | very low (1,4) |
| Follow‐up vs no follow‐up | 1 CBA | 1 yes | 1 study | no | yes | 1 study | no | no | no | very low (1,4) |
| HLPP+long shifts vs HLPP normal | 1 CBA | 1 yes | 1 study | no | yes | 1 study | no | no | no | very low (1,4) |
| 1‐5 Reasons for downgrading: 1. Risk of bias/Limitations in study design 2. Inconsistency between studies. 3. Indirectness of PICO 4. Imprecision of the results 5. Publication bias. 6‐8 Reasons for upgrading: 6. Large effect size. 7. Dose‐repsonse relationship 8. Confounding opposes the direction of the effect; aFinal grading of quality of evidence, between brackets domain that led to down/upgrading the quality. | ||||||||||
| Study | Described as HLPP | HPD provided | Noise measurements | Technical measures | Administrative measures | Audiometry |
| ? | Enforced mandatory wearing of hearing protection | Personal dosimeter twice a year | ? | ? | Audiometric booth ANSI‐OSHA | |
| HLPP | ? based on Aldera 1993 we assumed that excellent implementation meant better use of hearing protection | ? | ? | ? | Audiogram taken | |
| HCP | Beside educational intervention, hearing protection devices were provided free to students and replaced regularly | Students were given opportunity to use sound level meter unaffiliated | Not part of the programme | Not part of the programme | Yearly audiometric testing, calibrated per ANSI standard with Hughson‐Westlake modification of the ascending threshold technique | |
| HCP | ? | Area‐wide sound level surveys | ? | ? | Annual audiometric evaluation calibrated Bekesy audiometer ANSI | |
| HCP | Hearing protection was one element | Noise monitoring was one element | Engineering controls were one element | Administrative controls were one element | Audiometric evaluation by certified audiometric technicians | |
| ? | ? | Personal noise dosimeters | ? | ? | Calibrated ISO r389 | |
| HCP | Earmuffs mandatory in noise areas | Calibrated personal dosimeters sound level meter in all shop areas | ? | ? | Soundproof booth ANSI s3.1‐1960 | |
| Walsh‐Healy standard; OSHA | Yes, mandatory use of approved protection | ? | Gradual continuous engineering control wherever, whenever economically feasible | ? | Audiometric surveys | |
| HCP | ? Percent use of hearing protection used as a quality indicator | Used as a quality indicator of the programmes: high quality if any monitoring and worker input reported by focus group | Stated as part of the programme but not possible to evaluate with the study data | Training and education stated as part of the programme but not possible to evaluate with study data | Audiometric testing, quality varies, evaluated as days between two tests, audiometry method not reported | |
| ? | ? | Annual sound surveys | ? | ? | Automatic audiometer according to ANSI s3.6‐1996 | |
| HCP | Must be provided with effective HP devices | Identify hazardous noise | ? | Detailed follow‐up 3 and 6 months after a STS | ? | |
| HCP | Earmuffs and or earplugs with level‐dependent function limited to 82 dB(A) with SNR 27 dB | Standardised noise measurements | Risk areas around weapon use | ? | Screening audiometry | |
| HCP, stated to be stricter than to the one evaluated in Muhr 2006 | Mandatory use of HPDs, earmuffs and or earplugs with or without level‐dependent function (enable speech communication), (stated to be stricter recommendations and better devices) | ? | safety distances (stated to be stricter) | Mandatory training in HPD use and education in NIHL and noise induced tinnitus, stricter audiometry inclusion criteria for acceptance to military service (≤ 25 dB average HL for the frequencies 0.5 to 8 kHz in both ears, 30 dB HL at one or more frequencies, and 35–40 dB HL at one single frequency) (to exclude mild hearing loss cases presumed to be more vulnerable to HL) | Screening audiometry at begin and end of military service | |
| Routine HCP | ? | Individual noise dosimetry over long periods | ? | ? | Calibrated ISO 389 isolated booth | |
| ? | Mandatory hearing protection | Routine noise level surveys | Noise abatement | ? | Automatic Bekesy‐type ANSI calibrated | |
| HCP | 3 specific types of earplugs | Sound survey, noise dosimeters | ? | ? | Audiometric database | |
| Demonstrate excellent HCP practices | ? | ? | ? | ? | ? | |
| ANSI = American National Standards Institute | ||||||
| Reference ID | Case studies included in review | |||||
| Number of cases | Type of industry | Country | Interventiona | Measureb | Additional information (number of cases) | |
| 1 | mining (1) | USA | retro‐fit | noise level, noise dose | description of noise measurement (1), follow‐up (1) | |
| 1 | offshore helicopter (1) | France | all retro‐fit | noise level | description of noise measurement (1), funding (1), conflict of interest (1) | |
| 2 | manufacturing (2) | USA | all retro‐fit | noise level, dose | description of noise measurement (2) | |
| 3 | steel industry (3) | Iran | all retro‐fit | noise level, dose | description of noise measurement (3), funding (3), conflict of interest (3) | |
| 57 | manufacturing (57) | not reported | new 6 retro‐fit 51 | noise level | ‐ | |
| 2 | manufacturing (2) | not reported | all retro‐fit | noise level | ‐ | |
| 1 | alpine rescue operation (helicopter) (1) | Austria, Switzerland | new | noise level | description of noise measurement, follow‐up, statistical tests used | |
| 8 | textile (1), paper shredding (1), manufacturing (6) | USA | new 4, retro‐fit 2, both 2 | noise level | ‐ | |
| 18 | manufacturing (15), drilling industry (2), mining (1) | not reported | new 5, retro‐fit 11, both 2 | noise level, dose | description of noise measurement (3) | |
| 3 | mining (3) | Australia | all retro‐fit | dose | description of noise measurement (2), funding (3), follow‐up (immediate) (3) | |
| 5 | mining(5) | USA | all retro‐fit | noise level, dose | description of noise measurement (1), adverse effects: engine over‐heating (1), time of intervention: 2014/2015 (1) | |
| 6 | manufacturing (6) | not reported | all retro‐fit | noise level | ‐ | |
| Total | 107 | manufacturing (88), mining (10), steel (3), drilling (2), helicopter (2), textile (1), paper shredding (1) | Australia (3), Iran (3), France (1), USA (16), Austria and Switzerland (1), nr (26) | retro‐fit (86), new (16), both (4) | noise level, dose | description of noise measurement (14), funding (7), follow‐up (5), conflict of interest (4), adverse effects (1), time of intervention (1), statistical tests used (1) |
| aTypes of intervention: installation of completely new equipment (new), intervention to improve existing equipment (e.g. new parts, additional damping material layers) (retro‐fit), or a combination of new and retro‐fit interventions (both). | ||||||
| New equipment | |||||||
| Noise source | Intervention | follow‐up | Initial noise level | Noise level after | 8 h TWA before | 8 h TWA after | Reference ID |
| Helicopter | Modern helicopter with advanced technology (compared to older helicopters without advanced technology) | short term (1 year) | mean 98.41 (SD 4.49) (n = 10) | mean 87.9 (SD 4.16) (n = 4) | |||
| Pumps | New high‐pressure coolant pumps have been installed at various metal cutting operations. These new pumps produce more pressure and more volume directly at the cutting tools. | not reported | 110 dB | 87 dB | |||
| Drill | New injector drill with a sound enclosure for a deep drilling operation | not reported | 110 dB | 95 dB | |||
| Roof fans | Old roof fans were replaced with new high‐efficiency fans | not reported | lowered the noise below the fan | ||||
| Air gun | Air gun substitution | not reported | 94 dB | 85 dB | |||
| Fork lifts | Use of tugs instead of fork lifts | not reported | 92 dB | 72 dB | |||
| Alarm system | Change from audible alarm to visual warning and pressure sensor | not reported | 95 dB | 0 dB | |||
| Air wand | Replacement of 45 air wands | not reported | 112.8 dB | 90.1 dB | |||
| Bottling line ‐ rinser‐filler‐capper machine | Purchase of a new bottling line | not reported | 89 dB | below 80 dB | |||
| Bottle‐blowers | New bottle‐blowers and segregation | not reported | 86‐87 dB | below 83 dB | |||
| Glass bottles on transport conveyer | Purchasing new design of bottle transport conveyor | not reported | 101 dB | 83 dB | |||
| Packing machinery ‐ Compressors and compressed‐air exhausts | Purchasing policy and fitted silencers | not reported | above 90 dB | below 85 dB | |||
| Bakery machinery | Not purchasing equipment that produced noise level above 85 dB, company’s health and safety adviser would visit the makers of new machinery during its manufacture and conduct a noise assessment to make sure the machinery did not exceed 85 dB | not reported | 94 dB | 85 dB | |||
| Bottle‐laner ‐ bottles banging together on laner conveyor | New machine with guide‐rails | not reported | 93‐96 dB | 87 dB | |||
| Number of cases: 14 | mean before | mean after | mean reduction | ||||
| Noise level dB | 97.4 dB | 77.7 dB | 19.7 | ||||
| TWA dB | 98.41 (SD 4.49) | 87.9 (SD 4.16) | 10.51 (95% CI 15.45 to 5.57) | ||||
| TWA = time weighted average | |||||||
| Acoustic panels and curtains | |||||||
| Noise source | Intervention | Follow‐up | Initial noise level | Noise level after | Dose before | Dose after | Reference ID |
| Production noise | Door | not reported | 85 dB | 79 dB | |||
| Blast furnace | Control rooms were redesigned in order to improve acoustical condition: installation of a UPVC window with vacuumed double‐layered glass 80 x 80 cm and double wall for entrance by 90° rotate plus a 2.0 × 1.2 m steel door without glass | not reported | 80 dB | 52.6 dB | |||
| Blast furnace | In rest room wall facing to the furnace was made from the armed concrete with a thickness of 20 cm, length of 9 m, and height of 3 m and was located in the entrance by 90° rotate | not reported | 86.1 dB | 58.4 dB | |||
| Blast furnace | Control room and rest room redesigned to improve acoustical condition | not reported | 236% (unspecified) | 130% (unspecified) | |||
| Product impact on multi‐head weigher | Fitted flexible PVC curtains | not reported | 92 dB | 88 dB | |||
| Packaging lines | Fitted acoustic baffles to ceiling | not reported | Above 90 dB | below 90 dB | |||
| Noise from hearing protection zones affecting quieter areas | Erected acoustic panels and automatic doors between hearing protection zones and quieter areas | not reported | Above 90 dB | below 85 dB | |||
| Filler pump | Improved efficiency of pump and added acoustic hood | not reported | 96 dB | 86 dB | |||
| Compressed air in bottle transportation | Acoustic side panels fitted | not reported | 85–86 dB | 73 dB | |||
| Product impact on hoppers | Flexible PVC curtains fitted | not reported | Above 90 dB | 83 dB | |||
| Number of cases: 10 | mean before | mean after | mean reduction | ||||
| noise level dB | 88.3 | 77.2 | 11.1 | ||||
| Dose % (unspecified) | 236 | 130 | 106 | ||||
| Damping material and silencers | |||||||||
| Noise source | Intervention | Follow‐up | Initialnoise level | Noise level after | 8 h TWA before | 8 h TWA after | Dose before | Dose after | Reference ID |
| Confetti machine | Damped machine surfaces: Replaced vacuums with small cyclones that were quieter and had fewer clogs, Installed conveyors to carry the paper into the disintegrators | not reported | 95 dB | 85 dB | |||||
| Production noise | Installation of sound absorbing panels, shields, covers, insulation, sheeting, installation of mufflers for fans and solenoids, reduction of compressed‐air pressure and volume in vents, use of vibrating personal alarms instead of audible alarms | not reported | 2 to 11 dB noise reduction | ||||||
| Helicopter | Cover of structural leaks with lightweight materials (e.g. new door seals) and damping of the structure (patches of constrained visco‐elastic materials that are bonded to the structure), optimised sound‐proofing panels (sandwich panels with “soft core”) and windows (thickened laminated windows with damping layer and double glazing), and Main Gear Box suspension devices (laminated ball joints at MGB support strut foot) | not reported | 7 dB noise reduction | ||||||
| Pump | Suppressor on palletizer hydraulic pump to minimize hydraulic banging, pump whine contained in sound‐insulated box | not reported | 88 dB | 83 dB | |||||
| Air‐rotary drill rig | Installation of hydraulic noise suppressors and a lead‐fiberglass blanket covering Ihe gap between the inside door and the cab frame | not reported | 98 dB | 95 dB | MSHA PEL 280%; NIOSH 3222% | MSHA PEL 210%: NIOSH 2585% | |||
| Air‐rotary drill rig | Installation of hydraulic noise suppressors | not reported | 98 dB | 97 dB | MSHA PEL 280%; NIOSH 3222% | MSHA PEL 249%; NIOSH 2951% | |||
| Pumps | Installing mufflers on pumps | not reported | 98.1 dB | 81.3 dB | |||||
| Haul trucks in underground metal/non‐metal mines | Improving the engine compartment noise barrier: the usual barrier material has been replaced with a barrier material part number Duracote 5356, manufactured by Durasonic | not reported | MSHA PEL 495% | MSHA PEL 416% | |||||
| Chiller | Reduce noise from a chiller with a combination of acoustic absorbent and retro‐fit constrained layer damping | not reported | 8 dB noise reduction | ||||||
| High‐speed strip‐fed press | Normally the press legs are welded boxes, the press frame was isolated from the fabricated legs by inserting 6 mm composite pads between frame and legs | not reported | 101 dB | 92 dB | |||||
| Product impact on hoppers and chutes | Coated internally with food‐grade, sound‐deadening material | not reported | 96–98 dB | Noise reduced by 2‐8 dB | |||||
| Gas cylinder impact on metal table | Rubber matting on table | not reported | 110 dB peaks | removal of peak noises | |||||
| Product impact on ducting | Lagged ductwork with noise‐absorbent padding | not reported | 92 dB | 84 dB | |||||
| Product impact on vibrating components | Coated externally with sound‐deadening material | not reported | 92 dB | 84 dB | |||||
| Bread‐basket stacking machine | Fitted hydraulic dampers | not reported | 92 dB | 83 dB | |||||
| Hand‐crimping metal foil packages | Mounted on layers of rubber | not reported | 86–89 dB | 85–86 dB | |||||
| Keg impact on concrete floor | Fitted rubber matting on to floor | not reported | High noise levels | Noise levels reduced | |||||
| Gas cylinder impact on metal ‘A’ frame trolleys | Fitted rubber matting on to trolleys | not reported | 110 dB peaks | Peak noise levels reduced | |||||
| Road tanker degassing | Fitted silencers | not reported | 92 dB | 83 dB | |||||
| Evaporative condensers and refrigeration plant | Fitted silencers | not reported | 94 dB | 83–87 dB | |||||
| Number of cases: 20 | mean before | mean after | mean reduction | ||||||
| noise level dB | 93.6 | 86.5 | 7 | ||||||
| TWA dB | 101 | 92 | 9 | ||||||
| Dose % (MSHA PEL) [dosimeter settings: | 351.7 | 291.7 | 60 | ||||||
| Dose % (NIOSH) [dosimeter settings: | 3222 | 2768 | 454 | ||||||
| MSHA = Mine safety and health administration NIOSH = National Institute for Occupational Safety and Health PEL = permissible exposure limit | |||||||||
| Design changes | |||||||||
| Noise source | Intervention | Follow‐up | Initial noise level | Noise level after | 8 h TWA before | 8 h TWA after | Dose before | Dose after | Reference ID |
| Roof bolting machine at underground coal mines | New drill bit isolator | immediate | reduced by 3.2 dB | MSHA PEL per hole 0.85% | MSHA PEL per hole 0.57% | ||||
| short term (after 253 holes and 628 m) | reduced by 2.2 dB | MSHA PEL per hole 0.9% | MSHA PEL per hole 0.66% | ||||||
| 4‐roll calender in a tire manufacturing facility "calender operator" | Replacing the piercer brackets, optimising alignment and improving preventative maintenance (increased and more frequent lubrication of the piercer and other areas of the equipment with high friction or pressure) | not reported | 87.7 dB | 86.3 dB | OSHA dose 72.8% | OSHA dose 59.6% | |||
| 4‐roll calender in a tire manufacturing facility "wind up operator" | Replacing the piercer brackets, optimising alignment and improving preventative maintenance (increased and more frequent lubrication of the piercer and other areas of the equipment with high friction or pressure) | not reported | 93.1 dB | 89 dB | OSHA dose 153% | OSHA dose 87.3% | |||
| Heavy metal arms which drove the reciprocating blade on the machines | Alternative linkage using flexible nylon straps | not reported | 95 dB | 75 dB | |||||
| Tobacco filter making machine | Machine design improvements on a tobacco filter making machine and room improvements | not reported | 9 dB reduction | ||||||
| Weaving machines | Use of different spindle | not reported | 100 dB | 90 dB | |||||
| Locomotive for mining | Active noise control | immediate | |||||||
| Mining truck | Active noise control | immediate | |||||||
| Mining truck | active noise control and damping material | immediate | |||||||
| Filler | Filler outfeed: line shaft removed, individual drives installed | not reported | 107 dB | 81 dB | |||||
| Con‐air dryer | Machine set on vibration mounts, quieter blower | not reported | 94 dB | 85 dB | |||||
| Transfer cart | not reported | not reported | 94 dB | 79 dB | |||||
| Trimmer | rReplacing nozzles from trimmer with in feed decline drive belt | not reported | 98 to 113 dB | 86 to 104 dB | |||||
| Continuous mining machine | Exchange of a single sprocket chain for a dual sprocket chain on a continuous mining machine (CMM, Joy Mining Machine 14CM‐15) | not reported | 93.4 to 93.3 dB | 92 dB | MSHA PEL 159 % | MSHA PEL 132.5% | |||
| Moen case former | Exchange of pneumatic cylinder for servo‐mandrel | not reported | 97 dB | 87 dB | |||||
| Cart | Exchange of cart wheels | not reported | 88 dB | 72 dB | |||||
| Standard longwall cutting drums (mining) | Modified set of longwall cutting drums instead of a set of standard (baseline) drums | not reported | 98 dB | 92 dB | 95.7 dB | 93.1 dB | MSHA PEL 220.5% | MSHA PEL 158.6% | |
| Haul trucks in underground metal/non‐metal mines | Improving the engine compartment noise barrier and changing the fan type, size, and rotation speed (larger fan of different design and different fan pulley to reduce the fan rotation speed to 90%) | not reported | 102 dB | 93 dB | MSHA PEL 495% | MSHA PEL 158% | |||
| Load‐haul‐dumps (LHDs) in underground metal/non‐metal mines | Improving the engine compartment noise barrier and changing the fan type, size, and rotation speed (larger fan of a different design and a different fan hub to reduce the fan rotation speed to roughly 87% and new noise barrier material (Duracote Durasonic 5356)) | not reported | 98 dB | 96 dB | MSHA PEL 289% | MSHA PEL 231% | |||
| Load‐haul‐dumps (LHDs) in underground metal/non‐metal mines | Improving the engine compartment noise barrier and changing the fan type, size, and rotation speed (a larger fan of a different design was installed as well as a different fan hub to reduce the fan rotation speed to roughly 95%) | not reported | 98 dB | 93 dB | MSHA PEL 289% | MSHA PEL 142% | |||
| Standard camshaft washer drying nozzles (pneumatic) | Pneumatic nozzles replaced with suitable entraining units | not reported | 12 dB reduction | ||||||
| Drier fan | Retro‐fitting aerodynamic and acoustic elements inside fan casings and the associated ductwork | not reported | 9 dB reduction | ||||||
| Aluminium can extract and chopper fans | Fitting aerodynamic inserts inside the fan casing | not reported | 22 dB reduction | ||||||
| Separator (large thin sheet distribution dome) | alteration to a vibratory separator: forming this component in stainless sound deadened steel | not reported | 105 dB | 89 dB | |||||
| Metal trays | Replacing metal trays with plastic trays | not reported | 89 dB | 84‐85 dB | |||||
| Metal wheels on baking racks | Replacing baking rack wheels with resin wheels | not reported | above 100 dB | 86‐92 dB | |||||
| Loosening product from baking tins with air knives | Air knives modified to operate with a diffuse air jet | not reported | above 90 dB | below 85 dB | |||||
| Bottles and cans banging together on conveyors | Fitted a pressureless combiner conveyor system | not reported | above 90 dB | below 90 dB | |||||
| Baking tins banging together on chain or slat conveyors | Installing ‘tin‐friendly’ conveyors | not reported | above 90 dB | below 85 dB | |||||
| Manual changeover of baking tins on conveyor | Installed robots to handle pans | not reported | 94‐96 dB | below 90 dB | |||||
| Water pumps on filling machines | Replaced with air pumps and fitted silencers | not reported | 90 dB | 84 dB | |||||
| Filling sachets and cups | New design of horizontal powder‐feeder and enclosed machine | not reported | 83‐84 dB | 80 dB | |||||
| Bottle manufacture, filling and packing lines | Acoustic panels fitted to walls, high ceiling installed | not reported | Above 90 dB | 83 dB | |||||
| Contact between metal trays and metal tracking | Replaced with plastic tracking | not reported | 94 dB | 87 dB | |||||
| Product impact on metal chutes | Replaced with plastic chutes | not reported | 96‐98 dB | 90 dB | |||||
| Electrically powered sausage‐spooling machines | Replaced with compressed‐air spooler | not reported | 86‐90 dB | below 80 dB | |||||
| Tray‐indexing arm | Plastic caps on fingers of indexing arm | not reported | 94 dB | 87‐89 dB | |||||
| Vibratory conveyor | Ensured conveyor only used at least noisy speed | not reported | above 90 dB | below 85 | |||||
| Glass bottles on conveyor | New design of conveyor with different chain speeds | not reported | 101 dB | 84 dB | |||||
| Lidding and de‐lidding tins | Installed robots to lid and de‐lid baking tins | not reported | 90‐93 dB | 88 dB | |||||
| Number of cases: 41 | mean before | mean after | mean reduction | ||||||
| Noise level dB | 94.5 dB | 85.3 dB | 9.6 dB | ||||||
| TWA dB | 95.4 | 91.8 | 3.4 dB | ||||||
| Dose % (OSHA) | 112.9 | 73.5 | 39.5 | ||||||
| Dose % (MSHA PEL) | 207.8 | 117.6 | 90.1 | ||||||
| MSHA = Mine Safety and Health Administration OSHA = Occupational Safety and Health Administration PEL = permissible exposure limit | |||||||||
| Enclosure | |||||
| Noise source | Intervention | Follow‐up | Initial noise level | Noise level after | Reference ID |
| Conveyor | An enclosure was put over the conveyor at a cost of GBP 2000 and the conveyor speed was changed to reduce jar clashing | not reported | 96 dB | 86 dB | |
| Grinder | Enclosure over the grinder | not reported | 93 dB | 85 dB | |
| Not reported | Use of an enclosure with acoustical foam to deburring area | not reported | 104 dB | 82 dB | |
| Feeder | Enclosing the bowl feeder | not reported | 116 dB | 86 dB | |
| Compressed‐air knives | Enclosed machine | not reported | 91–92 dB | Below 85 dB | |
| Glass‐bottle conveyor | Enclosed the conveyor noise levels | not reported | Above 90 dB | reduced by 2‐8 dB | |
| Blower machine | Enclosed machine using sound‐absorbent panels | not reported | above 90 | Below 90 dB | |
| Bottle‐blowing machines | Machine enclosed and segregated | not reported | 94 dB | 89 dB | |
| Hammer mill | Enclosed in an acoustic booth | not reported | 102 dB | 87 dB | |
| Rinser‐filler‐capper machine | Enclosed machine | not reported | 85 dB | 73 dB | |
| Glass jars clashing together on conveyor | Fitted enclosure and changed conveyor speed | not reported | 96 dB | 86 dB | |
| Bottles banging together on filler infeed conveyor | Fitted covers over conveyor | not reported | 96‐100 dB | 92 dB | |
| Number of cases: 12 | mean before | mean after | mean reduction | ||
| Noise level (dB) | 96.3 dB | 85.5 dB | 11.8 dB | ||
| Maintenance | |||||
| Noise source | Intervention | Follow‐up | Initial noise level | Noise level after | Reference ID |
| Dough mixer | Maintenance modifications to a mixing machine | not reported | 94 dB | 91 dB | |
| Compressed air in soft drinks factory machines | Regular maintenance of machines to reduce noise from air leaks | not reported | High noise levels | Noise levels reduced by 3 to 4 dB | |
| Gearboxes on mixing machine | Lubricating gearboxes | not reported | 80–85 dB | Noise levels reduced by 1.5 dB | |
| Compressed‐air exhausts on vacuum‐wrapping machines | Fitting and maintaining silencers on wrapping machines | not reported | 88–90 dB | Below 85 dB | |
| Number of cases: 4 | mean before | mean after | mean reduction | ||
| Noise level dB | 88.5 dB | 85.7 dB | 3 dB | ||
| Segregation | |||||
| Noise source | Intervention | Follow‐up | Initial noise level | Noise level after | Reference ID |
| Main production area of bakery | Re‐routing pedestrian traffic, signage and training | not reported | 94 dB | below 85 dB | |
| Bowl chopper and mincers | Moved from main production area to an isolated area | not reported | 88–94 dB | below 85 dB | |
| Basket‐washing machine in main bakery | Moved to a separate building | not reported | 88 dB | Noise source removed | |
| High‐pressure air‐compressor | Located in a separate room | not reported | 110–112 dB | 60–70 dB outside room | |
| Vibrating cap‐hoppers | Located in separate enclosure | not reported | Above 90 dB | Noise source removed | |
| Air‐compressor | Located in separate, unmanned room | not reported | 94–95 dB | 80 dB | |
| Pet food processing area | Solid block wall with acoustic panelling between processing and packaging area | not reported | 95 dB | Below 85 dB | |
| Number of cases: 7 | mean before | mean after | mean reduction | ||
| Noise level dB | 97.1 dB | 80.0 dB | 17.1 dB | ||
| Study | Independence other changes | Sufficient data points | Formal test for trend | Intervention does not affect data | Blinded assessment of outcome | Complete data set | Reliable outcome measure |
| Not done | Done | Done | Not done | Not done | Not clear | Done | |
| Not done | Done | Done | Done | Not Done | Done | Done |
| Outcome or subgroup title | No. of studies | No. of participants | Statistical method | Effect size |
| 1 Immediate change in level Show forest plot | 1 | immediate change in level (Random, 95% CI) | Totals not selected | |
| 1.1 Surface noise Intervention (Int) Year 1999 | 1 | immediate change in level (Random, 95% CI) | 0.0 [0.0, 0.0] | |
| 1.2 Underground noise Int Year 1999 | 1 | immediate change in level (Random, 95% CI) | 0.0 [0.0, 0.0] | |
| 1.3 Surface noise Int Year 2000 | 1 | immediate change in level (Random, 95% CI) | 0.0 [0.0, 0.0] | |
| 1.4 Underground noise Int Year 2000 | 1 | immediate change in level (Random, 95% CI) | 0.0 [0.0, 0.0] | |
| 2 Change in slope Show forest plot | 1 | change in slope (Random, 95% CI) | Totals not selected | |
| 2.1 Surface noise Int Year 1999 | 1 | change in slope (Random, 95% CI) | 0.0 [0.0, 0.0] | |
| 2.2 Underground noise Int Year 1999 | 1 | change in slope (Random, 95% CI) | 0.0 [0.0, 0.0] | |
| 2.3 Surface noise Int Year 2000 | 1 | change in slope (Random, 95% CI) | 0.0 [0.0, 0.0] | |
| 2.4 Underground noise Int Year 2000 | 1 | change in slope (Random, 95% CI) | 0.0 [0.0, 0.0] | |
| Outcome or subgroup title | No. of studies | No. of participants | Statistical method | Effect size |
| 1 Noise attenuation at 0.5 kHz (REAT) Show forest plot | 1 | 40 | Mean Difference (IV, Random, 95% CI) | 2.34 [‐0.85, 5.54] |
| 1.1 Wilson Sound Ban cap | 1 | 20 | Mean Difference (IV, Random, 95% CI) | 4.1 [‐2.47, 10.67] |
| 1.2 Bilsom UF‐1 muff | 1 | 20 | Mean Difference (IV, Random, 95% CI) | 1.80 [‐1.86, 5.46] |
| 2 Noise attenuation at 1 kHz (REAT) Show forest plot | 1 | 40 | Mean Difference (IV, Random, 95% CI) | 0.89 [‐3.02, 4.80] |
| 2.1 Wilson Sound Ban Cap | 1 | 20 | Mean Difference (IV, Random, 95% CI) | 3.80 [‐3.70, 11.30] |
| 2.2 Bilsom UF‐1 Muff | 1 | 20 | Mean Difference (IV, Random, 95% CI) | ‐0.20 [‐4.78, 4.38] |
| 3 Noise attenuation at 2 kHz (REAT) Show forest plot | 1 | 40 | Mean Difference (IV, Random, 95% CI) | 2.57 [‐0.23, 5.38] |
| 3.1 Wilson Sound Ban Cap | 1 | 20 | Mean Difference (IV, Random, 95% CI) | 2.70 [‐1.89, 7.29] |
| 3.2 Bilsom UF‐1 Muff | 1 | 20 | Mean Difference (IV, Random, 95% CI) | 2.5 [‐1.05, 6.05] |
| 4 Noise attenuation at 3 kHz (REAT) Show forest plot | 1 | 40 | Mean Difference (IV, Random, 95% CI) | 2.23 [0.09, 4.36] |
| 4.1 Wilson Sound Ban Cap | 1 | 20 | Mean Difference (IV, Random, 95% CI) | 1.60 [‐3.01, 6.21] |
| 4.2 Bilsom UF‐1 Muff | 1 | 20 | Mean Difference (IV, Random, 95% CI) | 2.40 [‐0.01, 4.81] |
| 5 Noise attenuation at 4 kHz (REAT) Show forest plot | 1 | 40 | Mean Difference (IV, Random, 95% CI) | 0.83 [‐3.28, 4.95] |
| 5.1 Wilson Sound Ban Cap | 1 | 20 | Mean Difference (IV, Random, 95% CI) | 0.90 [‐6.18, 7.98] |
| 5.2 Bilsom UF‐1 Muff | 1 | 20 | Mean Difference (IV, Random, 95% CI) | 0.80 [‐4.26, 5.86] |
| 6 Noise attenuation at 6 kHz (REAT) Show forest plot | 1 | 40 | Mean Difference (IV, Random, 95% CI) | 0.64 [‐3.76, 5.04] |
| 6.1 Wilson Sound Ban Cap | 1 | 20 | Mean Difference (IV, Random, 95% CI) | 2.30 [‐7.31, 11.91] |
| 6.2 Bilsom UF‐1 Muff | 1 | 20 | Mean Difference (IV, Random, 95% CI) | 0.20 [‐4.75, 5.15] |
| 7 Noise attenuation at 8 kHz (REAT) Show forest plot | 1 | 40 | Mean Difference (IV, Random, 95% CI) | 1.14 [‐3.59, 5.87] |
| 7.1 Wilson Sound Ban Cap | 1 | 20 | Mean Difference (IV, Random, 95% CI) | 2.0 [‐8.13, 12.13] |
| 7.2 Bilsom UF‐1 Muff | 1 | 20 | Mean Difference (IV, Random, 95% CI) | 0.90 [‐4.45, 6.25] |
| Outcome or subgroup title | No. of studies | No. of participants | Statistical method | Effect size |
| 1 Noise attenuation at 0.5 kHz (REAT) Show forest plot | 1 | 40 | Mean Difference (IV, Random, 95% CI) | 12.69 [7.69, 17.69] |
| 1.1 EAR foam plugs | 1 | 20 | Mean Difference (IV, Random, 95% CI) | 16.30 [5.93, 26.67] |
| 1.2 UltraFit plugs | 1 | 20 | Mean Difference (IV, Random, 95% CI) | 11.6 [5.89, 17.31] |
| 2 Noise attenuation at 1 kHz (REAT) Show forest plot | 1 | 40 | Mean Difference (IV, Random, 95% CI) | 13.31 [8.13, 18.50] |
| 2.1 EAR foam plugs | 1 | 20 | Mean Difference (IV, Random, 95% CI) | 15.40 [5.62, 25.18] |
| 2.2 UltraFit plugs | 1 | 20 | Mean Difference (IV, Random, 95% CI) | 12.5 [6.39, 18.61] |
| 3 Noise attenuation at 2 kHz (REAT) Show forest plot | 1 | 40 | Mean Difference (IV, Random, 95% CI) | 9.62 [4.52, 14.72] |
| 3.1 EAR foam plugs | 1 | 20 | Mean Difference (IV, Random, 95% CI) | 7.90 [‐1.21, 17.01] |
| 3.2 UltraFit plugs | 1 | 20 | Mean Difference (IV, Random, 95% CI) | 10.40 [4.25, 16.55] |
| 4 Noise attenuation at 3 kHz (REAT) Show forest plot | 1 | 40 | Mean Difference (IV, Random, 95% CI) | 6.71 [2.66, 10.76] |
| 4.1 EAR foam plugs | 1 | 20 | Mean Difference (IV, Random, 95% CI) | 6.20 [‐1.54, 13.94] |
| 4.2 UltraFit plugs | 1 | 20 | Mean Difference (IV, Random, 95% CI) | 6.90 [2.15, 11.65] |
| 5 Noise attenuation at 4 kHz (REAT) Show forest plot | 1 | 40 | Mean Difference (IV, Random, 95% CI) | 7.97 [3.60, 12.34] |
| 5.1 EAR foam plugs | 1 | 20 | Mean Difference (IV, Random, 95% CI) | 6.00 [‐1.23, 13.23] |
| 5.2 UltraFit plugs | 1 | 20 | Mean Difference (IV, Random, 95% CI) | 9.10 [3.62, 14.58] |
| 6 Noise attenuation at 6 kHz (REAT) Show forest plot | 1 | 40 | Mean Difference (IV, Random, 95% CI) | 12.13 [6.21, 18.05] |
| 6.1 EAR foam plugs | 1 | 20 | Mean Difference (IV, Random, 95% CI) | 9.2 [‐1.87, 20.27] |
| 6.2 UltraFit plugs | 1 | 20 | Mean Difference (IV, Random, 95% CI) | 13.3 [6.30, 20.30] |
| 7 Noise attenuation at 8 kHz (REAT) Show forest plot | 1 | 40 | Mean Difference (IV, Random, 95% CI) | 11.07 [4.51, 17.64] |
| 7.1 EAR foam plugs | 1 | 20 | Mean Difference (IV, Random, 95% CI) | 7.60 [‐0.97, 16.17] |
| 7.2 UltraFit plugs | 1 | 20 | Mean Difference (IV, Random, 95% CI) | 14.3 [6.11, 22.49] |
| 8 Mean noise attenuation over 0.5, 1, 2, 3, 4, 6, 8 kHz (REAT) Show forest plot | 2 | 140 | Mean Difference (IV, Fixed, 95% CI) | 8.59 [6.92, 10.25] |
| 8.1 Moldex Comets, EN352, USA | 1 | 100 | Mean Difference (IV, Fixed, 95% CI) | 8.34 [6.58, 10.10] |
| 8.2 EAR foam plugs | 1 | 20 | Mean Difference (IV, Fixed, 95% CI) | 9.8 [0.60, 19.00] |
| 8.3 UltraFit plugs | 1 | 20 | Mean Difference (IV, Fixed, 95% CI) | 11.16 [4.87, 17.45] |
| Outcome or subgroup title | No. of studies | No. of participants | Statistical method | Effect size |
| 1 Mean attenuation at 0.5, 1, 2, 3, 4, 6, 8 kHz Show forest plot | 1 | Mean Difference (IV, Fixed, 95% CI) | Subtotals only | |
| 1.1 NRR 20 vs NRR 30 | 1 | 100 | Mean Difference (IV, Fixed, 95% CI) | 2.62 [1.75, 3.49] |
| Outcome or subgroup title | No. of studies | No. of participants | Statistical method | Effect size |
| 1 Noise attenuation (dB) Show forest plot | 1 | 4 | Mean Difference (IV, Fixed, 95% CI) | 0.0 [0.0, 0.0] |
| 1.1 Alpha‐200 series with Active Noise Cancelling | 1 | 2 | Mean Difference (IV, Fixed, 95% CI) | 0.0 [0.0, 0.0] |
| 1.2 Gentex/Bose Active Noise Cancelling | 1 | 2 | Mean Difference (IV, Fixed, 95% CI) | 0.0 [0.0, 0.0] |
| 2 TTS at 1 kHz (before exposure ‐ after exposure ) Show forest plot | 1 | Mean Difference (IV, Random, 95% CI) | Subtotals only | |
| 3 TTS at 2 kHz (before exposure ‐ after exposure ) Show forest plot | 1 | Mean Difference (IV, Random, 95% CI) | Subtotals only | |
| 4 TTS at 4 kHz (before exposure ‐ after exposure ) Show forest plot | 1 | Mean Difference (IV, Random, 95% CI) | Subtotals only | |
| 5 TTS at 6 kHz (before exposure ‐ after exposure ) Show forest plot | 1 | Mean Difference (IV, Random, 95% CI) | Subtotals only | |
| 6 TTS at 8 kHz (before exposure ‐ after exposure ) Show forest plot | 1 | Mean Difference (IV, Random, 95% CI) | Subtotals only | |
| Outcome or subgroup title | No. of studies | No. of participants | Statistical method | Effect size |
| 1 Noise attenuation dB(A) Show forest plot | 1 | 20 | Mean Difference (IV, Random, 95% CI) | 3.10 [1.12, 5.08] |
| Outcome or subgroup title | No. of studies | No. of participants | Statistical method | Effect size |
| 1 Noise attenuation (dB) Show forest plot | 1 | 36 | Mean Difference (IV, Fixed, 95% CI) | 0.0 [0.0, 0.0] |
| 1.1 Peltor H61 Muff Elec | 1 | 6 | Mean Difference (IV, Fixed, 95% CI) | 0.0 [0.0, 0.0] |
| 1.2 Peltor H7 Muff Elec | 1 | 6 | Mean Difference (IV, Fixed, 95% CI) | 0.0 [0.0, 0.0] |
| 1.3 Peltor H6 Muff Elec | 1 | 6 | Mean Difference (IV, Fixed, 95% CI) | 0.0 [0.0, 0.0] |
| 1.4 Bilsom Marksman Muff Elec | 1 | 6 | Mean Difference (IV, Fixed, 95% CI) | 0.0 [0.0, 0.0] |
| 1.5 Silenta Hunter Muff Elec | 1 | 6 | Mean Difference (IV, Fixed, 95% CI) | 0.0 [0.0, 0.0] |
| 1.6 EAR Ultra 9000 Plug | 1 | 6 | Mean Difference (IV, Fixed, 95% CI) | 0.0 [0.0, 0.0] |
| Outcome or subgroup title | No. of studies | No. of participants | Statistical method | Effect size |
| 1 Change in noise levels at 2 months' follow‐up Show forest plot | 1 | 132 | Mean Difference (IV, Random, 95% CI) | 0.32 [‐2.44, 3.08] |
| 1.1 Extensive information plus NLI vs information only | 1 | 64 | Mean Difference (IV, Random, 95% CI) | ‐0.40 [‐4.37, 3.57] |
| 1.2 Information plus NLI vs Information only | 1 | 68 | Mean Difference (IV, Random, 95% CI) | 1.0 [‐2.84, 4.84] |
| 2 Change in noise levels at 4 months' follow‐up Show forest plot | 1 | 132 | Mean Difference (IV, Fixed, 95% CI) | ‐0.14 [‐2.66, 2.38] |
| 2.1 Extensive information plus NLI vs information only | 1 | 64 | Mean Difference (IV, Fixed, 95% CI) | ‐0.30 [‐3.95, 3.35] |
| 2.2 Information plus NLI vs information only | 1 | 68 | Mean Difference (IV, Fixed, 95% CI) | 0.0 [‐3.48, 3.48] |
| Outcome or subgroup title | No. of studies | No. of participants | Statistical method | Effect size |
| 1 Change in noise levels at 2 months' follow‐up Show forest plot | 1 | Mean Difference (IV, Fixed, 95% CI) | Totals not selected | |
| 2 Change in noise levels at 4 months' follow‐up Show forest plot | 1 | Mean Difference (IV, Random, 95% CI) | Totals not selected | |
| Outcome or subgroup title | No. of studies | No. of participants | Statistical method | Effect size |
| 1 TTS at 0.5 kHz (Hearing loss before exposure ‐ after exposure ) Show forest plot | 1 | 70 | Mean Difference (IV, Random, 95% CI) | 0.0 [0.0, 0.0] |
| 1.1 After 8 minutes out of noise | 1 | 18 | Mean Difference (IV, Random, 95% CI) | 0.0 [0.0, 0.0] |
| 1.2 After 14.6 minutes out of noise | 1 | 18 | Mean Difference (IV, Random, 95% CI) | 0.0 [0.0, 0.0] |
| 1.3 After 20 minutes out of noise | 1 | 17 | Mean Difference (IV, Random, 95% CI) | 0.0 [0.0, 0.0] |
| 1.4 After 27.2 minutes out of noise | 1 | 17 | Mean Difference (IV, Random, 95% CI) | 0.0 [0.0, 0.0] |
| 2 TTS at 1 kHz (before exposure ‐ after exposure ) Show forest plot | 1 | Mean Difference (IV, Random, 95% CI) | Subtotals only | |
| 2.1 After 8 minutes out of noise | 1 | 18 | Mean Difference (IV, Random, 95% CI) | 0.0 [0.0, 0.0] |
| 2.2 After 14.6 minutes out of noise | 1 | 18 | Mean Difference (IV, Random, 95% CI) | 0.0 [0.0, 0.0] |
| 2.3 After 20 minutes out of noise | 1 | 17 | Mean Difference (IV, Random, 95% CI) | 0.0 [0.0, 0.0] |
| 2.4 After 27.2 minutes out of noise | 1 | 17 | Mean Difference (IV, Random, 95% CI) | 0.0 [0.0, 0.0] |
| 3 TTS at 2 kHz (before exposure ‐ after exposure ) Show forest plot | 1 | Mean Difference (IV, Random, 95% CI) | Subtotals only | |
| 3.1 After 8 minutes out of noise | 1 | 18 | Mean Difference (IV, Random, 95% CI) | 0.0 [0.0, 0.0] |
| 3.2 After 14.6 minutes out of noise | 1 | 18 | Mean Difference (IV, Random, 95% CI) | 0.0 [0.0, 0.0] |
| 3.3 After 20 minutes out of noise | 1 | 17 | Mean Difference (IV, Random, 95% CI) | 0.0 [0.0, 0.0] |
| 3.4 After 27.2 minutes out of noise | 1 | 17 | Mean Difference (IV, Random, 95% CI) | 0.0 [0.0, 0.0] |
| 4 TTS at 3 kHz (before exposure ‐ after exposure ) Show forest plot | 1 | Mean Difference (IV, Random, 95% CI) | Subtotals only | |
| 4.1 After 8 minutes out of noise | 1 | 18 | Mean Difference (IV, Random, 95% CI) | 0.0 [0.0, 0.0] |
| 4.2 After 14.6 minutes out of noise | 1 | 18 | Mean Difference (IV, Random, 95% CI) | 0.0 [0.0, 0.0] |
| 4.3 After 20 minutes out of noise | 1 | 17 | Mean Difference (IV, Random, 95% CI) | 0.0 [0.0, 0.0] |
| 4.4 After 27.2 minutes out of noise | 1 | 17 | Mean Difference (IV, Random, 95% CI) | 0.0 [0.0, 0.0] |
| 5 TTS at 4 kHz (before exposure ‐ after exposure) Show forest plot | 1 | Mean Difference (IV, Random, 95% CI) | Subtotals only | |
| 5.1 After 8 minutes out of noise | 1 | 18 | Mean Difference (IV, Random, 95% CI) | 0.0 [0.0, 0.0] |
| 5.2 After 14.6 minutes out of noise | 1 | 18 | Mean Difference (IV, Random, 95% CI) | 0.0 [0.0, 0.0] |
| 5.3 After 20 minutes out of noise | 1 | 17 | Mean Difference (IV, Random, 95% CI) | 0.0 [0.0, 0.0] |
| 5.4 After 27.2 minutes out of noise | 1 | 17 | Mean Difference (IV, Random, 95% CI) | 0.0 [0.0, 0.0] |
| 6 TTS at 6 kHz (before exposure ‐ after exposure) Show forest plot | 1 | Mean Difference (IV, Random, 95% CI) | Subtotals only | |
| 6.1 After 8 minutes out of noise | 1 | 18 | Mean Difference (IV, Random, 95% CI) | 0.0 [0.0, 0.0] |
| 6.2 After 14.6 minutes out of noise | 1 | 18 | Mean Difference (IV, Random, 95% CI) | 0.0 [0.0, 0.0] |
| 6.3 After 20 minutes out of noise | 1 | 17 | Mean Difference (IV, Random, 95% CI) | 0.0 [0.0, 0.0] |
| 6.4 After 27.2 minutes out of noise | 1 | 17 | Mean Difference (IV, Random, 95% CI) | 0.0 [0.0, 0.0] |
| Outcome or subgroup title | No. of studies | No. of participants | Statistical method | Effect size |
| 1 Hearing loss change over 3 years (4 kHz / STS) Show forest plot | 2 | OR (Random, 95% CI) | Subtotals only | |
| 1.1 High noise exposure > 89 dB(A) | 2 | OR (Random, 95% CI) | 0.80 [0.63, 1.03] | |
| 1.2 Low noise exposure < 89 dB(A) | 2 | OR (Random, 95% CI) | 2.65 [0.40, 17.52] | |
| Outcome or subgroup title | No. of studies | No. of participants | Statistical method | Effect size |
| 1 STS Show forest plot | 1 | Odds Ratio (Fixed, 95% CI) | Subtotals only | |
| 1.1 3‐year follow‐up | 1 | Odds Ratio (Fixed, 95% CI) | 0.85 [0.29, 2.44] | |
| 1.2 16‐year follow‐up | 1 | Odds Ratio (Fixed, 95% CI) | 0.94 [0.46, 1.91] | |
| Outcome or subgroup title | No. of studies | No. of participants | Statistical method | Effect size |
| 1 HL (dB/year at 2, 3 and 4 kHz) Δ level Show forest plot | 1 | rate of hearing loss (Random, 95% CI) | Totals not selected | |
| 1.1 intervention ‐ controlled for age, gender, baseline hearing | 1 | rate of hearing loss (Random, 95% CI) | 0.0 [0.0, 0.0] | |
| 1.2 control ‐ controlled for age, gender, baseline hearing | 1 | rate of hearing loss (Random, 95% CI) | 0.0 [0.0, 0.0] | |
| 1.3 intervention minus control ‐ controlled for age, gender, baseline hearing | 1 | rate of hearing loss (Random, 95% CI) | 0.0 [0.0, 0.0] | |
| 1.4 intervention ‐ controlled for age, gender, baseline hearing and initial rate of HL | 1 | rate of hearing loss (Random, 95% CI) | 0.0 [0.0, 0.0] | |
| 1.5 control ‐ controlled for age, gender, baseline hearing and initial rate of HL | 1 | rate of hearing loss (Random, 95% CI) | 0.0 [0.0, 0.0] | |
| 1.6 intervention minus control ‐ controlled for age, gender, baseline hearing and initial rate of HL | 1 | rate of hearing loss (Random, 95% CI) | 0.0 [0.0, 0.0] | |
| 2 HL (dB/year at 2, 3 and 4 kHz) slope Show forest plot | 1 | rate of hearing loss (Fixed, 95% CI) | Totals not selected | |
| 2.1 intervention ‐ controlled for age, gender, baseline hearing | 1 | rate of hearing loss (Fixed, 95% CI) | 0.0 [0.0, 0.0] | |
| 2.2 control ‐ controlled for age, gender, baseline hearing | 1 | rate of hearing loss (Fixed, 95% CI) | 0.0 [0.0, 0.0] | |
| 2.3 intervention minus control ‐ controlled for age, gender, baseline hearing | 1 | rate of hearing loss (Fixed, 95% CI) | 0.0 [0.0, 0.0] | |
| 2.4 intervention ‐ controlled for age, gender, baseline hearing and initial rate of HL | 1 | rate of hearing loss (Fixed, 95% CI) | 0.0 [0.0, 0.0] | |
| 2.5 control ‐ controlled for age, gender, baseline hearing and initial rate of HL | 1 | rate of hearing loss (Fixed, 95% CI) | 0.0 [0.0, 0.0] | |
| 2.6 intervention minus control ‐ controlled for age, gender, baseline hearing and initial rate of HL | 1 | rate of hearing loss (Fixed, 95% CI) | 0.0 [0.0, 0.0] | |
| Outcome or subgroup title | No. of studies | No. of participants | Statistical method | Effect size |
| 1 Hearing loss change (STS) Show forest plot | 1 | 1317 | Odds Ratio (M‐H, Fixed, 95% CI) | 0.87 [0.56, 1.36] |
| Outcome or subgroup title | No. of studies | No. of participants | Statistical method | Effect size |
| 1 STS Show forest plot | 1 | 341 | Risk Ratio (M‐H, Fixed, 95% CI) | 0.36 [0.09, 1.42] |
| Outcome or subgroup title | No. of studies | No. of participants | Statistical method | Effect size |
| 1 Hearing loss change STS/at 4 kHz Show forest plot | 3 | 16301 | OR (Random, 95% CI) | 0.40 [0.23, 0.69] |
| 1.1 Adera 2000 | 1 | 15345 | OR (Random, 95% CI) | 0.26 [0.14, 0.47] |
| 1.2 Adera 1993 | 1 | 692 | OR (Random, 95% CI) | 0.35 [0.19, 0.65] |
| 1.3 Brink 2000 | 1 | 264 | OR (Random, 95% CI) | 0.62 [0.40, 0.97] |
| Outcome or subgroup title | No. of studies | No. of participants | Statistical method | Effect size |
| 1 Hearing loss change over 1 year at 4 kHz Show forest plot | 1 | Mean Difference (IV, Fixed, 95% CI) | Totals not selected | |
| Outcome or subgroup title | No. of studies | No. of participants | Statistical method | Effect size |
| 1 hearing loss STS Show forest plot | 1 | Risk Ratio (Random, 95% CI) | 3.38 [1.23, 9.32] | |
| 1.1 low‐exposed engineers | 1 | Risk Ratio (Random, 95% CI) | 2.07 [0.27, 15.99] | |
| 1.2 medium‐exposed infantry | 1 | Risk Ratio (Random, 95% CI) | 2.82 [0.37, 21.57] | |
| 1.3 high‐exposed artillery | 1 | Risk Ratio (Random, 95% CI) | 4.69 [1.13, 19.51] | |
| Outcome or subgroup title | No. of studies | No. of participants | Statistical method | Effect size |
| 1 hearing loss STS Show forest plot | 1 | Risk Ratio (Fixed, 95% CI) | Totals not selected | |
| 1.1 high‐exposed artillery | 1 | Risk Ratio (Fixed, 95% CI) | 0.0 [0.0, 0.0] | |
| Outcome or subgroup title | No. of studies | No. of participants | Statistical method | Effect size |
| 1 Hearing loss change at 4 kHz/STS (5‐year follow‐up) Show forest plot | 4 | 2231 | effect size (Fixed, 95% CI) | 0.05 [‐0.05, 0.16] |
| 1.1 Pell hearing loss 10 dB | 1 | 628 | effect size (Fixed, 95% CI) | ‐0.1 [‐0.27, 0.07] |
| 1.2 Pell hearing loss 15 to 35 dB | 1 | 559 | effect size (Fixed, 95% CI) | 0.09 [‐0.11, 0.29] |
| 1.3 Pell hearing loss 40 dB | 1 | 385 | effect size (Fixed, 95% CI) | 0.18 [‐0.06, 0.42] |
| 1.4 Lee‐Feldstein | 1 | 474 | effect size (Fixed, 95% CI) | 0.29 [‐0.07, 0.66] |
| 1.5 Hager | 1 | 43 | effect size (Fixed, 95% CI) | ‐0.1 [‐0.72, 0.52] |
| 1.6 Gosztonyi | 1 | 142 | effect size (Fixed, 95% CI) | 0.15 [‐0.18, 0.48] |
| 2 Hazard of STS Show forest plot | 1 | Hazard Ratio (Random, 95% CI) | 3.78 [2.69, 5.31] | |
| 2.1 80 to 85 dB‐years | 1 | Hazard Ratio (Random, 95% CI) | 2.10 [1.26, 3.49] | |
| 2.2 85 to 90 dB‐years | 1 | Hazard Ratio (Random, 95% CI) | 3.00 [2.27, 3.96] | |
| 2.3 90 to 95 dB‐years | 1 | Hazard Ratio (Random, 95% CI) | 3.30 [2.76, 3.94] | |
| 2.4 95 to 100 dB‐years | 1 | Hazard Ratio (Random, 95% CI) | 4.60 [3.86, 5.48] | |
| 2.5 More than 100 dB‐years | 1 | Hazard Ratio (Random, 95% CI) | 6.60 [5.56, 7.84] | |
| Outcome or subgroup title | No. of studies | No. of participants | Statistical method | Effect size |
| 1 Hearing loss change at 4kHz / STS Show forest plot | 3 | effect size (Fixed, 95% CI) | 0.17 [‐0.06, 0.40] | |
| 1.1 Lee‐Feldstein | 1 | effect size (Fixed, 95% CI) | 0.29 [‐0.07, 0.66] | |
| 1.2 Hager | 1 | effect size (Fixed, 95% CI) | ‐0.1 [‐0.72, 0.52] | |
| 1.3 Gosztonyi | 1 | effect size (Fixed, 95% CI) | 0.15 [‐0.18, 0.48] | |