Percutaneous vertebroplasty for osteoporotic vertebral compression fracture
Information
- DOI:
- https://doi.org/10.1002/14651858.CD006349.pub4Copy DOI

- Database:
-
- Cochrane Database of Systematic Reviews
- Version published:
-
- 06 November 2018see what's new
- Type:
-
- Intervention
- Stage:
-
- Review
- Cochrane Editorial Group:
-
Cochrane Musculoskeletal Group
- Copyright:
-
- Copyright © 2018 The Cochrane Collaboration. Published by John Wiley & Sons, Ltd.
Article metrics
Altmetric:
Cited by:
Authors
Contributions of authors
For this review update: R Buchbinder, R Johnston and KJ Rischin drafted the review update. R Buchbinder, R Johnston, KJ Rischin, K Golmohammadi, A Jones, J Homik, and D Kallmes conducted the updated search and/or independently selected trials for inclusion and/or extracted the data, and/or performed a 'Risk of bias' assessment and/or assessed the quality of the body of evidence for the main outcomes using the GRADE approach and/or provided critical comment on the manuscript. All authors approved the final manuscript.
Sources of support
Internal sources
-
Monash Department of Clinical Epidemiology, Cabrini Institute and Department of Epidemiology and Preventive Medicine, School of Public Health and Preventive Medicine, Monash University, Australia.
External sources
-
R Buchbinder is supported in part by an Australian National Health and Medical Research Council Practitioner Fellowship, Australia.
Declarations of interest
R Buchbinder was a principal investigator of Buchbinder 2009. D Kallmes was a principal investigator of Kallmes 2009 and Evans 2015.
D Kallmes participated in IDE trial for Benvenue Medical spinal augmentation device. He is a stockholder, Marblehead Medical, LLC, Development of spine augmentation devices. He holds a spinal fusion patent license, unrelated to spinal augmentation/vertebroplasty. R Buchbinder and D Kallmes did not perform risk of bias assessments for their own or any other placebo‐controlled trials included in the review.
Acknowledgements
The original review was supported by grants from the University Hospital Foundation and the Canadian Radiology Foundation. The authors would like to thank Ms Louise Falzon, formerly from the Cochrane Musculoskeletal Group, for designing the search strategies for the review; Ms Tamara Rader, formerly Cochrane Musculoskeletal Group Knowledge Translation Specialist for conducting the electronic database searches in the first version of the review; Dr Mauritz Voormolen and Dr Caroline Klazen who provided additional information from their trials; Dr. Sean Crowther and Dr. Ken Ong for assistance with review of abstracts; and Dr. Kerry Siminoski and Dr. Sumit Majumdar for advice in the early stages of the first version of the review.
The authors of this update would like to thank the authors of the original protocol and previous published version of the review for their contribution: RGW Lambert, SR Majumdar, SS Dhillon, R Owen and K Siminoski.
The authors thank Emil Jesper Hansen from the University of Southern Denmark for providing us with his PhD thesis, which reported the results of the VOPE trial.
Version history
| Published | Title | Stage | Authors | Version |
| 2018 Nov 06 | Percutaneous vertebroplasty for osteoporotic vertebral compression fracture | Review | Rachelle Buchbinder, Renea V Johnston, Kobi J Rischin, Joanne Homik, C Allyson Jones, Kamran Golmohammadi, David F Kallmes | |
| 2018 Apr 04 | Percutaneous vertebroplasty for osteoporotic vertebral compression fracture | Review | Rachelle Buchbinder, Renea V Johnston, Kobi J Rischin, Joanne Homik, C Allyson Jones, Kamran Golmohammadi, David F Kallmes | |
| 2015 Apr 30 | Percutaneous vertebroplasty for osteoporotic vertebral compression fracture | Review | Rachelle Buchbinder, Kamran Golmohammadi, Renea V Johnston, Richard J Owen, Joanne Homik, Allyson Jones, Sukhvinder S Dhillon, David F Kallmes, Robert GW Lambert | |
| 2007 Jan 24 | Percutaneous vertebroplasty for osteoporotic vertebral compression fracture | Protocol | Robert GW Lambert, Kamran Golmohammadi, Sumit R Majumdar, Allyson Jones, Rachelle Buchbinder, Sukhvinder S Dhillon, Richard Owen, Joanne Homik, David F Kallmes, Kerry Siminoski | |
Differences between protocol and review
For the original review the protocol was extensively updated to conform with updated conduct and reporting standards of systematic reviews as recommended by Cochrane and the MECIR project.
At the time that the protocol was developed, we had planned to include controlled before and after studies (CBAs) and interrupted time series (ITS) in our efficacy analysis if there were no published randomised controlled trials (CTs) or quasi‐RCTs. Subsequent to the publication of the protocol, several RCTs were published and we therefore only included RCTs or quasi‐RCTs in this review.
Subsequent to publication of the protocol, we clarified the possible comparators eligible for inclusion, i.e. that we would include randomised controlled trials of vertebroplasty compared with any comparator, including sham, conservative treatment or other surgical procedures such as kyphoplasty, but would exclude trials that compared vertebroplasty to another type of vertebroplasty.
Differences between first version of the review and current updated version
We removed four trials that were classed as ongoing trials or awaiting classification in the first version of this review (Damaskinos 2015 NCT02489825; Nakstad 2008 NCT00635297; Nieuwenhuijse 2012 NTR3282; Zhao 2014 ChiCTR‐TRC‐14004835), as we subsequently discovered that percutaneous vertebroplasty was given to participants in both treatment arms and thus, when trial results become available, they will not be eligible for inclusion in this review.
We used mean differences for calculating effect sizes on pain scores as this enabled us to combine change with end of treatment scores.
Calculating number needed to treat for an additional beneficial outcome (NNTB), or number needed to treat for an additional harmful outcome (NNTH), an additional person: we had planned to calculate these for outcomes that showed a statistically significant difference between groups. However, in light of any differences we found being small and clinically unimportant, we decided that such statistics were difficult to interpret.
We updated the subgroup analysis based upon data available from the newly published placebo‐controlled trials to compare 'acute' to 'subacute' fractures. Previously we compared pain duration ≤ 6 weeks to > 6 weeks. However all three new placebo‐controlled trials only included participants with 'acute' fractures defined as pain less than 6 weeks in Clark 2016, 8 weeks or less in VOPE 2015, and Firanescu 2018 altered their inclusion criteria from 6 weeks or less to 9 weeks or less after 6 months due to poor recruitment. Both Buchbinder 2009 and Kallmes 2009 performed post‐hoc subgroup analyses comparing data for participants with symptom duration of 6 weeks or less compared to more than 6 weeks.
Keywords
MeSH
Medical Subject Headings (MeSH) Keywords
- Bone Cements [therapeutic use];
- Fractures, Compression [*therapy];
- Glucocorticoids [therapeutic use];
- Osteoporotic Fractures [*therapy];
- Pain Measurement;
- Pain, Postoperative;
- Quality of Life;
- Randomized Controlled Trials as Topic;
- Spinal Fractures [*therapy];
- Vertebroplasty [adverse effects, *methods];
Medical Subject Headings Check Words
Aged; Aged, 80 and over; Female; Humans; Male; Middle Aged;
PICOs

'Risk of bias' summary: review authors' judgements about each risk of bias item for each included study.
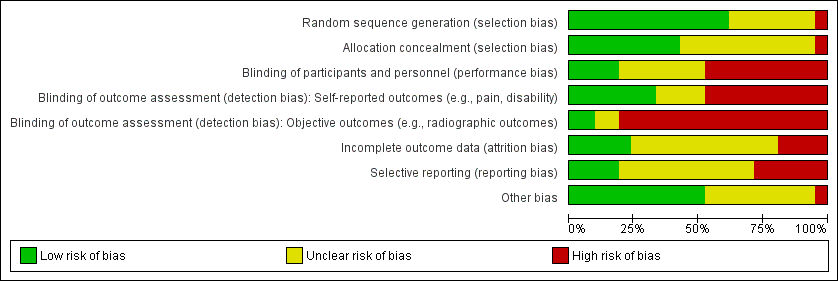
'Risk of bias summary': review authors' judgements about the risk of bias of the available evidence presented as percentages across all included studies.

Comparison 1 Efficacy: Vertebroplasty versus placebo (sham), Outcome 1 Pain (0 to 10 point scale).

Comparison 1 Efficacy: Vertebroplasty versus placebo (sham), Outcome 2 Proportion of participants with pain improved by a clinically relevant amount (>2.5 units or 30% on a 0 or 1 to 10 scale from baseline or less than 4 out of 10.

Comparison 1 Efficacy: Vertebroplasty versus placebo (sham), Outcome 3 Disability (RMDQ).
![Comparison 1 Efficacy: Vertebroplasty versus placebo (sham), Outcome 4 Quality of life (QUALEFFO) [0 to 100].](/cdsr/doi/10.1002/14651858.CD006349.pub4/media/CDSR/CD006349/image_n/nCD006349-CMP-001-04.png)
Comparison 1 Efficacy: Vertebroplasty versus placebo (sham), Outcome 4 Quality of life (QUALEFFO) [0 to 100].

Comparison 1 Efficacy: Vertebroplasty versus placebo (sham), Outcome 5 Treatment success.

Comparison 1 Efficacy: Vertebroplasty versus placebo (sham), Outcome 6 Quality of Life (EQ5D).

Comparison 2 Efficacy: Vertebroplasty versus usual care (open label), Outcome 1 Pain (0 or 1 to 10 point scale).
![Comparison 2 Efficacy: Vertebroplasty versus usual care (open label), Outcome 2 Disability (RMDQ [0 to 24] or ODI [0 to 100]).](/cdsr/doi/10.1002/14651858.CD006349.pub4/media/CDSR/CD006349/image_n/nCD006349-CMP-002-02.png)
Comparison 2 Efficacy: Vertebroplasty versus usual care (open label), Outcome 2 Disability (RMDQ [0 to 24] or ODI [0 to 100]).

Comparison 2 Efficacy: Vertebroplasty versus usual care (open label), Outcome 3 Quality of Life (QUALEFFO).

Comparison 2 Efficacy: Vertebroplasty versus usual care (open label), Outcome 4 Quality of life (EQ5D).

Comparison 2 Efficacy: Vertebroplasty versus usual care (open label), Outcome 5 Treatment success.

Comparison 3 Efficacy: Vertebroplasty versus kyphoplasty (balloon), Outcome 1 Pain (0 to 10 point scale).

Comparison 3 Efficacy: Vertebroplasty versus kyphoplasty (balloon), Outcome 2 Disability (ODI).

Comparison 3 Efficacy: Vertebroplasty versus kyphoplasty (balloon), Outcome 3 Quality of Life (EQ5D).

Comparison 4 Efficacy: Vertebroplasty versus facet joint injection, Outcome 1 Pain (0 to 10 point scale).

Comparison 4 Efficacy: Vertebroplasty versus facet joint injection, Outcome 2 Disability (RMDQ).

Comparison 4 Efficacy: Vertebroplasty versus facet joint injection, Outcome 3 Quality of Life (SF‐36).

Comparison 5 Safety: Vertebroplasty versus placebo (sham) or usual care, Outcome 1 New clinical vertebral fractures.

Comparison 5 Safety: Vertebroplasty versus placebo (sham) or usual care, Outcome 2 New radiographic vertebral fractures.

Comparison 5 Safety: Vertebroplasty versus placebo (sham) or usual care, Outcome 3 Number of serious other adverse events.

Comparison 6 Safety: Vertebroplasty versus kyphoplasty, Outcome 1 New clinical vertebral fractures.

Comparison 6 Safety: Vertebroplasty versus kyphoplasty, Outcome 2 New radiographic vertebral fractures.

Comparison 6 Safety: Vertebroplasty versus kyphoplasty, Outcome 3 Number of serious other adverse events.

Comparison 7 Safety: Vertebroplasty versus facet joint injection, Outcome 1 New radiographic vertebral fractures.

Comparison 8 Subgroup analysis: 'Acute' fractures versus 'subacute' fractures, Outcome 1 Pain at 1 to 2 weeks.

Comparison 8 Subgroup analysis: 'Acute' fractures versus 'subacute' fractures, Outcome 2 Pain at 1 month.

Comparison 8 Subgroup analysis: 'Acute' fractures versus 'subacute' fractures, Outcome 3 Disability at 1 to 2 weeks.

Comparison 8 Subgroup analysis: 'Acute' fractures versus 'subacute' fractures, Outcome 4 Disability at 1 month.

Comparison 8 Subgroup analysis: 'Acute' fractures versus 'subacute' fractures, Outcome 5 Quality of life (EQ‐5D) at 1 month.

Comparison 9 Sensitivity analysis, Outcome 1 Pain at 1 to 2 weeks (0 or 1 to 10 point scale).

Comparison 9 Sensitivity analysis, Outcome 2 Pain at 1 month (0 or 1 to 10 point scale).

Comparison 9 Sensitivity analysis, Outcome 3 Pain at 3 months (0 or 1 to 10 point scale).
![Comparison 9 Sensitivity analysis, Outcome 4 Disability at 1 to 2 weeks (RMDQ [0 to 24] or ODI [0 to 100])).](/cdsr/doi/10.1002/14651858.CD006349.pub4/media/CDSR/CD006349/image_n/nCD006349-CMP-009-04.png)
Comparison 9 Sensitivity analysis, Outcome 4 Disability at 1 to 2 weeks (RMDQ [0 to 24] or ODI [0 to 100])).
![Comparison 9 Sensitivity analysis, Outcome 5 Disability at 1 month (RMDQ [0 to 24] or ODI [0 to 100]).](/cdsr/doi/10.1002/14651858.CD006349.pub4/media/CDSR/CD006349/image_n/nCD006349-CMP-009-05.png)
Comparison 9 Sensitivity analysis, Outcome 5 Disability at 1 month (RMDQ [0 to 24] or ODI [0 to 100]).
![Comparison 9 Sensitivity analysis, Outcome 6 Disability at 3 months (RMDQ [0 to 24] or ODI [0 to 100]).](/cdsr/doi/10.1002/14651858.CD006349.pub4/media/CDSR/CD006349/image_n/nCD006349-CMP-009-06.png)
Comparison 9 Sensitivity analysis, Outcome 6 Disability at 3 months (RMDQ [0 to 24] or ODI [0 to 100]).
| Vertebroplasty for osteoporotic vertebral compression fracture | ||||||
| Patient or population: people with osteoporotic vertebral compression fracture | ||||||
| Outcomes | Illustrative comparative risks* (95% CI) | Relative effect | No of Participants | Quality of the evidence | Comments | |
| Assumed risk | Corresponding risk | |||||
| Placebo1 | Vertebroplasty | |||||
| Pain | The mean pain in the control groups was | The mean pain in the intervention groups was | 535 | ⊕⊕⊕⊕ | Absolute change 7% better (3% better to 12% better); relative change 10% better (4% better to 17% better)3 | |
| Disability (Roland‐Morris Disability Questionnaire) | The mean disability in the control groups was | The mean disability in the intervention groups was | 472 | ⊕⊕⊕⊕ | Absolute change 7% better (2% better to 11% better); relative change 9% better (2% better to 15% better)3 | |
| Disease‐specific quality of Life (QUALEFFO) | The mean quality of life (QUALEFFO) in the control groups was | The mean quality of life in the intervention groups was | 351 | ⊕⊕⊕⊕ | Absolute change 2% better (1% worse to 6% better); relative change 4% better (2% worse to 10% better)3 | |
| Overall quality of Life (EQ5D) | The mean quality of life (EQ‐5D) in the control groups was | The mean quality of life in the intervention groups was | 285 | ⊕⊕⊕⊝ | Absolute change 5% better (1% better to 9% better); relative change 18% improvement (4% better to 32% better)3 | |
| Participant global assessment of success (People perceived their pain as better) Follow‐up: 1 month | 225 per 1000 | 315 per 1000 | RR 1.40 | 78 | ⊕⊕⊕⊝ | Absolute difference 9% more reported success (11% fewer to 29% more); relative change 40% more reported success (33% fewer to 195% more) |
| Incident symptomatic vertebral fractures Follow‐up: 12 ‐24 months | 73 per 1000 | 95 per 1000 (34 to 264) | RR 1.29 | 840 | ⊕⊕⊝⊝ | Absolute difference 3% more fractures with vertebroplasty (8% fewer to 13% more); relative difference 29% more (54% fewer to 262% more) |
| Other serious adverse events | 56 per 1000 | 34 per 1000 | RR 0.61 | 821 | ⊕⊕⊝⊝ | Absolute difference 1% fewer events with vertebroplasty (6% fewer to 4% more); relative change 39% fewer (67% fewer to 10% more) |
| *The basis for the assumed risk (e.g. the median control group risk across studies) is provided in footnotes. The corresponding risk (and its 95% confidence interval) is based on the assumed risk in the comparison group and the relative effect of the intervention (and its 95% CI). | ||||||
| GRADE Working Group grades of evidence | ||||||
| 1 For incident vertebral fractures the comparison includes two placebo (sham)‐controlled trials and three trials that compared vertebroplasty versus usual care. 2 The internal validity of the five placebo‐controlled trials that have full or some results available is high. Four trials have published their results in peer‐reviewed journals (Buchbinder 2009; Clark 2016; Firanescu 2018; Kallmes 2009) while a fifth trial (VOPE 2015), completed in April 2014, was published as a thesis (http://www.forskningsdatabasen.dk/en/catalog/2371744560), and reported at a conference. Therefore we did not downgrade the evidence due to suspected publication bias although the results of one additional placebo‐controlled trial (VERTOS V) remain unpublished. This trial was previously reported as completed in June 2015, but its status has been changed to 'enrolling by invitation', at: https://clinicaltrials.gov/ct2/show/NCT01963039. While publication bias is possible, it is unlikely the conclusions will change when data from this trial become available. 3 Relative changes calculated as absolute change (mean difference) divided by mean at baseline in the placebo group from Buchbinder 2009 (values were: 7.1 points on 0 to 10 point VAS pain; 17.3 points on 0 to 23 point Roland‐Morris Disability questionnaire; 0.28 points on EQ‐5D quality of life scale; 59.6 points on the QUALEFFO scale). 4 Downgraded due to imprecision: the 95% confidence intervals do not exclude a clinically important change (defined as 1.5 points on the 0 to 10 pain scale; 2 to 3 points on the 0 to 23 point RMDQ scale; 0.074 on the 0 to 1 EQ‐5D quality of life scale, and 10 points on the 0 to 100 QUALEFFO scale); or for dichotomous outcomes the total number of participants was small, or number of events was small (<200); or data were from a single trial only 5 Pooled both placebo and usual care comparisons in the safety analyses. 6 Downgraded due to the possibility of detection bias in the studies with a usual care control group. | ||||||
| Trial registration number | Principle Investigator/s and Country | Comparator/s | Main selection criteria | Registration date | Recruitment commenced | Status 8 January 2018 | Planned sample size | Final sample size |
| NCT00749060 ‘OSTEO‐6’ | Laredo JD France | Kyphoplasty; Usual care with or without brace | Age ≥ 50 years Fracture < 6 weeks | 8 Sept 2008 | Dec 2007 | Completed June 2012; results unpublished | 300 | 48 |
| NCT00749086 ‘STIC2’ | Laredo JD France | Kyphoplasty | Age ≥ 50 years Fracture > 6 weeks | 8 Sept 2008 | Dec 2007 | Completed June 2012; results unpublished | 200 | 97 |
| NCT00203554 | Sorensen L Denmark | Usual care | Fracture < 6 months | 16/09/2005 | Mar 2004 | Completed Jan 2008; results unpublished | 27 | 27 |
| ISRCTN14442024 (Also N0213112414) | Dolin, S UK | Usual care | Fracture > 4 weeks | 12 Sep 2003 | Nov 28 2005 | Completed (last updated 6 Feb 2014); results unpublished | Not provided | Not provided |
| NCT01677806 | Sun G China | Usual care | Age ≥ 50 years Fracture < 6 weeks | 23 Aug 2012 | Oct 2012 | Recruitment status unknown (last updated 11 Sep 2014) | 114 | ‐ |
| Registration details not found. | Longo UG Italy | 3 weeks bed rest, rigid hyperextension corset, followed by 2‐3 months in a Cheneau brace (called ‘double‐blind) | Age ≥ 50 years | Trial registration not found | Unknown | Unknown (protocol published) | 200 | ‐ |
| NCT01963039 ‘VERTOS V’ | Carli D the Netherlands | Sham | Age ≥ 50 years Fracture ≥ 12 weeks | 28 Aug 2013 | May 2013 | Previously reported as completed (Nov 2015) then recruiting again (Feb 2017) (protocol published) | 94 | ‐ |
| Record of trial registration not found | Chen JP China | Usual care | Not available | Trial registration not found | Unknown | Completed; study awaiting translation | Unknown | 84 |
| Record of trial registration not found | Li DH China | Kyphoplasty Bone filling mesh container | Not available | Trial registration not found | Unknown | Completed; study awaiting translation | Unknown | 90 |
| Record of trial registration not found | Tan B China | Kyphoplasty | Not available | Trial registration not found | Unknown | Completed; study awaiting translation | Unknown | 106 |
| Record of trial registration not found | Zhou W China | Kyphoplasty | Not available | Trial registration not found | Unknown | Completed; study awaiting translation | Unknown | 80 |
| * Abstract reported that analysis favoured vertebroplasty at 1 day and 1 week for pain, and disability measured by RMDQ and ODI (data not provided), but no evidence of important differences between groups at 1, 3, 6, 12 months for pain, RMDQ, ODI and SF‐36 function and SF‐36 physical and mental component scores. After 12 months follow‐up, there were 13 new fractures in the percutaneous vertebroplasty group and 11 new fractures in the facet joint block group. Abstract did not report method of randomisation, whether or not treatment allocation was concealed and whether or not participants and investigators were blinded to treatment allocation. | ||||||||
| Study | Country | Treatment Groups | Mean age, yrs | Mean symptom duration | Mean (SD) baseline pain (0‐10 scale$) | Mean (SD) baseline RMDQ+ (0‐24 scale†) | Mean (SD) baseline QUALEFFO (0‐100 scale) | Procedures performed by | Mean (range) volume cement injected (mL) | Follow‐up |
| Spain | Vertebroplasty | 71.3 | 140.3 days | 7.2 (0.3) | ‐ | 65.2 (2.2) | Interventional radiologists | Not specified | 2 weeks, 2, 6, 12 months | |
| Usual care | 71.3 | 143.1 days | 6.3 (0.4) | ‐ | 59.2 (2.2) | |||||
| Australia | Vertebroplasty | 74.2 | 9 weeks^ | 7.4 (2.1) | 17.3 (2.8) | 56.9 (13.4) | Interventional radiologists | 2.8 (1.2 ‐ 5.5) | 1 week, 1, 3, 6, 12, 24 months | |
| Placebo | 78.9 | 9.5 weeks^ | 7.1 (2.3) | 17.3 (2.9) | 59.6 (17.1) | |||||
| Australia | Vertebroplasty | 80 | 2.8 weeks | 8.1 (1.8) | 19.5 (3.5) | 65.4 (11.4) | Interventional radiologists | 7.5 (4.7 ‐ 10.3) | 3 days, 14 days, 1, 3 and 6 months | |
| Placebo | 81 | 2.4 weeks | 8.2 (1.5) | 19.8 (3.7) | 67.7 (11.2) | |||||
| China | Vertebroplasty | 64.6 | 31 weeks | 6.5 (0.9)& | 18.6 (1.8)#& | ‐ | Orthopaedic surgeons | 3.6 (3 ‐ 6) | 1 day, 1 week, 1, 3, 6, 12 months | |
| Usual care and brace | 66.5 | 29.5 weeks | 6.4 (0.9)& | 16.7 (1.3)#& | ‐ | |||||
| USA and Canada | Vertebroplasty | 75.7 | ‐¤ | ˜7.6µ | ‐ | ‐ | Interventional radiologists and neuroradiologists, orthopaedic surgeons, neuroradiologists | 4.0 (3.0 to 6.0)¢ | 7 days, 1, 3, 12 and 24 months | |
| Balloon kyphoplasty | 75.5 | ‐¤ | ˜7.6µ | ‐ | ‐ | Not stated | 4.6 (3.4 to 6.0)¢ | |||
| Germany | Vertebroplasty | 71.3 | ‐§ | 7.8 (0.9) | ‐ | ‐ | Orthopaedic surgeon | 3.1 (2 – 4) | Immediately, mean 5.8 months (range: 4 to 7) | |
| Balloon kyphoplasty | 63.3 | ‐§ | 9.0 (0.7) | ‐ | ‐ | Orthopaedic surgeon | 3.9 (3 – 5) | |||
| Shield kyphoplasty | 67.1 | ‐§ | 8.8 (1.5) | ‐ | ‐ | Orthopaedic surgeon | 4.6 (3 – 6) | |||
| USA | Vertebroplasty | 76.1 | ‐ | 7.9 (2.0) | 16.3 (7.4) | ‐ | Not reported | Not reported | 3 days, 1, 6 and 12 months | |
| Kyphoplasty | 75.1 | ‐ | 7.4 (1.9) | 17.3 (6.6) | ‐ | Not reported | Not reported | |||
| Iran | Vertebroplasty | 72 | 27 weeks | 8.4 (1.6) | ‐ | ‐ | Neurosurgeons | 3.5 (1 ‐ 5.5) | 1 week, 2, 6, 12, 24, 36 months | |
| Usual care | 74 | 30 weeks | 7.2 (1.7) | ‐ | ‐ | |||||
| the Netherlands | Vertebroplasty | 74.7 | 29.2 days | 7.7 (1.4) | 18 (4.5) | 68.4 (17.1) | Interventional radiologists | 5.11 (1 ‐ 11) | 1 day, 1 week, 1, 3, 6, 12 months | |
| Placebo | 76.8 | 25.9 days | 7.9 (1.6) | 17.8 (4.7) | 69.7 (17.9) | |||||
| US, UK, Australia | Vertebroplasty | 73.4 | 16 weeks | 6.9 (2.0) | 16.6 (3.8) | ‐ | Interventional radiologists | 2.8 (1 ‐ 5.5)* | 3 days, 2 weeks, 1 month | |
| Placebo | 73.3 | 20 weeks | 7.2 (2.0) | 17.5 (4.1) | ‐ | |||||
| the Netherlands, Belgium | Vertebroplasty | 75.2 | 29.3 days | 7.8 (1.5) | 18.6 (3.6)# | 58.7 (13.5) | Interventional radiologists | 4.1 (1 ‐ 9) | 1 day, 1 week, 1, 3, 6, 12 months | |
| Usual care | 75.4 | 26.8 days | 7.5 (1.6) | 17.2 (4.2)# | 54.7 (14.4) | |||||
| Italy | Vertebroplasty | ‐ | ‐§ | 4.8 (‐) | 53.6 (‐) | ‐ | Not reported | 4 (‐) | 1 and 2 days, 6 weeks, 3 and 6 months | |
| Usual care | ‐ | ‐§ | ‐§ | ‐ | ‐ | Not reported | ||||
| Taiwan | Vertebroplasty | 74.3 | 15.8 days | 7.9 (0.7) | ‐ | ‐ | Not reported | 4.9 (0.7) | 3 days, 6 months, 1, 3 and 5 years | |
| Balloon kyphoplasty | 72.3 | 17.0 days | 8.0 (0.8) | ‐ | ‐ | Not reported | 5.6 (0.6) | |||
| Denmark | Vertebroplasty | 80 | 8.4 days | 7.5 (2.0) | ‐ | ‐ | Orthopaedic surgeons | Not reported | 3 months | |
| Usual care and brace | 80 | 6.7 days | 8.8 (1.2) | ‐ | ‐ | |||||
| China | Vertebroplasty | 65.4 | ‐ | 8.5 (1.1) | 70.6 (8.6)× | ‐ | Not reported | 3.4 (0.3) | 2 days, 12 months | |
| Kyphoplasty | 65.2 | ‐ | 8.2 (0.9) | 71.7(8.5)× | ‐ | Not reported | 4.2 (0.2) | |||
| Germany and USA | Vertebroplasty | 74 | ‐¥ | 8.5 (1.2) | ‐ | ‐ | Not reported | 4.0 (1.1) | 1 day, 3 and 12 months | |
| Shield kyphoplasty | 80 | ‐¥ | 8.3 (1.1) | ‐ | ‐ | Not reported | 3.8 (0.7) | |||
| the Netherlands | Vertebroplasty | 72 | 85 days | 7.1 (5 ‐ 9)+ | 15.7 (8‐24) | 60.0 (37 to 86) | Interventional radiologists | 3.2 (1.0 ‐ 5.0) | 2 weeks | |
| Usual care | 74 | 76 days | 7.6 (5‐10) | 17.8 (8‐22) | 60.7 (38 to 86) | |||||
| Denmark | Vertebroplasty | 70.6 | ‐ª | 7.47 () | ‐ | ‐ | Orthopaedic surgeons | Not reported˜ | 6 hours, weekly to 3 months, 12 months | |
| Placebo (lidocaine injected) | 69.3 | ‐ª | 7.61 () | ‐ | ‐ | Orthopaedic surgeons | ||||
| China | Vertebroplasty | 69.43 | ‐ | 8.1 (1.2) | 71.22 (10.56)× | ‐ | Not reported | 3.31 (0.77) | 1 day, 3 and 12 months | |
| Balloon kyphoplasty | 68.63 | ‐ | 8.0 (1.1) | 71.30 (10.22)× | ‐ | Not reported | 4.22 (1.29) | |||
| China | Vertebroplasty | 63.7 | ‐ª | 7.65 (1.11) | 18.3 (1.0) | ‐ | Spine surgeon | 5.5 (3.0 ‐ 9.0) | ||
| Facet joint injection | 62.6 | ‐ª | 7.76 (1.06) | 18.45 (0.98) | ‐ | Spine surgeon | ||||
| China | Vertebroplasty | 77.1 | Not reported | 7.5 (1.1) | 80.2 (9.9)× | 78.1 (8.1) | Not stated | 4.5 (3‐6.5) | 1 week, 3, 6 and 12 months | |
| Usual care | 76.2 | Not reported | 7.7 (1.1) | 81.5 (9.7)× | 77.5 (8.6) | |||||
| $1‐10 point scale used by Farrokhi 2011, 0 to 100 scale used by VOPE 2015 and we report pain with forward bending for this trial as overall pain not reported and have converted SE to SD; +RMDQ: Roland‐Morris Disability Questionnaire; †modified RMDQ (0‐23 scale) used by Buchbinder 2009, Kallmes 2009 and Firanescu 2018; ×Oswestry Disability Index (0 to 100) used by Leali 2016, Wang 2015, Yang 2016; ^ median duration of symptoms; ¤Not reported but symptom duration 6 months or less; µMean symptom duration reported graphically only; ¢Median and interquartile range;§Not reported but symptom duration 6 weeks or less; ªNot reported but symptom duration 8 weeks or less; &Data only included for the 42/46 in VP group and 43/50 in the usual care group who completed 12‐month follow‐up in groups assigned to at baseline; #Disability significantly higher in the vertebroplasty group; *from n = 20 treated at Mayo (personal communication); ¥Not reported but at least 6 weeks of conservative treatment; +Only range provided; ˜up to 2 mL. | ||||||||||
| Outcome or subgroup title | No. of studies | No. of participants | Statistical method | Effect size |
| 1 Pain (0 to 10 point scale) Show forest plot | 5 | Mean Difference (IV, Random, 95% CI) | Subtotals only | |
| 1.1 1 to 2 weeks | 5 | 539 | Mean Difference (IV, Random, 95% CI) | ‐0.25 [‐0.82, 0.33] |
| 1.2 1 month | 5 | 535 | Mean Difference (IV, Random, 95% CI) | ‐0.73 [‐1.18, ‐0.28] |
| 1.3 3 months | 4 | 395 | Mean Difference (IV, Random, 95% CI) | ‐0.48 [‐1.01, 0.05] |
| 1.4 6 months | 3 | 338 | Mean Difference (IV, Random, 95% CI) | ‐0.59 [‐1.18, 0.01] |
| 1.5 12 months | 3 | 265 | Mean Difference (IV, Random, 95% CI) | ‐0.42 [‐1.02, 0.18] |
| 1.6 24 months | 1 | 57 | Mean Difference (IV, Random, 95% CI) | ‐1.1 [‐2.68, 0.48] |
| 2 Proportion of participants with pain improved by a clinically relevant amount (>2.5 units or 30% on a 0 or 1 to 10 scale from baseline or less than 4 out of 10 Show forest plot | 4 | Risk Ratio (M‐H, Random, 95% CI) | Subtotals only | |
| 2.1 1 to 2 weeks | 2 | 198 | Risk Ratio (M‐H, Random, 95% CI) | 1.43 [0.78, 2.60] |
| 2.2 1 month | 3 | 326 | Risk Ratio (M‐H, Random, 95% CI) | 1.53 [0.99, 2.36] |
| 2.3 3 months | 2 | 198 | Risk Ratio (M‐H, Random, 95% CI) | 1.60 [1.12, 2.30] |
| 2.4 6 months | 2 | 198 | Risk Ratio (M‐H, Random, 95% CI) | 1.38 [1.02, 1.87] |
| 2.5 12 months | 2 | 230 | Risk Ratio (M‐H, Random, 95% CI) | 1.29 [1.06, 1.58] |
| 2.6 24 months | 1 | 78 | Risk Ratio (M‐H, Random, 95% CI) | 1.43 [0.84, 2.42] |
| 3 Disability (RMDQ) Show forest plot | 4 | Mean Difference (IV, Random, 95% CI) | Subtotals only | |
| 3.1 1 to 2 weeks | 4 | 475 | Mean Difference (IV, Random, 95% CI) | 0.21 [‐1.23, 1.65] |
| 3.2 1 month | 4 | 472 | Mean Difference (IV, Random, 95% CI) | ‐1.50 [‐2.61, ‐0.38] |
| 3.3 3 months | 3 | 333 | Mean Difference (IV, Random, 95% CI) | ‐0.81 [‐3.15, 1.52] |
| 3.4 6 months | 3 | 324 | Mean Difference (IV, Random, 95% CI) | ‐1.82 [‐4.12, 0.47] |
| 3.5 12 months | 2 | 200 | Mean Difference (IV, Random, 95% CI) | 0.12 [‐1.56, 1.80] |
| 3.6 24 months | 1 | 43 | Mean Difference (IV, Random, 95% CI) | 0.10 [‐3.67, 3.87] |
| 4 Quality of life (QUALEFFO) [0 to 100] Show forest plot | 3 | Mean Difference (IV, Random, 95% CI) | Subtotals only | |
| 4.1 1 to 2 weeks | 3 | 352 | Mean Difference (IV, Random, 95% CI) | ‐3.10 [‐6.96, 0.75] |
| 4.2 1 month | 3 | 351 | Mean Difference (IV, Random, 95% CI) | ‐2.33 [‐6.06, 1.41] |
| 4.3 3 months | 2 | 244 | Mean Difference (IV, Random, 95% CI) | ‐0.42 [‐4.23, 3.39] |
| 4.4 6 months | 3 | 330 | Mean Difference (IV, Random, 95% CI) | ‐1.88 [‐6.66, 2.91] |
| 4.5 12 months | 2 | 219 | Mean Difference (IV, Random, 95% CI) | ‐1.32 [‐5.41, 2.77] |
| 4.6 24 months | 1 | 57 | Mean Difference (IV, Random, 95% CI) | 1.30 [‐5.48, 8.08] |
| 5 Treatment success Show forest plot | 1 | Risk Ratio (M‐H, Random, 95% CI) | Totals not selected | |
| 5.1 1 week | 1 | Risk Ratio (M‐H, Random, 95% CI) | 0.0 [0.0, 0.0] | |
| 5.2 1 month | 1 | Risk Ratio (M‐H, Random, 95% CI) | 0.0 [0.0, 0.0] | |
| 5.3 3 months | 1 | Risk Ratio (M‐H, Random, 95% CI) | 0.0 [0.0, 0.0] | |
| 5.4 6 months | 1 | Risk Ratio (M‐H, Random, 95% CI) | 0.0 [0.0, 0.0] | |
| 5.5 12 months | 1 | Risk Ratio (M‐H, Random, 95% CI) | 0.0 [0.0, 0.0] | |
| 5.6 24 months | 1 | Risk Ratio (M‐H, Random, 95% CI) | 0.0 [0.0, 0.0] | |
| 6 Quality of Life (EQ5D) Show forest plot | 4 | Mean Difference (IV, Random, 95% CI) | Subtotals only | |
| 6.1 1 to 2 weeks | 2 | 164 | Mean Difference (IV, Random, 95% CI) | 0.01 [‐0.03, 0.05] |
| 6.2 1 month | 3 | 285 | Mean Difference (IV, Random, 95% CI) | 0.05 [0.01, 0.09] |
| 6.3 3 months | 3 | 203 | Mean Difference (IV, Random, 95% CI) | 0.04 [‐0.00, 0.08] |
| 6.4 6 months | 2 | 156 | Mean Difference (IV, Random, 95% CI) | 0.06 [0.01, 0.10] |
| 6.5 12 months | 2 | 93 | Mean Difference (IV, Random, 95% CI) | ‐0.05 [‐0.17, 0.07] |
| 6.6 24 months | 1 | 44 | Mean Difference (IV, Random, 95% CI) | 0.0 [‐0.24, 0.24] |
| Outcome or subgroup title | No. of studies | No. of participants | Statistical method | Effect size |
| 1 Pain (0 or 1 to 10 point scale) Show forest plot | 7 | Std. Mean Difference (IV, Random, 95% CI) | Subtotals only | |
| 1.1 1 to 2 weeks | 6 | 627 | Std. Mean Difference (IV, Random, 95% CI) | ‐1.33 [‐2.26, ‐0.39] |
| 1.2 1 month | 3 | 384 | Std. Mean Difference (IV, Random, 95% CI) | ‐2.06 [‐3.35, ‐0.76] |
| 1.3 2 to 3 months | 6 | 627 | Std. Mean Difference (IV, Random, 95% CI) | ‐1.18 [‐1.95, ‐0.40] |
| 1.4 6 months | 5 | 573 | Std. Mean Difference (IV, Random, 95% CI) | ‐1.05 [‐1.82, ‐0.28] |
| 1.5 12 months | 6 | 612 | Std. Mean Difference (IV, Random, 95% CI) | ‐1.02 [‐1.74, ‐0.30] |
| 1.6 24 months | 1 | 77 | Std. Mean Difference (IV, Random, 95% CI) | ‐0.45 [‐0.90, 0.01] |
| 2 Disability (RMDQ [0 to 24] or ODI [0 to 100]) Show forest plot | 5 | Std. Mean Difference (IV, Random, 95% CI) | Subtotals only | |
| 2.1 1 to 2 weeks | 5 | 494 | Std. Mean Difference (IV, Random, 95% CI) | ‐2.06 [‐3.28, ‐0.83] |
| 2.2 1 month | 3 | 378 | Std. Mean Difference (IV, Random, 95% CI) | ‐1.52 [‐3.00, ‐0.04] |
| 2.3 3 months | 4 | 460 | Std. Mean Difference (IV, Random, 95% CI) | ‐2.76 [‐4.65, ‐0.87] |
| 2.4 6 months | 4 | 461 | Std. Mean Difference (IV, Random, 95% CI) | ‐1.84 [‐3.37, ‐0.30] |
| 2.5 12 months | 4 | 455 | Std. Mean Difference (IV, Random, 95% CI) | ‐1.59 [‐2.79, ‐0.38] |
| 2.6 24 months | 1 | 77 | Std. Mean Difference (IV, Random, 95% CI) | ‐5.65 [‐6.67, ‐4.63] |
| 3 Quality of Life (QUALEFFO) Show forest plot | 4 | Mean Difference (IV, Random, 95% CI) | Subtotals only | |
| 3.1 1 to 2 weeks | 4 | 448 | Mean Difference (IV, Random, 95% CI) | ‐5.67 [‐11.65, 0.32] |
| 3.2 1 month | 2 | 289 | Mean Difference (IV, Random, 95% CI) | ‐10.18 [‐21.49, 1.13] |
| 3.3 2 to 3 months | 3 | 415 | Mean Difference (IV, Random, 95% CI) | ‐5.83 [‐15.41, 3.75] |
| 3.4 6 months | 3 | 415 | Mean Difference (IV, Random, 95% CI) | ‐5.14 [‐15.02, 4.74] |
| 3.5 12 months | 3 | 415 | Mean Difference (IV, Random, 95% CI) | ‐3.40 [‐9.90, 3.11] |
| 4 Quality of life (EQ5D) Show forest plot | 2 | Mean Difference (IV, Random, 95% CI) | Subtotals only | |
| 4.1 1 to 2 weeks | 1 | 183 | Mean Difference (IV, Random, 95% CI) | 0.08 [0.00, 0.15] |
| 4.2 1 month | 1 | 183 | Mean Difference (IV, Random, 95% CI) | 0.09 [0.01, 0.16] |
| 4.3 3 months | 2 | 215 | Mean Difference (IV, Random, 95% CI) | 0.10 [0.00, 0.20] |
| 4.4 6 months | 1 | 183 | Mean Difference (IV, Random, 95% CI) | 0.07 [‐0.02, 0.15] |
| 4.5 12 months | 2 | 215 | Mean Difference (IV, Random, 95% CI) | 0.07 [‐0.00, 0.14] |
| 5 Treatment success Show forest plot | 1 | Risk Ratio (M‐H, Random, 95% CI) | Totals not selected | |
| 5.1 12 months | 1 | Risk Ratio (M‐H, Random, 95% CI) | 0.0 [0.0, 0.0] | |
| Outcome or subgroup title | No. of studies | No. of participants | Statistical method | Effect size |
| 1 Pain (0 to 10 point scale) Show forest plot | 6 | Mean Difference (IV, Random, 95% CI) | Subtotals only | |
| 1.1 1 to 2 weeks | 2 | 462 | Mean Difference (IV, Random, 95% CI) | ‐0.06 [‐0.37, 0.25] |
| 1.2 1 month | 2 | 441 | Mean Difference (IV, Random, 95% CI) | ‐0.05 [‐0.59, 0.48] |
| 1.3 3 months | 2 | 419 | Mean Difference (IV, Random, 95% CI) | 0.14 [‐0.11, 0.39] |
| 1.4 6 months | 3 | 230 | Mean Difference (IV, Random, 95% CI) | ‐0.04 [‐0.31, 0.22] |
| 1.5 12 months | 4 | 558 | Mean Difference (IV, Random, 95% CI) | 0.16 [‐0.07, 0.40] |
| 1.6 24 months | 2 | 320 | Mean Difference (IV, Random, 95% CI) | ‐0.15 [‐0.56, 0.27] |
| 2 Disability (ODI) Show forest plot | 4 | 1758 | Std. Mean Difference (IV, Random, 95% CI) | ‐0.03 [‐0.12, 0.07] |
| 2.1 1 to 2 weeks | 1 | 98 | Std. Mean Difference (IV, Random, 95% CI) | 0.02 [‐0.38, 0.41] |
| 2.2 1 month | 2 | 425 | Std. Mean Difference (IV, Random, 95% CI) | ‐0.11 [‐0.30, 0.08] |
| 2.3 3 months | 2 | 399 | Std. Mean Difference (IV, Random, 95% CI) | 0.04 [‐0.16, 0.24] |
| 2.4 6 months | 1 | 93 | Std. Mean Difference (IV, Random, 95% CI) | ‐0.06 [‐0.46, 0.35] |
| 2.5 12 months | 4 | 542 | Std. Mean Difference (IV, Random, 95% CI) | 0.00 [‐0.16, 0.17] |
| 2.6 24 months | 1 | 201 | Std. Mean Difference (IV, Random, 95% CI) | ‐0.07 [‐0.35, 0.21] |
| 3 Quality of Life (EQ5D) Show forest plot | 2 | 1346 | Std. Mean Difference (IV, Random, 95% CI) | 0.06 [‐0.04, 0.17] |
| 3.1 1 month | 2 | 422 | Std. Mean Difference (IV, Random, 95% CI) | 0.10 [‐0.09, 0.29] |
| 3.2 3 months | 1 | 292 | Std. Mean Difference (IV, Random, 95% CI) | 0.0 [‐0.23, 0.23] |
| 3.3 6 months | 1 | 88 | Std. Mean Difference (IV, Random, 95% CI) | 0.03 [‐0.39, 0.45] |
| 3.4 12 months | 2 | 342 | Std. Mean Difference (IV, Random, 95% CI) | 0.06 [‐0.15, 0.27] |
| 3.5 24 months | 1 | 202 | Std. Mean Difference (IV, Random, 95% CI) | 0.10 [‐0.18, 0.37] |
| Outcome or subgroup title | No. of studies | No. of participants | Statistical method | Effect size |
| 1 Pain (0 to 10 point scale) Show forest plot | 1 | Mean Difference (IV, Random, 95% CI) | Totals not selected | |
| 1.1 1 to 2 weeks | 1 | Mean Difference (IV, Random, 95% CI) | 0.0 [0.0, 0.0] | |
| 1.2 1 month | 1 | Mean Difference (IV, Random, 95% CI) | 0.0 [0.0, 0.0] | |
| 1.3 3 months | 1 | Mean Difference (IV, Random, 95% CI) | 0.0 [0.0, 0.0] | |
| 1.4 6 months | 1 | Mean Difference (IV, Random, 95% CI) | 0.0 [0.0, 0.0] | |
| 1.5 12 months | 1 | Mean Difference (IV, Random, 95% CI) | 0.0 [0.0, 0.0] | |
| 2 Disability (RMDQ) Show forest plot | 1 | Mean Difference (IV, Random, 95% CI) | Totals not selected | |
| 2.1 1 to 2 weeks | 1 | Mean Difference (IV, Random, 95% CI) | 0.0 [0.0, 0.0] | |
| 2.2 1 month | 1 | Mean Difference (IV, Random, 95% CI) | 0.0 [0.0, 0.0] | |
| 2.3 3 months | 1 | Mean Difference (IV, Random, 95% CI) | 0.0 [0.0, 0.0] | |
| 2.4 6 months | 1 | Mean Difference (IV, Random, 95% CI) | 0.0 [0.0, 0.0] | |
| 2.5 12 months | 1 | Mean Difference (IV, Random, 95% CI) | 0.0 [0.0, 0.0] | |
| 3 Quality of Life (SF‐36) Show forest plot | 1 | Mean Difference (IV, Random, 95% CI) | Totals not selected | |
| 3.1 1 month | 1 | Mean Difference (IV, Random, 95% CI) | 0.0 [0.0, 0.0] | |
| 3.2 3 months | 1 | Mean Difference (IV, Random, 95% CI) | 0.0 [0.0, 0.0] | |
| 3.3 6 months | 1 | Mean Difference (IV, Random, 95% CI) | 0.0 [0.0, 0.0] | |
| 3.4 12 months | 1 | Mean Difference (IV, Random, 95% CI) | 0.0 [0.0, 0.0] | |
| Outcome or subgroup title | No. of studies | No. of participants | Statistical method | Effect size |
| 1 New clinical vertebral fractures Show forest plot | 6 | 840 | Risk Ratio (M‐H, Random, 95% CI) | 1.29 [0.46, 3.62] |
| 2 New radiographic vertebral fractures Show forest plot | 8 | 804 | Risk Ratio (M‐H, Random, 95% CI) | 1.14 [0.71, 1.84] |
| 3 Number of serious other adverse events Show forest plot | 5 | 821 | Risk Ratio (M‐H, Random, 95% CI) | 0.61 [0.33, 1.10] |
| Outcome or subgroup title | No. of studies | No. of participants | Statistical method | Effect size |
| 1 New clinical vertebral fractures Show forest plot | 1 | Risk Ratio (M‐H, Random, 95% CI) | Totals not selected | |
| 1.1 24 months | 1 | Risk Ratio (M‐H, Random, 95% CI) | 0.0 [0.0, 0.0] | |
| 2 New radiographic vertebral fractures Show forest plot | 2 | 593 | Risk Ratio (M‐H, Random, 95% CI) | 1.18 [0.97, 1.43] |
| 2.1 12 months | 2 | 372 | Risk Ratio (M‐H, Random, 95% CI) | 0.81 [0.21, 3.16] |
| 2.2 24 months | 1 | 221 | Risk Ratio (M‐H, Random, 95% CI) | 1.17 [0.92, 1.51] |
| 3 Number of serious other adverse events Show forest plot | 2 | Risk Ratio (M‐H, Random, 95% CI) | Subtotals only | |
| 3.1 12 months | 1 | 101 | Risk Ratio (M‐H, Random, 95% CI) | 0.20 [0.01, 4.14] |
| 3.2 24 months | 1 | 221 | Risk Ratio (M‐H, Random, 95% CI) | 0.91 [0.42, 1.97] |
| Outcome or subgroup title | No. of studies | No. of participants | Statistical method | Effect size |
| 1 New radiographic vertebral fractures Show forest plot | 1 | Risk Ratio (M‐H, Random, 95% CI) | Totals not selected | |
| 1.1 12 months | 1 | Risk Ratio (M‐H, Random, 95% CI) | 0.0 [0.0, 0.0] | |
| Outcome or subgroup title | No. of studies | No. of participants | Statistical method | Effect size |
| 1 Pain at 1 to 2 weeks Show forest plot | 5 | Std. Mean Difference (IV, Random, 95% CI) | Subtotals only | |
| 1.1 'Acute' fractures | 5 | 378 | Std. Mean Difference (IV, Random, 95% CI) | ‐0.12 [‐0.38, 0.14] |
| 1.2 'Subacute' fractures | 2 | 157 | Std. Mean Difference (IV, Random, 95% CI) | 0.01 [‐0.30, 0.33] |
| 2 Pain at 1 month Show forest plot | 5 | 535 | Std. Mean Difference (IV, Random, 95% CI) | ‐0.27 [‐0.44, ‐0.10] |
| 2.1 'Acute' fractures | 5 | 378 | Std. Mean Difference (IV, Random, 95% CI) | ‐0.26 [‐0.46, ‐0.05] |
| 2.2 'Subacute' fractures | 2 | 157 | Std. Mean Difference (IV, Random, 95% CI) | ‐0.29 [‐0.61, 0.02] |
| 3 Disability at 1 to 2 weeks Show forest plot | 4 | 467 | Std. Mean Difference (IV, Random, 95% CI) | 0.02 [‐0.16, 0.20] |
| 3.1 'Acute' fractures | 4 | 326 | Std. Mean Difference (IV, Random, 95% CI) | ‐0.03 [‐0.29, 0.22] |
| 3.2 'Subacute' fractures | 2 | 141 | Std. Mean Difference (IV, Random, 95% CI) | 0.13 [‐0.20, 0.46] |
| 4 Disability at 1 month Show forest plot | 4 | Std. Mean Difference (IV, Random, 95% CI) | Subtotals only | |
| 4.1 'Acute' fractures | 4 | 326 | Std. Mean Difference (IV, Random, 95% CI) | ‐0.25 [‐0.47, ‐0.04] |
| 4.2 'Subacute' fractures | 2 | 142 | Std. Mean Difference (IV, Random, 95% CI) | ‐0.14 [‐0.47, 0.19] |
| 5 Quality of life (EQ‐5D) at 1 month Show forest plot | 3 | 281 | Mean Difference (IV, Random, 95% CI) | 0.05 [0.01, 0.08] |
| 5.1 'Acute' fractures | 3 | 139 | Mean Difference (IV, Random, 95% CI) | 0.05 [0.01, 0.09] |
| 5.2 'Subacute' fractures | 2 | 142 | Mean Difference (IV, Random, 95% CI) | 0.04 [‐0.02, 0.10] |
| Outcome or subgroup title | No. of studies | No. of participants | Statistical method | Effect size |
| 1 Pain at 1 to 2 weeks (0 or 1 to 10 point scale) Show forest plot | 11 | 1166 | Std. Mean Difference (IV, Random, 95% CI) | ‐0.76 [‐1.30, ‐0.22] |
| 1.1 Sham (placebo) control | 5 | 539 | Std. Mean Difference (IV, Random, 95% CI) | ‐0.09 [‐0.30, 0.12] |
| 1.2 Usual care (open label) control | 6 | 627 | Std. Mean Difference (IV, Random, 95% CI) | ‐1.33 [‐2.26, ‐0.39] |
| 2 Pain at 1 month (0 or 1 to 10 point scale) Show forest plot | 8 | 919 | Std. Mean Difference (IV, Random, 95% CI) | ‐0.94 [‐1.55, ‐0.34] |
| 2.1 Sham (placebo) control | 5 | 535 | Std. Mean Difference (IV, Random, 95% CI) | ‐0.27 [‐0.44, ‐0.10] |
| 2.2 Usual care (open label) control | 3 | 384 | Std. Mean Difference (IV, Random, 95% CI) | ‐2.06 [‐3.35, ‐0.76] |
| 3 Pain at 3 months (0 or 1 to 10 point scale) Show forest plot | 10 | 1021 | Std. Mean Difference (IV, Random, 95% CI) | ‐0.78 [‐1.28, ‐0.29] |
| 3.1 Sham (placebo) control | 4 | 394 | Std. Mean Difference (IV, Random, 95% CI) | ‐0.20 [‐0.40, ‐0.00] |
| 3.2 Usual care (open label) control | 6 | 627 | Std. Mean Difference (IV, Random, 95% CI) | ‐1.18 [‐1.95, ‐0.40] |
| 4 Disability at 1 to 2 weeks (RMDQ [0 to 24] or ODI [0 to 100])) Show forest plot | 8 | 793 | Std. Mean Difference (IV, Random, 95% CI) | ‐1.25 [‐2.06, ‐0.43] |
| 4.1 Sham (placebo) control | 3 | 299 | Std. Mean Difference (IV, Random, 95% CI) | ‐0.00 [‐0.34, 0.34] |
| 4.2 Usual care (open label) control | 5 | 494 | Std. Mean Difference (IV, Random, 95% CI) | ‐2.06 [‐3.28, ‐0.83] |
| 5 Disability at 1 month (RMDQ [0 to 24] or ODI [0 to 100]) Show forest plot | 6 | 674 | Std. Mean Difference (IV, Random, 95% CI) | ‐0.88 [‐1.60, ‐0.17] |
| 5.1 Sham (placebo) control | 3 | 296 | Std. Mean Difference (IV, Random, 95% CI) | ‐0.27 [‐0.50, ‐0.04] |
| 5.2 Usual care (open label) control | 3 | 378 | Std. Mean Difference (IV, Random, 95% CI) | ‐1.52 [‐3.00, ‐0.04] |
| 6 Disability at 3 months (RMDQ [0 to 24] or ODI [0 to 100]) Show forest plot | 6 | 622 | Std. Mean Difference (IV, Random, 95% CI) | ‐1.85 [‐3.08, ‐0.61] |
| 6.1 Sham (placebo) control | 2 | 162 | Std. Mean Difference (IV, Random, 95% CI) | ‐0.11 [‐0.78, 0.55] |
| 6.2 Usual care (open label) control | 4 | 460 | Std. Mean Difference (IV, Random, 95% CI) | ‐2.76 [‐4.65, ‐0.87] |