Very early versus delayed mobilisation after stroke
Information
- DOI:
- https://doi.org/10.1002/14651858.CD006187.pub3Copy DOI

- Database:
-
- Cochrane Database of Systematic Reviews
- Version published:
-
- 16 October 2018see what's new
- Type:
-
- Intervention
- Stage:
-
- Review
- Cochrane Editorial Group:
-
Cochrane Stroke Group
- Copyright:
-
- Copyright © 2018 The Cochrane Collaboration. Published by John Wiley & Sons, Ltd.
Article metrics
Altmetric:
Cited by:
Authors
Contributions of authors
For this review update, Peter Langhorne co‐ordinated the updated searches, drafted the update, and re‐drafted in response to comments. Peter Langhorne and Trish Bate extracted references. Julie Bernhardt, Janice Collier, Matthew Thuy, and Trish Bate refined the manuscript.
For the original review, Julie Bernhardt drafted the protocol and participated in all stages of the review. Janice Collier and Lynn Legg refined the protocol and contributed to the planned bibliographic searches. Matthew Thuy and Lynn Legg identified studies, assessed methodological quality, and checked the extracted data. Matthew Thuy performed much of the planned bibliographic searches, obtained full‐text articles and made contact with study authors. All review authors commented on drafts of the manuscript.
Sources of support
Internal sources
-
No sources of support supplied
External sources
-
NIHR Priority Review Support Programme, UK.
Declarations of interest
Several of the review authors were trialists in at least one of the included trials. However, we allocated trial selection decisions in a manner that avoided trialists making decisions about their own trials.
Peter Langhorne: PL is trialist in two of the included trials (AVERT III 2015; Langhorne 2010). However, trial selection decisions were allocated in a manner to avoid making decisions about his own trials.
Janice M Collier: JC is trialist in two of the included trials (AVERT II 2008; AVERT III 2015). However, trial selection decisions were allocated in a manner to avoid making decisions about her own trials.
Patricia J Bate: none known
Matthew NT Thuy: none known
Julie Bernhardt: JB is trialists in three of the included trials (AVERT II 2008; AVERT III 2015; Langhorne 2010). However, trial selection decisions were allocated in a manner to avoid making decisions about her own trials.
Acknowledgements
For this update of the review, we acknowledge the support of: Dr Wenwen Zhang (The Florey Institute) for help getting papers, interpreting and translating the Chinese research; Ms Ye Liu and Dr Jue Wang (The Florey Institute) for translating abstracts; Ms Rosemary Morrison for cross‐checking studies identified; Mr Joshua Cheyne (Cochrane Stroke Group information Specialist); Hazel Fraser and the Cochrane Stroke Group; University of Melbourne with full text articles; Dr Karin Diserins and Patrik Michel (Department of Clinical Neurosciences, Centre Hospitalier Universitaire and University of Lausanne, Switzerland), and Antje Sundseth (Akershus Hospital, Norway) for trial information. We are grateful to Jonathan M Fuchs for his consumer review.
For the original version of the review, we acknowledge the following for their support of this review: Dr Jue Wang (The Florey Institute) and Dr Wenwen Zhang (The Florey Institute) for help getting papers, interpreting, and translating the Chinese research; the Austin Health Interpreting and Transcultural Services (Austin Health, Melbourne, Australia) for help with Chinese language interpreting; Ms Li Chun Quang (The Florey Institute) and Ms Kim Ong (The Florey Institute) with technology support; Brenda Thomas (Cochrane Stroke Group Trials Search Co‐ordinator) and Lynsey Smyth (STEP program, University of Glasgow) with searches; Hazel Fraser and the Cochrane Stroke Group, Ms Nancy Guan with Chinese Academic Journals, the Austin Health Sciences Library staff (Austin Health, Melbourne, Australia), Ms Bick‐har Yeung (East Asian Library, University of Melbourne), and the University of Melbourne with full‐text articles; Ms Dianna Sorbello (The Florey Institute) and Ms Mingming Zhang (Chinese Cochrane Center) for general assistance; Dr Dong Junli (Department of Neurology, Yunyang Medical College, Hubei Province, China), Dr William J Peek (International Society of Physical and Rehabilitation Medicine), Mr Werner Van Cleemputte (ISPRM) and Prof Peter Langhorne (Academic Section of Geriatric Medicine, Royal Infirmary, Glasgow, UK) for manuscripts; Dr Stefan Kreisel (Dept of Neurology, University of Heidelberg, Mannheim, Germany), Dr Andrea Di Lauro (U. O. Neurologia, Azienda Ospedaliera S. Sebastiano, Via Palasciano, Caserta, Italy), Prof Valerie Pomeroy (Section of Geriatric Medicine, Division of Clinical Developmental Sciences, St George's University of London, UK), Dr Stefano Paolucci (Fondazione S. Lucia ‐ IRCCS, Rome, Italy) and Dr Michal Katz‐Leurer (Department of Physiotherapy, Tel Aviv University, Ramat Aviv, Israel) for further information on their studies; and Dr Di Lauro and Prof Lorraine Smith (Nursing & Health Care, Faculty of Medicine, University of Glasgow, UK) for expert opinion on identifying unpublished studies.
Version history
| Published | Title | Stage | Authors | Version |
| 2018 Oct 16 | Very early versus delayed mobilisation after stroke | Review | Peter Langhorne, Janice M Collier, Patricia J Bate, Matthew NT Thuy, Julie Bernhardt | |
| 2009 Jan 21 | Very early versus delayed mobilisation after stroke | Review | Julie Bernhardt, Matthew NT Thuy, Janice M Collier, Lynn A Legg | |
| 2006 Oct 18 | Very early versus delayed mobilisation after stroke | Protocol | Julie Bernhardt, Janice M Collier, Lynn Legg | |
Differences between protocol and review
We added, or more explicitly defined, the following secondary outcomes:
-
Death or requiring institutional care: we defined institutional care as care within a residential home, nursing home, or hospital at follow‐up.
-
Type of complication (adverse events): categorised as complications of immobility (deep vein thrombosis (DVT), pulmonary embolism (PE), incidence and grade of pressure sores (using standardized grading scale), chest infection, urinary tract infection, falls), and other complications.
-
'Time to walking unassisted (without help from another person) reported alone or as a component of a functional mobility scale' has been replaced by 'Able to walk (Outcome 1.8) and mobility score (Outcome 1.9)'. This minor change was to allow the inclusion of more trial data.
-
'Length of acute stay in acute hospital (Outcome 1.13)' was added to provide an indicator of resource use.
Search Strategy: the WHO Registry now incorporates the Australian Clinical Trials Registry (ACTR; now the Australian New Zealand Clinical Trials Registry (ANZCTR)), the Netherlands Trial Register, and ISRCTNs data sets.
Network meta‐analysis: we included an exploratory network meta‐analysis in view of the diversity of the included studies.
Keywords
MeSH
Medical Subject Headings (MeSH) Keywords
Medical Subject Headings Check Words
Adult; Humans;
PICOs

Risk of bias summary: review authors' judgements about each risk of bias item for each included study
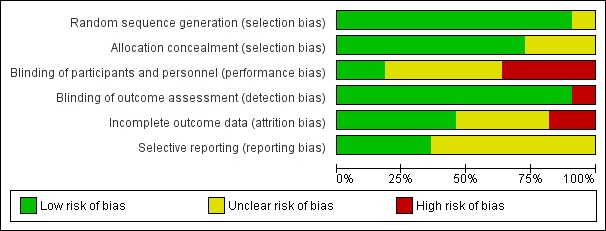
Risk of bias graph: review authors' judgements about each risk of bias item presented as percentages across all included studies

Network plot of all trials. Each point shows the time‐to‐first mobilisation (TTFM) classifications. The lines show the number of trials directly comparing each TTFM category.
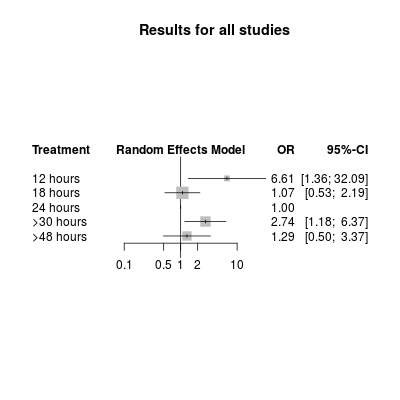
Network meta‐analysis plot for poor outcome (death or dependency at 3 months). The treatment column shows the time‐to‐first mobilisation (TTFM) categories. The results are the odds ratio (95% confidence interval) for the odds of a poor outcome with TTFM of 24 hours as the reference (OR = 1.0).

Network meta‐analysis plot for death at 3 months. The treatment column shows the time‐to‐first mobilisation (TTFM) categories. The results are the odds ratio (95% confidence interval) for the odds of death with TTFM of 24 hours as the reference (OR = 1.0).

Comparison 1 Very early mobilisation (VEM) versus standard care (measured at end of scheduled follow‐up), Outcome 1 Death or poor outcome.

Comparison 1 Very early mobilisation (VEM) versus standard care (measured at end of scheduled follow‐up), Outcome 2 Death.

Comparison 1 Very early mobilisation (VEM) versus standard care (measured at end of scheduled follow‐up), Outcome 3 Death or dependence (modified Rankin score 3 to 6).

Comparison 1 Very early mobilisation (VEM) versus standard care (measured at end of scheduled follow‐up), Outcome 4 Death or institutional care.

Comparison 1 Very early mobilisation (VEM) versus standard care (measured at end of scheduled follow‐up), Outcome 5 Activities of daily living (ADL) score.

Comparison 1 Very early mobilisation (VEM) versus standard care (measured at end of scheduled follow‐up), Outcome 6 Subjective Health Status score.

Comparison 1 Very early mobilisation (VEM) versus standard care (measured at end of scheduled follow‐up), Outcome 7 Able to walk.

Comparison 1 Very early mobilisation (VEM) versus standard care (measured at end of scheduled follow‐up), Outcome 8 Mobility score.

Comparison 1 Very early mobilisation (VEM) versus standard care (measured at end of scheduled follow‐up), Outcome 9 Any complication: participants who experienced at least one complication.

Comparison 1 Very early mobilisation (VEM) versus standard care (measured at end of scheduled follow‐up), Outcome 10 Type of complication: participants who experienced at least one complication.

Comparison 1 Very early mobilisation (VEM) versus standard care (measured at end of scheduled follow‐up), Outcome 11 Mood score.

Comparison 1 Very early mobilisation (VEM) versus standard care (measured at end of scheduled follow‐up), Outcome 12 Length of acute hospital stay (days).

Comparison 2 Very early mobilisation versus standard care (results at 3 months), Outcome 1 Death or poor outcome.

Comparison 2 Very early mobilisation versus standard care (results at 3 months), Outcome 2 Death.

Comparison 2 Very early mobilisation versus standard care (results at 3 months), Outcome 3 Death or dependence (modified Rankin score 3 to 6).

Comparison 2 Very early mobilisation versus standard care (results at 3 months), Outcome 4 Death or institutional care.

Comparison 2 Very early mobilisation versus standard care (results at 3 months), Outcome 5 Activities of daily living (ADL) score.
| Very early mobilisation versus delayed mobilisation | ||||||
| Patient or population: adults with acute stroke Settings: stroke unit or acute ward Intervention: very early mobilisation (VEM) Comparison: delayed mobilisation | ||||||
| Outcomes | Illustrative comparative risks* (95% CI) | Relative effect | No of Participants | Quality of the evidence | Comments | |
| Assumed risk | Corresponding risk | |||||
| Delayed mobilisation | Very early mobilisation | |||||
| Death or a poor outcome (median 3‐month follow‐up) | Medium risk population | OR 1.08 (0.92 to 1.26) | 2542 (8) | ⊕⊕⊕⊝ | Largest trial (2104 participants) found increased risk of death or poor outcome with VEM | |
| 486 per 1000 | 507 per 1000 | |||||
| Death (median 3‐month follow‐up) | Medium risk population | OR 1.27 (0.95 to 1.70) | 2561 (8) | ⊕⊕⊕⊝ | Sensitivity analysis suggested increased risk of death in trials with earlier onset of VEM | |
| 68 per 1000 | 85 per 1000 | |||||
| Death or dependence (modified Rankin score 3 to 6; median 3‐month follow‐up) | Medium risk population | OR 1.08 (0.92 to 1.26) | 2542 (8) | ⊕⊕⊕⊝ | Largest trial found increased risk of death or dependency with VEM | |
| 486 per 1000 | 507 per 1000 | |||||
| Activities of daily living (ADL) (Barthel Index score 0 to 20; lower = 0; median 3‐month follow‐up) | The mean Barthel Index scores across control groups ranged from 14.2 to 18.1. | The mean Barthel Index score in the intervention groups was on average 1.94 points higher (0.75 higher to 3.13 higher). | MD 1.94 higher (0.75 to 3.13 higher) | 2630 (8) | ⊕⊕⊝⊝ | Higher rate of missing data |
| Subjective Health Status score (Assessment of Quality of Life Score 0 to 1; lower = 0; end of scheduled follow‐up) | The mean Assessment of Quality of Life (AQoL) score in the control group was 0.306 | The mean AQoL score in the intervention group was on average 0.07 points higher (0.1 lower to 0.23 higher) | MD 0.07 higher (0.1 lower to 0.23 higher) | 68 (1) | ⊕⊝⊝⊝ | Higher rate of missing data Data from one trial only |
| Any complication: participants who experience at least one complication (median 3‐month follow‐up) | Medium risk population | OR 0.88 (0.73 to 1.06) | 2778 (6) | ⊕⊕⊕⊝ | Uncertain blinding at follow‐up | |
| 224 per 1000 | 200 per 1000 | |||||
| Length of acute hospital stay (days) | The mean length of stay across control groups ranged from 9.8 to 14.9 days. | The mean length of stay in the intervention groups was, on average, 1.44 days less (2.28 days less to 0.60 day less) | MD 1.44 lower (2.28 lower to 0.60 lower) | 2551 (8) | ⊕⊕⊝⊝ | Different definitions and imprecise measures of length of stay were reported Result largely depends on two small trials with small SDs |
| *The basis for the assumed risk (e.g. the mean control group risk across studies) is provided in footnotes. The corresponding risk (and its 95% confidence interval) is based on the assumed risk in the comparison group and the relative effect of the intervention (and its 95% CI). | ||||||
| GRADE Working Group grades of evidence | ||||||
| a Downgraded for potential risk of performance bias. b Downgraded for unexplained heterogeneity. c Downgraded for imprecision. | ||||||
| Trial | Stated aim for mobilisation activity | Participant median age (% male) | Stroke severity (moderate or severe stroke) | Early mobilisation TTFM (hours; median; IQR) | Usual care TTFM (hours; median; IQR) | Average frequency of mobilisation events per day (early vs usual care) | Average amount of mobilisation activity (early vs usual care) |
| Earlier and more | 75 yrs (54%) | 57% | 18.1 (12.8 to 21.5) | 30.8 (23.0 to 39.9) | 2 vs 0 | 167 vs 69 mins/admission mobilisation activity | |
| Earlier and more | 73 yrs (39%) | 45% | 18.5 (12.8 to 22.3) | 22.4 (16.5 to 29.3) | 6.5 vs 3 | 31 vs 10 mins/day mobilisation activity | |
| Earlier and more | 60 yrs (52%) | 68% | 18 (16.6 to 19.8) | 30.5 (29.0 to 35.0) | Not stated | Extra 5 to 30 mins/day out‐of‐bed activity | |
| Earlier and more | 64 yrs (57%) | 44% | 18 (16.6 to 19.8) | 30.5 (29.0 to 35.0) | Not stated | Extra 5 to 30 mins/day out‐of‐bed activity | |
| Earlier and more | 68 yrs (50%) | 28% | 27.3 (26.0 to 29.0) | 32.0 (22.5 to 47.3) | Not stated | More early mobilisation, standing or walking, recorded using activity monitors (P = 0.02) | |
| Earlier | 64 yrs (72%) | < 89% | < 24 | 96 | Not stated | 60 mins/day more early mobilisation group for first 4 days | |
| Earlier and more | 65 yrs (35%) | < 70% | 43 | 72 | 0.54 vs 0.03 | Extra 30 mins/day out‐of‐bed activity | |
| Earlier | 70 yrs (64%) | 44% | 25.9 (22.5 to 29.3) | 71.5 (68.1 to 74.9) | Not stated | 83.7 vs 56.6 mins/day | |
| Earlier | 77 yrs (45%) | 34% | 13.1 (8.5 to 25.6) | 33.3 (26.0 to 39.0) | Not stated | Not stated | |
| IQR: interquartile range | |||||||
| Usual care group TTFM characteristics | Very early mobilisation group TTFM characteristics | ||||
| 12 hours | 18 hours | 24 hours | > 30 hours | > 48 hours | |
| 12 hours | ‐ | ‐ | ‐ | ‐ | ‐ |
| 18 hours | ‐ | ‐ | ‐ | ‐ | ‐ |
| 24 hours | ‐ | AVERT III 2015 (2014 ppts) | ‐ | ‐ | ‐ |
| > 30 hours | Sundseth 2012 (65 ppts) | AVEAVERT II 2008; Chippala 2015a; Chippala 2015b (211 ppts) | Langhorne 2010 (32 ppts) | ‐ | ‐ |
| > 48 hours | SEVEL 2016 167 ppts) | Poletto 2015 (39 ppts) | ‐ | ||
| ppts = participants Table shows Time‐to‐first mobilisation (TTFM) in each trial with the very early mobilisation TTFM group in the columns and usual care TTFM in the rows. The number of trials (participants) in each direct comparison of TTFM are also shown. For example Sundseth 2012 compared TTFM of approximately 12 hours with > 30 hours and included 65 participants. We did not include data from Morreale 2016 in this analysis as we did not have access to dichotomous data on poor outcome or death. | |||||
| TTFM category | TTFM recorded in the trials (median; IQR) | Direct comparison (OR) | Indirect comparison (OR) | Log difference (95% CI) between direct and indirect comparisons | P value of difference between direct and indirect comparisons | Network meta‐analysis (OR and 95% CI) |
| 12 hours | 13 (9 to 26) | NA | 6.62 | NA | NA | 6.61 (1.36 to 32.09) |
| 18 hours | 18 (13 to 21) | 1.17 | 0.80 | ‐0.39 (‐2.09 to 1.31) | 0.65 | 1.07 (0.53 to 2.19) |
| 24 hours | 26 (22 to 29) | 1.00 (reference) | Reference | Reference | Reference | Reference |
| > 30 hours | 32 (26 to 40) | 3.86 | 2.46 | 0.45 (‐1.50 to 2.41) | 0.65 | 2.74 (1.18 to 6.37) |
| > 48 hours | 72 (68 to 75) | 0.94 | 3.03 | ‐1.18 (‐3.33 to 0.98) | 0.28 | 1.29 (0.50 to 3.37) |
| The first two columns show the TTFM category plus the actual recorded TTFM for that category. The next two columns show the odds ratio of a poor outcome for the direct and indirect comparison of the TTFM category, with 24 hours as the reference category. The fifth column shows the log difference, and the sixth shows the P value, between the two odds ratio estimates. The final column shows the network meta‐analysis results, which combine the direct and indirect evidence. CI: confidence interval | ||||||
| TTFM category | TTFM recorded in the trials (median; IQR) | Direct comparison (OR) | Indirect comparison (OR) | Log difference (95% CI) between direct and indirect comparisons | P value of difference between direct and indirect comparisons | Network meta‐analysis (OR and 95% CI) |
| 12 hours | 13 (9 to 26) | NA | 4.18 | NA | NA | 4.17 (0.57 to 30.7) |
| 18 hours | 18 (13 to 21) | 1.25 | 4.35 | 1.25 (‐1.16 to 3.66) | 0.31 | 1.27 (0.92 to 1.76) |
| 24 hours | 26 (22 to 29) | 1.00 (reference) | ‐ | ‐ | ‐ | ‐ |
| > 30 hours | 32 (26 to 40) | 3.19 | 0.82 | 1.36 (‐2.12 to 4.84) | 0.44 | 0.96 (0.32 to 2.92) |
| > 48 hours | 72 (68 to 75) | 1.73 | 0.77 | 0.81 (‐1.99 to 3.62) | 0.57 | 1.41 (0.41 to 4.82) |
| The first two columns show the TTFM category plus the actual recorded TTFM for that category. The next two columns show the odds ratio of a poor outcome for the direct and indirect comparison of the TTFM category, with 24 hours as the reference. The fifth column shows the log difference, and the sixth shows the P value, between the two odds ratio estimates. The final column shows the network meta‐analysis results, which combine the direct and indirect evidence. CI: confidence interval | ||||||
| Intervention TTFM | Comparison TTFM (reference treatment) | No. of studies (participants) with direct comparison evidence | Direct comparison evidence OR (95% CI) | Quality of the evidence (GRADE) for direct comparisons | Direct plus indirect evidence (NMA) OR (95% CI) | Quality of the evidence (GRADE) for NMA |
| Poor outcome | ||||||
| 12 hours | 24 hours | 0 | NA | NA | 6.61 (1.36 to 32.1) | Low a, b |
| 18 hours | 24 hours | 1 (2104) | 1.17 (0.99 to 1.39) | Moderate c | 1.07 (0.53 to 2.19) | Low b, c |
| 30 to 48 hours | 24 hours | 1 (32) | 3.85 (0.86 to 16.7) | Low b, e | 2.74 (1.18 to 6.37) | Low b, e |
| More than 48 hours | 24 hours | 1 (167) | 0.94 (0.42 to 2.08) | Low d, e | 1.29 (0.50 to 3.37) | Low b, e |
| Death | ||||||
| 12 hours | 24 hours | 0 | NA | NA | 4.17 (0.57 to 30.7) | Low a, b |
| 18 hours | 24 hours | 1 (2104) | 1.25 (0.90 to 1.72) | Moderate c | 1.27 (0.92 to 1.76) | Low b, c |
| 30 to 48 hours | 24 hours | 1 (32) | 3.03 (0.12 to 100) | Low b, e | 0.96 (0.32 to 2.92) | Low b, e |
| More than 48 hours | 24 hours | 1 (167) | 1.75 (0.42 to 7.14) | Low b, e | 1.41 (0.41 to 4.82) | Low b, e |
| a Main trial in the loop was small and had missing data b Downgraded for imprecision c Based on a single large trial d Based on single small trial e Uncertain blinding of follow up | ||||||
| Outcome or subgroup title | No. of studies | No. of participants | Statistical method | Effect size |
| 1 Death or poor outcome Show forest plot | 8 | 2542 | Odds Ratio (M‐H, Fixed, 95% CI) | 1.08 [0.92, 1.26] |
| 2 Death Show forest plot | 8 | 2561 | Odds Ratio (M‐H, Fixed, 95% CI) | 1.27 [0.95, 1.70] |
| 3 Death or dependence (modified Rankin score 3 to 6) Show forest plot | 8 | 2542 | Odds Ratio (M‐H, Fixed, 95% CI) | 1.08 [0.92, 1.26] |
| 4 Death or institutional care Show forest plot | 3 | 227 | Odds Ratio (M‐H, Fixed, 95% CI) | 1.05 [0.53, 2.07] |
| 5 Activities of daily living (ADL) score Show forest plot | 9 | 2630 | Mean Difference (IV, Random, 95% CI) | 1.94 [0.75, 3.13] |
| 6 Subjective Health Status score Show forest plot | 1 | 68 | Mean Difference (IV, Random, 95% CI) | 0.07 [‐0.10, 0.23] |
| 7 Able to walk Show forest plot | 4 | 2255 | Odds Ratio (M‐H, Fixed, 95% CI) | 1.00 [0.83, 1.21] |
| 8 Mobility score Show forest plot | 2 | 102 | Std. Mean Difference (IV, Random, 95% CI) | 0.14 [‐0.27, 0.56] |
| 9 Any complication: participants who experienced at least one complication Show forest plot | 7 | 2778 | Odds Ratio (M‐H, Fixed, 95% CI) | 0.88 [0.73, 1.06] |
| 10 Type of complication: participants who experienced at least one complication Show forest plot | 7 | Odds Ratio (M‐H, Fixed, 95% CI) | Subtotals only | |
| 10.1 Complications of immobility | 7 | 2778 | Odds Ratio (M‐H, Fixed, 95% CI) | 0.79 [0.60, 1.03] |
| 10.2 Other complications | 6 | 2435 | Odds Ratio (M‐H, Fixed, 95% CI) | 0.98 [0.78, 1.23] |
| 11 Mood score Show forest plot | 2 | 100 | Std. Mean Difference (IV, Random, 95% CI) | 0.07 [‐0.33, 0.46] |
| 12 Length of acute hospital stay (days) Show forest plot | 8 | 2551 | Mean Difference (IV, Random, 95% CI) | ‐1.44 [‐2.28, ‐0.60] |
| Outcome or subgroup title | No. of studies | No. of participants | Statistical method | Effect size |
| 1 Death or poor outcome Show forest plot | 8 | 2542 | Odds Ratio (M‐H, Fixed, 95% CI) | 1.08 [0.92, 1.26] |
| 2 Death Show forest plot | 8 | 2570 | Odds Ratio (M‐H, Fixed, 95% CI) | 1.27 [0.95, 1.70] |
| 3 Death or dependence (modified Rankin score 3 to 6) Show forest plot | 8 | 2542 | Odds Ratio (M‐H, Fixed, 95% CI) | 1.08 [0.92, 1.26] |
| 4 Death or institutional care Show forest plot | 3 | 227 | Odds Ratio (M‐H, Fixed, 95% CI) | 1.05 [0.53, 2.07] |
| 5 Activities of daily living (ADL) score Show forest plot | 9 | 2634 | Mean Difference (IV, Random, 95% CI) | 0.75 [0.01, 1.49] |