Repetitive task training for improving functional ability after stroke
Information
- DOI:
- https://doi.org/10.1002/14651858.CD006073.pub3Copy DOI

- Database:
-
- Cochrane Database of Systematic Reviews
- Version published:
-
- 14 November 2016see what's new
- Type:
-
- Intervention
- Stage:
-
- Review
- Cochrane Editorial Group:
-
Cochrane Stroke Group
- Copyright:
-
- Copyright © 2016 The Cochrane Collaboration. Published by John Wiley & Sons, Ltd.
Article metrics
Altmetric:
Cited by:
Authors
Contributions of authors
Beverley French co‐ordinated the review process. Beverley French, Lois Thomas, Jacqueline Coupe, Naoimh McMahon, Louise Connell, Michael Leathley, and Joanna Harrison undertook data filtration, extraction, appraisal and analysis. Jacqueline Coupe was responsible for the administration of the review process. Chris Sutton provided statistical expertise. Caroline Watkins undertook critical reading of outputs.
Sources of support
Internal sources
-
NIHR Cochrane Review Incentive Scheme 2015, UK.
£5000
External sources
-
Department of Health Research and Development Health Technology Assessment Programme, UK.
Declarations of interest
Beverley French: none known.
Lois H Thomas: none known.
Jacqueline Coupe: none known.
Naoimh E McMahon: none known.
Louise Connell: none known.
Joanna Harrison: none known.
Christopher J Sutton: none known.
Svetlana Tishkovskaya: none known.
Caroline L Watkins: none known.
Acknowledgements
We acknowledge the support of Hazel Fraser from the Cochrane Stroke Group for her help in the review process. We also thank all of the trial authors who kindly replied to our requests for information. We thank the authors of the original review: Anne Forster, Peter Langhorne, Christopher Price, and Andrew Walker. Finally, we would like to thank the following for their helpful comments on the first draft of the review: Alex Pollock, Joshua Cheyne, Valentina Assi, Jan Mehrholz, Ailie Turton, Brian Stafford, and Matiram Pun.
Version history
| Published | Title | Stage | Authors | Version |
| 2016 Nov 14 | Repetitive task training for improving functional ability after stroke | Review | Beverley French, Lois H Thomas, Jacqueline Coupe, Naoimh E McMahon, Louise Connell, Joanna Harrison, Christopher J Sutton, Svetlana Tishkovskaya, Caroline L Watkins | |
| 2007 Oct 17 | Repetitive task training for improving functional ability after stroke | Review | Beverley French, Lois H Thomas, Michael J Leathley, Christopher J Sutton, Joanna McAdam, Anne Forster, Peter Langhorne, Christopher IM Price, Andrew Walker, Caroline L Watkins, Louise Connell, Jacqueline Coupe, Naoimh McMahon | |
| 2006 Jul 19 | Repetitive task training for improving functional ability after stroke | Protocol | Beverley French, Anne Forster, Peter Langhorne, Michael J Leathley, Joanna McAdam, Christopher IM Price, Christopher J. Sutton, Lois H Thomas, Andrew Walker, Caroline L Watkins | |
Differences between protocol and review
As all the studies in the original review were identified from the Cochrane Stroke Trials Register, we limited searching for this update to the Cochrane Stroke Trials Register and key electronic databases (MEDLINE, Embase, CIHAHL, SPORTSDiscus, AMED, the Cochrane Central Register of Controlled Trials, ClinicalTrials.gov and the World Health Organization International Clinical Trials Registry Platform).
Keywords
MeSH
Medical Subject Headings (MeSH) Keywords
Medical Subject Headings Check Words
Adult; Humans;
PICOs

Study flow diagram (2007 review and update 2016 figures)

'Risk of bias' summary: review authors' judgements about each risk of bias item for each included study.
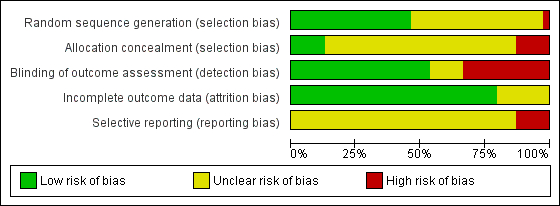
'Risk of bias' graph: review authors' judgements about each risk of bias item presented as percentages across all included studies.

Comparison 1 Upper limb function: post treatment, Outcome 1 Arm function.

Comparison 1 Upper limb function: post treatment, Outcome 2 Hand function.

Comparison 1 Upper limb function: post treatment, Outcome 3 Sitting balance/reach.

Comparison 2 Upper limb function: follow‐up, Outcome 1 All outcomes.

Comparison 3 Upper limb function: subgroup analyses, Outcome 1 Dosage of task practice.

Comparison 3 Upper limb function: subgroup analyses, Outcome 2 Time since stroke.

Comparison 3 Upper limb function: subgroup analyses, Outcome 3 Type of intervention.

Comparison 4 Lower limb function: post treatment, Outcome 1 Walking distance: change from baseline.

Comparison 4 Lower limb function: post treatment, Outcome 2 Walking speed.

Comparison 4 Lower limb function: post treatment, Outcome 3 Functional ambulation.

Comparison 4 Lower limb function: post treatment, Outcome 4 Sit‐to‐stand: post treatment/change from baseline.

Comparison 4 Lower limb function: post treatment, Outcome 5 Lower limb functional measures.

Comparison 4 Lower limb function: post treatment, Outcome 6 Standing balance/reach.

Comparison 5 Lower limb function: follow‐up, Outcome 1 All outcomes.

Comparison 6 Lower limb function: subgroup analyses, Outcome 1 Dosage of task practice.

Comparison 6 Lower limb function: subgroup analyses, Outcome 2 Time since stroke.

Comparison 6 Lower limb function: subgroup analyses, Outcome 3 Type of intervention.

Comparison 7 Secondary outcomes, Outcome 1 Activities of daily living function.

Comparison 7 Secondary outcomes, Outcome 2 Global motor function scales.

Comparison 7 Secondary outcomes, Outcome 3 Quality of life/health status.
| Repetitive task training compared with usual care or attention control for patients with stroke | ||||||
| Patient or population: people with stroke Settings: hospital, clinic or home Intervention: repetitive task training (RTT) Comparison: usual care, attention control or no treatment | ||||||
| Outcomes | Illustrative comparative risks (95% CI) | Relative effect | No of participants | Quality of the evidence | Comments | |
| Assumed risk | Corresponding risk | |||||
| Estimated score / value with control | Absolute reduction in score / value with RTTa | |||||
| Arm function | Arm function score in the repetitive task training groups was on average 0.25 standard deviations (0.01 to 0.49) higher than in the control groups. SD units, measured using different instruments; higher scores mean better arm function. | SMD 0.25, 95% CI 0.01 to 0.49 | 11 studies 749 participants | ⊕⊕⊝⊝ | Downgraded by one level for inconsistency (12 58%). Downgraded by one level for study design (random sequence generation unclear in 4/11 trials and high risk in 1/11 trials in the meta‐analysis; allocation concealment unclear in 7/11 trials and high risk in 1/11 trials). | |
| Hand function | Hand function score in the repetitive task training groups was on average 0.25 standard deviations (0.00 to 0.51) higher than in the control groups. SD units, measured using different instruments; higher scores mean better hand function. | SMD 0.25, 95% CI 0.00 to 0.51 | 8 studies 619 participants | ⊕⊕⊝⊝ | Downgraded by one level for inconsistency (12 54%). Downgraded by one level for study design (random sequence generation unclear in 2/8 trials and high risk in 1/8 trials in the meta‐analysis; allocation concealment unclear in 4/8 trials and high risk in 1/8 trials). | |
| Walking distance: change from baseline | The mean change in walking distance (metres walked in six minutes; a higher score means greater walking distance) in the control groups ranged from ‐1.0 to 118.5. | The mean change in walking distance (metres walked in six minutes; a higher score means greater walking distance) in the repetitive training group ranged from 19 to 221. | MD 34.80, 95% CI 18.19 to 51.41 | 9 studies 610 participants | ⊕⊕⊕⊝ | Downgraded by one level for study design (random sequence generation unclear in 6/9 trials in the meta‐analysis; allocation concealment unclear in 6/9 trials and high risk in 3/9 trials). |
| Walking speed | The mean walking speed in the control groups ranged from | The mean walking speed in the intervention groups ranged from 0.39 to 2.03 metres per second. A higher score means faster walking speed. | SMD 0.39, 95% CI ‐0.02 to 0.79 | 12 studies 685 participants | ⊕⊕⊝⊝ | Downgraded by one level for inconsistency (12 80%). Downgraded by one level for study design (random sequence generation unclear in 7/12 trials in the meta‐analysis; allocation concealment unclear in 9/12 trials and high risk in 3/12 trials). |
| Functional ambulation | Functional ambulation score in the repetitive task training groups was on average 0.35 standard deviations (0.04 to 0.66) higher than in the control groups. SD units, measured using different instruments; higher scores mean better function. | SMD 0.35, 95% CI 0.04 to 0.66 | 8 studies 525 participants | ⊕⊕⊕⊝ | Downgraded by one level for study design (random sequence generation unclear in 4/8 trials in the meta‐analysis; allocation concealment unclear in 7/8 trials and high risk in 1/8 trials). | |
| Lower limb functional measures | Lower limb functional measures in the repetitive task training groups were on average 0.29 standard deviations (0.10 to 0.48) higher than in the control groups. SD units, measured using different instruments; higher scores mean better function. | SMD 0.29, 95% CI 0.10 to 0.48 | 5 studies 419 participants | ⊕⊕⊝⊝ | Downgraded by one level for study design (random sequence generation unclear in 3/5 trials in the meta‐analysis; allocation concealment unclear in 3/5 trials and high risk in 1/5 trials). Downgraded by one level for publication bias; 4 out of 5 are small studies (less than 50 participants). | |
| Global motor function scales | Global motor function in the repetitive task training groups was on average 0.38 standard deviations (0.11 to 0.65) higher than in the control groups. SD units, measured using different instruments; higher scores mean better function. | SMD 0.38, 95% CI 0.11 to 0.65 | 5 studies 222 participants | ⊕⊕⊕⊝ | Downgraded by one level for study design (random sequence generation unclear in 4/5 trials in the meta‐analysis; allocation concealment unclear in 4/5 trials and high risk in 1/5 trials). | |
| Adverse events | Barreca 2004: 3/25 (12%) falls in the intervention group versus 4/23 (17.4%) in the control group, OR 0.65, 95% CI 0.13 to 3.27. Holmgren 2010: 11 participants in total fell during study (32%), five in the intervention group and six in the attention control group. van de Port 2012: 29 falls reported in the circuit training group and 26 in the usual physiotherapy group (P = 0.93). Two serious adverse events were reported in the circuit training group: one participant fell and consulted a GP and one patient experienced arrhythmias during one session. Winstein 2016: 168 serious adverse events involving 109 participants. The most common were hospitalisation (n = 143, 25% of randomised participants) and recurrent stroke (n = 42, 9% of randomised participants). Adverse events were not presented by trial arm. Salbach 2004: intervention‐related reasons for withdrawal that could be interpreted as adverse events included one participant out of 47 in a mobility training group who experienced the onset of groin pain. Four participants also fell during the mobility intervention but did not suffer injury and continued to participate in the group. Two falls also occurred during evaluation. Two trials narratively reported no adverse effects (de Sèze 2001; McClellan 2004). | |||||
| a As a rule of thumb, 0.2 SD represents a small difference, 0.5 a moderate, and 0.8 a large difference. CI: confidence interval; MD: mean difference; SMD: standardised mean difference; OR: odds ratio; SD: standard deviation | ||||||
| GRADE Working Group grades of evidence | ||||||
| STUDY | Task practice dose | Time since stroke | Type of intervention | Practice intensity | Allocation conceal | Comparison group | Therapy equivalence | Small trials |
| 1 = 20 hours or less 2 = more than 20 hours | 1 = 1 to 14 days 2 = 15 days to 6 months 3 = more than 6 months | 1 = whole therapy 2 = mixed task 3 = single task | 1 = 1 to 4 weeks or less 2 = more than 4 weeks | A = adequate B = inadequate/unclear | AC = attention control UC = usual care | EQ = equivalent therapy time ADD = additional therapy time | 1 = less than 25 participants 2 = 25 or more participants | |
| Not reported | 2 | 1 | 1 | A | UC | EQ | 2 | |
| Not reported | 3 | 2 | 1 | B | UC | ADD | 2 | |
| 1 | 2 | 1 | 2 | B | AC | ADD | 2 | |
| 1 | 2 | 2 | 1 | B | AC | EQ | 2 | |
| 1 | 3 | 3 | 1 | B | AC | EQ | 1 | |
| 1 | 3 | 2 | 1 | B | AC | EQ | 1 | |
| 1 | 2 | 3 | 1 | B | AC | EQ | 1 | |
| 1 | 2 | 3 | 1 | B | UC | EQ | 2 | |
| 1 | 2 | 2 | 2 | B | UC | ADD | 1 | |
| 1 | 3 | 2 | 2 | B | AC | EQ | 2 | |
| 2 | 2 | 2 | 2 | A | UC | ADD | 2 | |
| 1 | 2 | 3 | 1 | A | UC | ADD | 2 | |
| 1 | 3 | 2 | 1 | B | UC | ADD | 1 | |
| 1 | 3 | 2 | 1 | B | UC | ADD | 2 | |
| 2 | 2 | 2 | 1 | B | UC | ADD | 1 | |
| 2 | 1 | 2 | 2 | B | AC | EQ | 2 | |
| 1 | 1 | 1 | 1 | B | UC | EQ | 2 | |
| 1 | 1 | 2 | 1 | B | UC | EQ | 2 | |
| 2 | 3 | 2 | 2 | B | AC | EQ | 2 | |
| 1 | 3 | 2 | 1 | B | AC | EQ | 2 | |
| 2 | 3 | 2 | 2 | B | UC | EQ | 2 | |
| 1 | 3 | 2 | 1 | B | UC | ADD | 2 | |
| 2 | 1 | 2 | 1 | B | UC | ADD | 2 | |
| 2 | 3 | 2 | 2 | A | UC | ADD | 2 | |
| 1 | 3 | 2 | 2 | B | AC | EQ | 2 | |
| 1 | 3 | 2 | 1 | B | UC | ADD | 1 | |
| 1 | 3 | 1 | 1 | B | UC | ADD | 2 | |
| 2 | 2 | 2 | 2 | B | UC | ADD | 1 | |
| 2 | 2 | 2 | 2 | B | UC | ADD | 2 | |
| 1 | 1 | 1 | 1 | B | UC | EQ | 2 | |
| 1 | 1 | 2 | 1 | B | UC | ADD | 2 | |
| 2 | 2 | 2 | 2 | A | UC | EQ | 2 | |
| 2 | 3 | 2 | 1 | B | UC | EQ | 2 |
| Author and year | Global function | Lower limb function | Balance/sit‐to‐stand | Upper limb function | Hand function | ADL function | QOL, health status | Adverse events |
| Action Research Arm Test ‐ gross arm movement | ||||||||
| Number of participants able to stand | Dartmouth COOP | Falls | ||||||
| Blennerhassett 2004; Blennerhassett 2004a; Blennerhassett 2004b | 6 Minute Walk Test; Step Test | Timed Up & Go Test | Motor Assessment Scale ‐ arm | Motor Assessment Scale ‐ hand | ||||
| 10 Metre Walk Speed | Reaching distance | |||||||
| 6 Minute Walk Test; 10 Metre Walk Speed; Step Test | Timed Up & Go Test | |||||||
| 10 Metre Walk Test | Reaching distance | |||||||
| Functional Ambulation Classification | Sitting and Standing Equilibrium Index | Functional Independence Measure | ||||||
| 10 Metre Walk Test Functional Ambulatory Category | ||||||||
| 6 Minute Walk Test | Barthel Index | SF‐36 physical health component | ||||||
| Berg Balance Scale | Barthel Index | |||||||
| Lateral reach ‐ time, sit‐to‐stand ‐ time | ||||||||
| 10 Metre Walk Speed | Berg Balance Scale; Timed Up & Go Test | |||||||
| Stroke Impact Scale ‐ social participation subscale | 10 Metre Walk Test 6 Minute Walk Test | |||||||
| 6 Minute Walk Test | Berg Balance Scale | Korean version of Modified Barthel Index | ||||||
| Functional Ambulation Classification; Walking speed | Action Research Arm Test | Barthel Index | Nottingham Health Profile | |||||
| Motor Assessment Scale | Motor Assessment Scale ‐ walking; Sødring Motor Evaluation Scale ‐ trunk, balance and gait | Motor Assessment Scale ‐ balanced sitting, Motor Assessment Scale ‐ sit‐to‐stand | Motor Assessment Scale ‐ arm | Motor Assessment Scale ‐ hand | Barthel Index | Nottingham Health Profile | ||
| 5 Metre Walk Speed | ||||||||
| Motor Assessment Scale ‐ walking | Functional Reach Test | |||||||
| 6 Minute Walk Test | ||||||||
| 10 Metre Walk Speed | ||||||||
| 10 Metre Walk Speed; 6 Minute Walk Test; Walking ability questionnaire | Activities‐Specific Balance Confidence Scale | |||||||
| Rivermead Mobility Index | ||||||||
| Wolf Motor Function Test (functional score) | Canadian Occupational Performace Measure | |||||||
| 6 Minute Walk Test; 5 Metre Walk Speed | Timed Up and Go Test; Berg Balance Scale | Box & Block Test | 9 Hole Peg Test | Barthel Index | ||||
| Berg Balance Scale | ||||||||
| Southern Motor Group's Motor Assessment ‐ upper extremity | 10 Hole Peg Test | |||||||
| 6 Minute Walk Test; 5 Metre Walk Speed; Stroke Impact Scale ‐ mobility domain | Timed Balance Test | |||||||
| Rivermead Motor Assessment ‐ gross function | Rivermead Motor Assessment ‐ leg and trunk; 6 Minute Walk Test; Motor Assessment Scale ‐ walking, Motor Assessment Scale ‐ leg and truck | Motor Assessment Scale ‐ balanced sitting, Motor Assessment Scale ‐ sit‐to‐stand | Motor Assessment Scale ‐ arm | Motor Assessment Scale ‐ hand | Barthel Index | |||
| Functional Test of the Hemiparetic Upper Extremity | ||||||||
| Log Wolf Motor Function Test | Stroke Impact Scale ‐ hand function | |||||||
| Wolf Motor Function Test |
| Outcome or subgroup title | No. of studies | No. of participants | Statistical method | Effect size |
| 1 Arm function Show forest plot | 11 | 749 | Std. Mean Difference (IV, Random, 95% CI) | 0.25 [0.01, 0.49] |
| 2 Hand function Show forest plot | 8 | 619 | Std. Mean Difference (IV, Random, 95% CI) | 0.25 [0.00, 0.51] |
| 3 Sitting balance/reach Show forest plot | 6 | 222 | Std. Mean Difference (IV, Fixed, 95% CI) | 0.28 [0.01, 0.55] |
| Outcome or subgroup title | No. of studies | No. of participants | Statistical method | Effect size |
| 1 All outcomes Show forest plot | 9 | Std. Mean Difference (IV, Fixed, 95% CI) | Subtotals only | |
| 1.1 Under 6 months post treatment | 3 | 153 | Std. Mean Difference (IV, Fixed, 95% CI) | 0.92 [0.58, 1.26] |
| 1.2 6 to 12 months post treatment | 6 | 412 | Std. Mean Difference (IV, Fixed, 95% CI) | 0.10 [‐0.09, 0.30] |
| Outcome or subgroup title | No. of studies | No. of participants | Statistical method | Effect size |
| 1 Dosage of task practice Show forest plot | 15 | 833 | Std. Mean Difference (IV, Random, 95% CI) | 0.33 [0.11, 0.56] |
| 1.1 0 to 20 hours | 9 | 383 | Std. Mean Difference (IV, Random, 95% CI) | 0.23 [0.00, 0.46] |
| 1.2 More than 20 hours | 6 | 450 | Std. Mean Difference (IV, Random, 95% CI) | 0.38 [‐0.03, 0.80] |
| 2 Time since stroke Show forest plot | 15 | 833 | Std. Mean Difference (IV, Random, 95% CI) | 0.33 [0.11, 0.56] |
| 2.1 0 to 15 days | 4 | 239 | Std. Mean Difference (IV, Random, 95% CI) | 0.21 [‐0.04, 0.47] |
| 2.2 16 days to 6 months | 7 | 421 | Std. Mean Difference (IV, Random, 95% CI) | 0.48 [0.06, 0.91] |
| 2.3 More than 6 months | 4 | 173 | Std. Mean Difference (IV, Random, 95% CI) | 0.24 [‐0.23, 0.72] |
| 3 Type of intervention Show forest plot | 15 | 833 | Std. Mean Difference (IV, Random, 95% CI) | 0.33 [0.11, 0.56] |
| 3.1 Whole therapy | 3 | 240 | Std. Mean Difference (IV, Random, 95% CI) | 0.51 [‐0.18, 1.20] |
| 3.2 Mixed training | 8 | 509 | Std. Mean Difference (IV, Random, 95% CI) | 0.14 [‐0.03, 0.32] |
| 3.3 Single task training | 4 | 84 | Std. Mean Difference (IV, Random, 95% CI) | 0.71 [0.11, 1.30] |
| Outcome or subgroup title | No. of studies | No. of participants | Statistical method | Effect size |
| 1 Walking distance: change from baseline Show forest plot | 9 | 610 | Mean Difference (IV, Random, 95% CI) | 34.80 [18.19, 51.41] |
| 2 Walking speed Show forest plot | 12 | 685 | Std. Mean Difference (IV, Random, 95% CI) | 0.39 [‐0.02, 0.79] |
| 3 Functional ambulation Show forest plot | 8 | 525 | Std. Mean Difference (IV, Random, 95% CI) | 0.35 [0.04, 0.66] |
| 4 Sit‐to‐stand: post treatment/change from baseline Show forest plot | 7 | 346 | Std. Mean Difference (Fixed, 95% CI) | 0.35 [0.13, 0.56] |
| 5 Lower limb functional measures Show forest plot | 5 | 419 | Std. Mean Difference (IV, Fixed, 95% CI) | 0.29 [0.10, 0.48] |
| 6 Standing balance/reach Show forest plot | 9 | 504 | Std. Mean Difference (IV, Fixed, 95% CI) | 0.24 [0.07, 0.42] |
| Outcome or subgroup title | No. of studies | No. of participants | Statistical method | Effect size |
| 1 All outcomes Show forest plot | 12 | Std. Mean Difference (IV, Fixed, 95% CI) | Subtotals only | |
| 1.1 Under 6 months post treatment | 8 | 471 | Std. Mean Difference (IV, Fixed, 95% CI) | 0.34 [0.16, 0.52] |
| 1.2 6 to 12 months post treatment | 6 | 268 | Std. Mean Difference (IV, Fixed, 95% CI) | 0.06 [‐0.18, 0.31] |
| Outcome or subgroup title | No. of studies | No. of participants | Statistical method | Effect size |
| 1 Dosage of task practice Show forest plot | 24 | 1144 | Std. Mean Difference (IV, Random, 95% CI) | 0.32 [0.12, 0.53] |
| 1.1 0 to 20 hours | 16 | 583 | Std. Mean Difference (IV, Random, 95% CI) | 0.39 [0.07, 0.71] |
| 1.2 More than 20 hours | 8 | 561 | Std. Mean Difference (IV, Random, 95% CI) | 0.33 [0.16, 0.50] |
| 2 Time since stroke Show forest plot | 24 | 1144 | Std. Mean Difference (IV, Random, 95% CI) | 0.32 [0.12, 0.53] |
| 2.1 0 to 15 days | 5 | 288 | Std. Mean Difference (IV, Random, 95% CI) | 0.16 [‐0.15, 0.46] |
| 2.2 16 days to 6 months | 9 | 428 | Std. Mean Difference (IV, Random, 95% CI) | 0.52 [‐0.03, 1.07] |
| 2.3 More than 6 months | 10 | 428 | Std. Mean Difference (IV, Random, 95% CI) | 0.41 [0.21, 0.60] |
| 3 Type of intervention Show forest plot | 24 | 1144 | Std. Mean Difference (IV, Random, 95% CI) | 0.32 [0.12, 0.53] |
| 3.1 Whole therapy | 2 | 138 | Std. Mean Difference (IV, Random, 95% CI) | 0.10 [‐0.24, 0.43] |
| 3.2 Mixed training | 17 | 894 | Std. Mean Difference (IV, Random, 95% CI) | 0.42 [0.17, 0.67] |
| 3.3 Single task training | 5 | 112 | Std. Mean Difference (IV, Random, 95% CI) | 0.07 [‐0.42, 0.55] |
| Outcome or subgroup title | No. of studies | No. of participants | Statistical method | Effect size |
| 1 Activities of daily living function Show forest plot | 9 | 527 | Std. Mean Difference (IV, Fixed, 95% CI) | 0.28 [0.10, 0.45] |
| 2 Global motor function scales Show forest plot | 5 | 222 | Std. Mean Difference (IV, Fixed, 95% CI) | 0.38 [0.11, 0.65] |
| 3 Quality of life/health status Show forest plot | 4 | 264 | Std. Mean Difference (IV, Fixed, 95% CI) | 0.28 [0.04, 0.53] |