Pelvic floor muscle training versus no treatment, or inactive control treatments, for urinary incontinence in women
Appendices
Appendix 1. PFMT protocol
| Study ID | VPFMC taught/confirmed | Description | Total VPFMC per day | Duration of programme | Supervision |
| Aksac 2003 | Taught by: Therapist
Confirmed by: Vaginal palpation, while keeping abdominal and buttock muscles relaxed | Number of VPFMC per set: 10 | 30 | 8 weeks | Weekly clinic visits |
| Duration of hold: 5 seconds | |||||
| Duration of rest: 10 seconds | |||||
| Number sets per day: 3 | |||||
| Body position(s): Not reported | |||||
| Type(s) of contraction: Sustained | |||||
| Other exercise(s): Contractions progressed at 2 weeks to 10 seconds hold and 20 seconds rest, home treatment | |||||
| Adherence strategy(s): Not reported Adherence measures: Not reported | |||||
| Beuttenmuller 2010 | Taught by: Physical therapist
Confirmed by: Not reported, but assessed by the evaluator prior to treatment | Number of VPFMC per set: 8 | Not reported | 6 weeks | 20‐minut twice‐weekly clinic visits
* Except during menstruation or due to other complications |
| Duration of hold: 5 seconds | |||||
| Duration of rest: Not reported | |||||
| Number sets per day: Not reported | |||||
| Body position(s): Supine with knee bent, sitting on a chair or gym ball, on all fours, and standing | |||||
| Type(s) of contraction: Submaximal, maximal/long and short contractions | |||||
| Other exercise(s): Proprioceptive exercises such as sitting and hopping around a ball, movements that raise the pelvis (e.g., anteversion, retroversion, lateralisation and circumduction) | |||||
| Adherence strategy(s) : Not reported Adherence measures: Not reported | |||||
| Bidmead 2002 | Taught by: Physical therapist
Confirmed by: Not reported | Number of VPFMC per set: Not reported | Not reported | 14 weeks | Five clinic visits over fourteen week period (weeks 1, 3, 6, 10 and 14) |
| Duration of hold: Not reported | |||||
| Duration of rest: Not reported | |||||
| Number sets per day: Not reported | |||||
| Body position: Not reported | |||||
| Type(s) of contraction: Not reported | |||||
| Other treatment(s): Not reported | |||||
| Adherence strategy(s): None reported
Adherence measure: Treatment diary; compliance with PFM exercices was generally good with three quarters of subject performing the exercises more than 3 times per week
| |||||
| Burgio 1998 | Taught by: Nurse practitioner
Confirmed by: VPFMC confirmed with anorectal biofeedback while keeping abdominal muscles relaxed | Number of VPFMC per set: 15 | 45 | 8 weeks | 4 clinic visits at 2‐week intervals |
| Duration of hold: Based on each patient’s ability and gradually increased across multiple sessions to a maximum of 10 seconds | |||||
| Duration of rest: Based on each patient’s ability | |||||
| Number sets per day: 3 | |||||
| Body position(s) Supine, sitting, standing | |||||
| Type(s) of contraction: Not reported | |||||
| Other treatment(s): Knack and interrupting or slowing urine stream once per day | |||||
| Adherence strategy(s): Not reported Adherence measures: Not reported | |||||
| Burns 1993 | Taught by: Nurse trained in biofeedback techniques
Confirmed by: Biofeedback to teach the subject to relax and contract the pelvic muscles | Number of VPFMC per set: 10 (x 2 sets) | 200 | 8 weeks | Weekly clinic visits
|
| Duration of hold: 10 contractions held for 3 seconds and 10 contractions held for 10 seconds | |||||
| Duration of rest: Not reported | |||||
| Number sets per day: 4 | |||||
| Body position(s): Not reported | |||||
| Type(s) of contraction: Sustained | |||||
| Other treatment(s): Videotape describing exercise protocol for home exercises
Intervention progressed 10 per set to a daily maximum of 200 | |||||
| Adherence strategy(s): Weekly and post treatment 3‐and 6‐month telephone reminder calls for the appointments; weekly home exercise reminder cards mailed between visits Adherence measures: Not reported | |||||
| Bø 1999 | Taught by: Physical therapist
Confirmed by: Vaginal palpation | Number of VPFMC per set: 8‐12 high‐intensity (close to maximal) with 3‐4 fast contractions added at the end of each hold | 36 | 6 months | 45‐minute weekly exercise class
Monthly clinic visit with physical therapist |
| Duration of hold: 6‐8 seconds for the high intensity contractions | |||||
| Duration of rest: 6 seconds | |||||
| Number sets per day: 3 | |||||
| Body position(s): Supine, kneeling, sitting, standing; all with legs apart. Subject used preferred position. | |||||
| Type(s) of contraction: Sustained high‐intensity contractions and quick contractions | |||||
| Other treatment(s): Verbal information on the PFM and lower urinary tract anatomy and physiology and on continence mechanisms
Body awareness, breathing, relaxation exercises and strength training exercises for the back, abdominal and thigh muscles
| |||||
| Adherence strategy(s): Audiotape with verbal guidance for home training Adherence measures: Training diary
| |||||
| Carneiro 2010 | Taught by: Physical therapist
Confirmed by: Vaginal palpation | Number of VPFMC per set: 8‐12 ( 5 sets total) | 50 | 8 weeks | 30‐minute, twice‐weekly clinic visits |
| Duration of hold: 6‐10 seconds | |||||
| Duration of rest: Not reported | |||||
| Number sets per day: Once | |||||
| Body position(s): Sitting, standing | |||||
| Type(s) of contraction: Sustained | |||||
| Other treatment(s): Verbal information about PFM function and visualization of pelvic floor components using anatomical figures
5 minutes of proprioceptive exercises sitting on a 75‐cm diameter therapeutic ball | |||||
| Adherence strategy(s): Not reported
Adherence measures: Not reported | |||||
| Castro 2008
| Taught by: Physical therapist
Confirmed by: Vaginal palpation | Number of VPFMC and duration of hold and rest: ‐ 5 contractions held 10 seconds with 10‐second recovery ‐10 contractions held 5 seconds with 5‐second recovery ‐20 contractions held 2 seconds with 2‐second recovery ‐20 contractions held 1 second with 1‐second recovery ‐5 contractions with cough | 60 | 6 months | 3 group sessions per week |
| Number sets per day: Once, 3 times per week | |||||
| Body position(s): Not reported | |||||
| Type(s) of contraction: Sustained and quick contractions | |||||
| Other treatment(s): Verbal information on the PFM and lower urinary tract anatomy and physiology and on continence mechanisms Warm‐up exercises for the joints and stretching exercises targeting the hip, adductor, hamstring and paravertebral muscles | |||||
| Adherence strategy(s): Not reported Adherence measures: | |||||
| Diokno 2010 | Taught by: Urology nurse
Confirmed by: Not reported | Number of VPFMC per set: 25 (5 short and 20 long contractions) and, when needed, the Knack (sneezing) | 50 | 6‐8 weeks | 1 teaching session
1 follow‐up session after 2 to 4 weeks with a vaginal exam if needed and a written test on new knowledge acquired
|
| Duration of hold: Long contractions held up to 6 seconds | |||||
| Duration of rest: Not reported | |||||
| Number sets per day: 2 | |||||
| Body position(s): Not reported | |||||
| Type(s) of contraction: Short and long contractions | |||||
| Other treatment(s): 2‐hour Microsoft PowerPoint presentation, BMP lecture with printed handouts on the lower urinary tract anatomy, the mechanism of urinary bladder function, and UI
Bladder training tips, if needed Knack, if needed Audiotape for daily use | |||||
| Adherence strategy(s): 2‐4 week follow‐up, including a vaginal examination if needed, measurement of pelvic floor muscle strength and an ability test Adherence measures: Not reported | |||||
| Henalla 1989 | Taught by: Physical therapist
Confirmed by: Vaginal palpation | Number of VPFMC per set: 5 | ˜80 | 12 weeks | Weekly clinic visit |
| Duration of hold: 5 seconds | |||||
| Duration of rest: Not reported | |||||
| Number sets per day: 1 set per hour during the day | |||||
| Body position(s): Not reported | |||||
| Type(s) of contraction: Not reported | |||||
| Other treatment(s): Not reported Adherence strategy(s): Not reported Adherence measure: Not reported | |||||
| Henalla 1990 | Taught by: Physical therapist
Confirmed by: Not reported | Number of VPFMC per set: Not reported | Not reported | 6 weeks | Not reported |
| Duration of hold: Not reported | |||||
| Duration of rest: Not reported | |||||
| Number sets per day: Not reported | |||||
| Body position(s): Not reported | |||||
| Type(s) of contraction: Not reported | |||||
| Other treatment(s): Not reported | |||||
| Adherence strategy(s): Not reported Adherence measures: Not reported | |||||
| Hofbauer 1990 | Taught by: Physical therapist
Confirmed by: Not reported | Number of VPFMC per set: Not reported | ?? | 6 months | 20‐minute twice‐weekly clinic visits
|
| Duration of hold: Not reported | |||||
| Duration of rest: Not reported | |||||
| Number sets per day: Not reported | |||||
| Body position(s): Not reported | |||||
| Type(s) of contraction: Not reported | |||||
| Other treatment(s): Abdominal wall and adductor exercises and home training | |||||
| Adherence strategy(s): Not reported Adherence measures: Not reported | |||||
| Kim 2007 | Taught by: Nurse
Confirmed by: Subjects were trained to exert force only on the PFM but did not give detail on how it was done | During the 12 weeks intervention: Number of VPFMC per set: 10 (x 2 sets) | ˜30 | 12 weeks | Exercise class, twice a week |
| Duration of hold: 10 contractions held 3 seconds and 10 additional contractions held 6‐8 seconds | |||||
| Duration of rest: 10 seconds | |||||
| Number sets per day: twice per week | |||||
| Body position(s): Sitting, Supine and standing positions with the legs apart Type(s) of contraction: Fast and sustained contractions | |||||
| Other treatment(s): Body awareness, breathing, and relaxation exercises. Strength training for the thigh, abdominal, and back muscles (ie: bending the knees, tilting the pelvis backward and forward, lifting the buttocks on the back with the knees bent, raising one leg while lying on the back) Exercises using two types of training balls | |||||
| Adherence strategy(s): Home training reinforced through a pamphlet illustrating PFM and strengthening exercises and a record‐keeping sheet Adherence measures: Measured adherence to exercise treatment | |||||
| During one‐year follow up: Number of VPFMC per set: 13 | |||||
| Sets per day: 2 to 3 sets at least twice a week | |||||
| Kim 2011 | Taught by: Nurse
Confirmed by: Subjects were trained to exert force on just the PFMs, but details on how this was done were lacking | Number of VPFMC per set: 10 fast and 10 sustained contractions | 60 | 12 weeks | 1‐hour, twice‐weekly group sessions |
| Duration of hold: 3 seconds for fast contractions, 6 to 8 seconds for sustained contractions | |||||
| Duration of rest: 5 seconds for fast contractions, 10 seconds for sustained contractions | |||||
| Number sets per day: 3 | |||||
| Body position(s): PFM contractions, without excessively straining the abdomen, performed in supine, sitting, and standing positions with legs apart | |||||
| Type(s) of contraction: Fast and sustained contractions | |||||
| Other treatment(s): Warm‐up and stretching exercises 10 to 15 minutes. Thigh and abdominal muscle strength training exercises between PFM trainings, and weight bearing and ball exercises
Home exercises 2 to 3 sets (PFM +13 other exercises) at least 3 times a week (duration: approximately 30 minutes) | |||||
| Adherence strategy(s): Not reported Adherence measures: Not reported | |||||
| Kim 2011a | Taught by: Nurse
Confirmed by: Subjects were trained to exert force on just the PFMs, but details on how this was done were lacking | Number of VPFMC per set: 10 fast and 10 sustained contractions | 60 | 12 weeks | 1‐hour, twice‐ weekly group sessions |
| Duration of hold: 3 seconds for fast contractions, 6 to 8 seconds for sustained contractions | |||||
| Duration of rest: 5 seconds for fast contractions, 10 seconds for sustained contractions | |||||
| Number sets per day: 3 | |||||
| Body position(s): PFM contraction without excessively straining the abdomen, performed in supine, sitting, and standing positions with legs apart Type(s) of contraction: Fast and sustained contractions | |||||
| Other treatment (s): Warm‐up and stretching exercise for 10 to 15 minutes. Strength training of the thigh and abdominal muscles, back, legs, trunk and use of an exercise ball.
| |||||
| Adherence strategy(s): ?? Adherence measures: Training diary | |||||
| Follow‐up: After the 12 weeks intervention, participants attended a 1‐hour exercise classes once a month for 7 months and continued a home‐based program (2‐3 sets of PFM plus 13 other exercises taught during the intervention) | |||||
| Lagro‐Janssen 1991 | Taught by: General practitioner
Confirmed by: Vaginal palpation | Number of VPFMC per set: 10 | 50 to 100 | 12 weeks | No supervision, the participants received written instructions for home practice |
| Duration of hold: 6 seconds | |||||
| Duration of rest: Not reported | |||||
| Number sets per day: 5 to 10 | |||||
| Body position(s): Not reported | |||||
| Type(s) of contraction: Not reported | |||||
| Other treatment(s): Verbal information on PFMs | |||||
| Adherence strategy(s): Not reported Adherence measures: Patient were asked how many exercises per day they completed and how well they complied with the exercise programme: | |||||
| Miller 1998 | Taught by: Nurse
Confirmed by: Vaginal palpation | Number of VPFMC per set: Not reported | Not reported | One week | No supervision |
| Duration of hold: Not reported | |||||
| Duration of rest: Not reported | |||||
| Number sets per day: Not reported | |||||
| Body position(s): Not reported | |||||
| Type(s) of contraction: Coordination | |||||
| Other treatment(s): Verbal information on PFM physiology and functional properties
Participants were taught to practice the Knack | |||||
| Adherence strategy(s): Not reported Adherence measures: Not reported | |||||
| Pereira 2011 | Taught by: Physical therapist
Confirmed by: Vaginal palpation and instructed not to use compensatory muscles | For Group and individual PFMT intervention Number of VPFMC per set: on average, 100 contractions were performed, | 100 | 6 weeks | Two 1‐hour weekly sessions in clinic |
| Duration of hold: 5‐10 seconds | |||||
| Duration of rest: 10‐20 seconds | |||||
| Number sets per day: Not reported | |||||
| Body position(s): Supine, sitting and standing positions | |||||
| Type(s) of contraction: Phasic and tonic contractions | |||||
| Other treatment(s): Verbal information on the PFM anatomy and continence mechanisms. The degree of difficulty progressed according to the positions adopted, the number of repetitions, and the time of sustained contractions | |||||
| Adherence strategy(s): Not reported Adherence measures: Not reported | |||||
| Sar 2009 | Taught by: Nurse
Confirmed by: Vaginal palpation | Number of VPFMC per set: 30 | 90 | 6 weeks | Weekly telephone call by the nurse |
| Duration of hold: 1‐10 seconds | |||||
| Duration of rest: Same as contraction time | |||||
| Number sets per day: 3 | |||||
| Body position(s): Supine, sitting and standing | |||||
| Type(s) of contraction: quick flicks (1‐2 second contractions), sustained progressive (5‐10 seconds) contractions | |||||
| Other treatment(s): Verbal information on the PFM and lower urinary tract anatomy and physiology and on continence mechanisms
Knack | |||||
| Adherence strategy(s): Weekly telephone call to encourage exercises practice and answer questions Adherence measures: Not reported
| |||||
| Wells 1999 | Taught by: Nurse practitioner
Confirmed by: Able to contract PFM was confirmed through a physical examination | Number of VPFMC per set: 80 | 80 | 5 months | Monthly visits for observation, coaching and encouragement |
| Duration of hold: 10 seconds | |||||
| Duration of rest: 10 seconds | |||||
| Number sets per day: 1 set during the day | |||||
| Body position(s): Not reported | |||||
| Type(s) of contraction: Sustained | |||||
| Other treatment(s): Not reported | |||||
| Adherence strategy(s): Training diary Adherence measures: Not reported | |||||
| Yoon 2003 | Taught by: Nurse
Confirmed by: Weekly surface electromyography biofeedback | Number of VPFMC per set: 30 strength and endurance VPFMC per day (unclear if this is 30 for both combined or 30 per type of exercise; i.e., 60), approximately 15 to 20 minutes per day | Not clear if 30 or 60 | 8 weeks | Weekly clinic visit with nurse |
| Duration of hold: Strength: Burst of intense activity lasting a few seconds. Endurance: 6‐second hold progressed by 1‐second per week to 12 seconds. | |||||
| Duration of rest: Not reported | |||||
| Number sets per day: Not reported | |||||
| Body position(s): Not reported | |||||
| Type(s) of contraction: Strength and endurance | |||||
| Other treatment(s): Not reported | |||||
| Adherence strategy(s): Not reported Adherence measures: Not reported |
* Voluntary pelvic floor muscle contraction (VPFMC)
Appendix 2. Other UI specific quality of life outcomes
| Study ID | Outcome | Measure | Subscale | PFMT | Control | Difference |
| Bø 1999
| Bristol Female Lower Urinary Tract Symptoms (BFLUTS) Questionnaire For analysis, positive findings ('a little', 'somewhat' and 'a lot', or 'a bit of a problem', 'quite a problem' and 'a serious problem') were regrouped and reported as frequencies. Only the lifestyle (28‐31, 33) and sex‐life questions (21‐24) were reported. |
Number and % | Avoiding places and situations | n=25 7 | n=30 10 | RR 0.84, 95% CI (0.37 to 1.88) |
| Interference with social life | n=25 1 | n=30 12 | RR 0.10, 95% CI (0.01 to 0.72) | |||
| Interference with physical activity | n=25 11 | n=30 24 | RR 0.55, 95% CI (0.34 to 0.89) | |||
| Overall interference with life | n=25 14 | n=30 25 | RR 0.67, 95% CI (0.46 to 0.99) | |||
| Unsatisfied if had to spend rest of life as now | n=25 10 | n=30 11 | RR 0.11, 95% CI (0.02 to 0.79) | |||
| Sex‐life spoilt by urinary symptoms | n=20 3 | n=25 13 | RR 0.29, 95% CI (0.10 to 0.87) | |||
| Problem with sex‐life being spoilt | n=20 2 | n=25 13 | RR 0.19, 95% CI (0.05 to 0.76) | |||
| Problem with painful intercourse | n=20 2 | n=25 10 | RR 0.25, 95% CI (0.06 to 1.01) | |||
| Urinary incontinence with intercourse | n=20 2 | n=25 10 | RR 0.25, 95% CI (0.06 to 1.01) | |||
| Social Activity Index
Provides a summation of scores for a visual analogue scale for perception of difficulty participating in 9 specified social situations. A lower score indicates problem is perceived to be greater. | Mean score (SD) | NA | n=25 9.3 (1.0) | n=30 7.9 (2.2) | MD 1.4, 95% CI (0.4 to 2.4) | |
| Diokno 2010 | Sandvik’s Severity Index for Female Urinary Incontinence (3‐point scale) Questions assess the degree of UI: Frequency: 1. How often do you experience urinary leakage? Scale: 1 = less than once a month, 2 = a few times a month, 3 = a few times a week, 4 = every day and/or night. Quantity: 2. How much urine do you lose each time? Scale: 1 = drops, 2 = small splashes, and 3 = more. Note: on the 3‐level severity index, responses to this question are aggregated into drops (1) or more (2). The Severity Index is created by multiplying the result of questions 1 (quantity) and 2 (frequency), resulting in the following index values whereby 1‐2 = slight, 3‐4 = moderate, and 6‐8= severe | Number and % |
| n=23 | n=18 |
|
| Slight | 13 (56.5%) | 5 (22.2%) | RR 2.03, 95% CI (0.89 to 4.65) | |||
| Moderate | 5 (21.7%)
| 7 (38.9%)
| RR 0.78, 95% CI (0.27 to 2.29) | |||
| Severe | 5 (21.7%) | 7 (38.9%) | RR 0.78, 95% CI (0.27 to 2.29) | |||
| Kim 2011a | Urine leakage score This is calculated based on the self‐reported 1‐week urinary diary (score of 0‐4; with 0 = no urine leakage, 1 = less than once a week, 2 = once a week, 3 = two or three times a week, and 4 = every day) | Mean score (SD) | N.A |
n = 59 3.0 (2.0)
| n =61 4.4 (1.6)
|
MD ‐1.4, 95% CI (‐2.1 to ‐0.8) |
NA = Not Applicable
Appendix 3. Other leakage outcomes
| Study ID | Outcome | Measure | PFMT | Control | Difference |
| Bø 1999 | Leakage Index *Perceived frequency of leakage with 7 prespecified types of exertion. Higher score indicates more perceived leakage. | Mean (SD) | n=25 1.9 (0.5) |
n=30 3.1 (0.6) | MD ‐1.2, 95% CI (‐1.5 to ‐0.9) |
| Yoon 2003 | Urinary incontinence score *Sum of scores from 5‐point Likert scales regarding severity of leakage with 18 prespecified activities. | Mean (SD) | n=13 10.8 (6.2) | n=12 14.2 (3.6) | MD ‐3.4, 95% CI (‐7.6 to 0.8) |
Appendix 4. Other pad or paper towel test
| Study ID | Outcome | Measure | PFMT | Control | Difference |
| Aksac 2003 | One‐hour pad test (g) | Median (SD) | n=20 2.1 (0.4) | n=20 28.2 (3.7) | Not estimable |
| Bidmead 2002 | Short pad test, weight change from baseline (g) | Mean (SD) | n=40 ‐9.62 (3.37) | n=20 3.65 (1.17) | MD ‐13.3, 95% CI (‐23.1 to ‐3.4) |
| Diokno 2010 | Cough test (cm) | Mean (SD) | n=23 12.6 (41.6) | n=18 19.6 (48.8) | MD 25.30, 95% CI (‐2.9 to 53.5) |
| Miller 1998 | Paper towel test, wet area (cm2) | Mean (SD) on medium cough | n=13 0.4 (1.04) | n=10 21.2 (44.8) | MD ‐20.8, 95% CI (‐46.5 to 4.9) |
| Mean (SD) on deep cough | n=13 5.4 (15.3) | n=10 26.8 (46.7) | MD ‐21.4, 95% CI (‐50.0 to 7.2) |
Appendix 5. Other non‐specific quality of life outcomes
| Study ID | Outcome | Measure | Subscale | PFMT | Control | Difference |
| Burgio 1998 | Hopkins Symptom Checklist for psychological distress (SCL‐90‐R)
* A 90‐item self‐administered questionnaire with nine clinical subscales aggregated into a total score: the Global Severity Index. A score of 50 is normal. A score of more than 63 is a 'case' on any of the subscales. |
Mean score (SD) | All | n=57 | n= 46 |
|
| Somatization | 51.8 (11.4) | 49.8 (13.0) | MD 2.0, 95% CI (‐2.8 to 6.8) | |||
| Obsessive/compulsive | 53.8 (13.9) | 55.4 (11.0) | MD ‐1.6, 95% CI (‐5.7 to 2.5) | |||
| Interpersonal sensitivity | 49.5 (12.0) | 49.2 (11.3) | MD 0.3, 95% CI (‐4.3 to 4.9) | |||
| Depression | 51.5 (11.5) | 51.4 (11.2) | MD 0.1, 95% CI (‐6.7 to 1.9) | |||
| Anxiety | 46.1 (14.6) | 45.8 (12.9) | MD 0.3, 95% CI (‐6.7 to 1.9) | |||
| Hostility | 44.9 (10.8) | 47.3 (11.2) | MD (‐2.4, 95% CI (‐6.7 to 1.9) | |||
| Phobia | 47.1 (11.2) | 45.1 (8.5) | MD 2.0, 95% CI (‐2.0 to 6.0) | |||
| Paranoia ideation | 45.8 (10.9) | 47.2 (12.0) | MD ‐1.4, 95% CI (‐5.9 to 3.1) | |||
| Psychoticism | 49.2 (11.7) | 49.6 (10.3) | MD ‐0.4, 95% CI (‐4.8 to 4.0) | |||
| Global severity | 50.8 (12.8) | 51.4 (10.9) | MD ‐0.6, 95% CI (5.3 to 4.1) | |||
| Bø 1999 | Quality of Life Scale in Norwegian (QoLS‐N)
* A 16‐item scale used in populations with chronic illness. Uses a 7‐point satisfaction scale per item whereby a higher score indicates a higher quality of life. |
Mean total score (SD) | NA | n=25 90.1 (9.5) | n=30 85.2 (12.1) | MD 4.9, 95% CI (‐1.1 to 10.9) |
*NA = Not Applicable
Appendix 6. PFMT function assessment
|
| PFMT Outcomes and Study ID
| Outcome
| Measure
| PFMT
| Control
| Difference
| ||
| US measurements
| Carneiro 2010 | Transperineal US
Bladder neck mobility (mm) | Mean (SD) | n=25 12.63 (4.35) | n=25 17.53 (4.33) |
MD ‐4.90, 95% CI ‐7.3 to ‐2.5) | ||
| Transperineal US PFM thickness (mm) | Mean (SD) | n=25 12.87 (1.02)
| n=25 10.74 (2.26)
| MD 2.13, 95% CI 0.4 to 3.9) | ||||
| Pressure measurements | Aksac 2003 | Intra‐vaginal (cmH2O) | Median (SD) | n=20 37.5 (8.7)
| n=10 20.0 (3.9)
| Non‐estimable | ||
| Beuttenmuller 2010 | Intra‐vaginal (cmH2O) | Mean (SD) | n=25
Slow twitch 22.74 (5.65)
Fast twitch 32.72 (10.34)
| n=25 Slow twitch 17.70 (5.86) Fast twitch 28.09 (9.89)
| MD 5.04, 95% CI 1.9 to 8.2)
MD 4.63, 95% CI ‐0.03 to 9.3)
| |||
| Bø 1999 | Intra‐vaginal (cmH2O)
| Mean (SD) | 19.2 (10.0) n=25 | 16.4 (9.8) n=30 | MD 2.8, 95% CI ( ‐2.6 to 8.2) | |||
| Pereira 2011 | Intra‐vaginal (cmH2O)
|
Mean (SD) | Group PFMT n=15 37.13 (19.24) | Individual PFMT n=15 38.53 (19.34)
| n=15 11.91 (5.57)
|
MD 25.92, 95% CI 18.45 to 33.0) | ||
| Yoon 2003 | Average pressure, intra‐vaginal (mm Hg) |
| n=13 | n=12 |
| |||
| Mean (SD) | 26.1 (12.5) | 12.2 (5.3) |
MD 13.9, 95% CI (5.8 to 22.0) | |||||
| Peak pressure, intra‐vaginal (mm Hg) | Mean (SD) | 39.7 (20.0) | 19.9 (7.5) | MD 19.8, 95% CI (7.1 to 32.5) | ||||
| Duration of PFM contraction(s) | Mean (SD) | 14.5 (3.0) | 5.9 (1.7) | MD 8.6, 95% CI (6.6 to 10.6) | ||||
| Digital measurements | Aksac 2003 | Intra‐vaginal Number of fingers not stated Scale: 5‐point scale | Median (SD) | n=20 4.8 (0.4)
| n=10 3.3 (0.6)
|
Not estimable | ||
| Beuttenmuller 2010 | Intra‐vaginal 1 finger Scale: Oxford | Mean (SD) | n=25
Slow twitch 3.84 (0.8)
Fast twitch 3.80 (0.65)
| n=25 Slow twitch 2.95 (0.90) Fast twitch 2.86 (0.77)
|
MD 0.45, 95% CI (‐0.02 to 0.92)
MD 0.94, 95% CI 0.6 to 1.3) | |||
| Carneiro 2010 | Intra‐vaginal 2 fingers Scale: Not stated |
Mean (SD) | n=25 3.20 (1.05)
| n=25 2.50 (0.76)
| MD 0.7, 95% CI (0.2 to 1.21) | |||
| Castro 2008 | Intra‐vaginal Number of fingers not stated Scale: Oxford | Mean (SD) | n=26 3.6 (0.71) | n=24 2.3 (1.07) | MD 1.30, 95% CI (0.79, 1.81) | |||
| Diokno 2010 | Intra‐vaginal Number of fingers not stated Scale: Not stated | n=23 | n=18 |
| ||||
| Pressure | Mean (SD) | 4.1 (1.1) | 3.8 (0.9) | MD 0.30 , 95% CI (‐0.3 to 0.9) | ||||
| Displacement | Mean (SD) | 2.3 (1.3) | 2.1 (0.9) | MD 0.20, 95% CI (‐0.5 to 0.9) | ||||
| Duration | Mean (SD) | 7.1 (2.9) | 5.9 (3.1) | MD 1.2, 95% CI (‐0.7 to 3.1) | ||||
| Miller 1998 | Intra‐vaginal Number of fingers not stated Score: 0‐21 | Mean (SD) | n=13 10.4 (4.7) | n=13 11.2 (5.1) | MD ‐1.1, 95% CI (‐5.1 to 2.9) | |||
| Pereira 2011 | Intra‐vaginal 2 fingers Scale: 6‐point modified Oxford scale | Mean (SD) | Group PFMT n=15 3.07 (0.70) | Individual PFMT n=15 2.73 (0.96) | n=15 1.47 (0.52) |
MD 1.43, 95% CI (1.0 to 1.46) | ||
| Wells 1999 | Intra‐vaginal Number of fingers not stated Scale: Pressure and displacement digital score (4‐12) | Mean | 8.8 | 8.2 | Not estimable | |||
| EMG measurements | Burns 1993
| Intra‐vaginal EMG
5 fast contractions | Mean (SD) | n=38 3.0 (3.4) | n=40 3.5 (4.4) | MD ‐0.5, 95% CI (‐2.3 to 1.3) | ||
| Intra‐vaginal EMG 5 sustained contractions | Mean (SD) | n=33 1.8 (2.0) | n=34 2.0 (1.8) | MD ‐0.2, 95% CI (‐1.1 to 0.7) | ||||
| Carneiro 2010 | Intra‐vaginal EMG 3 maximal contractions | Mean (SD) | n=25 13.56 (5.41)
| n=25 8.25 (5.70)
| MD 5.31, 95% CI 2.23 to 8.39) | |||
| Wells 1999 | Intra‐vaginal or intra‐anal EMG 4 sustained and 4 short contractions | Mean | 48.8 | 24.2 | Not estimable | |||

PRISMA study flow diagram.


Comparison 1 PFMT versus no treatment, placebo or control, Outcome 1 Participant perceived cure.
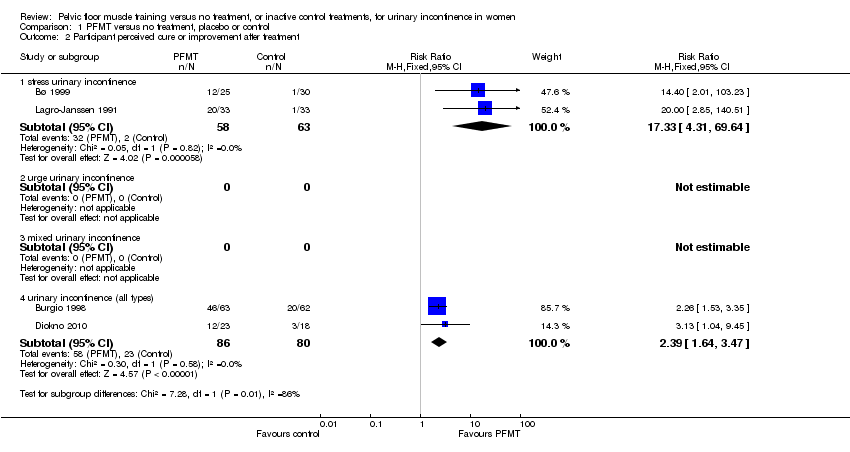
Comparison 1 PFMT versus no treatment, placebo or control, Outcome 2 Participant perceived cure or improvement after treatment.
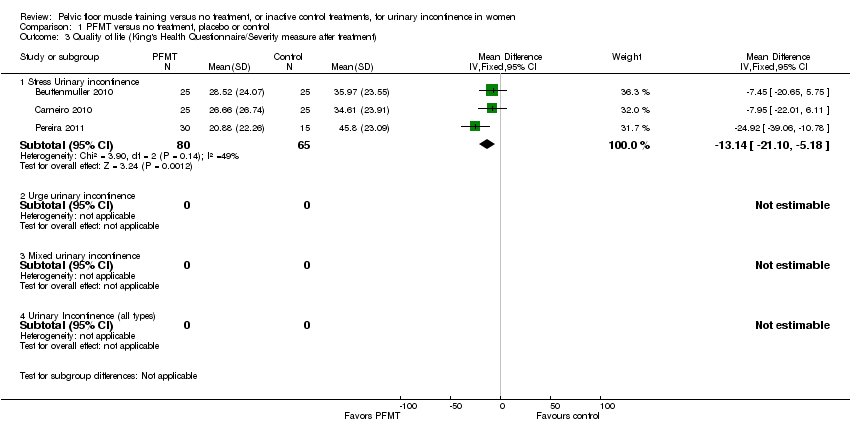
Comparison 1 PFMT versus no treatment, placebo or control, Outcome 3 Quality of life (King's Health Questionnaire/Severity measure after treatment).

Comparison 1 PFMT versus no treatment, placebo or control, Outcome 4 Quality of life (King's Health Questionnaire/Incontinence impact after treatment).

Comparison 1 PFMT versus no treatment, placebo or control, Outcome 5 Quality of life (King's Health Questionnaire/Physical limitation).
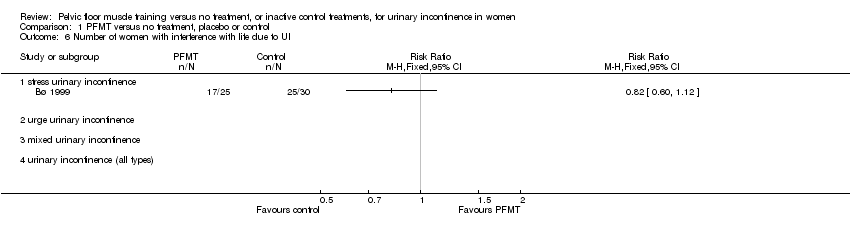
Comparison 1 PFMT versus no treatment, placebo or control, Outcome 6 Number of women with interference with life due to UI.

Comparison 1 PFMT versus no treatment, placebo or control, Outcome 7 I‐QOL.
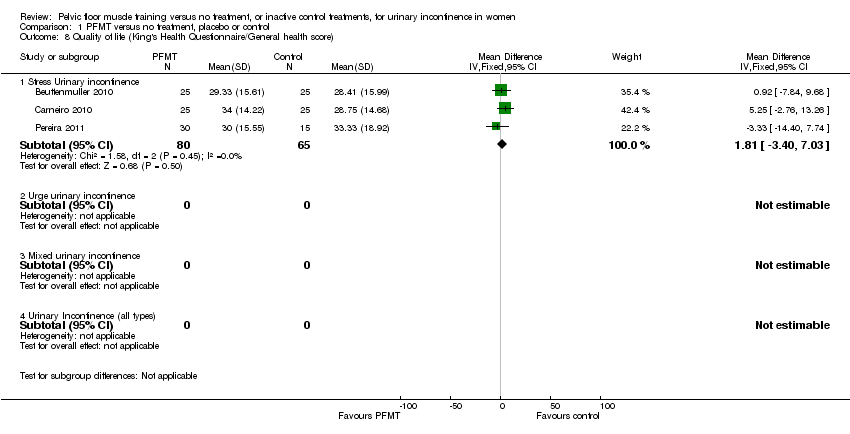
Comparison 1 PFMT versus no treatment, placebo or control, Outcome 8 Quality of life (King's Health Questionnaire/General health score).

Comparison 1 PFMT versus no treatment, placebo or control, Outcome 9 Cure at up to one year.

Comparison 1 PFMT versus no treatment, placebo or control, Outcome 10 Cure or improvement at up to one year.

Comparison 1 PFMT versus no treatment, placebo or control, Outcome 11 Patient perceived satisfaction.

Comparison 1 PFMT versus no treatment, placebo or control, Outcome 12 Number of women needing further treatment.

Comparison 1 PFMT versus no treatment, placebo or control, Outcome 13 Number of leakage episodes in 24 hours.

Comparison 1 PFMT versus no treatment, placebo or control, Outcome 14 Number of voids per day (frequency).
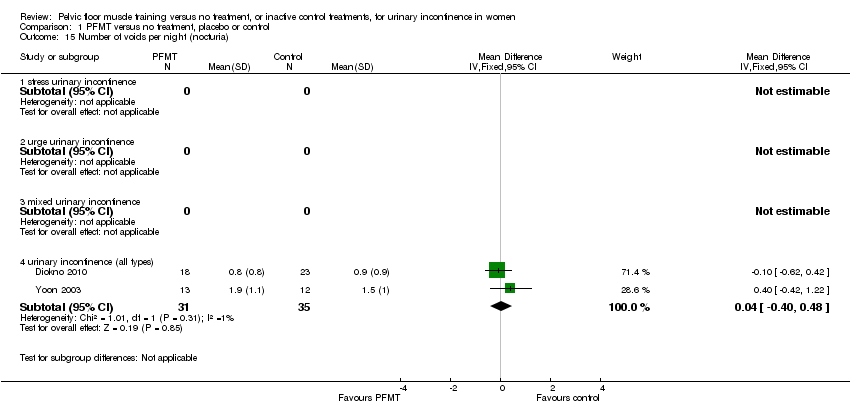
Comparison 1 PFMT versus no treatment, placebo or control, Outcome 15 Number of voids per night (nocturia).

Comparison 1 PFMT versus no treatment, placebo or control, Outcome 16 Short (up to one hour) pad test measured as grams of urine.
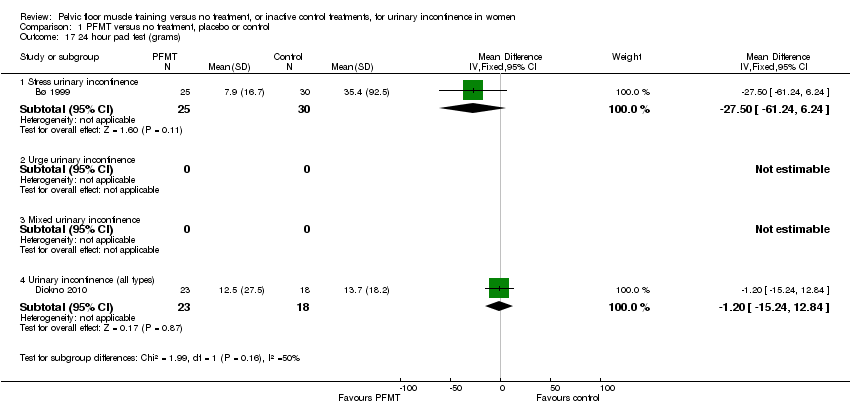
Comparison 1 PFMT versus no treatment, placebo or control, Outcome 17 24 hour pad test (grams).
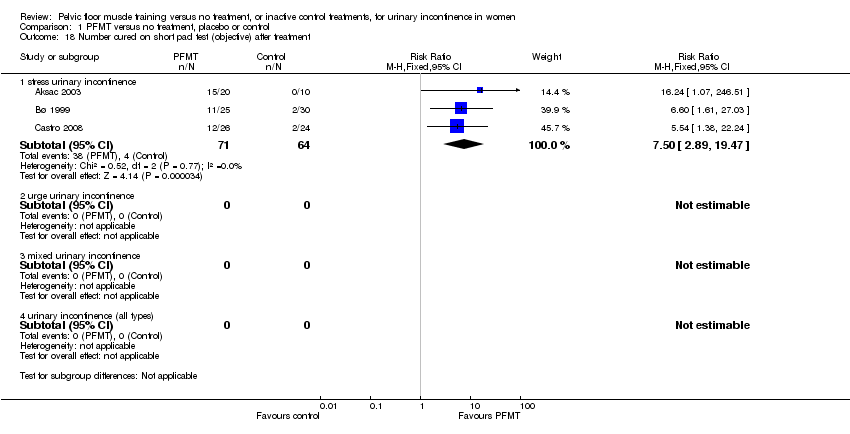
Comparison 1 PFMT versus no treatment, placebo or control, Outcome 18 Number cured on short pad test (objective) after treatment.

Comparison 1 PFMT versus no treatment, placebo or control, Outcome 19 Number cured or improved on short pad test (objective) after treatment.
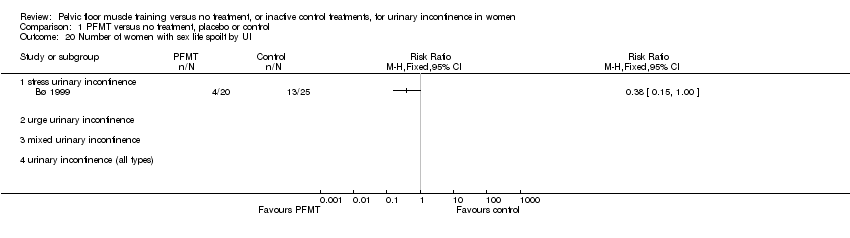
Comparison 1 PFMT versus no treatment, placebo or control, Outcome 20 Number of women with sex life spoilt by UI.

Comparison 1 PFMT versus no treatment, placebo or control, Outcome 21 Number of women with UI during intercourse.
| PFMT versus no treatment, placebo or control for urinary incontinence in women | ||||||
| Patient or population: patients with urinary incontinence in women | ||||||
| Outcomes | Illustrative comparative risks* (95% CI) | Relative effect | No of Participants | Quality of the evidence | Comments | |
| Assumed risk | Corresponding risk | |||||
| Control | PFMT versus no treatment, placebo or control | |||||
| Participant perceived cure ‐ stress urinary incontinence | Study population | RR 8.38 | 165 | ⊕⊕⊕⊕ | ||
| 60 per 1000 | 505 per 1000 | |||||
| Moderate | ||||||
| 62 per 1000 | 520 per 1000 | |||||
| Participant perceived cure or improvement after treatment ‐ stress urinary incontinence | Study population | RR 17 | 121 | ⊕⊕⊕⊝ | ||
| 32 per 1000 | 540 per 1000 | |||||
| Moderate | ||||||
| 32 per 1000 | 544 per 1000 | |||||
| Quality of life (King's Health Questionnaire/Incontinence impact after treatment) ‐ stress urinary incontinence | The mean quality of life (King's health questionnaire/incontinence impact after treatment) ‐ stress urinary incontinence in the intervention groups was | 145 | ⊕⊝⊝⊝ | |||
| Number of leakage episodes in 24 hours ‐ stress urinary incontinence | The mean number of leakage episodes in 24 hours ‐ stress urinary incontinence in the intervention groups was | 253 | ⊕⊕⊕⊝ | |||
| Short (up to one hour) pad test measured as grams of urine ‐ stress urinary incontinence | The mean short (up to one hour) pad test measured as grams of urine ‐ stress urinary incontinence in the intervention groups was | 150 | ⊕⊕⊕⊝ | |||
| Treatment adherence ‐ not reported | See comment | See comment | Not estimable | ‐ | See comment | |
| Formal economic analysis ‐ not reported | See comment | See comment | Not estimable | ‐ | See comment | |
| *The basis for the assumed risk (e.g. the median control group risk across studies) is provided in footnotes. The corresponding risk (and its 95% confidence interval) is based on the assumed risk in the comparison group and the relative effect of the intervention (and its 95% CI). | ||||||
| GRADE Working Group grades of evidence | ||||||
| 1 Not applicable. Fewer than 10 trials. | ||||||
| PFMT versus no treatment, placebo or control for urinary incontinence in women | ||||||
| Patient or population: patients with urinary incontinence in women | ||||||
| Outcomes | Illustrative comparative risks* (95% CI) | Relative effect | No of Participants | Quality of the evidence | Comments | |
| Assumed risk | Corresponding risk | |||||
| Control | PFMT versus no treatment, placebo or control | |||||
| Participant perceived cure ‐ urinary incontinence (all types) | Study population | RR 5.5 | 301 | ⊕⊕⊕⊝ | ||
| 57 per 1000 | 315 per 1000 | |||||
| Moderate | ||||||
| 16 per 1000 | 88 per 1000 | |||||
| Participant perceived cure or improvement after treatment ‐ urinary incontinence (all types) | Study population | RR 2.35 | 166 | ⊕⊕⊕⊝ | ||
| 288 per 1000 | 676 per 1000 | |||||
| Moderate | ||||||
| 245 per 1000 | 576 per 1000 | |||||
| Quality of life (King's Health Questionnaire/Incontinence impact after treatment) ‐ urinary Incontinence (all types) ‐ not reported | See comment | See comment | Not estimable | ‐ | See comment | |
| Number of leakage episodes in 24 hours ‐ urinary incontinence (all types) | The mean number of leakage episodes in 24 hours ‐ urinary incontinence (all types) in the intervention groups was | 125 | ⊕⊕⊕⊝ | |||
| Short (up to one hour) pad test measured as grams of urine ‐ urinary incontinence (all types) | The mean short (up to one hour) pad test measured as grams of urine ‐ urinary incontinence (all types) in the intervention groups was | 25 | ⊕⊕⊝⊝ | |||
| Treatment adherence ‐ not reported | See comment | See comment | Not estimable | ‐ | See comment | |
| Formal economic analysis ‐ not reported | See comment | See comment | Not estimable | ‐ | See comment | |
| *The basis for the assumed risk (e.g. the median control group risk across studies) is provided in footnotes. The corresponding risk (and its 95% confidence interval) is based on the assumed risk in the comparison group and the relative effect of the intervention (and its 95% CI). | ||||||
| GRADE Working Group grades of evidence | ||||||
| 1 Allocation concealment is unclear in Burgio 1998 which is the biggest trial. | ||||||
| Outcome or subgroup title | No. of studies | No. of participants | Statistical method | Effect size |
| 1 Participant perceived cure Show forest plot | 6 | Risk Ratio (M‐H, Fixed, 95% CI) | Subtotals only | |
| 1.1 stress urinary incontinence | 4 | 165 | Risk Ratio (M‐H, Fixed, 95% CI) | 8.38 [3.68, 19.07] |
| 1.2 urge urinary incontinence | 0 | 0 | Risk Ratio (M‐H, Fixed, 95% CI) | 0.0 [0.0, 0.0] |
| 1.3 mixed urinary incontinence | 0 | 0 | Risk Ratio (M‐H, Fixed, 95% CI) | 0.0 [0.0, 0.0] |
| 1.4 urinary incontinence (all types) | 3 | 290 | Risk Ratio (M‐H, Fixed, 95% CI) | 5.34 [2.78, 10.26] |
| 2 Participant perceived cure or improvement after treatment Show forest plot | 4 | Risk Ratio (M‐H, Fixed, 95% CI) | Subtotals only | |
| 2.1 stress urinary incontinence | 2 | 121 | Risk Ratio (M‐H, Fixed, 95% CI) | 17.33 [4.31, 69.64] |
| 2.2 urge urinary incontinence | 0 | 0 | Risk Ratio (M‐H, Fixed, 95% CI) | 0.0 [0.0, 0.0] |
| 2.3 mixed urinary incontinence | 0 | 0 | Risk Ratio (M‐H, Fixed, 95% CI) | 0.0 [0.0, 0.0] |
| 2.4 urinary incontinence (all types) | 2 | 166 | Risk Ratio (M‐H, Fixed, 95% CI) | 2.39 [1.64, 3.47] |
| 3 Quality of life (King's Health Questionnaire/Severity measure after treatment) Show forest plot | 3 | Mean Difference (IV, Fixed, 95% CI) | Subtotals only | |
| 3.1 Stress Urinary incontinence | 3 | 145 | Mean Difference (IV, Fixed, 95% CI) | ‐13.14 [‐21.10, ‐5.18] |
| 3.2 Urge urinary incontinence | 0 | 0 | Mean Difference (IV, Fixed, 95% CI) | 0.0 [0.0, 0.0] |
| 3.3 Mixed urinary incontinence | 0 | 0 | Mean Difference (IV, Fixed, 95% CI) | 0.0 [0.0, 0.0] |
| 3.4 Urinary Incontinence (all types) | 0 | 0 | Mean Difference (IV, Fixed, 95% CI) | 0.0 [0.0, 0.0] |
| 4 Quality of life (King's Health Questionnaire/Incontinence impact after treatment) Show forest plot | 3 | Mean Difference (IV, Fixed, 95% CI) | Subtotals only | |
| 4.1 Stress Urinary incontinence | 3 | 145 | Mean Difference (IV, Fixed, 95% CI) | ‐11.76 [‐20.83, ‐2.69] |
| 4.2 Urge urinary incontinence | 0 | 0 | Mean Difference (IV, Fixed, 95% CI) | 0.0 [0.0, 0.0] |
| 4.3 Mixed urinary incontinence | 0 | 0 | Mean Difference (IV, Fixed, 95% CI) | 0.0 [0.0, 0.0] |
| 4.4 Urinary Incontinence (all types) | 0 | 0 | Mean Difference (IV, Fixed, 95% CI) | 0.0 [0.0, 0.0] |
| 5 Quality of life (King's Health Questionnaire/Physical limitation) Show forest plot | 3 | Mean Difference (IV, Fixed, 95% CI) | Subtotals only | |
| 5.1 Stress Urinary incontinence | 3 | 145 | Mean Difference (IV, Fixed, 95% CI) | ‐11.89 [‐20.55, ‐3.23] |
| 5.2 Urge urinary incontinence | 0 | 0 | Mean Difference (IV, Fixed, 95% CI) | 0.0 [0.0, 0.0] |
| 5.3 Mixed urinary incontinence | 0 | 0 | Mean Difference (IV, Fixed, 95% CI) | 0.0 [0.0, 0.0] |
| 5.4 Urinary Incontinence (all types) | 0 | 0 | Mean Difference (IV, Fixed, 95% CI) | 0.0 [0.0, 0.0] |
| 6 Number of women with interference with life due to UI Show forest plot | 1 | Risk Ratio (M‐H, Fixed, 95% CI) | Totals not selected | |
| 6.1 stress urinary incontinence | 1 | Risk Ratio (M‐H, Fixed, 95% CI) | 0.0 [0.0, 0.0] | |
| 6.2 urge urinary incontinence | 0 | Risk Ratio (M‐H, Fixed, 95% CI) | 0.0 [0.0, 0.0] | |
| 6.3 mixed urinary incontinence | 0 | Risk Ratio (M‐H, Fixed, 95% CI) | 0.0 [0.0, 0.0] | |
| 6.4 urinary incontinence (all types) | 0 | Risk Ratio (M‐H, Fixed, 95% CI) | 0.0 [0.0, 0.0] | |
| 7 I‐QOL Show forest plot | 2 | Mean Difference (IV, Fixed, 95% CI) | Totals not selected | |
| 7.1 Stress urinary incontinence | 1 | Mean Difference (IV, Fixed, 95% CI) | 0.0 [0.0, 0.0] | |
| 7.2 Urge urinary incontinence | 0 | Mean Difference (IV, Fixed, 95% CI) | 0.0 [0.0, 0.0] | |
| 7.3 Mixed urinary incontinence | 0 | Mean Difference (IV, Fixed, 95% CI) | 0.0 [0.0, 0.0] | |
| 7.4 Urinary incontinence (all types) | 1 | Mean Difference (IV, Fixed, 95% CI) | 0.0 [0.0, 0.0] | |
| 8 Quality of life (King's Health Questionnaire/General health score) Show forest plot | 3 | Mean Difference (IV, Fixed, 95% CI) | Subtotals only | |
| 8.1 Stress Urinary incontinence | 3 | 145 | Mean Difference (IV, Fixed, 95% CI) | 1.81 [‐3.40, 7.03] |
| 8.2 Urge urinary incontinence | 0 | 0 | Mean Difference (IV, Fixed, 95% CI) | 0.0 [0.0, 0.0] |
| 8.3 Mixed urinary incontinence | 0 | 0 | Mean Difference (IV, Fixed, 95% CI) | 0.0 [0.0, 0.0] |
| 8.4 Urinary Incontinence (all types) | 0 | 0 | Mean Difference (IV, Fixed, 95% CI) | 0.0 [0.0, 0.0] |
| 9 Cure at up to one year Show forest plot | 1 | Risk Ratio (M‐H, Fixed, 95% CI) | Totals not selected | |
| 9.1 stress urinary incontinence | 0 | Risk Ratio (M‐H, Fixed, 95% CI) | 0.0 [0.0, 0.0] | |
| 9.2 urge urinary incontinence | 0 | Risk Ratio (M‐H, Fixed, 95% CI) | 0.0 [0.0, 0.0] | |
| 9.3 mixed urinary incontinence | 0 | Risk Ratio (M‐H, Fixed, 95% CI) | 0.0 [0.0, 0.0] | |
| 9.4 urinary incontinence (all types) | 1 | Risk Ratio (M‐H, Fixed, 95% CI) | 0.0 [0.0, 0.0] | |
| 10 Cure or improvement at up to one year Show forest plot | 1 | Risk Ratio (M‐H, Fixed, 95% CI) | Totals not selected | |
| 10.1 stress urinary incontinence | 1 | Risk Ratio (M‐H, Fixed, 95% CI) | 0.0 [0.0, 0.0] | |
| 10.2 urge urinary incontinence | 0 | Risk Ratio (M‐H, Fixed, 95% CI) | 0.0 [0.0, 0.0] | |
| 10.3 mixed urinary incontinence | 0 | Risk Ratio (M‐H, Fixed, 95% CI) | 0.0 [0.0, 0.0] | |
| 10.4 urinary incontinence (all types) | 0 | Risk Ratio (M‐H, Fixed, 95% CI) | 0.0 [0.0, 0.0] | |
| 11 Patient perceived satisfaction Show forest plot | 3 | Risk Ratio (M‐H, Fixed, 95% CI) | Subtotals only | |
| 11.1 stress urinary incontinence | 2 | 105 | Risk Ratio (M‐H, Fixed, 95% CI) | 5.32 [2.63, 10.74] |
| 11.2 urge urinary incontinence | 0 | 0 | Risk Ratio (M‐H, Fixed, 95% CI) | 0.0 [0.0, 0.0] |
| 11.3 mixed urinary incontinence | 0 | 0 | Risk Ratio (M‐H, Fixed, 95% CI) | 0.0 [0.0, 0.0] |
| 11.4 urinary incontinence (all types) | 1 | 108 | Risk Ratio (M‐H, Fixed, 95% CI) | 2.77 [1.74, 4.41] |
| 12 Number of women needing further treatment Show forest plot | 2 | Risk Ratio (M‐H, Fixed, 95% CI) | Subtotals only | |
| 12.1 stress urinary incontinence | 1 | 55 | Risk Ratio (M‐H, Fixed, 95% CI) | 0.17 [0.07, 0.42] |
| 12.2 urge urinary incontinence | 0 | 0 | Risk Ratio (M‐H, Fixed, 95% CI) | 0.0 [0.0, 0.0] |
| 12.3 mixed urinary incontinence | 0 | 0 | Risk Ratio (M‐H, Fixed, 95% CI) | 0.0 [0.0, 0.0] |
| 12.4 urinary incontinence (all types) | 1 | 106 | Risk Ratio (M‐H, Fixed, 95% CI) | 0.19 [0.10, 0.36] |
| 13 Number of leakage episodes in 24 hours Show forest plot | 5 | Mean Difference (IV, Fixed, 95% CI) | Subtotals only | |
| 13.1 stress urinary incontinence | 4 | 253 | Mean Difference (IV, Fixed, 95% CI) | ‐1.21 [‐1.52, ‐0.89] |
| 13.2 urge urinary incontinence | 0 | 0 | Mean Difference (IV, Fixed, 95% CI) | 0.0 [0.0, 0.0] |
| 13.3 mixed urinary incontinence | 0 | 0 | Mean Difference (IV, Fixed, 95% CI) | 0.0 [0.0, 0.0] |
| 13.4 urinary incontinence (all types) | 1 | 125 | Mean Difference (IV, Fixed, 95% CI) | ‐0.80 [‐1.26, ‐0.34] |
| 14 Number of voids per day (frequency) Show forest plot | 2 | Mean Difference (IV, Fixed, 95% CI) | Subtotals only | |
| 14.1 stress urinary incontinence | 0 | 0 | Mean Difference (IV, Fixed, 95% CI) | 0.0 [0.0, 0.0] |
| 14.2 urge urinary incontinence | 0 | 0 | Mean Difference (IV, Fixed, 95% CI) | 0.0 [0.0, 0.0] |
| 14.3 mixed urinary incontinence | 0 | 0 | Mean Difference (IV, Fixed, 95% CI) | 0.0 [0.0, 0.0] |
| 14.4 urinary incontinence (all types) | 2 | 66 | Mean Difference (IV, Fixed, 95% CI) | ‐2.56 [‐3.65, ‐1.48] |
| 15 Number of voids per night (nocturia) Show forest plot | 2 | Mean Difference (IV, Fixed, 95% CI) | Subtotals only | |
| 15.1 stress urinary incontinence | 0 | 0 | Mean Difference (IV, Fixed, 95% CI) | 0.0 [0.0, 0.0] |
| 15.2 urge urinary incontinence | 0 | 0 | Mean Difference (IV, Fixed, 95% CI) | 0.0 [0.0, 0.0] |
| 15.3 mixed urinary incontinence | 0 | 0 | Mean Difference (IV, Fixed, 95% CI) | 0.0 [0.0, 0.0] |
| 15.4 urinary incontinence (all types) | 2 | 66 | Mean Difference (IV, Fixed, 95% CI) | 0.04 [‐0.40, 0.48] |
| 16 Short (up to one hour) pad test measured as grams of urine Show forest plot | 4 | Mean Difference (IV, Fixed, 95% CI) | Subtotals only | |
| 16.1 Stress urinary incontinence | 3 | 150 | Mean Difference (IV, Fixed, 95% CI) | ‐4.36 [‐6.77, ‐1.96] |
| 16.2 Urge urinary incontinence | 0 | 0 | Mean Difference (IV, Fixed, 95% CI) | 0.0 [0.0, 0.0] |
| 16.3 mixed urinary incontinence | 0 | 0 | Mean Difference (IV, Fixed, 95% CI) | 0.0 [0.0, 0.0] |
| 16.4 urinary incontinence (all types) | 1 | 25 | Mean Difference (IV, Fixed, 95% CI) | ‐5.10 [‐11.16, 0.96] |
| 17 24 hour pad test (grams) Show forest plot | 2 | Mean Difference (IV, Fixed, 95% CI) | Subtotals only | |
| 17.1 Stress urinary incontinence | 1 | 55 | Mean Difference (IV, Fixed, 95% CI) | ‐27.5 [‐61.24, 6.24] |
| 17.2 Urge urinary incontinence | 0 | 0 | Mean Difference (IV, Fixed, 95% CI) | 0.0 [0.0, 0.0] |
| 17.3 Mixed urinary incontinence | 0 | 0 | Mean Difference (IV, Fixed, 95% CI) | 0.0 [0.0, 0.0] |
| 17.4 Urinary incontinence (all types) | 1 | 41 | Mean Difference (IV, Fixed, 95% CI) | ‐1.20 [‐15.24, 12.84] |
| 18 Number cured on short pad test (objective) after treatment Show forest plot | 3 | Risk Ratio (M‐H, Fixed, 95% CI) | Subtotals only | |
| 18.1 stress urinary incontinence | 3 | 135 | Risk Ratio (M‐H, Fixed, 95% CI) | 7.50 [2.89, 19.47] |
| 18.2 urge urinary incontinence | 0 | 0 | Risk Ratio (M‐H, Fixed, 95% CI) | 0.0 [0.0, 0.0] |
| 18.3 mixed urinary incontinence | 0 | 0 | Risk Ratio (M‐H, Fixed, 95% CI) | 0.0 [0.0, 0.0] |
| 18.4 urinary incontinence (all types) | 0 | 0 | Risk Ratio (M‐H, Fixed, 95% CI) | 0.0 [0.0, 0.0] |
| 19 Number cured or improved on short pad test (objective) after treatment Show forest plot | 3 | Risk Ratio (M‐H, Fixed, 95% CI) | Subtotals only | |
| 19.1 stress urinary incontinence | 3 | 96 | Risk Ratio (M‐H, Fixed, 95% CI) | 8.22 [3.17, 21.28] |
| 19.2 urge urinary incontinence | 0 | 0 | Risk Ratio (M‐H, Fixed, 95% CI) | 0.0 [0.0, 0.0] |
| 19.3 mixed urinary incontinence | 0 | 0 | Risk Ratio (M‐H, Fixed, 95% CI) | 0.0 [0.0, 0.0] |
| 19.4 urinary incontinence (all types) | 0 | 0 | Risk Ratio (M‐H, Fixed, 95% CI) | 0.0 [0.0, 0.0] |
| 20 Number of women with sex life spoilt by UI Show forest plot | 1 | Risk Ratio (M‐H, Fixed, 95% CI) | Totals not selected | |
| 20.1 stress urinary incontinence | 1 | Risk Ratio (M‐H, Fixed, 95% CI) | 0.0 [0.0, 0.0] | |
| 20.2 urge urinary incontinence | 0 | Risk Ratio (M‐H, Fixed, 95% CI) | 0.0 [0.0, 0.0] | |
| 20.3 mixed urinary incontinence | 0 | Risk Ratio (M‐H, Fixed, 95% CI) | 0.0 [0.0, 0.0] | |
| 20.4 urinary incontinence (all types) | 0 | Risk Ratio (M‐H, Fixed, 95% CI) | 0.0 [0.0, 0.0] | |
| 21 Number of women with UI during intercourse Show forest plot | 1 | Risk Ratio (M‐H, Fixed, 95% CI) | Totals not selected | |
| 21.1 stress urinary incontinence | 1 | Risk Ratio (M‐H, Fixed, 95% CI) | 0.0 [0.0, 0.0] | |
| 21.2 urge urinary incontinence | 0 | Risk Ratio (M‐H, Fixed, 95% CI) | 0.0 [0.0, 0.0] | |
| 21.3 mixed urinary incontinence | 0 | Risk Ratio (M‐H, Fixed, 95% CI) | 0.0 [0.0, 0.0] | |
| 21.4 urinary incontinence (all types) | 0 | Risk Ratio (M‐H, Fixed, 95% CI) | 0.0 [0.0, 0.0] | |