Entrenamiento muscular del suelo pélvico versus ningún tratamiento o tratamientos control inactivos para la incontinencia urinaria en mujeres
Resumen
Antecedentes
El entrenamiento muscular del suelo pélvico (EMSP) es el tratamiento de fisioterapia utilizado con mayor frecuencia para las mujeres con incontinencia urinaria de esfuerzo (IUE). En ocasiones también se recomienda para la incontinencia urinaria mixta (IUM) y, con menos frecuencia, para la incontinencia urinaria de urgencia (IUU).
Ésta es una actualización de una revisión Cochrane publicada por primera vez en 2001 y actualizada por última vez en 2014.
Objetivos
Evaluar los efectos del EMSP para las mujeres con incontinencia urinaria (IU) en comparación con ningún tratamiento, placebo o tratamientos simulados u otros tratamientos de control inactivos; y resumir los hallazgos de las evaluaciones económicas pertinentes.
Métodos de búsqueda
Se realizaron búsquedas en el Registro Especializado Cochrane de Incontinencia (Cochrane Incontinence Specialised Register) (12 de febrero de 2018), que contiene ensayos identificados en CENTRAL, MEDLINE, MEDLINE In‐Process, MEDLINE Epub Ahead of Print, ClinicalTrials.gov, WHO ICTRP, búsquedas manuales en revistas y resúmenes de congresos, y en las listas de referencias de artículos relevantes.
Criterios de selección
Ensayos controlados aleatorizados o cuasialeatorizados en mujeres con IUE, IUU o IUM (sobre la base de los síntomas, los signos o la urodinámica). Un brazo del ensayo que incluyera EMPP. El otro brazo incluyó ningún tratamiento, placebo, tratamiento simulado o tratamiento de control inactivo.
Obtención y análisis de los datos
Al menos dos autores de la revisión evaluaron la elegibilidad y el riesgo de sesgo de los ensayos de forma independiente. Los datos se extrajeron y se verificaron de forma cruzada. Un tercer revisor resolvió los desacuerdos. Los datos se procesaron como se describe en el Manual Cochrane para las Revisiones Sistemáticas de Intervenciones (Cochrane Handbook for Systematic Reviews of Interventions). Los ensayos se subagruparon según el diagnóstico de la IU. Se realizó un metanálisis formal cuando fue apropiado.
Resultados principales
La revisión incluyó 31 ensayos (diez de los cuales fueron nuevos para esta actualización), en los que participaron 1817 mujeres de 14 países. En general, los ensayos fueron de tamaño pequeño a moderado, con seguimientos generalmente inferiores a 12 meses y muchos tuvieron un riesgo moderado de sesgo. Hubo una variación considerable en el contenido y la duración de la intervención, las poblaciones de estudio y las medidas de resultado. Solo hubo un estudio de mujeres con IUM y solo un estudio de mujeres con IUU, sin datos sobre la resolución, la resolución o la mejoría, ni sobre el número de episodios de IU para estos subgrupos.
Resolución sintomática de la IU al final del tratamiento: en comparación con ningún tratamiento o los tratamientos control inactivos, las mujeres con IUE que estaban en los grupos de EMSP tuvieron ocho veces más probabilidades de informar la resolución (56% versus 6%; riesgo relativo [RR] 8,38; intervalo de confianza [IC] del 95%: 3,68 a 19,07; cuatro ensayos, 165 mujeres; evidencia de calidad alta). Para las mujeres con cualquier tipo de IU, los grupos de EMSP tuvieron cinco veces más probabilidades de informar la resolución (35% versus 6%; RR 5,34; IC del 95%: 2,78 a 10,26; tres ensayos, 290 mujeres; evidencia de calidad moderada).
Resolución o mejoría delos síntomas de la IU al final del tratamiento: en comparación con ningún tratamiento o los tratamientos control inactivos, las mujeres con IUE de los grupos de EMSP tuvieron seis veces más probabilidades de informar la resolución o la mejoría (74% versus 11%; RR 6,33; IC del 95%: 3,88 a 10,33; tres ensayos, 242 mujeres; evidencia de calidad moderada). Para las mujeres con cualquier tipo de IU, los grupos de EMSP tuvieron dos veces más probabilidades de informar la resolución o la mejoría que las mujeres en los grupos de control (67% versus 29%; RR 2,39; IC del 95%: 1,64 a 3,47; dos ensayos, 166 mujeres; evidencia de calidad moderada).
Síntomas específicos de IU y calidad de vida (CdV) al final del tratamiento: en comparación con ningún tratamiento o con los tratamientos control inactivos, las mujeres con IUE en el grupo de EMSP tuvieron más probabilidades de informar una mejoría significativa de los síntomas de IU (siete ensayos, 376 mujeres; evidencia de calidad moderada) y de informar una mejoría significativa en la CdV relacionada con la IU (seis ensayos, 348 mujeres; evidencia de calidad baja). Para cualquier tipo de IU, las mujeres del grupo de EMSP tuvieron más probabilidades de informar una mejoría significativa en los síntomas de la IU (un ensayo, 121 mujeres; evidencia de calidad moderada) y de informar una mejoría significativa en la CdV relacionada con la IU (cuatro ensayos, 258 mujeres; evidencia de calidad moderada). Finalmente, para las mujeres con IU mixta tratadas con EMSP, hubo un ensayo pequeño (12 mujeres) que informó una mejor calidad de vida.
Episodios de pérdidas en 24 horas al final del tratamiento: El EMSP redujo los episodios de pérdida de orina en uno en las mujeres con IUE (diferencia de medias [DM] 1,23 menor; IC del 95%: 1,78 menor a 0,68 menor; siete ensayos, 432 mujeres; evidencia de calidad moderada) y en las mujeres con todos los tipos de IU (DM 1,00 menor; IC del 95%: 1,37 menor a 0,64 menor; cuatro ensayos, 349 mujeres; evidencia de calidad moderada).
Pérdidas en las pruebas cortas con protectores en el consultorio al final del tratamiento: las mujeres con IUE en los grupos con EMSP perdieron significativamente menos orina en las pruebas cortas con protectores (hasta una hora). La comparación mostró una heterogeneidad considerable, aunque los hallazgos aún favorecieron el EMSP cuando se utilizó un modelo de efectos aleatorios (DM 9,71 g menor; IC del 95%: 18,92 menor a 0,50 menor; cuatro ensayos, 185 mujeres; evidencia de calidad moderada). Para las mujeres con todos los tipos de IU, los grupos de EMSP también informaron menos pérdida de orina en las pruebas cortas con protectores que los controles (DM 3,72 g menor; IC del 95%: 5,46 menor a 1,98 menor; dos ensayos, 146 mujeres; evidencia de calidad moderada).
Las mujeres en el grupo de EMSP también estuvieron más satisfechas con el tratamiento y sus resultados sexuales fueron mejores. Los eventos adversos fueron poco frecuentes y, en los dos ensayos que informaron alguno, fueron menores. Los resultados de la revisión fueron ampliamente apoyados por las tablas de "Resumen de los hallazgos", aunque en la mayoría de los casos la calidad de la evidencia se redujo a moderada por razones metodológicas. La excepción fue la "resolución percibida por la participante" en las mujeres con IUE, que se calificó como de calidad alta.
Conclusiones de los autores
Sobre la base a los datos disponibles, es posible confiar en que el EMSP puede resolver o mejorar los síntomas de la IUE y todos los demás tipos de IUE. Puede reducir el número de episodios de pérdidas, la cantidad de pérdidas en las pruebas cortas con protectores en el consultorio y los síntomas en los cuestionarios de síntomas específicos de la IU. Los autores de la única evaluación económica identificada para el Brief Economic Commentary informaron que la relación coste‐efectividad del EMSP parece prometedora. Los resultados de la revisión indican que el EMSP se podría incluir en los programas de tratamiento conservador de primera línea para las mujeres con IU. Es necesario realizar investigación adicional sobre la efectividad a largo plazo y la relación coste‐efectividad del EMSP.
PICOs
Resumen en términos sencillos
Entrenamiento muscular del suelo pélvico para la incontinencia urinaria en mujeres
Pregunta de la revisión
Se deseaba determinar si el entrenamiento muscular del suelo pélvico (EMSP) ayuda a las pacientes con problemas de incontinencia urinaria. Lo anterior se realizó al comparar los efectos de dicho entrenamiento con ningún tratamiento o con cualquier tratamiento inactivo (por ejemplo, asesoramiento sobre el tratamiento con protectores). También se resumieron los hallazgos sobre los costes y la relación coste‐efectividad.
Se buscaron los ensayos clínicos hasta el 12 de febrero de 2018.
¿Por qué es importante esta pregunta?
La incontinencia urinaria de esfuerzo es la pérdida de orina que no se puede controlar con facilidad (si es que se puede controlar) cuando se realiza una actividad física. Las actividades físicas pueden incluir toser, estornudar, hacer deporte o cambiar de posición repentinamente. La incontinencia de urgencia se presenta como la necesidad repentina y fuerte de orinar. A menudo puede provocar que la paciente no llegue al baño a tiempo para orinar, lo que da lugar a pérdidas de orina. La incontinencia mixta se observa cuando se presenta incontinencia de esfuerzo y de urgencia.
El EMSP es un programa de ejercicios para mejorar la fuerza muscular, la resistencia, la potencia o la relajación del suelo pélvico, o una combinación de los mismos. Es un tratamiento ampliamente utilizado para mujeres con incontinencia de esfuerzo, de urgencia y mixta.
¿Cómo se realizó la revisión de la evidencia?
En los 31 ensayos incluidos participaron 1817 mujeres de 14 países. Los estudios incluyeron a mujeres con incontinencia urinaria de esfuerzo, de urgencia o mixta. Las mujeres fueron aleatorizadas para recibir o no EMSP y se compararon los efectos. Se examinó si la afección se "resolvió" o si se "resolvió o mejoró". También se analizaron los síntomas, el efecto sobre la calidad de vida (CdV) y la polaquiuria y cantidad de orina perdida.
Estudio de las fuentes de financiación
Ocho estudios fueron financiados con fondos públicos. Tres recibieron subvenciones públicas y privadas. Dos recibieron subvenciones de fuentes privadas, mientras que dos estudios no recibieron financiación. Dieciséis estudios no declararon sus fuentes de financiamiento.
Datos encontrados
La calidad de la evidencia examinada fue en su mayoría moderada, lo que significa que se puede tener cierta confianza en los resultados.
Resolución de la incontinencia urinaria después del EMSP: las mujeres con incontinencia urinaria de esfuerzo en el grupo de EMSP tuvieron, como promedio, ocho veces más probabilidades de informar la resolución. Las mujeres con cualquier tipo de incontinencia urinaria en el grupo de EMSP tuvieron, como promedio, cinco veces más probabilidades de informar la resolución.
Resolución o mejoría de la incontinencia urinaria después del EMSP: las mujeres con incontinencia urinaria de esfuerzo en los grupos de EMSP tuvieron, como promedio, seis veces más probabilidades de informar la resolución o la mejoría. Las mujeres con todo tipo de incontinencia urinaria en el grupo de EMSP tuvieron aproximadamente el doble de probabilidades de informar la resolución o la mejoría.
Episodios de pérdida de orina después del EMSP: las mujeres con incontinencia urinaria de esfuerzo y las mujeres con todos los tipos de incontinencia urinaria en el grupo de EMSP tuvieron un episodio de pérdida de orina menos en 24 horas. El EMSP pareció reducir los episodios de pérdida de orina en las mujeres con incontinencia urinaria de urgencia sola.
Para las mujeres con incontinencia de esfuerzo y todos los tipos de incontinencia urinaria, los síntomas de incontinencia y la CdV mejoraron en los grupos de EMSP. Las mujeres estuvieron más satisfechas con el tratamiento con EMSP, mientras que las que estaban en los grupos control tuvieron más probabilidades de buscar tratamiento adicional.
Los efectos secundarios negativos del EMSP fueron poco frecuentes y, en los dos ensayos que los informaron fueron menores.
Los autores de la única evaluación económica identificada para el Brief Economic Commentary informaron que la relación coste‐efectividad del EMSP parece prometedora.
Conclusiones de los autores
Summary of findings
| Pelvic floor muscle training compared to control for stress urinary incontinence in women | ||||||
| Patient or population: women with SUI | ||||||
| Outcomes | Anticipated absolute effects* (95% CI) | Relative effect | № of participants | Quality of the evidence | Comments | |
| Risk with no treatment, placebo or control | Risk with PFMT | |||||
| Participant‐perceived cure after treatment | 60 per 1000a | 505 per 1000 | RR 8.38 | 165 | ⊕⊕⊕⊕ | — |
| Participant‐perceived cure or improvement after treatment | 114 per 1000a | 720 per 1000 | RR 6.33 | 242 | ⊕⊕⊕⊝ | — |
| Number of leakage episodes in 24 hours | The mean number of leakage episodes in 24 hours ranged from 1.07 to 3.61 episodes | MD 1.23 episodes lower | — | 432 | ⊕⊕⊕⊝ | — |
| Short (up to 1 hour) pad test measured as grams of urine | The mean short (up to 1 hour) pad test measured as grams of urine ranged from 3.64 to 38.70 g | MD 9.71 g lower | — | 185 | ⊕⊕⊕⊝ | — |
| GRADE A UI‐specific symptom measures Treatment duration: 4–12 weeks | 3 different Grade A psychometrically robust symptom questionnaires were used by trialists including KHQ severity domain (3 trials; n = 65), ICIQ‐UI Short Form (3 trials; n = 98) and UDI (1 trial; n = 17). Participants in the PFMT group reported significant improvement in UI symptoms. | — | (7 RCTs) | ⊕⊕⊕⊝ | — | |
| GRADE A UI‐specific QoL measures Treatment duration: 6 weeks to 6 months | 5 different Grade A psychometrically robust QoL questionnaires were used by trialists including KHQ impact domain (3 trials; n = 65), KHQ physical limitation domain (3 trials; n = 65); ICIQ‐LUTSqol (1 trial; n = 60); IIQ (1 trial; n = 17); I‐QOL (1 trial; n = 24). Participants in the PFMT group reported significant improvement in UI‐specific QoL except for the KHQ impact after treatment; however with considerable heterogeneity (I² = 76%). | — | (6 RCTs) | ⊕⊕⊝⊝ | — | |
| *The risk in the intervention group (and its 95% confidence interval) is based on the assumed risk in the comparison group and the relative effect of the intervention (and its 95% CI). CI: confidence interval; I‐QOL: Incontinence of Quality of Life questionnaire; ICIQ‐LUTSqol: ICIQ Lower Urinary Tract Symptoms Quality of Life; ICIQ‐UI Short Form: Incontinence Modular Questionnaire Urinary Incontinence Short Form; IIQ: Incontinence Impact Questionnaire; KHQ: King's Health Questionnaire; MD: mean difference; PFMT: pelvic floor muscle training; QoL: quality of life; RCT: randomised controlled trial; RR: risk ratio; SUI: stress urinary incontinence; UDI: Urinary Distress Inventory; UI: urinary incontinence. | ||||||
| GRADE Working Group grades of evidence | ||||||
| aAssumed risk based on number of events. bLarge RR and confidence interval in two trials. cRandom sequence generation and allocation concealment at high risk in one trial (Lagro‐Janssen 1991a). dBlinding of outcome assessor unclear in one trial, for which the participants filled web‐based questionnaires with no face‐to‐face interaction with the researcher group (Asklund 2017). eRandom sequence generation and allocation concealment at high risk in one trial (Lagro‐Janssen 1991a). fAllocation concealment and incomplete outcome data unclear in three trials (Burns 1993; Firra 2013; McLean 2013). gBlinding of outcome assessment unclear in two trials (Asklund 2017; McLean 2013), and at high risk in one trial (Firra 2013). hBaseline comparability at high risk in one trial, but not for this outcome and not for this subgroup (urinary frequency for the urge incontinent subgroup only, Firra 2013). iConsiderable heterogeneity (I² higher than 75%). jRandom sequence generation unclear, and blinding of outcome assessment at high risk in one trial (Pereira 2011). kAllocation concealment and incomplete outcome data unclear in two trials (McLean 2013; Pereira 2011). lDowngraded for being considered a self‐reported measure. mRandom sequence generation, allocation concealment, incomplete data and blinding of outcome assessor unclear for one trial (Carneiro 2010). nAllocation concealment and incomplete outcome data unclear in one trial (Pereira 2011). oUnclear for bias except baseline comparability and selective reporting (Beuttenmuller 2010). | ||||||
| Pelvic floor muscle training compared to control for urinary incontinence (all types) in women | ||||||
| Patient or population: women with UI (all types) | ||||||
| Outcomes | Anticipated absolute effects* (95% CI) | Relative effect | № of participants | Quality of the evidence | Comments | |
| Risk with no treatment, placebo or control | Risk with PFMT | |||||
| Participant‐perceived cure after treatment | 62 per 1000a | 329 per 1000 | RR 5.34 | 290 | ⊕⊕⊕⊝ | — |
| Participant‐perceived cure or improvement after treatment | 288 per 1000a | 687 per 1000 | RR 2.39 | 166 | ⊕⊕⊕⊝ | — |
| Number of leakage episodes in 24 hours | The mean number of leakage episodes in 24 hours ranged from 1.06 to 2.50 | MD 1 episode lower | — | 349 | ⊕⊕⊕⊝ | — |
| Short (up to 1 hour) pad test measured as grams of urine | The mean short (up to 1 hour) pad test measured as grams of urine ranged from 5.10 g to 8.40 g | MD 3.72 g lower | — | 146 | ⊕⊕⊕⊝ | — |
| GRADE A UI‐specific symptom measures Treatment duration: 12 weeks | 1 Grade A psychometrically robust symptom questionnaire was used by 1 trial (n = 63); the UDI. Participant in the PFMT group reported significant improvement in UI‐specific symptoms. | — | (1 RCT) | ⊕⊕⊕⊝ | — | |
| GRADE A UI‐specific QoL measures Treatment duration: 6–12 weeks | 4 different Grade A psychometrically robust QoL questionnaires were used by trialists including the IIQ short form (2 trials; n = 91), the IIQ long form (1 trial; n = 24); I‐QOL (1 trial; n = 17). Participant in the PFMT group reported significant improvement in UI‐specific QoL. | — | (4 RCTs) | ⊕⊕⊝⊝ | — | |
| *The risk in the intervention group (and its 95% confidence interval) is based on the assumed risk in the comparison group and the relative effect of the intervention (and its 95% CI). CI: confidence interval; I‐QOL: Incontinence of Quality of Life questionnaire; IIQ: Incontinence Impact Questionnaire; KHQ: King's Health Questionnaire; MD: mean difference; PFMT: pelvic floor muscle training; QoL: quality of life; RCT: randomised controlled trial; RR: risk ratio; UDI: Urinary Distress Inventory; UI: urinary incontinence. | ||||||
| GRADE Working Group grades of evidence | ||||||
| aAssumed risk based on number of events. bAllocation concealment unclear in two trials (Burgio 1998 which was the biggest trial, and in Kim 2007). cIncomplete outcome data and blinding of outcome assessor unclear for two trials (Kim 2007; Kim 2011a). dConsiderable heterogeneity (I² higher than 75%). eAllocation concealment unclear in both trials (Burgio 1998; Diokno 2010). fBaseline comparability at high risk for one trial, with older participants in the PFMT group (Diokno 2010). gDowngraded for being considered a self‐reported measure. hAllocation concealment unclear in one trial (Burgio 1998). iIncomplete outcome data, blinding of participant and personnel, baseline comparability for a different outcome unclear in Celiker Tosun 2015 (PFMT group presenting lower impact on quality of life and higher night‐time urinary frequency). jRandom sequence generation and allocation concealment unclear in one trial (Yoon 2003). kOnly one trial of a small sample size. lBlinding of outcome assessor and baseline comparability at high risk in one trial (PFMT group older (P = 0.06) and presenting higher impact on quality of life (P = 0.06); Leong 2015). mHigh risk for incomplete outcome data and blinding of outcome assessment (Sar 2009). | ||||||
| Pelvic floor muscle training compared to control for urgency urinary incontinence in women | ||||||
| Patient or population: UUI in women | ||||||
| Outcomes | Anticipated absolute effects* (95% CI) | Relative effect | № of participants | Quality of the evidence | Comments | |
| Risk with no treatment, placebo or control | Risk with PFMT | |||||
| Participant‐perceived cure after treatment | — | — | — | (0 studies) | — | — |
| Participant‐perceived cure or improvement after treatment | — | — | — | (0 studies) | — | — |
| Number of leakage episodes in 24 hours | The mean number of leakage episodes in 24 hours was 2.60 | MD 1.83 episodes lower | — | 12 | ⊕⊕⊝⊝ | — |
| Short (up to 1 hour) pad test measured as grams of urine | — | — | — | (0 studies) | — | — |
| GRADE A UI‐specific symptom measures | — | — | (0 studies) | — | — | |
| GRADE A UI‐specific QoL measures | — | — | (0 studies) | — | — | |
| *The risk in the intervention group (and its 95% confidence interval) is based on the assumed risk in the comparison group and the relative effect of the intervention (and its 95% CI). CI: confidence interval; MD: mean difference; PFMT: pelvic floor muscle training; QoL: quality of life; RCT: randomised controlled trial; UI: urinary incontinence; UUI: urgency urinary incontinence. | ||||||
| GRADE Working Group grades of evidence | ||||||
| aBlinding of outcome assessor and baseline comparability for a different outcome at high risk (urinary frequency higher for the PFMT group, Firra 2013). bBlock randomisation not properly specified, and allocation concealment and attrition bias unclear (Firra 2013). | ||||||
Antecedentes
Descripción de la afección
Incontinencia urinaria
La incontinencia urinaria (IU) es un trastorno frecuente en los adultos que viven en la comunidad. Es más frecuente en las mujeres, aumenta con la edad y es particularmente frecuente entre las personas que reciben cuidados geriátricos (Hunskaar 2002). Las estimaciones de la prevalencia están influenciadas por la definición de incontinencia, la población de la muestra y el formato de las preguntas sobre la incontinencia. Además, es poco probable que las cifras reflejen el verdadero alcance del problema, ya que la vergüenza y otros factores pueden dar lugar a que no se informe de manera suficiente. Las estimaciones de la prevalencia de la IU en las mujeres varían entre el 25% y el 45% en la mayoría de los estudios (Milsom 2013). Los datos del ampliamente citado estudio EPINCONT sobre la IU en mujeres (27 936 mujeres noruegas) indican un aumento gradual de la prevalencia con la edad hasta una prevalencia máxima temprana alrededor de la mediana edad (50 a 54 años), que coincide con la menopausia, seguido de una ligera disminución o estabilización hasta alrededor de los 70 años de edad, cuando la prevalencia comienza a aumentar de manera constante (Hannestad 2000). El embarazo, el trabajo de parto y el parto vaginal (versus cesárea) son factores de riesgo significativos para la IU tardía, pero la solidez de esta asociación disminuye considerablemente con la edad (Milsom 2013).
La incontinencia urinaria de esfuerzo (IUE) aislada representa la mitad de toda la IU, y la mayoría de los estudios informan una prevalencia del 10% al 39%. Con pocas excepciones, la incontinencia urinaria mixta (IUM) es la siguiente en frecuencia, y la mayoría de los estudios informan una prevalencia del 7,5% al 25%. La incontinencia urinaria de urgencia (IUU) aislada es poco frecuente, con una prevalencia del 1% al 7% (Milsom 2013). El tipo de pérdida de orina se clasifica de acuerdo a lo informado por la mujer (síntomas), lo observado por el médico (signos) y sobre la base de los estudios urodinámicos. Las definiciones de los diferentes tipos de IU que se proporcionan a continuación son las de la International Continence Society (Haylen 2010).
La IU no es solo una afección médica grave en cuanto a que puede provocar erupciones perineales, úlceras de decúbito e infecciones del tracto urinario (Resnick 1989), sino que también es un problema social innegable que genera vergüenza y una percepción negativa de uno mismo (Papanicolaou 2005). La IU reduce las interacciones sociales y las actividades físicas (Resnick 1989), y también se asocia con una salud autoevaluada deficiente (Johnson 1998), un deterioro del bienestar emocional y psicológico (Coyne 2012) y un deterioro de la función sexual (Sen 2006). A mediano o largo plazo, las mujeres con IU a menudo se encuentran aisladas y relativamente inactivas (Fantl 1996). Además, la IU en mujeres mayores duplica el riesgo de ingreso a un hogar de ancianos, independientemente de la edad o de la presencia de afecciones comórbidas (Hunskaar 1991). No se dispone de estimaciones actuales de los costes de la IU. En 1995 se calculó que el costo de la IU en las mujeres era de USD 12 400 millones en los Estados Unidos, lo que indica que su carga económica es considerable (Wilson 2001).
Incontinencia urinaria de esfuerzo
Si una mujer informa de pérdidas involuntarias de orina con el esfuerzo físico o un médico observa pérdida de orina al mismo tiempo que el ejercicio, la misma se denomina IUE. Cuando los estudios urodinámicos demuestran una pérdida involuntaria de orina durante el aumento de la presión intraabdominal, pero la pérdida no es acompañada de una contracción del músculo detrusor (músculo liso de la vejiga), la misma se denomina IUE urodinámica (Haylen 2010). Es probable que la IUE se deba a defectos anatómicos en las estructuras que soportan la vejiga y la uretra, que dan lugar a una posición subóptima de estas estructuras en reposo o durante el ejercicio, o a una disfunción de los componentes neuromusculares que ayudan a controlar el esfínter uretral o la presión uretral. Como resultado, la salida de la vejiga (uretra) no se cierra de forma apropiada durante el esfuerzo, lo cual da lugar a pérdidas.
Incontinencia urinaria de urgencia
El síntoma de la IUU está presente cuando una mujer informa una pérdida involuntaria asociada con, o inmediatamente precedida por, una necesidad repentina y apremiante de orinar (urgencia). El signo de la IUU es identificado mediante la observación de la pérdida involuntaria de orina de la uretra, simultáneamente con la sensación de un deseo repentino y apremiante de orinar que es difícil de diferir. La IUU suele ser resultado de un aumento involuntario de la presión de la vejiga debido a la contracción del músculo detrusor. Si hay una causa neurológica conocida para la disfunción del músculo detrusor, se le denomina hiperactividad neurogénica del detrusor. Si se desconoce la causa, la afección se denomina hiperactividad idiopática del detrusor.
Incontinencia urinaria mixta
Muchas mujeres tienen síntomas o signos de IUE y de IUU, y los estudios urodinámicos en ocasiones muestran que la pérdida de orina es resultado de una combinación de IUE urodinámica e hiperactividad del detrusor. Cuando las mujeres tienen uno o ambos síntomas y signos de IUE y IUU, se le denomina IUM.
Descripción de la intervención
Tratamiento de la incontinencia urinaria
Se ha utilizado una gama amplia de tratamientos para la incontinencia urinaria, como intervenciones conservadoras (por ejemplo, fisioterapias, intervenciones sobre el estilo de vida, entrenamiento conductual, dispositivos anti‐incontinencia), intervenciones con fármacos y cirugía. Esta revisión se centrará en una de las fisioterapias, específicamente en el entrenamiento muscular del suelo pélvico (EMSP).
Entrenamiento muscular del piso pelviano
El EMSP ha sido parte de los programas de ejercicios en el taoísmo chino durante más de 6000 años (Chang 1984). Se introdujo por primera vez en la medicina moderna en 1936; cuando un artículo que describía la tensión y relajación de los músculos del suelo pélvico introdujo el uso del EMSP como una opción para la prevención y el tratamiento de la incontinencia urinaria y fecal en la profesión de fisioterapia británica (Morris 1936). Sin embargo, el EMSP como tratamiento para la IUE no se generalizó hasta después de mediados del siglo XX, cuando el ginecólogo estadounidense Arnold Kegel informó sobre el tratamiento exitoso de 64 casos de IUE femenina mediante ejercicios musculares del suelo pélvico con un perinéómetro de biorretroalimentación de la presión (Kegel 1948). Más recientemente, un comité internacional de estandarización definió el EMSP como un ejercicio para mejorar la fuerza muscular, la resistencia, la potencia o la relajación del suelo pélvico, o una combinación de estos parámetros (Bø 2017).
De qué manera podría funcionar la intervención
Razones biológicas para el entrenamiento de los músculos del suelo pélvico para la incontinencia urinaria de esfuerzo y mixta
La justificación biológica es doble. En primer lugar, una contracción intencional y efectiva de los músculos del suelo pélvico (levantar los músculos del suelo pélvico en dirección craneal y hacia adelante) antes y durante el ezfuerzo o el ejercicio fija la uretra y aumenta la presión uretral, evitando la pérdida de orina (DeLancey 1988). Los estudios de ultrasonografía e imagenología de resonancia magnética (IRM) han demostrado el movimiento en dirección craneal y hacia adelante de los músculos del suelo pélvico durante la contracción activa y el impacto resultante en la posición uretral, lo que apoya este razonamiento (Bø 2001). Miller 1998 denominó este contrabalanceo de la contracción muscular del suelo pélvico antes de la tos como el "don (knack)" y evaluó su efectividad en un ensayo controlado aleatorizado (ECA). Demostraron que una contracción voluntaria de los músculos del suelo pélvico (CVMSP) antes o durante la tos puede reducir las pérdidas después de solo una semana de entrenamiento. Otras investigaciones publicadas, que utilizan el término "entrenamiento funcional de los músculos del suelo pélvico", recomiendan la precontracción de los músculos del suelo pélvico no solo durante la tos, sino para cualquier tarea diaria que dé lugar a un aumento de la presión intraabdominal (Carrière 2006). Por lo tanto, la investigación indica que el momento adecuado de la contracción de los músculos del suelo pélvico podría ser un factor importante en el mantenimiento de la IU.
Sin embargo, aún no se ha determinado la fuerza óptima requerida para fijar la uretra y prevenir la pérdida de orina. En las mujeres sanas sin incontinencia la activación de los músculos del suelo pélvico antes o durante el ezfuerzo físico parece ser una respuesta automática que no requiere de un esfuerzo consciente (Peschers 2001). Existe alguna evidencia de que esta contracción de "reflejo" de los músculos del suelo pélvico es un bucle de retroalimentación y podría preceder a un aumento de la presión de la vejiga en 200 ms a 240 ms (Constantinou 1982). Para las mujeres con IU, la posibilidad de aprender a realizar rápidamente una contracción fuerte y oportuna de los músculos del suelo pélvico podría prevenir activamente el descenso de la uretra durante un aumento de la presión intraabdominal (Bø 1995).
En segundo lugar, el cuello de la vejiga recibe el apoyo de unos músculos fuertes y tonificados del suelo pélvico (resistentes al estiramiento), lo que limita su movimiento descendente durante el esfuerzo y el ejercicio, y por lo tanto evita la pérdida de orina (Bø 2004). Bø 2004 indica que el entrenamiento intensivo de la fuerza puede construir el soporte estructural de la pelvis al elevar de manera permanente la placa elevadora a una posición más alta dentro de la pelvis y aumentar la hipertrofia y la rigidez de sus tejidos conectivos. En línea con esta hipótesis, y en apoyo de la misma, se han demostrado diferencias en la posición anatómica de los músculos del suelo pélvico entre mujeres con y sin IU (Pontbriand‐Drolet 2012). Además, los estudios dinamométricos han demostrado que las mujeres con IUE o IUM muestran menos tono, fuerza máxima, rapidez de contracción y resistencia de los músculos del suelo pélvico en comparación con las mujeres sin incontinencia (Pontbriand‐Drolet 2012).
Además, en un estudio no controlado de reconstrucción por IRM se observó una reducción significativa en el área de la superficie interna del elevador del ano después del EMSP, lo que indica un aumento de la rigidez pasiva del elevador del ano, que es indicativo del estado del tono muscular del suelo pélvico (Dumoulin 2007). Griffin 1994; con una sonda de presión dentro de la vagina, también encontró una diferencia significativa en la presión de reposo de los músculos del piso pélvico de las mujeres tres o cuatro semanas después de comenzar el EMSP, y un aumento en la presión de reposo después de completar el EMSP. Además, Balmforth 2004 informó de un aumento de la estabilidad de la uretra en reposo y durante el esfuerzo después de 14 semanas de EMSP supervisado y modificaciones conductuales.
Por lo tanto, existe un conjunto creciente de evidencia que apoya la justificación de que el EMSP mejora el tono muscular del suelo pélvico, lo que puede facilitar una activación automática más efectiva de la unidad motora de los MSP. Este hecho evita el descenso de los músculos del suelo pélvico durante el aumento de la presión intraabdominal, lo que a su vez evita la pérdida de orina (Bø 2007). Debido a la justificación biológica anterior, el objetivo del EMSP para la IUE suele ser mejorar el momento adecuado (de contracción), la fuerza, la resistencia y la rigidez de los músculos del suelo pélvico.
Justificación biológica del entrenamiento muscular del suelo pélvico para la incontinencia urinaria de urgencia
El EMSP también se puede utilizar para el tratamiento de la IUU. La justificación biológica se basa en la observación de Godec de que una contracción del músculo detrusor puede ser inhibida por una contracción de los músculos del suelo pélvico inducida por estimulación eléctrica (Godec 1975). Además, de Groat 2001 demostró que durante el almacenamiento de la orina hay un aumento de la respuesta de salida del nervio pudendo al esfínter uretral externo, con un aumento de la presión intrauretral, que representa lo que él denominó un "reflejo de protección" para la continencia.
Adicionalmente, Morrison 1995 demostró que el bucle excitatorio del centro de micción de Barrington se activa cuando las presiones de la vejiga están entre 5 y 25 mmHg, mientras que el bucle inhibitorio se activa predominantemente por encima de 25 mmHg. La inhibición implica un aumento automático (inconsciente) del tono de los músculos del suelo pélvico y del músculo estriado uretral. Por lo tanto, la CVMSP se puede utilizar para controlar la IUU. Después de inhibir la urgencia de orinar y la contracción del detrusor, la mujer puede llegar al baño a tiempo para evitar la pérdida de orina. Sin embargo, se desconoce el número, la duración, la intensidad y el momento adecuado de la contracción muscular del suelo pélvico necesarios para inhibir una contracción del músculo detrusor.
Tipos de programas de entrenamiento muscular del suelo pélvico
No hay una línea divisoria absoluta para diferenciar los programas de ejercicio de fuerza de los de resistencia. Es frecuente que la fuerza y la resistencia a la fatiga mejoren como respuesta a un programa de ejercicio, aunque una puede estar más afectada que la otra. Los rasgos característicos del entrenamiento de la fuerza incluyen un número reducido de repeticiones con cargas elevadas, donde las formas de aumentar la carga incluyen el aumento de la cantidad de esfuerzo voluntario con cada contracción y la realización de ejercicios a favor y contra la gravedad. El entrenamiento de resistencia se caracteriza por un gran número de repeticiones o contracciones prolongadas con una carga pequeña a moderada. El entrenamiento conductual para mejorar la coordinación y la supresión del deseo de orinar suele implicar el uso repetido de la CVMSP en respuesta a una situación específica, por ejemplo, la CVMSP antes de la tos y la CVMSP con la sensación de urgencia.
Por qué es importante realizar esta revisión
Muchas mujeres son derivadas para el EMSP sobre la base de síntomas o signos clínicos de IU de estrés, urgencia o mixta. Actualmente no existe consenso acerca de la necesidad de realizar investigaciones urodinámicas antes del EMSP (Clement 2013), aunque un único ECA indicó que no había evidencia de una diferencia en el resultado del tratamiento conservador cuando la derivación se realizó sobre la base del diagnóstico de los síntomas o la urodinámica (Ramsay 1995). La sensibilidad y especificidad del diagnóstico urodinámico parece variar según la experiencia del investigador, el alcance de la prueba y la disfunción que se investiga. Por estas razones, en esta revisión se incluyeron los diagnósticos basados en los síntomas, los signos y las investigaciones urodinámicas.
Esta es una actualización de Dumoulin 2014; que se publicó por primera vez en 2001 y se actualizó por última vez en 2014. Esta revisión investiga si el EMSP es un tratamiento efectivo para el tratamiento de la IU de esfuerzo, de urgencia y mixta en las mujeres en comparación con ningún tratamiento, placebo, tratamientos simulados o de control. Las mujeres valoran mucho la resolución de los síntomas asociados con la IU. Johannesson 1997 calculó la voluntad de pagar por una reducción del 50% de los síntomas en un grupo de mujeres con IU. La disposición media a pagar por una reducción del 50% de los síntomas fue de 89 GBP al mes (SEK 1030 en 1997). Debido a la naturaleza crónica y de larga duración de la IU, la posibilidad de conocer los costes y los efectos beneficiosos del EMSP es importante y proporcionará información valiosa a los responsables de la toma de decisiones.
Otras revisiones sobre la IU en mujeres y el EMSP consideran si:
-
un tipo de EMSP es mejor que otro (Hay‐Smith 2011), o si la retroalimentación o la biorretroalimentación tienen alguna función (Herderschee 2011);
-
el EMSP es mejor que otros tratamientos (p.ej. otras terapias físicas, fármacos y cirugía) (protocolo Lins 2014); y
-
si el agregado del EMSP a otros tratamientos añade algún efecto beneficioso (Ayeleke 2015).
Una revisión separada considera la función del EMSP en el tratamiento y la prevención de la incontinencia urinaria y fecal relacionada con el parto (Woodley 2017). Actualmente se realiza una revisión de revisiones sistemáticas Cochrane y su objetivo es considerar la función de las intervenciones conservadoras para la IU en las mujeres, una de las cuales es el EMSP (McClurg 2016).
Las revisiones Cochrane anteriores del EMSP (Dumoulin 2010; Dumoulin 2014; Hay‐Smith 2002; Hay‐Smith 2006), así como otras revisiones sistemáticas publicadas anteriormente del EMSP (Berghmans 1998; Berghmans 2000; Bø 1996; de Kruif 1996; Fedorkow 1993; Wilson 1999), quedan obsoletas a medida que se publican nuevos ensayos. Aunque estas revisiones identificaron varios ensayos del EMSP, hubo pocos datos y una heterogeneidad clínica considerable en los estudios. Existen dudas suficientes acerca de los efectos del EMSP, en particular el tamaño del efecto, como para indicar que se justifica continuar con la actualización de las revisiones Cochrane anteriores.
Objetivos
Evaluar los efectos del EMSP para las mujeres con IU en comparación con ningún tratamiento, placebo o tratamientos simulados u otros tratamientos de control inactivos; y resumir los resultados de las evaluaciones económicas pertinentes.
Métodos
Criterios de inclusión de estudios para esta revisión
Tipos de estudios
Se incluyeron ECA y ensayos cuasialeatorizados (p.ej. que utilizaron la asignación mediante alternancia). Se excluyeron otros diseños de ensayos clínicos controlados.
Tipos de participantes
Se incluyeron ensayos de mujeres con IU y con diagnóstico de IUE, IUU o IUM sobre la base de los síntomas, los signos o la evaluación urodinámica, según la definición de los investigadores. Los ensayos que reclutaron a hombres y mujeres fueron elegibles para su inclusión, siempre que los datos demográficos y de resultados se informaran por separado para las mujeres.
Se excluyeron los ensayos en mujeres con IU cuyos síntomas se podían deber a factores significativos ajenos al tracto urinario (p.ej. trastornos neurológicos, deterioro cognitivo, falta de movilidad independiente y cáncer o radioterapia). Se excluyeron los estudios que investigaban la enuresis nocturna en las mujeres. Se excluyeron los estudios que habían incluido específicamente a mujeres antes del parto o después del parto (en edad reproductiva). Es posible que el efecto del EMSP pueda ser diferente en este grupo debido a los cambios fisiológicos durante el período de embarazo y después del parto. El EMSP para la prevención y el tratamiento de la IU en mujeres antes y después del parto se considera en otra revisión Cochrane (Woodley 2017).
Tipos de intervenciones
Un brazo de todos los ensayos elegibles incluyó un programa de EMSP para mejorar los síntomas de la pérdida de orina existente. Por lo tanto, se excluyeron los estudios en los que participaron solamente mujeres asintomáticas que realizaron el EMSP para la prevención primaria o secundaria de la IU. Otro brazo del ensayo fue un brazo de ningún tratamiento, un brazo de tratamiento de placebo, un brazo de tratamiento simulado (p.ej. estimulación eléctrica simulada) o un brazo de tratamiento de control inactivo (p.ej. asesoramiento sobre el uso de protectores).
El EMSP se definió como un programa de CVMSP repetido, enseñado y supervisado por un profesional sanitario. Se consideraron todos los tipos de programas de EMSP, incluido el uso de variaciones en el propósito y el momento del EMSP (por ejemplo, EMSP para fortalecimiento, EMSP para supresión de la urgencia), diferentes formas de enseñar el EMSP, tipos de contracciones (rápidas o sostenidas) y número de contracciones.
Se incluyeron los ensayos que combinaban el EMSP con un único episodio de biorretroalimentación (con el propósito de enseñar una contracción muscular del suelo pélvico) o asesoramiento sobre estrategias para los síntomas de urgencia o polaquiuria (pero sin un régimen de evacuación de orina programado característico del entrenamiento de la vejiga). Se excluyeron los ensayos que combinaban el EMSP con otro tratamiento conservador (p.ej. entrenamiento de la vejiga, biorretroalimentación, conos vaginales o estimulación eléctrica) o tratamiento farmacológico (p.ej. un fármaco anticolinérgico).
Tipos de medida de resultado
Un subcomité (Outcome Research in Women) del Standardisation Committee of the International Continence Society indicó que la investigación sobre el efecto de las intervenciones terapéuticas para las mujeres con incontinencia urinaria considera cinco categorías de resultados: las observaciones de la mujer (síntomas), la cuantificación de los síntomas (p.ej. pérdida de orina), las observaciones del médico (anatómicas y funcionales), la calidad de vida (CdV) y las medidas socioeconómicas (Lose 1998). Para esta revisión se eligieron uno o más resultados de interés de cada dominio.
Los autores de la revisión también consideraron la International Classification of Function, Disability, and Health (ICF), una iniciativa de la Organización Mundial de la Salud (OMS) que describe un marco conceptual para comprender la salud y las consecuencias de las afecciones de salud, al elegir los resultados primarios de interés para la revisión (OMS 2002). El marco describe las interrelaciones entre el deterioro de las funciones y estructuras corporales de una mujer (p.ej. disfunción muscular del suelo pélvico), las limitaciones en la actividad (p.ej. evitar correr debido a las pérdidas) y la limitación de la participación (p.ej. evitar actividades sociales con amigos y familiares debido a las pérdidas). Por lo tanto, la elección de la CdV específica de la afección como una de las medidas de resultado primarias refleja la importancia que los autores asignaron a los efectos de la incontinencia en las actividades y la participación de las mujeres, mientras que una medida del deterioro (p.ej. de la función muscular del suelo pélvico) fue de importancia secundaria.
Resultados primarios
Medidas informadas por las participantes
-
Resolución sintomática de la IU al final del tratamiento.
-
Resolución o mejoría sintomática de la IU al final del tratamiento.
-
Medidas de la CdV específicas de los síntomas y de la afección (por ejemplo, King's Health Questionnaire [Kelleher 1997], Incontinence Quality of Life [I‐QOL] [Donovan 2005], el cuestionario Bristol Female Lower Urinary Tract Symptoms [B‐FLUTS] [Jackson 1996]).
Resultados secundarios
Medidas informadas por las participantes
-
Resolución y mejoría sintomática a largo plazo (de seis meses a un año después del final del tratamiento; más de un año después del final del tratamiento).
-
Satisfacción
-
Necesidad de tratamiento adicional (por ejemplo, necesidad de ayudas, cirugía, fármacos, EMSP).
-
Autoeficacia (p.ej. escala de autoeficacia específica de la IU [Tannenbaum 2009], o escalas de autoeficacia específicas del EMSP [Broome 2003]).
Cuantificación de lpos síntomas informados por la participante
-
Número de episodios de pérdidas urinarias (en 24 horas).
-
Número de micciones durante el día (polaquiuria).
-
Número de micciones durante la noche (nicturia).
Medidas de los médicos
-
Prueba con protectores y toallas de papel corta (hasta una hora) o larga (24 horas) de pérdida de orina (gramos de orina perdidos) al final del tratamiento.
-
Número de pacientes con resolución o mejoría según el peso de los protectores en una prueba clínica corta al final del tratamiento.
-
Otras pruebas con protectores o toallas de papel (p.ej. las que no informan la resolución, la resolución y mejoría o los gramos, las que se informan en otros momentos después del tratamiento).
Calidad de vida (no específica de la afección)
-
Medidas del estado de salud general (p.ej. el Short Form 36 [Ware 1993]).
-
Medidas de resultado psicosociales (p.ej. Hopkins Symptoms Checklist para el estrés psicológico [SCL‐90‐R] [Derogatis 1974], Hospital Anxiety and Depression Scale [HADS] [Zigmond 1983]).
-
Función o problemas sexuales (p.ej. pérdida durante el coito, impacto en la función sexual).
Efectos adversos
-
Efectos adversos (p.ej. molestias, sensibilidad, dolor, hemorragia).
Medidas de las probables variables moderadoras
Medidas de la función muscular del suelo pélvico
-
Evaluación digital.
-
Dinamometría de los músculos del suelo pélvico.
-
Electromiografía de los músculos del suelo pélvico.
-
Presión de compresión vaginal.
-
Ecografía perineal.
Medida de adherencia
-
Número de participantes del estudio que asisten o completan las sesiones de tratamiento.
-
Número de participantes del estudio que realizan el EMSP o se adhieren al EMSP en el domicilio y en el consultorio.
-
Número de contracciones realizadas por sesión, día o semana.
Resultados principales de las tablas de "Resumen de hallazgos"
De acuerdo con la guía del Manual Cochrane para las Revisiones Sistemáticas de Intervenciones (Cochrane Handbook for Systematic Reviews of Interventions) (Higgins 2011), se seleccionaron los siguientes resultados para su inclusión en las tablas de "Resumen de los hallazgos":
-
resolución sintomática de la IU informada por la participante al final del tratamiento;
-
síntomas informados por la participante de resolución o mejoría de la IU al final del tratamiento;
-
síntomas y medidas de la calidad de vida específica de la afección (síntomas específicos de la IU de grado A y medidas de la calidad de vida);
-
número de episodios de pérdidas urinarias (en 24 horas); y
-
prueba corta con protectores (hasta una hora) medida en gramos de orina al final del tratamiento.
Métodos de búsqueda para la identificación de los estudios
This review drew on the search strategy developed by Cochrane Incontinence. There were no language or other restrictions on any of the searches described below.
Búsquedas electrónicas
We identified relevant trials from the Cochrane Incontinence Specialised Register. For more details of the search methods used to build the Specialised Register, please see the Group's webpages where details of the Register's development (from inception) and the most recent searches performed to populate the Register can be found. To summarise, the Register contains trials identified from the Cochrane Central Register of Controlled Trials (CENTRAL), MEDLINE, MEDLINE In‐Process, MEDLINE Epub Ahead of Print, ClinicalTrials.gov, WHO ICTRP, UK Clinical Research Network Portfolio, and handsearching of journals and conference proceedings. Many of the trials in the Cochrane Incontinence Specialised Register are also contained in CENTRAL.
The date of the last search was 12 February 2018.
The terms used to search the Cochrane Incontinence Specialised Register are given in Appendix 1.
We performed additional searches for the Brief Economic Commentary (BEC) in the following databases:
-
MEDLINE on OvidSP (1946 to week 4 July 2018) searched on 2 August 2018;
-
Embase on OvidSP (1974 to week 31 2018) searched on 2 August 2018;
-
NHS Economic Evaluation Database (NHS EED) on the Centre for Reviews and Dissemination website searched on 3 August 2018.
The search strategies used for the BEC are given in Appendix 2.
Búsqueda de otros recursos
We cross‐referenced relevant conference abstracts identified from the Cochrane Incontinence Specialised Register search to determine if a full‐length report had been published. We sought additional trials from the reference lists of included trials.
Obtención y análisis de los datos
Selección de los estudios
Two review authors (CD with LPC or JHS) independently screened the list of titles and abstracts generated by our search. We retrieved full‐text articles of potentially relevant studies. We also included trials for which only abstracts were available. Two review authors (CD with LPC or JHS) independently assessed the full‐text articles or abstracts for eligibility. We contacted study investigators as required. We resolved any differences of opinion by discussion or involvement of a third party. We listed studies formally considered for the review but excluded, with the reasons given for their exclusion. The selection process is documented with a PRISMA flow chart (see Figure 1).
Extracción y manejo de los datos
Two review authors (CD and LPC) independently undertook data extraction, which was cross‐checked by a third review author (JHS). We resolved any differences of opinion related to the data extraction by discussion. Where study data were possibly collected but not reported, or data were reported in a form that could not be used in the formal comparisons, we sought further clarification from the trialists. In addition, where the reported data were clearly incomplete (i.e. data from abstracts for ongoing trials), we contacted the trialists for data from the completed trial. When found, we added data to the extraction sheet. Two review authors (CD and LPC) performed data entry using Review Manager 5 software (Review Manager 2014). All included trial data were processed as described in the Cochrane Handbook for Systematic Reviews of Interventions (Higgins 2011). One review author (JHS) cross‐checked data entry. We resolved any differences of opinion related to the data extraction by discussion.
For categorical outcomes, we related the numbers reporting an outcome to the numbers at risk in each group to derive a risk ratio (RR) with 95% confidence intervals (CI). For continuous variables, we used means and standard deviations (SD) to derive mean differences (MD) and 95% CIs. We had planned to undertake formal meta‐analysis where appropriate.
Evaluación del riesgo de sesgo de los estudios incluidos
We assessed the risk of bias in the included trials using Cochrane's 'Risk of bias' assessment tool (Higgins 2011). This included the following.
-
Random sequence generation (selection bias).
-
Allocation concealment (selection bias).
-
Blinding of participants and personnel (performance bias).
-
Blinding of outcome assessment (detection bias).
-
Selective reporting (reporting bias).
-
Incomplete outcome data (attrition bias).
-
Baseline comparability of the randomised groups.
Baseline comparability was included in the risk of bias assessment because difference in incontinence severity between groups (for example) can influence outcomes. This may be even more important in small trials, where randomisation cannot insure comparability between groups.
Two review authors (CD and LPC) independently assessed these domains, which another review author (JHS) cross‐checked. Any differences of opinion were resolved by consensus.
Medidas del efecto del tratamiento
Analyses were based on available data from all included trials relevant to the comparisons and outcomes of interest. For trials with multiple publications, we included only the most up‐to‐date or complete data for each outcome. We undertook meta‐analysis where data were available from more than one study assessing the same outcome. We used a fixed‐effect model for calculations of pooled estimates and their 95% CIs.
For categorical outcomes, we related the numbers reporting an outcome to the numbers at risk in each group to calculate an RR with 95% CI. For continuous variables, we used means and SDs to calculate an MD with 95% CI. For positive outcomes such as cure, we altered the labelling of the forest plots. If data to calculate RRs or MDs were not given, we utilised the most detailed numerical data available to calculate the actual numbers or means and SDs (e.g. test statistics, P values).
Cuestiones relativas a la unidad de análisis
The primary analysis was per woman randomised.
Manejo de los datos faltantes
Where possible, we analysed the trial data according to the intention‐to‐treat principle, that is by the randomised groups, and irrespective of whether women received treatment according to their randomised allocation. We did not impute missing outcome data.
If trials reported sufficient detail to calculate MDs but not enough information to calculate the associated SD, we assumed the outcome to have an SD equal to the highest SD from other trials within the same analysis.
We attempted to obtain missing data from the original trialists.
Evaluación de la heterogeneidad
We assessed heterogeneity between trials by visual inspection of plots of the data, the Chi² test for heterogeneity and the I² statistic (Higgins 2011). We defined the thresholds for interpretation of the I² statistic according to the Cochrane Handbook for Systematic Reviews of Interventions, considering substantial heterogeneity for I² values between 50% and 90% and considerable heterogeneity for I² values higher than 75% (Higgins 2011). We sought and discussed possible explanations for heterogeneity.
Evaluación de los sesgos de notificación
In view of the difficulty of detecting and correcting for publication bias and other reporting biases, we aimed to minimise their potential impact by ensuring a comprehensive search for eligible studies and by being alert for duplication of data. With respect to reporting bias, and more specifically publication bias, we planned to use the Egger's test where there were more than 10 studies per subgroup analysis.
Síntesis de los datos
For dichotomous outcomes, we pooled RRs using the Mantel‐Haenszel method. For continuous outcomes, we presented MDs using inverse variance. We used a fixed‐effect model approach in the meta‐analyses in this review except when there was significant heterogeneity (Chi² test, P less than 0.10), where we used a more conservative random‐effects model.
Análisis de subgrupos e investigación de la heterogeneidad
We used subgroup analysis to address the effect of the type of incontinence on outcome. Because the rationale for PFMT is different for the two main types of UI (SUI and UUI), it is plausible to expect a difference in the outcome of PFMT on the basis of the type of incontinence. It is commonly believed that PFMT is most effective for women with SUI and that it may be effective, in combination with behavioural interventions, for women with MUI. In the past, PFMT has rarely been the first‐choice treatment for women with UUI alone (Dumoulin 2017).
The four prespecified diagnostic subgroups were trials that recruited women with:
-
SUI alone (symptoms, signs, urodynamic stress incontinence);
-
UUI alone (symptoms, signs, idiopathic detrusor overactivity incontinence);
-
MUI (symptoms or signs of both SUI and UUI, or idiopathic detrusor overactivity incontinence with urodynamic SUI); and
-
a range of diagnoses of UI (women could have SUI, UUI or MUI, but data were not reported separately according to these subgroups).
If heterogeneity between trials was sufficiently large, we planned to conduct an investigation to identify its causes. The investigation of heterogeneity addressed the populations and interventions in the individual trials. If heterogeneity remained after appropriate investigation and possible removal of outlying trials, we planned to use a random‐effects model in the meta‐analysis.
Análisis de sensibilidad
Had sufficient data been available, we planned sensitivity analysis with respect to trial quality, as there is some evidence that the adequacy of randomisation (sequence generation and allocation concealment) may have an impact on the findings of a meta‐analysis (Moher 1998).
'Summary of findings' tables and assessment of the quality of the evidence
We prepared 'Summary of findings' tables for our main comparisons and presented the results for the outcomes prespecified for this purpose in the Types of outcome measures section.
We adopted the GRADE approach to assess the quality of evidence related to these outcomes (Guyatt 2013a; Guyatt 2013b). The four levels of evidence quality were 'high,' 'moderate,' 'low' or 'very low.' The following factors were considered for assessing the quality of evidence: limitations in the study design, inconsistency of results, indirectness of evidence, imprecision and publication bias.
Incorporating economics evidence
A Brief Economic Commentary was developed to summarise the availability and principal findings of the economic evaluations captured as part of this review. This included evaluations alongside trials and model‐based evaluations. This was carried out in accordance with current guidance. This commentary focused on the extent to which principal findings of eligible economic evaluations indicate that an intervention might be judged favourably (or unfavourably) from an economic perspective when implemented in different settings. A supplementary search to identify economic studies was carried out according to the guidelines in Cochrane Economics Methods (Shemilt 2011).
Results
Description of studies
Results of the search
The literature search produced 1299 records for screening, from which we retrieved 94 new potentially relevant full‐text articles. There were 52 reports of 31 studies that met the inclusion criteria and we excluded 39 reports of 33 studies, with reasons given in the Characteristics of excluded studies. In addition, two studies were placed in Studies awaiting classification pending further information from the trialists (Bali 2016; Zhang 2015), and one study was placed in Ongoing studies (NCT03097549).
The supplementary search for the BEC produced 463 records which we screened and found one relevant economic evaluation (Sjostrom 2017), conducted alongside an included study (Asklund 2017). This report had already been identified by the search for effectiveness studies.
The flow of literature through the assessment process is shown in the PRISMA flowchart (see Figure 1).
Included studies
For more details about the trials, see the Characteristics of included studies.
Of the 31 included trials, four contained no data usable in forest plots (Bidmead 2002; Ferreira 2014; Miller 1998; Wells 1999), while 27 contributed to forest plots. Twenty‐one trials contributed to the analysis of primary outcomes:
-
cure (Bø 1999; Burgio 1998; Hofbauer 1990; Kim 2007; Kim 2011a; Kim 2011b);
-
cure or improvement (Asklund 2017; Bø 1999; Burgio 1998; Diokno 2010; Lagro‐Janssen 1991a; Leong 2015);
-
symptom‐ or condition‐specific health measures (Asklund 2017; Bertotto 2017; Beuttenmuller 2010; Bø 1999; Carneiro 2010; Castro 2008; Celiker Tosun 2015; Firra 2013; Kargar Jahromi 2013; Leong 2015; McLean 2013; Pereira 2011; Solberg 2016; Sran 2016).
Seventeen trials had more than two treatment arms (Aksac 2003; Bertotto 2017; Beuttenmuller 2010; Bidmead 2002; Bø 1999; Burgio 1998; Burns 1993; Castro 2008; Firra 2013; Henalla 1989; Henalla 1990; Hofbauer 1990; Kim 2011a; Pereira 2011; Solberg 2016; Wells 1999; Yoon 1999). Although all comparison groups are listed (see Characteristics of included studies), only descriptions and data relating to the PFMT and control arms were given in this review. Of the 31 included trials, 21 were included in the previous version of the review (Dumoulin 2014).
Design
All included trials were RCTs except one, which was considered to be quasi‐randomised (Lagro‐Janssen 1991a).
Sample sizes
Sample size ranged from 15 to 143 participants per study.
Setting
The settings were single centre in 22 trials (Aksac 2003; Bertotto 2017; Beuttenmuller 2010; Bidmead 2002; Burgio 1998; Burns 1993; Carneiro 2010; Castro 2008; Celiker Tosun 2015; Ferreira 2014; Firra 2013; Henalla 1989; Henalla 1990; Hofbauer 1990; Kargar Jahromi 2013; McLean 2013; Miller 1998; Pereira 2011; Sar 2009; Solberg 2016; Sran 2016; Yoon 2003), or multi‐centre in four trials (Bø 1999; Lagro‐Janssen 1991a; Leong 2015; Wells 1999). In three other trials, participants came from a multiples resident register in the USA (Diokno 2010); a single resident register in Tokyo, Japan (Kim 2007; Kim 2011a; Kim 2011b); or through a website (Asklund 2017). Fourteen countries contributed studies to this review: USA (six); Brazil (five); UK, Japan and Turkey (three each); Canada and Norway (two each); and Austria, China, Iran, Korea, Portugal, The Netherlands and Sweden (one each).
Participants
All the women in the included studies had UI. Fifteen trials diagnosed the type of UI based on symptoms or signs, or both. Of these:
-
seven included only women with SUI (Asklund 2017; Bertotto 2017; Ferreira 2014; Kargar Jahromi 2013; Kim 2007; Miller 1998; Pereira 2011);
-
seven included women with all types of UI (Diokno 2010; Kim 2011a; Kim 2011b; Leong 2015; Sar 2009; Sran 2016; Yoon 2003); and
-
one included women with SUI or MUI (Wells 1999).
Thirteen trials reported urodynamic diagnoses:
-
eight included women with urodynamic SUI only (Aksac 2003; Bidmead 2002; Bø 1999; Carneiro 2010; Castro 2008; Henalla 1989; Henalla 1990; Hofbauer 1990);
-
one included women with detrusor overactivity incontinence with or without urodynamic SUI and 51% had MUI (Burgio 1998);
-
one included women with urodynamic SUI with or without detrusor overactivity incontinence, but the proportion with mixed symptoms was small (9%) (Burns 1993);
-
one included women with urodynamic SUI and MUI, with 54% of the participants having mixed symptoms (Celiker Tosun 2015);
-
one included women with SUI, UUI or MUI, although a subset of data was available for women with urodynamic SUI only (Lagro‐Janssen 1991a); and
-
one included women with symptoms of SUI or MUI and excluded those with detrusor instability (McLean 2013).
For the other three trials, one included women with all types of UI diagnosed by symptoms or urodynamics (Firra 2013), and two were unclear about the diagnosis method for MUI (Beuttenmuller 2010), and SUI (Solberg 2016).
Based on diagnosis, the incontinence subgroups used in the analysis were:
-
SUI: 18 trials (Aksac 2003; Asklund 2017; Bertotto 2017; Beuttenmuller 2010; Bø 1999; Burns 1993; Carneiro 2010; Castro 2008; Firra 2013; Henalla 1989; Henalla 1990; Hofbauer 1990; Kargar Jahromi 2013; Kim 2007; Kim 2011a; Lagro‐Janssen 1991a; McLean 2013; Pereira 2011);
-
MUI: one trial (Solberg 2016);
-
UUI: one trial (Firra 2013); and
-
UI, range of diagnoses: nine trials (Burgio 1998 (UUI/MUI); Celiker Tosun 2015 (SUI/MUI); Diokno 2010 (all types of UI); Kim 2011a (all types of UI); Kim 2011b (all types of UI); Leong 2015 (all types of UI); Sar 2009 (all types of UI); Sran 2016 (all types of UI); Yoon 2003 (all types of UI)).
Lagro‐Janssen 1991a recruited women with SUI, UUI or MUI, and those with UUI or MUI were offered bladder training. As data from women with SUI were reported separately, this trial was eligible for inclusion.
For two trials, women with a range of diagnoses were recruited but data was reported by subgroups of symptoms. In one case, there were data available separately for women with predominant SUI or UUI symptoms (Firra 2013). In the other trial, there were data reported for SUI and UUI or MUI together (Kim 2011a).
Other characteristics
In 12 trials, leakage frequency was one of the inclusion criteria:
-
more than once a month (Kim 2007; Kim 2011a; Pereira 2011);
-
twice or more per month (Lagro‐Janssen 1991a);
-
once or more per week (Asklund 2017; Kim 2011b);
-
twice or more per week (Burgio 1998);
-
three times or more per week (Burns 1993; Castro 2008);
-
twice or more per three days (Sran 2016);
-
one to five leakage episodes per day (Miller 1998); and
-
three incontinence episodes or more in three days (Firra 2013).
Four trials used amount of leakage from a pad test:
-
more than 1 g during 15 minutes of volleyball practice (Ferreira 2014);
-
more than 1 g during a 30‐minute test (Yoon 2003);
-
more than 2 g during a 60‐minute pad test (Sar 2009); and
-
more than 4 g on a short clinic‐based pad test, with standardised bladder volume (Bø 1999).
Aside from diagnosis and some measure of leakage severity, there were no other consistently reported inclusion criteria, although 18 trials restricted participation based on age. These trials recruited women aged:
-
13 to 30 years (Ferreira 2014);
-
18 years and older (Asklund 2017; McLean 2013; Solberg 2016);
-
20 to 65 years (Lagro‐Janssen 1991a);
-
21 years and older (Firra 2013);
-
35 to 50 years (Carneiro 2010);
-
35 to 55 years (Yoon 2003);
-
50 to 65 years (Bertotto 2017);
-
55 years and older (Burgio 1998; Burns 1993; Sran 2016);
-
60 years and older (Miller 1998);
-
60 to 74 years (Kargar Jahromi 2013);
-
65 years and older (Leong 2015); and
Common exclusion criteria were untreated urinary tract infection, postmicturition residual volume greater than a specified amount, neurological disorders and cognitive impairment. Three trials also considered body mass index (BMI) as a criteria for exclusion when it was greater than 30 kg/m² (Leong 2015), greater than 50 kg/m² (Firra 2013), or either lower than 18 kg/m² or greater than 25 kg/m² (Ferreira 2014).
Interventions
The individual characteristics of the active and control interventions are summarised in the Characteristics of included studies and detailed in Appendix 3.
Active intervention: pelvic floor muscle training
Three trials gave no details of the PFMT programme used (Bidmead 2002; Henalla 1990; Hofbauer 1990). Of the 28 remaining trials, 21 stated that a correct VPFMC was confirmed prior to training using vaginal, rectal or physical examination (Aksac 2003; Bertotto 2017; Bø 1999; Burgio 1998; Burns 1993; Carneiro 2010; Castro 2008; Celiker Tosun 2015; Diokno 2010; Firra 2013; Henalla 1989; Lagro‐Janssen 1991a; Leong 2015; McLean 2013; Miller 1998; Pereira 2011; Sar 2009; Solberg 2016; Sran 2016; Wells 1999; Yoon 2003). Five trials reported that participants were taught to do a VPFMC but did not say how they were taught (Ferreira 2014; Kargar Jahromi 2013; Kim 2007; Kim 2011a; Kim 2011b). One trial did not report correct VPFMC confirmation, but stated that the pelvic floor muscles were assessed by an evaluator prior to treatment (Beuttenmuller 2010). Another trial reported that participants were instructed by a smartphone app to identify the correct VPFMC, but without face‐to‐face interaction with health professionals (Asklund 2017).
Specialist nurses taught PFMT in 10 trials (Burgio 1998; Burns 1993; Diokno 2010; Kim 2007; Kim 2011a; Kim 2011b; Miller 1998; Sar 2009; Wells 1999; Yoon 2003), physiotherapists in 16 trials (Bertotto 2017; Beuttenmuller 2010; Bidmead 2002; Bø 1999; Carneiro 2010; Castro 2008; Celiker Tosun 2015; Firra 2013; Henalla 1989; Henalla 1990; Hofbauer 1990; Leong 2015; McLean 2013; Pereira 2011; Solberg 2016; Sran 2016), family doctor in one trial (Lagro‐Janssen 1991a), smartphone app in one trial (Asklund 2017), and was not specified in three trials (Aksac 2003; Ferreira 2014; Kargar Jahromi 2013).
Based on the descriptions of training, two trials had PFMT programmes that clearly or predominantly targeted co‐ordination or strength training (Bø 1999; Miller 1998). Miller 1998 described a short (one‐week) programme to improve co‐ordination between a VPFMC and a rise in intra‐abdominal pressure. Bø 1999 recommended a programme that comprised of 8 to 12 high‐intensity (close to maximal) VPFMC, with six to eight second hold and three to four fast contractions added at the end of each hold, and six‐second rests between contractions, three times per day. Exercises were done in different body positions, including lying, kneeling, sitting and standing, all with legs apart.
It was more difficult to characterise or categorise the other PFMT programmes because they were either a mixed programme (e.g. strength and endurance) or had not described a key training parameter (e.g. amount of voluntary effort per contraction). The individual characteristics of each exercise programme (i.e. the number of VPFMC, duration of holding time, duration of rest time, number of sets per day, types of contraction strength, endurance, co‐ordination, body position and adherence strategies) are detailed in Appendix 3.
Many of the recent trials described a mixed programme of short or short and rapid contractions of one to three seconds and long sustained contractions of 6 to 59 seconds (Asklund 2017; Celiker Tosun 2015; Diokno 2010; Ferreira 2014; Firra 2013; Kargar Jahromi 2013; Kim 2011a; Kim 2011b; Leong 2015; Sar 2009; Sran 2016), in addition to contraction prior to and during a cough (Asklund 2017; Castro 2008; Celiker Tosun 2015; Diokno 2010; Leong 2015; McLean 2013; Sar 2009; Sran 2016), or prior to an abdominal strain (Bertotto 2017), and in different body positions from lying to standing (Asklund 2017; Bertotto 2017; Beuttenmuller 2010; Carneiro 2010; Firra 2013; Kargar Jahromi 2013; Kim 2007; Kim 2011a; Kim 2011b; Leong 2015; Pereira 2011; Sar 2009; Sran 2016).
The training programme was progressive in 14 trials, increasing the difficulty of the exercise week by week, including body position or number of repetitions (Asklund 2017; Bertotto 2017; Burns 1993; Carneiro 2010; Celiker Tosun 2015; Firra 2013; Leong 2015; Pereira 2011; Sran 2016), or the contraction holding time (Aksac 2003; Bø 1999; Burgio 1998; Sar 2009; Yoon 2003).
Control interventions
Control interventions included:
-
no treatment (Aksac 2003; Asklund 2017; Bertotto 2017; Beuttenmuller 2010; Bidmead 2002; Burns 1993; Carneiro 2010; Celiker Tosun 2015; Diokno 2010; Firra 2013; Henalla 1989; Henalla 1990; Kargar Jahromi 2013; McLean 2013; Miller 1998; Pereira 2011; Sar 2009; Solberg 2016; Yoon 2003);
-
placebo drug (Burgio 1998);
-
sham electrical stimulation (Hofbauer 1990); and
-
other inactive control treatments that comprised:
-
use of an anti‐incontinence device (Bø 1999);
-
advice on incontinence pads (Lagro‐Janssen 1991a);
-
motivational telephone calls once per month (Castro 2008);
-
advice on simple lifestyle alterations (Kim 2011b; Wells 1999);
-
general education class (cognitive function, osteoporosis and oral hygiene) (Kim 2011a; Sran 2016);
-
refraining from special exercises aiming to increase muscle strength, walking speed, to reduce BMI or to improve dietary habits (Kim 2007); and
-
access to an educational pamphlet with or without advice on UI (Ferreira 2014; Leong 2015).
-
Outcomes
Overall, there was no consistency in the choice of outcome measures by trialists. This limited the possibilities for considering the results from individual trials together. It was disappointing that four eligible trials did not contribute any data to the main analyses because they did not report any prespecified outcomes of interest, or they did not report their outcome data in a usable way (e.g. mean without a measure of dispersion, P values without raw data, or only postintervention minus pre‐intervention data or differential data available) (Bidmead 2002; Ferreira 2014; Miller 1998; Wells 1999). We attempted communication with the authors but received no responses.
As the length of intervention and timing of postintervention assessment varied, there was no attempt to report outcomes at a particular time point. Postintervention outcomes were used as it was assumed that the trialists would choose to complete treatment and measure outcomes when maximum benefit was likely to have been gained. Data from after treatment stopped or any longer‐term follow‐up were reported as secondary outcomes.
For one trial, the length of the programme depended on the strength of the participants' pelvic floor muscles (Celiker Tosun 2015). Those who did not reach the goal of grade 5 (according to the Oxford grading system) at the end of the 12‐week PFMT programme were invited for additional training until the goal was achieved. However, only data from the primary endpoint (after the 12‐week training programme) was eligible for this review since there was no additional follow‐up for the control group.
Primary outcomes – participant‐reported measures
Symptomatic cure or symptomatic cure or improvement of urinary incontinence at the end of treatment
The studies used many different scales to measure a participant's response to treatment, including Likert scales, visual analogue scales and per cent reduction in symptoms. Whatever the scale, data were included in the formal comparisons when the trialists stated the number of women who perceived they were cured or improved, as defined by the trialists, after treatment. Where there was more than one level of improvement reported (e.g. much better and somewhat better), we entered data for the greater degree of improvement in the comparison. It was thought that this was more likely to capture participants who had clinically important improvement. As some trial reports did not differentiate cure from improvement, we used two measures to avoid losing important data ('cure only' or 'cure or improvement').
The studies used the following definitions.
-
Participant perceived cure defined as no urine loss or 'dry' (Burgio 1998; Kim 2011a).
-
Participant perceived cure as 'incontinence is now unproblematic' (Bø 1999).
-
Cure was also reported by women as no leakage in a urinary diary (Hofbauer 1990; Kim 2007; Kim 2011b).
-
Participant perceived cure and improvement defined as much better and somewhat better (Asklund 2017; Diokno 2010).
-
Participant perceived cure and improvement defined as '75% or more perceived improvement' (Burgio 1998).
-
Participant perceived cure and improvement defined as 'dry' or 'improved' (Lagro‐Janssen 1991a).
-
Participant perceived cure and improvement defined as 'continent' or 'almost continent' (Bø 1999).
Patient Global Impression of Improvement
Asklund 2017 used the Patient Global Impression of Improvement (PGI‐I) questionnaire, which is highly recommended to measure
symptom bother related to
UI in women with SUI (Grade A, Kelleher 2013). It is a validated questionnaire that asks about the change experienced after treatment, with seven response options ranging from "very much better" to "very much worse" (Yalcin 2003).
Leong 2015 used a visual analogue scale (0 suggesting "no improvement" and 10 "complete relief") to measure participant perception of improvement (Analysis 1.18).
Symptom‐ and condition‐specific quality of life measures
Thirteen trials used psychometrically robust questionnaires (Grade A questionnaire according to International Consultation on Incontinence book) (Kelleher 2013) for assessment of incontinence symptoms, or the impact of these symptoms on QoL, or both. They are presented below and can be found in the forest plots.
King's Health questionnaire
Three trials used the King's Heath questionnaire (Beuttenmuller 2010; Carneiro 2010; Pereira 2011), which has established validity, reliability and responsiveness to change or evaluation of UI symptoms in women (Kelleher 1997; Margolis 2011; Grade A+, Kelleher 2013). Higher scores represent higher QoL. Four domains of this questionnaire (severity measure, incontinence impact, physical limitation and general health scores) are presented in the forest plots (Analysis 1.3; Analysis 1.4; Analysis 1.5; Analysis 1.6).
International Consultation on Incontinence Modular Questionnaire – Short Form
Four trials used the International Consultation on Incontinence Modular Questionnaire – Short Form (ICIQ‐UI Short Form) (Asklund 2017; Bertotto 2017; Kargar Jahromi 2013; Solberg 2016), which is highly recommended for the assessment of the impact of UI on QoL (Grade A, Kelleher 2013). It includes four items: frequency of UI, amount of leakage, overall impact of UI and self‐diagnosis. The score ranges from 0 to 21, with greater values indicating increased severity (Avery 2004).
Asklund 2017 used the lower urinary tract symptoms module of the ICIQ questionnaire (ICIQ‐LUTSqol), which is also highly recommended to assess the impact of lower urinary tract symptoms on QoL with particular reference to social effects (Grade A+, Kelleher 2013). It is a 19‐item questionnaire, with scores ranging from 19 to 76 and higher values indicating lower QoL (Brookes 2004).
Incontinence Impact Questionnaire
Three trials used the short form version of the Incontinence Impact Questionnaire (IIQ) (Celiker Tosun 2015; Leong 2015; McLean 2013), and one used the long form version (Sran 2016). Both versions are highly recommended for the assessment of QoL impact of UI (Grade A, Kelleher 2013). The score ranges from 0 to 400 for the long form (Wyman 1987), and from 0 to 100 for the short form, with higher scores indicating worse symptoms (Uebersax 1995).
Urogenital Distress Inventory
Three trials used the short form of the Urogenital Distress Inventory (UDI) questionnaire (UDI‐6) (Celiker Tosun 2015; McLean 2013; Sran 2016), which assesses the degree to which symptoms associated to incontinence are troubling. The long and short versions are highly recommended for the assessment of symptoms of UI in women (Grade A, Kelleher 2013). The short form includes six questions with total scores ranging from 0 to 100, with greater values indicating worse symptoms (Uebersax 1995).
Incontinence‐specific quality of life
Castro 2008 and Sar 2009 used the UI‐specific QoL instrument (I‐QOL), which has established validity, reliability and responsiveness to change or evaluation of incontinence symptoms in women (Bushnell 2005; Wagner 1996; Grade A+, Kelleher 2013). The I‐QOL contains 22 items, each with a 5‐point Likert‐type response scale yielding a total score of 0 to 100, with the higher scores representing greater QoL. Castro 2008 reported the total score after treatment, while Sar 2009 only reported change from baseline (thus a positive value for change from pre‐ to post‐treatment represents a deterioration in QoL).
Lower‐grade symptoms and condition‐specific QoL measures are listed below and are presented in Appendix 4 and Appendix 5.
-
B‐FLUTS: used by Bø 1999.
-
The Social Activity Index: Bø 1999 reported a symptom score that addressed activity limitation (difficulty with certain activities and functions) in nine social situations.
-
Sandvik's Incontinence Severity Index (ISI) for female UI: reported by Diokno 2010.
-
York Incontinence Perceptions Scale (YIPS): used by Firra 2013.
-
Leakage Index: reported by Bø 1999.
-
Urine leakage score: Kim 2011b reported a urine leakage score based on a self‐reported one week urinary diary. There was no information on the psychometric properties of this instrument.
-
UI score: Yoon 2003 reported on a UI score calculated from a 5‐point Likert‐type scale regarding severity of leakage with 18 prespecified activities associated with urine loss. There was no information on the psychometric properties of this instrument.
Secondary outcomes – participant‐reported measures
Longer‐term symptomatic cure and improvement (six months to one year after end of treatment; more than one year after end of treatment)
Most of the trials evaluated cure or cure and improvement immediately after the treatment period. Only two trials evaluated cure in the medium‐term, which was nine months (Henalla 1989) and seven months (Kim 2011b) after treatment.
No trials evaluated cure or improvement one year or more after the end of treatment.
One trial evaluated symptoms and UI‐specific QoL using UDI‐6 and IIQ questionnaires nine months after the end of treatment (Sran 2016).
Satisfaction and need for further treatment
Three trials reported on participant‐perceived satisfaction following the intervention (Bø 1999; Burgio 1998; Castro 2008), while two reported on the number of women needing further treatment (Bø 1999; Burgio 1998).
Self‐efficacy
One trial reported UI‐specific self‐efficacy using the Geriatric Self‐Efficacy Index for Urinary Incontinence (GSE‐UI), which assesses self‐efficacy to prevent unwanted urine loss among postmenopausal women (Sran 2016). It contains 12 questions proposed for geriatric women with UI, with scores ranging from 0 to 120 and higher scores indicating higher self‐efficacy. It has established validity, reliability and responsiveness to change in elderly women with UI (Tannenbaum 2009; Appendix 6). One trial reported on the need for the use of aids (Asklund 2017; Appendix 7).
Participant‐reported quantification of symptoms
Number of leakage episodes (in 24 hours)
Fourteen of the trials used diaries to collect data on leakage episodes for:
-
two days (Yoon 2003);
-
three days (Bø 1999; Celiker Tosun 2015; Firra 2013; McLean 2013; Sar 2009);
-
four days (Wells 1999);
-
seven days (Asklund 2017; Castro 2008; Lagro‐Janssen 1991a; Leong 2015; Sran 2016); and
-
14 days (Burgio 1998; Burns 1993).
Yoon 2003 collected these data but did not report them directly. Rather, they reported leakage per 48 hours as an incontinence score. Sar 2009 reported mean change from baseline, while Wells 1999 reported means without a measure of dispersion. To enable comparison between trials, the data were presented as number of leakage episodes in 24 hours.
Number of micturitions during the day (frequency) or during the night (nocturia)
Four trials reported on number of micturition during the day (Celiker Tosun 2015; Diokno 2010; Firra 2013; Yoon 2003), while three trials reported on frequency per night (Celiker Tosun 2015; Diokno 2010; Yoon 2003).
Clinicians' measures
Pad and paper towel testing in a short test (up to one hour) or long test (24 hours) (grams of urine lost) and number cured or improved based on pad weights in short clinic‐based pad test
Thirteen trials reported data on pad and paper towel tests.
-
Ten trials used clinic‐based short pad tests (Aksac 2003; Bidmead 2002; Bø 1999; Castro 2008; Celiker Tosun 2015; Henalla 1989; Henalla 1990; McLean 2013; Pereira 2011; Yoon 2003).
-
In addition to the short pad test, one trial used a 24‐hour home‐based pad test (Bø 1999).
-
One trial used a paper towel test (Miller 1998).
-
Two further trials reported only a 24‐hour pad test (Diokno 2010; Sran 2016).
Aside from differences in the type of test, trialists also presented their data differently. Data were usually categorised (such as cured, improved, not improved) or reported as a mean with SD. The former data were used to report the number of women with objective cure or improvement of incontinence, while the latter were reported as grams of urine lost.
Quality of life (not condition‐specific)
General health status measures
Two trials reported non‐condition‐specific QoL data (Bø 1999; Burgio 1998). Burgio 1998 used the Hopkins Symptom Checklist for psychological distress with 90 items and a total score (Global Severity Index) (Derogatis 1983). Bø 1999 used the Norwegian version of the Quality of Life Scale (QoLS‐N) to assess general health and QoL prior to and after the intervention (Wahl 1998).
One trial used the Rosenberg self‐esteem questionnaire (Kargar Jahromi 2013).
For further details, see Appendix 6.
Sexual function or problems
One trial reported the effect of PFMT on UI during intercourse and in terms of interference with sexual satisfaction (Bø 1999).
Adverse effects
Seven trials reported on adverse effects (Bø 1999; Burgio 1998; Castro 2008; Kargar Jahromi 2013; Lagro‐Janssen 1991a; Solberg 2016; Sran 2016).
Measure of likely moderator variables
Measures of pelvic floor muscle function
-
Three trials used ultrasound (Carneiro 2010; Celiker Tosun 2015; McLean 2013).
-
Seven trials used perineometry to measure vaginal squeeze pressure (Aksac 2003; Beuttenmuller 2010; Bø 1999; Celiker Tosun 2015; Firra 2013; Pereira 2011; Yoon 2003).
-
Nine trials used digital palpation (Aksac 2003; Beuttenmuller 2010; Carneiro 2010; Castro 2008; Celiker Tosun 2015; Diokno 2010; Miller 1998; Pereira 2011; Wells 1999).
-
Four trials used vaginal electromyography (Bertotto 2017; Burns 1993; Carneiro 2010; Wells 1999).
Measures of adherence
Twelve trials attempted to measure adherence to PFMT at home using either exercise or training diaries (Asklund 2017; Bidmead 2002; Bø 1999; Burns 1993; Castro 2008; Kim 2007; Kim 2011b; Leong 2015; Solberg 2016; Sran 2016; Wells 1999), or self‐reported adherence (Lagro‐Janssen 1991a). Five trials attempted to measure attendance at exercise sessions (Kim 2007; Kim 2011b; Leong 2015; Solberg 2016; Sran 2016), with only one study reporting attendance on the control group (for education sessions) (Sran 2016). Results are detailed in Appendix 3.
Excluded studies
Full details of the 33 excluded studies are given in the Characteristics of excluded studies.
Risk of bias in included studies
Figure 2 and Figure 3 summarise the results of the risk of bias analysis.

Risk of bias summary: review authors' judgements about each risk of bias item for each included study.

Risk of bias graph: review authors' judgements about each risk of bias item presented as percentages across all included studies.
Due to the brevity of reporting, it was difficult to assess the two trials that were published as conference abstracts (Bidmead 2002; Henalla 1990). Fifteen of the trials were small, with fewer than 25 women per comparison group (Aksac 2003; Bertotto 2017; Diokno 2010; Ferreira 2014; Firra 2013; Henalla 1990; Hofbauer 1990; Kargar Jahromi 2013; McLean 2013; Miller 1998; Pereira 2011; Sar 2009; Solberg 2016; Sran 2016; Yoon 2003). Ten were of moderate size, with around 25 to 50 per group (Beuttenmuller 2010; Bø 1999; Burns 1993; Carneiro 2010; Castro 2008; Henalla 1989; Kim 2007; Kim 2011a; Lagro‐Janssen 1991a; Leong 2015). The other five allocated more than 50 women per group (Asklund 2017; Burgio 1998; Celiker Tosun 2015; Kim 2011b; Wells 1999). One trial randomised participants in a 2:1 ratio, with 40 in the PFMT group and 20 in the control group (Bidmead 2002). There were no large or very large trials. Eleven trials reported on a priori power calculation (Asklund 2017; Bø 1999; Castro 2008; Celiker Tosun 2015; Firra 2013; Kim 2007; Kim 2011b; Leong 2015; McLean 2013; Sar 2009; Sran 2016).
Allocation
Random sequence generation
Seventeen trials generated a genuine random sequence (e.g. computer generation of random numbers, block size) (Asklund 2017; Bertotto 2017; Bø 1999; Burgio 1998; Burns 1993; Castro 2008; Celiker Tosun 2015; Diokno 2010; Ferreira 2014; Kim 2007; Kim 2011a; Kim 2011b; Leong 2015; McLean 2013; Miller 1998; Solberg 2016; Sran 2016). Thirteen trials stated only that women were allocated at random, with no further description (Aksac 2003; Beuttenmuller 2010; Bidmead 2002; Carneiro 2010; Firra 2013; Henalla 1989; Henalla 1990; Hofbauer 1990; Kargar Jahromi 2013; Pereira 2011; Sar 2009; Wells 1999; Yoon 2003).
The abstract of one study stated that women were randomly allocated to comparison groups, but the methods section of the same paper reported that women were "consecutively assigned" (Lagro‐Janssen 1991a). Therefore, it appears this was a quasi‐randomised trial rather than a randomised trial and was at high risk of bias for this domain.
Allocation concealment
Ten trials reported allocation concealment adequately (Asklund 2017; Bertotto 2017; Bø 1999; Castro 2008; Celiker Tosun 2015; Kim 2011a; Kim 2011b; Leong 2015; Solberg 2016; Sran 2016). For 20 trials, insufficient information meant it was not clear if allocation was adequately concealed (Aksac 2003; Beuttenmuller 2010; Bidmead 2002; Burgio 1998; Burns 1993; Carneiro 2010; Diokno 2010; Ferreira 2014; Firra 2013; Henalla 1989; Henalla 1990; Hofbauer 1990; Kargar Jahromi 2013; Kim 2007; McLean 2013; Miller 1998; Pereira 2011; Sar 2009; Wells 1999; Yoon 2003). One trial had inadequate allocation concealment (alternate allocation), which was considered to be quasi‐randomised and at high risk of allocation concealment (Lagro‐Janssen 1991a).
Blinding
Blinding of participants and personnel (performance bias)
Given the nature of PFMT it is difficult, and often impossible, to blind the treatment provider and participants during treatment. We rated all trials as unclear for this domain as it is not feasible to blind the participants or care providers. We specified in the 'Risk of bias' tables any in inactive interventions given to the control group in an effort to reduce performance bias.
Blinding of outcome assessment (detection bias)
Twelve trials reported using blinded outcome assessors (Bidmead 2002; Bø 1999; Burgio 1998; Burns 1993; Castro 2008; Celiker Tosun 2015; Diokno 2010; Kim 2011b; Lagro‐Janssen 1991a; Miller 1998; Sran 2016; Yoon 2003).
In 15 trials, the authors did not report sufficient information to conclude that the outcome assessment was blinded (Aksac 2003; Asklund 2017; Bertotto 2017; Beuttenmuller 2010; Carneiro 2010; Ferreira 2014; Henalla 1989; Henalla 1990; Hofbauer 1990; Kargar Jahromi 2013; Kim 2007; Kim 2011a; McLean 2013; Solberg 2016; Wells 1999).
The last four trials reported that the outcome assessors were not blinded to treatment assignment (Firra 2013; Leong 2015; Pereira 2011; Sar 2009).
Incomplete outcome data
There were no dropouts or loss to follow‐up in three trials (Ferreira 2014; Leong 2015; Miller 1998). In six trials it appeared there were no dropouts, but this was not clearly stated in the trial reports (Aksac 2003; Beuttenmuller 2010; Carneiro 2010; Henalla 1989; Henalla 1990; Hofbauer 1990). Twenty‐two trials reported attrition, dropouts or losses to follow‐up. In these trials the proportion was:
-
less than 10% in five (Asklund 2017; Burns 1993; Celiker Tosun 2015; Kargar Jahromi 2013; Kim 2007; Kim 2011a; Kim 2011b; Lagro‐Janssen 1991a; Sran 2016);
-
11% to 15% in six (Bertotto 2017; Bø 1999; Burgio 1998; Castro 2008; Diokno 2010; Firra 2013; McLean 2013; Pereira 2011; Yoon 2003);
-
more than 20% in two (Bidmead 2002; Sar 2009); and
-
nearly 50% in two others (Solberg 2016; Wells 1999).
The proportion of withdrawals or loss to follow‐up was higher in the control group in five trials (Bertotto 2017; Burgio 1998; Firra 2013; Sar 2009; Solberg 2016), and in the intervention group in one trial (Celiker Tosun 2015). There were no clear differences in the other trials. In most trials the cause of the differential dropout was not thought to be significantly related to the intervention, but for one case there was differential dropout from the groups (Sar 2009). Five of 22 women were excluded from the control group analysis as they received other treatment for their incontinence and this was not reflected in the analysis of the remaining 17 women.
Selective reporting
It was unclear if there was selective reporting of the outcomes in most trials because the protocols were not available for most of the older studies. Therefore, we considered risk of bias to be low when it was clear that the published report included all expected outcomes. Two trials did not report all expected outcomes in the results section (Ferreira 2014; Henalla 1990). One trial reported all expected outcomes narratively in the results section but without any supporting data (Bidmead 2002).
Other potential sources of bias
Baseline comparability
Twenty‐three trials were comparable at baseline for all important outcomes and demographic characteristics that might predict outcomes such as symptom severity or duration (Aksac 2003; Asklund 2017; Bertotto 2017; Beuttenmuller 2010; Bidmead 2002; Bø 1999; Burgio 1998; Burns 1993; Carneiro 2010; Castro 2008; Ferreira 2014; Henalla 1989; Kargar Jahromi 2013; Kim 2007; Kim 2011a; Kim 2011b; Lagro‐Janssen 1991a; McLean 2013; Miller 1998; Pereira 2011; Sar 2009; Sran 2016; Yoon 2003). Three trials did not give enough information to assess baseline comparability between groups (Henalla 1990; Hofbauer 1990; Wells 1999). Finally, five trials reported a statistically significant difference between the PFMT and control groups (Celiker Tosun 2015; Diokno 2010; Firra 2013; Leong 2015; Solberg 2016). Differences were reported for age, with the PFMT group being older than the control group in one trial (Diokno 2010), and marginally younger in another (Leong 2015, P = 0.06); number of micturitions during the day (Leong 2015), and during the night (Celiker Tosun 2015), with the PFMT group having higher number of micturition episodes during the day and during the night; and severity of impact on QoL, with the PFMT group reporting lower (Celiker Tosun 2015), and higher (Leong 2015), IIQ scores. For one trial, groups were different for the primary outcome (ICIQ‐UI Short Form), with the PFMT group reporting lower severity of symptoms than the control group at baseline (Solberg 2016).
Analysis by intention‐to‐treat, attrition and dropout
Full intention‐to‐treat analysis requires that all participants are analysed in the group to which they were randomly assigned whether they adhered to treatment or not, crossed over to other treatments, or withdrew (Ferguson 2002). However, for the purpose of this review we have accepted the results as presented in the reports for those participants who provided outcome data at any time point, unless there was evidence of differential dropout from the groups. This was only the case in one trial, but we were unable to adjust the data (Sar 2009).
It was not clear if any other included study met the above definition/criteria for intention‐to‐treat, but four stated that the primary analysis was by intention‐to‐treat (Asklund 2017; Bidmead 2002; Burgio 1998; Sran 2016), while another stated that intention‐to‐treat analysis did not alter the findings of the primary analysis (Bø 1999). We have assumed that, in the absence of information to the contrary, all the trials analysed the participants in their assigned groups, with the exception of Sar 2009, as noted above.
Eight trials reported outcome data for all randomised participants (i.e. there appeared to be no dropouts) (Aksac 2003; Carneiro 2010; Ferreira 2014; Henalla 1989; Henalla 1990; Hofbauer 1990; Leong 2015; Miller 1998).
Five trials reported data only for those participants who reached outcome time points, but there was no evidence of differential dropout from the groups (Bertotto 2017; Diokno 2010; Kim 2011a; Kim 2011b; Pereira 2011).
One trial provided insufficient information to form an opinion on intention‐to‐treat analysis because the numbers at the outcome time points were not provided (Beuttenmuller 2010).
Effects of interventions
See: Summary of findings for the main comparison Pelvic floor muscle training compared to control for stress urinary incontinence in women; Summary of findings 2 Pelvic floor muscle training compared to control for urinary incontinence (all types) in women; Summary of findings 3 Pelvic floor muscle training compared to control for urgency urinary incontinence in women
Thirty‐one RCTs or quasi‐randomised trials that compared PFMT (933 women) with no treatment, placebo, sham or other non‐active control treatments (884 women) were eligible for inclusion in this review. Four trials did not contribute any data suitable for meta‐analysis (Bidmead 2002; Ferreira 2014; Miller 1998; Wells 1999). In the 27 trials contributing data, the two comparison groups comprised 793 women in the PFMT group and 762 women in the comparison group.
In the following, as reflected by the subgroups in the forest plots, we presented the results for individual outcomes separately for the four incontinence subgroups: SUI (18 trials), UUI (one trial), MUI (one trial) and UI of all types (nine trials). Where available, we included subgroup data such as for participants with SUI from trials in the last category in the relevant diagnostic category.
Readers should note that when referring to the forest plots for some of the analyses, the right‐hand side of the plot favours PFMT (Analysis 1.1; Analysis 1.2; Analysis 1.13; Analysis 1.14; Analysis 1.17; Analysis 1.18; Analysis 1.25; Analysis 1.26). For the remaining analyses, the left‐hand side of the plot favours PFMT (Analysis 1.3; Analysis 1.4; Analysis 1.5; Analysis 1.6; Analysis 1.7; Analysis 1.8; Analysis 1.9; Analysis 1.10; Analysis 1.11Analysis 1.12; Analysis 1.15; Analysis 1.16; Analysis 1.19; Analysis 1.20; Analysis 1.21; Analysis 1.22; Analysis 1.23Analysis 1.24; Analysis 1.27; Analysis 1.28). This decision was made to keep interpretation of the forest plots clinically intuitive.
When a study measured an outcome but the data could not be included in the analysis for some reason, we noted this and briefly discussed the consistency with the usable data. Data in 'Other data' tables are only briefly discussed to give an indication of whether the findings were broadly consistent or not.
Primary outcomes
Participant‐reported measures
Symptomatic cure of urinary incontinence at the end of treatment
Six trials reported data on participant‐reported cure of symptoms: four included women with SUI alone (Bø 1999; Hofbauer 1990; Kim 2007; Kim 2011a), and three included women with all types of incontinence (Burgio 1998; Kim 2011a; Kim 2011b). SUI subgroup data were available from Kim 2011a, which appears in both diagnostic categories. This outcome was not reported by the single trials for UUI or MUI. Although the CIs for most trials reporting data for SUI alone or all types of incontinence were wide, all trials found that women assigned PFMT were more likely to report that they were cured (Analysis 1.1).
Stress urinary incontinence alone
Women assigned PFMT were eight times more likely to report cure of symptoms than controls (46/82 (56%) with PFMT versus 5/83 (6%) with control; RR 8.38, 95% CI 3.68 to 19.07; 4 trials, 165 women; I² = 0%; high‐quality evidence; Analysis 1.1.1).
Urinary incontinence (all types)
The three trials which included women with all types of UI showed a significant result favouring PFMT (50/144 (35%) with PFMT versus 9/146 (6%) with control; RR 5.34, 95% CI 2.78 to 10.26; 3 trials, 290 women; I² = 74%; moderate‐quality evidence; Analysis 1.1.4). There was substantial statistical heterogeneity (I² = 74%), although there was agreement in the direction of effect in all three individually, favouring PFMT. The findings still favoured PFMT even when a random‐effects model was used (RR 7.50, 95% CI 1.03 to 54.63). Visual inspection of the forest plot suggested a smaller effect size in Burgio 1998, while the effect size appeared similar in the two remaining trials (i.e. the magnitude of the benefit was uncertain but the analysis suggested consistency in the direction of effect). A possible explanation of this difference in treatment effect may come from the percentage of women with urgency symptoms, which was higher in Burgio 1998 than in the other two trials.
Symptomatic cure or improvement of urinary incontinence at the end of treatment
Five trials contributed outcome data for cure or improvement of symptoms: three included women with SUI alone (Asklund 2017; Bø 1999; Lagro‐Janssen 1991a), and two included women with all types of UI (Burgio 1998; Diokno 2010). The single trials for UUI or MUI did not report this outcome. All five reported that PFMT was better than control interventions.
Stress urinary incontinence alone
Women assigned PFMT were six times more likely to report cure or improvement than women assigned control (88/119 (74%) with PFMT versus 14/123 (11%) with control; RR 6.33, 95% CI 3.88 to 10.33; 3 trials, 242 women; I² = 43%; moderate‐quality evidence; Analysis 1.2.1).
Urinary incontinence (all types)
Women assigned PFMT were twice as likely to report cure or improvement than women assigned control (58/86 (67%) with PFMT versus 23/80 (29%) with control; RR 2.39, 95% CI 1.64 to 3.47; 2 trials, 166 women; I² = 0%; moderate‐quality evidence; Analysis 1.2.4).
Wells 1999 reported information on cure or improvement with no difference between treatment groups, but the data were not suitable for meta‐analysis (no raw data available). Leong 2015 reported on participant perception of improvement on a visual analogue scale (0 to 10: higher scores = better outcome): this favoured PFMT (MD 7.30, 95% CI 6.84 to 7.76; 55 women; Analysis 1.18.4).
Symptom‐ and condition‐specific quality of life measures
Grade A UI symptoms and QoL measures are presented in the forest plots. Eight out of nine different measures of QoL specific to the effect of UI were in favour of PFMT in women with SUI, MUI and all types of UI (Analysis 1.3; Analysis 1.4; Analysis 1.5; Analysis 1.7; Analysis 1.8; Analysis 1.9; Analysis 1.10; Analysis 1.11; Analysis 1.12). Evidence of higher QoL following PFMT was not evident in the three trials that reported the King's Health Questionnaire general health score in women with SUI, but this may be because measures of general health are less sensitive to changes in continence (Beuttenmuller 2010; Carneiro 2010; Pereira 2011; Analysis 1.6).
In the King's Health Questionnaire, which measures the impact of incontinence after treatment, there was considerable statistical heterogeneity (I² = 76%). When a random‐effects model was used there was no evidence of a difference between treatment groups, although all trials had the same direction of effect and their CIs included clinically important differences (Analysis 1.4). Visual inspection of the forest plot suggested a larger effect size in Pereira 2011, while the effect size appeared similar in the two remaining trials. A possible explanation of this difference in treatment effect may come from the intensity of the PFMT programme, which was higher in Pereira 2011 than in the two others. In the IIQ short form there was considerable statistical heterogeneity (I² = 99%) and, although all trials were on the same side of the forest plot, we decided not to combine them in a meta‐analysis considering that the baseline comparability for the IIQ short form score was at high risk of bias in both trials (Celiker Tosun 2015; Leong 2015; Analysis 1.10.4).
Three trials reported lower grade measures of UI symptoms and QoL (Bø 1999; Diokno 2010; Firra 2013). Their effects are given in detail in Appendix 4.
Secondary outcomes
Participant‐reported measures
Longer‐term symptomatic cure and improvement
There was limited information from low‐ to moderate‐quality trials indicating that the benefit of PFMT seemed to persist after treatment stopped for up to one year for cure in women with all types of UI (23/59 (38.9%) with PFMT versus 1/61 (1.6%) with control; RR 23.78, 95% CI 3.32 to 170.49; Analysis 1.13; Kim 2011b), and for cure and improvement in women with SUI only (14/26 (53.8%) with PFMT versus 0/25 (0%) with control; RR 27.93, 95% CI 1.75 to 444.45; Analysis 1.14; Henalla 1989). The CIs in both trials were wide and hence these results need further confirmation.
Longer‐term symptom‐ and condition‐specific quality of life measures
One trial indicated that the benefit of PFMT seemed to persist (after treatment stopped) for up to one year in women with UI (all types) in regards to symptoms (UDI long form) (69.15 (SD 38.14) with PFMT versus 107.73 (SD 61.72) with control; MD –38.58, 95% CI –67.61 to –9.55; Analysis 1.15; Sran 2016), and UI‐specific QoL measures (IIQ long form) (20.44 (SD 30.71) with PFMT versus 62.35 (SD 98.54) with control; MD –41.91, 95% CI –83.20 to –0.62; Analysis 1.16; Sran 2016). One trial published one‐year and two‐year follow‐up reports with data on symptoms (ICIQ‐UI Short Form) and QoL (ICIQ‐LUTSqol) but only for the PFMT group (Asklund 2017).
Satisfaction
Three trials measured participant satisfaction with treatment for SUI (Bø 1999; Castro 2008), or for women with UI (all types) (Burgio 1998; Analysis 1.17). In trials which included women with SUI alone, women in the PFMT group were five times more likely to be satisfied with the intervention than women in the control group (36/51 (70.6%) with PFMT versus 7/54 (12.9%) with control; RR 5.32, 95% CI 2.63 to 10.74; Analysis 1.17.1). There was substantial statistical heterogeneity (I² = 74%) but the findings still favoured PFMT when a random‐effects model was used (RR 5.54, 95% CI 1.15 to 25.63). In the one trial with women with all types of UI, women assigned to PFMT were three times more likely to be satisfied with the intervention than women assigned to control (45/58 (78%) with PFMT versus 14/50 (28%) with control; RR 2.77, 95% CI 1.74 to 4.41; Analysis 1.17.4).
Need for further treatment
Two trials reported that more women needed further treatment in the control groups; one trial in women with SUI (RR 0.17, 95% CI 0.07 to 0.42; Bø 1999), and one in women with UI of all types (RR 0.19, 95% CI 0.10 to 0.36; Burgio 1998) (Analysis 1.19).
Perception of improvement
One trial measured perception of improvement in women with UI (all types) with women assigned to PFMT reporting perception of improvement seven times higher than women assigned to control (8.7 (1) with PFMT versus 1.4 (0.7) with control; MD 7.30, 95% CI 6.84 to 7.76; Analysis 1.18.4; Leong 2015).
Self‐efficacy
One trial measured self‐efficacy (Sran 2016). In women with SUI, the PFMT group presented higher self‐efficacy immediately after treatment and at one year compared to the control group (after treatment: MD 0.19, 95% CI 0.06 to 0.32; at one year: MD 0.15, 95% CI 0.02 to 0.28).
Participant‐reported quantification of symptoms
Number of leakage episodes (in 24 hours)
Twelve trials contributed to the forest plot: seven for the SUI subgroup (Asklund 2017; Bø 1999; Burns 1993; Castro 2008; Firra 2013; Lagro‐Janssen 1991a; McLean 2013); one for the UUI subgroup (Firra 2013); and four for the UI of all types subgroup (Burgio 1998; Celiker Tosun 2015; Leong 2015; Sran 2016). While the overall effect for the SUI subgroup showed a clinically important difference favouring PFMT, visual inspection of the forest plot suggested the effect size might be greater in the trial by Lagro‐Janssen 1991a, while the effect sizes appeared similar in the six remaining trials (Analysis 1.20.1). It was not clear why the data from Lagro‐Janssen 1991a were different from the other six trials in women with SUI, or the trials overall. A possible explanation of the greater treatment effect might be an inadequate concealment of the randomisation process. The point estimates in the other six trials were similar and all provided evidence of a clinically important reduction in leakage episodes following PFMT, except for one (Firra 2013). There was substantial heterogeneity (I² = 73%), but the findings still favoured PFMT with the random‐effects model used. Women with SUI assigned PFMT experienced about one leakage episode less in 24 hours compared to women assigned control (MD –1.23, 95% CI –1.78 to –0.68; 7 trials, 432 women; moderate‐quality evidence; Analysis 1.20.1). For women with UUI, one trial favoured PFMT over control (0.77 (SD 0.97) with PFMT versus 2.6 (SD 0.33) with control; MD –1.83, 95% CI –2.65 to –1.01; 12 women; low‐quality evidence; Analysis 1.20.2; Firra 2013). Similarly, according to four trials, women with UI of all types assigned to PFMT experienced about one less leakage episode in 24 hours compared to women assigned to control (MD –1.00, 95% CI –1.37 to –0.64; 349 women; moderate‐quality evidence; Analysis 1.20.4).
Number of micturitions during the day (frequency)
Four trials reported data on number of micturitions during the day (frequency) (Celiker Tosun 2015; Diokno 2010; Firra 2013; Yoon 2003). One trial reported on frequency for women with SUI (MD –0.60, 95% CI –3.09 to 1.89; Analysis 1.21.1; Firra 2013), and UUI (MD –0.24, 95% CI –3.43 to 2.95; Analysis 1.21.2; Firra 2013) separately, without a statistically significant difference between groups. In three trials, women assigned PFMT with all types of UI reported about two fewer micturitions per day than women assigned control (MD –2.32, 95% CI –3.21 to –1.43; Analysis 1.21.4; Celiker Tosun 2015; Diokno 2010; Yoon 2003).
Number of micturitions during the night (nocturia)
For the number of micturitions during the night, in three trials there was no evidence of a difference between the PFMT and control groups and the CI was wide (MD –0.03, 95% CI –0.46 to 0.40; Analysis 1.22.4; Celiker Tosun 2015; Diokno 2010; Yoon 2003).
Of interest might be the fact that five trials reported other leakage outcomes rather than the number of leakages or number of micturitions (one leakage index, two leakage scores, number of urgency episodes and urine leakage at one year) (Bø 1999; Celiker Tosun 2015; Kim 2011b; Sran 2016; Yoon 2003). These are reported in detail in Appendix 5.
Clinicians' measures
Pad and paper towel tests short (up to one hour) or long (24 hours) urine loss at the end of treatment
Up to one hour
Four trials reported urine loss on pad tests in women with SUI (Bø 1999; Castro 2008; McLean 2013; Pereira 2011), and two in women with UI (all types) (Celiker Tosun 2015; Yoon 2003). Women with SUI in the PFMT groups lost significantly less urine on the up to one hour pad tests (MD –4.22 g, 95% CI –6.56 to –1.88; 185 women; moderate‐quality evidence; Analysis 1.23.1). There was statistical considerable heterogeneity (I² = 78%), but the finding still favoured PFMT if a random‐effect model was used (MD –9.71 g, 95% CI –18.92 to –0.50). Visual inspection of the forest plot suggested that the effect size might be greater in one trial (Bø 1999). One possible explanation for this difference would be the variation among test protocols. Bø 1999 used a 60‐second pad test in which the participants were required to run on the spot for 30 seconds and then jump with legs in subsequent adduction and abduction (jumping jacks) at a rate of 132 beats/minute. For the other three trials, the pad test protocol appeared to be more similar, varying from 30 minutes to one hour, in which the participants were asked to do different circuits, including walking, running, jumping and coughing (Castro 2008; McLean 2013; Pereira 2011). For women with unspecified UI, the PFMT groups also reported less urine loss than the control groups (MD –3.72 g, 95% CI –5.46 to –1.98; 2 trials, 146 women; moderate‐quality evidence; Analysis 1.23.4).
Over 24 hours
One trial reported urine loss on a 24‐hour pad test with women with SUI (Bø 1999), and two trials with women with UI of all types (Diokno 2010; Sran 2016). There was no difference between PFMT and control on the 24‐hour test for the two subgroups (SUI or all types of UI) (Analysis 1.24). One trial reported urine loss on a 24‐hour pad test after one‐year follow‐up, favouring PFMT (MD –30.50, 95% CI –55.97 to –5.03; Sran 2016; Appendix 8).
Number cured or improved based on pad weights in short clinic‐based pad test at the end of treatment
When urine leakage was objectively assessed based on the number of women who had dry pads (short pad test), women with SUI were more likely to be cured in the PFMT groups (number cured: 38/71 (53.5%) with PFMT versus 4/64 (6.3%) with control; RR 7.50, 95% CI 2.89 to 19.47; Analysis 1.25.1), and similarly for cure or improvement (41/54 (75.9%) with PFMT versus 2/42 (4.8%) with control; RR 8.22, 95% CI 3.17 to 21.28; Analysis 1.26.1).
Four trials reported pad or paper towel tests in other ways or reported data where the MD was not estimable (Aksac 2003; Bidmead 2002; Diokno 2010; Miller 1998). These data are given in detail in Appendix 8. The data were generally in agreement with the findings above.
Quality of life (not condition specific)
General health status measures
Validated measures were used to assess generic QoL (Bø 1999), psychological distress (Burgio 1998), and self‐esteem (Kargar Jahromi 2013). There was no statistically significant difference between PFMT and control groups in either women with SUI or women with all types of UI for generic QoL or psychological distress. Women with SUI in the PFMT group presented higher self‐esteem after treatment compared to the control group (MD 5.28, 95% CI 2.71 to 7.85; Appendix 6).
Psychosocial outcome measures
None of the trials reported psychological outcome measures.
Sexual function or problems
One trial with women with SUI suggested that PFMT improved the women's sex life both generally and in terms of reduction of urine leakage during intercourse (Analysis 1.27; Analysis 1.28; Bø 1999).
Adverse effects
Seven trials specifically mentioned adverse events, and five did not report any in the PFMT group (Bø 1999; Burgio 1998; Castro 2008; Leong 2015, Sran 2016). Two trials reported adverse events with PFMT (Lagro‐Janssen 1991a; Solberg 2016). These were: worsening of incontinence symptoms after the first two treatments that disappeared as treatment continued (one woman; Solberg 2016), or pain (one woman); uncomfortable feeling during exercise (three women); and "not wanting to be continuously bothered with the problem" (two women; Lagro‐Janssen 1991a).
Measures of likely moderator variables
Measures of pelvic floor muscle function
Fifteen trials reported measures of pelvic floor muscle function (Aksac 2003; Bertotto 2017; Beuttenmuller 2010; Bø 1999; Burns 1993; Carneiro 2010; Castro 2008; Celiker Tosun 2015; Diokno 2010; Firra 2013; McLean 2013; Miller 1998; Pereira 2011; Wells 1999; Yoon 2003).
-
Three trials used ultrasound to measure morphological changes in pelvic floor muscles after treatment (Carneiro 2010; Celiker Tosun 2015; McLean 2013).
-
Seven trials used vaginal squeeze pressure to measure functional changes in pelvic floor muscles (Aksac 2003; Beuttenmuller 2010; Bø 1999; Celiker Tosun 2015; Firra 2013; Pereira 2011; Yoon 2003).
-
Nine trials used vaginal digital assessment to measure functional changes in pelvic floor muscles (Aksac 2003; Beuttenmuller 2010; Carneiro 2010; Castro 2008; Celiker Tosun 2015; Diokno 2010; Miller 1998; Pereira 2011; Wells 1999).
-
Four trials used electromyography (EMG) measures of pelvic floor muscle function (Bertotto 2017; Burns 1993; Carneiro 2010; Wells 1999).
Of the 15 trials, three did not report the data in such a way that it was possible to calculate the MD in PFM morphometry as measured by ultrasound, vaginal squeeze pressure, EMG activity or digital palpation score (Aksac 2003; McLean 2013; Wells 1999). Overall, there were no consistent patterns in measures of pelvic floor muscle function. Details are given in Appendix 9.
Measures of adherence
From diaries
Leong 2015 reported the highest rate of adherence to PFMT (99.4%) and Bø 1999 reported the second highest rate of adherence to PFMT (93%), both using exercise and training diaries. Further, Castro 2008 reported the third highest rate of adherence to PFMT (92%), using a training diary. Sran 2016 reported a high rate of adherence to PFMT using an exercise diary in the PFMT group with 33% (8/24) of participants completing 100% of the 12‐week home exercises and 33% (8/24) completing 70% to 99% of the home exercises programme. At one year, 78% (18/23) of the physiotherapy participants continued to do the PFM exercises using an exercise diary. Bidmead 2002 found that 75% of women assigned to PFMT had excellent (daily) or good (training more than three times per week) adherence to exercise on using exercise and training diaries. Women in the study by Lagro‐Janssen 1991a rated their adherence as excellent or good (62%), reasonable (20%), or poor or none (18%). Kim 2007 reported adherence to home PFMT only in the follow‐up period (after the intervention to the follow‐up assessment) using exercise and training diaries, with 30% of women doing their pelvic floor muscle exercises every day, two to three times per week in 45.5%, and once or less per week in 24.2%. In Kim 2011b, the same research group reported adherence using exercise and training diaries for home PFMT in the follow‐up period, again with 35.7% of women doing their pelvic floor muscle exercises every day, two to three times per week in 42.9% and once or less per week in 21.4%. Wells 1999 reported a greater exercise frequency in the treatment group at the beginning of the trial, although no raw data were available to support this finding. Asklund 2017 was able to compute the completion of each PFMT exercise and save in a statistics table in the application, reporting that 41.0% (25/61) had performed PFMT daily.
From attendance at appointments
Five trials attempted to measure attendance at exercise sessions (Burns 1993; Castro 2008; Kim 2007; Leong 2015; Sran 2016). Four trials reported very good to excellent attendance rates at clinic appointments (70%, Kim 2007; 92%, Castro 2008; 92%, Sran 2016; 98%, Leong 2015), and the fifth did not present any data (Burns 1993).
Methods to increase adherence
Eight trials used adherence strategies to encourage participants to do their PFMT exercises (Asklund 2017; Bø 1999; Burns 1993; Celiker Tosun 2015; Diokno 2010; Kim 2007; Sar 2009; Solberg 2016). Sar 2009 used a telephone call to encourage participants and answer questions. Diokno 2010 used as reinforcement a two‐ to four‐week follow‐up which consisted of vaginal examination, measurement of pelvic floor muscle strength and a test measuring participants' ability to correctly perform the verbally instructed exercise programme. Burns 1993 used weekly and three‐ and six‐month telephone reminders for treatment appointments and weekly exercise reminder cards were mailed between visits. Bø 1999 used audiotape with verbal guidance for home training. Kim 2007 used a pamphlet illustrating the pelvic floor muscles and strengthening exercises. Two trials reported that participants were required to keep a training diary to maintain their motivation (Celiker Tosun 2015; Solberg 2016). There were no data on adherence. Asklund 2017 included adherence strategies in their application to promote adherence (reminder setting that was used by 83.6% (51/61) and the statistics function used by 86.9% (53/61)).
GRADE quality of evidence
'Summary of findings' tables were prepared separately for women with SUI at baseline (summary of findings Table for the main comparison), for women with all types of UI (SUI, UUI, MUI) (summary of findings Table 2), and for women with UUI (summary of findings Table 3). The findings of the review were supported in the tables but in all cases except one the quality of the evidence was downgraded. The exception was 'Participant perceived cure – stress urinary incontinence,' which was rated as high‐quality. This suggested that SUI was eight times more likely to be cured in this subgroup (RR 8.38, 95% CI 3.68 to 19.07; Analysis 1.1.1), which is a much higher estimate of success than suggested in the other subgroups or other outcomes. However, although the CI was wide and was derived from two small‐ and two moderate‐size trials, we can be confident that PFMT does improve outcomes.
Discusión
Esta revisión es una de una serie de revisiones del EMSP para la IU en la mujer y se debe considerar en dicho contexto. Otras revisiones consideraron si:
-
un tipo de EMSP era mejor que otro (Hay‐Smith 2011), o si la retroalimentación o la biorretroalimentación tuvieron alguna función (Herderschee 2011);
-
el EMSP fue mejor que otros tratamientos (p.ej. otras terapias físicas, fármacos y cirugía) (Lins 2014); y
-
si el agregado de EMSP a otras terapias agregó algún efecto beneficioso (Ayeleke 2015).
Una revisión separada consideró la función del EMSP en el tratamiento y la prevención de la incontinencia urinaria y fecal relacionada con el parto (Woodley 2017).
Resumen de los resultados principales
¿El entrenamiento de los músculos del suelo pélvico es mejor que ningún tratamiento, un placebo o un tratamiento de control?
De los 31 ensayos que consideraron esta pregunta, 27 informaron datos adecuados para el análisis de los resultados de interés.
Resolución sintomática de la incontinencia urinaria al final del tratamiento: en comparación con ningún tratamiento o con los tratamientos de control inactivos, las mujeres con IUE que estaban en los grupos de EMSP tuvieron ocho veces más probabilidades de informar la resolución (56% con EMSP versus 6% con control; RR 8,38; IC del 95%: 3,68 a 19,07; cuatro ensayos, 165 mujeres; evidencia de calidad alta; Análisis 1.1.1). Para las mujeres con cualquier tipo de IU, los grupos de EMSP tuvieron cinco veces más probabilidades de informar la resolución (35% con EMSP versus 6% con control; RR 5,34; IC del 95%: 2,78 a 10,26; tres ensayos; 290 mujeres; evidencia de calidad moderada; nálisis 1.1.4), aunque con heterogeneidad estadística considerable (I² = 74%). Sin embargo, cuando se utilizó un modelo de efectos aleatorios, los resultados aún favorecieron al EMSP. La inspección visual del diagrama de bosque indicó un tamaño del efecto más pequeño en un ensayo (RR 2,34; IC del 95%: 1,11 a 4,94; Burgio 1998), donde el componente de urgencia de la IU fue más frecuente que en los otros dos ensayos (RR 11,48; IC del 95%: 0,67 a 196,07; Kim 2011a; RR 26,88; IC del 95%: 3,77 a 191,79; Kim 2011b).
Resolución sintomática o mejoría de la incontinencia urinaria al final del tratamiento: en comparación con ningún tratamiento o con los tratamientos de control inactivos, las mujeres con IUE que estaban en los grupos de EMSP tuvieron seis veces más probabilidades de informar la resolución o la mejoría (74% con EMSP versus 11% con control; RR 6,33; IC del 95%: 3,88 a 10,33; tres ensayos, 242 mujeres; evidencia de calidad moderada; Análisis 1.2.1). Para las mujeres con cualquier tipo de IU, los grupos de EMSP tuvieron dos veces más probabilidades de informar la resolución o la mejoría que las mujeres en los grupos de control (67% con EMSP versus 29% con control; RR 2,39; IC del 95%: 1,64 a 3,47; dos ensayos; 166 mujeres; evidencia de calidad moderada; Análisis 1.2.4).
Cuando se informó, la CdV realacionada con la incontinencia también mejoró con la intervención activa de EMSP en mujeres con IUE, IUM y todos los tipos de IU (evidencia de calidad moderada). Las mujeres también estuvieron más satisfechas con el tratamiento activo, mientras que las mujeres en los grupos de control fueron más propensas a buscar tratamiento adicional.
Episodios de pérdida en 24 horas: El EMSP redujo los episodios de pérdida de orina en uno en las mujeres con IUE (DM 1,23 menor; IC del 95%: 1,78 menor a 0,68 menor; siete ensayos, 432 mujeres; evidencia de calidad moderada) y en las mujeres con todos los tipos de IU (DM 1,00 menor; IC del 95%: 1,37 menor a 0,64 menor; cuatro ensayos, 349 mujeres; evidencia de calidad moderada). La EMSP puede haber reducido los episodios de pérdida de orina en 1,8 en las mujeres con IUU (DM 1,83 menor; IC del 95%: 2,65 menor a 1,01 menor; un ensayo, 12 mujeres; evidencia de calidad baja).
Las mujeres asignadas al EMSP también perdieron cantidades más pequeñas en las pruebas clínicas cortas con protectores, evacuaron sus vejigas con menos frecuencia durante el día y sus resultados sexuales fueron mejores. Los eventos adversos fueron poco frecuentes y, en los dos ensayos que informaron alguno, fueron menores. Sin embargo, no hubo evidencia de un cambio en las medidas de la CdV, quizás debido a que las medidas de la salud general son menos sensibles a los cambios en el estado de continencia o debido a que no hubo evidencia suficiente.
Muchos ensayos apoyaron la mejoría en la función de los músculos del suelo pélvico como el mecanismo mediante el cual mejoró la IU. En general, la asistencia a las sesiones de tratamiento fue buena y las mujeres también estuvieron motivadas a practicar sus ejercicios del suelo pélvico durante el período de intervención. Sin embargo, solo tres ensayos presentaron información sobre la persistencia del efecto beneficioso a largo plazo, y la necesidad de tratamiento adicional como cirugía o fármacos para la incontinencia fue reducida.
Los resultados de la revisión recibieron un gran apoyo en las tablas "Resumen de los hallazgos", aunque la calidad de la mayor parte de la evidencia se redujo a moderada por razones metodológicas (Resumen de los hallazgos, tabla 1; Resumen de los hallazgos, tabla 2; Resumen de los hallazgos, tabla 3).
Para una actualización futura, se pretende revisar la lista de resultados de acuerdo con las guías Cochrane actuales. En primer lugar, todos los síntomas específicos de la IU y los datos de la CdV de los diferentes cuestionarios de grado A se transformarán en dos resultados, que se presentarán en los diagramas de bosque y no solo como un informe narrativo en las tablas de "Resumen de los hallazgos". Este hecho proporcionará una mejor visión general de los síntomas específicos de la IU y de los resultados de la calidad de vida, y reducirá el número de diagramas de bosque y apéndices.
Además, aunque se considera que la adherencia es una medida muy importante y se estimula a los autores a informar sobre la misma, la intención es eliminarla de la lista de resultados del EMSP. Finalmente, los resultados de la CdV no específica, los resultados de la adherencia y las evaluaciones de la función de los MSP, aunque son medidas muy importantes, se eliminarán de la lista de resultados, ya que no están directamente relacionados con el EMSP para la reducción de la IU.
Compleción y aplicabilidad general de las pruebas
Tipos de incontinencia
Aunque en el análisis se predeterminaron cuatro subgrupos clínicos para el tipo de IU inicial (IUE, IUU, IUM e IU de todos los tipos), la mayoría de los ensayos informaron datos sobre dos de ellos (IUE e IU de todos los tipos). Solo dos ensayos investigaron el efecto del EMSP versus control en los dos subgrupos restantes, uno en mujeres con IUU solamente y otro en mujeres con IUM solamente.
Además, las participantes se seleccionaron para los ensayos únicamente sobre la base del tipo de incontinencia, diagnosticada según los signos, los síntomas o la urodinámica. En teoría, las mujeres con rotura de los ligamentos o la fascia, avulsión parcial o completa de los MSP, o incluso con daño nervioso periférico grave, pueden haber respondido de manera diferente al EMSP que las mujeres sin defectos anatómicos tan importantes, lo que puede afectar la estimación del efecto del tratamiento. El uso de nuevas técnicas de imagenología puede mejorar la capacidad de los investigadores para proporcionar un diagnóstico más específico y utilizar una muestra más homogénea de participantes, o presentar sus datos de acuerdo con las mujeres que presentaron y no presentaron tales defectos (Dumoulin 2011).
Variación en las intervenciones
Hubo grandes variaciones en los programas de EMSP, como se indica en el Apéndice 3. Además, a menudo el régimen de ejercicios en los programas de EMSP domiciliarios y en los realizados en los consultorios se informó de manera incompleta. Fue difícil emitir juicios en cuanto a las similitudes y las diferencias entre los programas de entrenamiento y, por lo tanto, su efectividad relativa potencial. La inclusión de ensayos con una "dosis" de ejercicio subóptima podría afectar de forma negativa la estimación de las diferencias en el efecto del tratamiento. Aunque se ha recomendado la evaluación de las interacciones entre la calidad de los programas de ejercicio y sus efectos (Herbert 2005), no fue posible explorar este aspecto en esta revisión. Sin embargo, los ensayos más recientes informaron de regímenes de ejercicios de EMSP más acordes con la bibliografía sobre la teoría del entrenamiento de los músculos esqueléticos y la disfunción muscular del suelo pélvico, con protocolos de entrenamiento progresivo supervisado.
Resultados
Hubouna falta de algunos resultados secundarios importantes o los mismos se informaron en pocas ocasiones. Solo tres ensayos informaron sobre un seguimiento a plazo medio (menos de un año) y todos favorecieron al EMSP activo, pero con IC muy amplios (Análisis 1.13; Análisis 1.14). Aunque un ensayo nuevo proporcionó datos para el seguimiento a uno y dos años, solo estuvieron disponibles para un grupo (el grupo de EMSP). Existen razones éticas que pueden impedir el mantenimiento del grupo de control en un estado de ningún tratamiento y que pueden explicar esta falta de seguimiento a largo plazo. Se podría decir que la necesidad de tratamiento adicional (p.ej. el uso de otra intervención conservadora, pesarios, cirugía o fármacos) proporcionaría una medida robusta y objetiva del éxito final del tratamiento y se debería informar en los estudios futuros. Desafortunadamente, este resultado no se informó en los ensayos.
La adherencia al tratamiento (p.ej. realización de ejercicios de los músculos del suelo pélvico) solo se informó a corto plazo (durante la intervención) y en algunos ensayos no se informó en los grupos de control, por lo que no fue posible hacer comparaciones entre los grupos. Por lo tanto, no fue posible evaluar las interacciones entre el tamaño del efecto y la adherencia al tratamiento.
Calidad de la evidencia
Calidad de los ensayos e informe
En la revisión se incluyeron 31 ensayos en total, en su mayoría de tamaño pequeño a moderado, para la IUE y todos los subgrupos de la población con IU (1793 mujeres). Un ensayo contribuyó al subgrupo de IUU solamente (12 mujeres) y otro al subgrupo de IUM solamente (12 mujeres).
La principal limitación en el informe de los ensayos incluidos fue la falta de una descripción clara de los programas de EMSP. Otro problema fue la falta de seguimiento a largo plazo o de la necesidad de tratamiento adicional.
Los resultados fueron consistentes para la mayoría de los resultados y favorecieron al EMSP sobre el control. El único resultado que no fue consistentemente diferente entre las condiciones experimentales y de control fue la CdV genérica, aunque estas medidas pueden no ser lo suficientemente sensibles como para detectar cambios debido a la mejoría en la IU.
Tablas de "Resumen de los hallazgos" y criterios GRADE
Las razones principales para disminuir la calidad de la evidencia en las tablas de "Resumen de los hallazgos" fueron:
-
la generación de la secuencia aleatoria y la ocultación de la asignación estuvieron en riesgo alto o incierto en algunos ensayos;
-
la comparabilidad inicial tuvo un riesgo alto o incierto en algunos ensayos;
-
los resultados fueron imprecisos (heterogeneidad debido a la variación de los resultados, aunque en general favorecieron al EMSP); y
-
los resultados fueron imprecisos (por ser medidas autoinformadas).
Sesgos potenciales en el proceso de revisión
De los 31 ensayos incluidos, nueve estuvieron en riesgo alto de sesgo:
-
Diokno 2010 debido a sus diferencias en la comparabilidad inicial (especialmente con respecto a la edad; las pacientes del grupo de tratamiento eran mayores);
-
Ferreira 2014 por no informar sobre todos los resultados esperados en la sección de resultados;
-
Firra 2013 por la falta de cegamiento de la evaluación de los resultados, así como por las diferencias en la comparabilidad inicial (los grupos fueron diferentes solo en el subgrupo de IUU, y las pacientes del grupo de control presentaron una menor polaquiuria en el diario de tres días);
-
Henalla 1990 por no informar sobre todos los resultados esperados en la sección de resultados;
-
Lagro‐Janssen 1991a debido a la falta de aleatorización genuina y la ocultación inadecuada de la asignación;
-
Leong 2015 por la falta de cegamiento de la evaluación de los resultados y por las diferencias en la comparabilidad inicial (las pacientes del grupo de control eran mayores y presentaron puntuaciones más bajas en el IIQ Short Form – con menos impacto);
-
Pereira 2011 por la falta de cegamiento de la evaluación de los resultados;
-
Sar 2009 por el tratamiento con respecto a la deserción; y
-
Solberg 2016 por las diferencias en la comparabilidad inicial (las pacientes del grupo de EMSP presentaron una puntuación menor en el ICIQ‐UI Short Form), y por el sesgo de deserción, si se considera que casi la mitad de la muestra se perdió durante el seguimiento, sin un análisis de intención de tratar (intention‐to‐treat analysis).
Debido a la naturaleza de la intervención, que es una interacción compleja entre el terapeuta y el paciente, no fue posible el cegamiento de las partes, por lo que todos los ensayos se calificaron como en riesgo incierto para este dominio. También fue difícil evaluar los datos de resultado incompletos debido a que la mayoría de los ensayos no publicaron sus protocolos. Los ensayos se calificaron como en riesgo bajo de sesgo cuando los resultados esperados se presentaron en la sección de resultados. Solo Asklund 2017; Bertotto 2017; Leong 2015; Pereira 2011 y Sran 2016 publicaron un protocolo. Muchos ensayos no pudieron informar sobre el seguimiento a largo plazo, ni lo intentaron. En nueve ensayos los autores declararon que los grupos no tratados recibirían tratamiento después del final del ensayo (Asklund 2017; Bertotto 2017; Bidmead 2002; Burns 1993; Celiker Tosun 2015; Kim 2007; Miller 1998; Pereira 2011; Solberg 2016).
Se combinaron los datos de un grupo diverso de estudios. Este hecho puede repercutir de forma inevitable en la aplicabilidad de los hallazgos para la práctica. Finalmente, no fue posible utilizar la prueba de Egger para evaluar el sesgo de publicación en la versión actual de la revisión. Sin embargo, se planifica incluirla en las futuras actualizaciones cuando haya más de diez estudios por análisis de subgrupos.
Fuentes de heterogeneidad
Variabilidad de los regímenes de entrenamiento muscular del piso pelviano
Los programas de EMSP variaron considerablemente en cuanto a su contenido y su duración entre los ensayos (Apéndice 3). Además, el régimen de ejercicios de los programas de EMSP en los consultorios y en los domicilios a menudo se informó de manera incompleta. Por lo tanto, fue difícil emitir juicios en cuanto a las similitudes y diferencias entre las intervenciones y, por lo tanto, su efectividad relativa potencial. Sin embargo, aunque el protocolo de entrenamiento se describió de forma deficiente en muchos de los ensayos más antiguos (6/31 ensayos), los ensayos más recientes presentaron informes de regímenes de ejercicios con EMSP que estaban más en consonancia con la bibliografía sobre la teoría del entrenamiento de los músculos esqueléticos y la disfunción muscular del suelo pélvico, con ejercicios supervisados (26/31 ensayos) y progresivos (14/31 ensayos). La duración de los programas varió entre una semana y seis meses, aunque en la mayoría de los ensayos los programas variaron entre ocho y 12 semanas (20/31 ensayos). Por lo tanto, fue difícil evaluar el posible efecto fisiológico de los programas de ejercicio. La inclusión de ensayos con un régimen de ejercicios subóptimo junto con ensayos que tenían un régimen suficiente podría influir negativamente en la estimación agrupada del efecto del EMPP. Junto con el efecto fisiológico del ejercicio, también se requiere el apoyo a los aspectos conductuales del ejercicio. Habitualmente el apoyo conductual se proporciona mediante la supervisión del ejercicio, y su grado varió notablemente entre los ensayos. La mayoría de los ensayos proporcionaron clases de EMSP supervisadas al menos semanalmente (21/31). La menor supervisión consistió en no tener una interacción directa con un profesional sanitario (un ensayo) o en una sesión para confirmar una contracción correcta de los MSP antes del entrenamiento (tres ensayos). En la mayoría la media fue de 72 clases (tres clases por semana) durante seis meses (un ensayo).
Se ha recomendado evaluar la interacción entre la calidad y el efecto de la intervención, aunque hubo muy pocos ensayos para realizar un análisis de sensibilidad formal según la calidad de la intervención (Herbert 2005). Por lo tanto, no fue posible explorar este aspecto en esta revisión. En lugar de excluir o incluir ensayos sobre la base de la suficiencia del EMSP, o de la probabilidad de que se había realizado una comparación clara entre el EMSP y la condición de control, el enfoque preferido habría sido realizar un análisis de sensibilidad sobre la base de las características del programa de EMSP o la magnitud de la diferencia clínica entre las intervenciones con EMSP y los controles. Sin embargo, para que sea posible este enfoque se necesitarían más ensayos en cada una de las comparaciones de la revisión.
Variabilidad de las condiciones control
Las condiciones de control también fueron muy variables. Incluyeron ningún tratamiento (19 ensayos), un fármaco de placebo (un ensayo), estimulación eléctrica simulada (un ensayo) y una variedad de estrategias de intervención inactivas, como folletos educativos, clases de educación general o asesoramiento sobre modificaciones en el estilo de vida. Sin embargo, a menudo no estuvo claro si el grupo control recibió asesoramiento sobre el EMSP, o si hacían ejercicios de EMSP en el domicilio (ver Características de los estudios incluidos).
Acuerdos y desacuerdos con otros estudios o revisiones
Los resultados de esta actualización son consistentes con la versión anterior de esta revisión Cochrane (Dumoulin 2014), y con una monografía de la Heath Technology Assessment que investigó todos los métodos conservadores de tratamiento de la IUE (Imamura 2010).
Breve comentario económico
Para complementar la revisión sistemática principal de la eficacia de los ejercicios musculares del suelo pélvico en el tratamiento de la IU, se identificaron evaluaciones económicas que comparaban la intervención con placebo o un control simulado. Se identificó un análisis de utilidad de los costes (Sjostrom 2017, que fue un informe adicional de Asklund 2017; ver Características de los estudios incluidos y Apéndice 3 para obtener detalles de la intervención y el control). El análisis pretendió adoptar una perspectiva social en un horizonte temporal de un año. Los costes incluyeron los costes de implementar la aplicación y la pérdida de ingresos de las mujeres mientras hacían los ejercicios. Se excluyeron los costes del desarrollo de la aplicación. Los resultados se expresaron como puntuaciones del ICIQ‐UI Short Form y del ICIQ‐LUTSqol. Estas puntuaciones se mapearon a valores de utilidad mediante un índice basado en las preferencias. Los autores de la evaluación informaron que la aplicación que proporcionó instrucciones para el EMSP fue una alternativa de tratamiento de primera línea coste‐efectiva.
No se analizó de forma crítica la evaluación económica y no se intentó establecer conclusiones firmes o generales con respecto a los costes relativos o la eficiencia de las intervenciones de EMSP. Sin embargo, esta evaluación proporciona alguna evidencia de que el EMSP basado en aplicaciones es una estrategia promisoria para el tratamiento de la IU. Los usuarios finales de esta revisión deberán evaluar en qué medida los métodos y resultados de la evaluación económica pueden ser aplicables o transferibles a su propio entorno.
Consideraciones para la investigación futura
Los resultados de las investigaciones sobre la incontinencia serían mucho más útiles si los investigadores seleccionaran una medida de resultado primaria que fuera importante para las mujeres, eligieran medidas secundarias para cubrir una serie de dominios importantes y optaran por herramientas estandarizadas con validez, fiabilidad y capacidad de respuesta establecidas para medir los resultados. Un dominio que requiere especial atención en el futuro es el socioeconómico, ya que hasta la fecha se ha considerado de forma deficiente. Tres ensayos incluidos en la revisión preguntaron a las mujeres si deseaban un tratamiento adicional o estaban satisfechas con el resultado del tratamiento, o ambos. Preguntas como éstas tienen un mérito potencial, pero preguntar a las mujeres si su afección se resolvió o mejoró con el tratamiento puede no diferenciar las que mejoraron y no desean otra intervención de las que mejoraron pero no lo suficiente como para estar satisfechas con el resultado del tratamiento. Aunque mejoró en los ensayos más recientes, también hay margen para el uso de cuestionarios validados que evalúan la molestia o la angustia asociadas con los síntomas (p.ej. el Urogenital Distress Inventory, ICIQ‐LUTSqol) en lugar de los cuestionarios de salud general que son menos sensibles a los cambios en la continencia.
Es necesario prestar atención a la duración del seguimiento después del final del tratamiento supervisado. Como el objetivo del tratamiento es la continencia a largo plazo, sería apropiado que el resultado se midiera al menos un año después del final del tratamiento. Como el EMSP generalmente precede a otras opciones de tratamiento más invasivas como la cirugía, la proporción de mujeres satisfechas con el resultado del EMSP (y por cuánto tiempo lo seguirán estando) proporcionaría información esencial para las mujeres, los médicos y los planificadores de servicios.
Se podría mejorar el informe de los métodos y los datos. Algunos ensayos incluidos recopilaron datos para los resultados de interés pero no los informaron de manera útil (p.ej. estimaciones puntuales sin una medida de dispersión). También fue difícil evaluar una de las formas primarias de minimizar el riesgo de sesgo para la ocultación de la asignación, debido a que los métodos de aleatorización a menudo se describieron de manera deficiente. Se remite a los investigadores a las declaraciones CONSORT y CONSORT revisadas para acceder al estándar adecuado de presentación de los informes de los ensayos (Boutron 2008; Moher 2001).
En esencia, se necesita al menos un ensayo grande, pragmático, bien realizado e informado de forma explícita que compare el EMSP con un control para investigar la efectividad clínica y la relación coste‐efectividad a largo plazo (más de un año) del EMSP. Se debe agregar una medida de resultado importante a la resolución y la mejoría de la incontinencia: la necesidad de utilizar intervenciones adicionales (como pesarios, fármacos o cirugía) después del final de la intervención de EMSP.
Dicho ensayo podría reclutar a grupos separados de mujeres con síntomas de IUE, IUU o IU mixta sobre la base de la historia clínica y el examen físico, con un tamaño de la muestra basado en una diferencia clínicamente importante en la IU autoinformada y en los resultados de la calidad de vida específicos de la afección, y suficiente para el análisis de subgrupos según el tipo de IU. Se podrían utilizar procedimientos de estratificación o minimización para asegurar una distribución uniforme de las mujeres con diferentes tipos de IU en ambos brazos del ensayo.
Uno de los brazos del estudio consistiría en un programa supervisado de EMSP basado en una ciencia de ejercicios sólida con la confirmación de una CVMSP correcta, e incorporaría medidas de supervisión y adherencia apropiadas para promover el mantenimiento de la adquisición de conocimientos, habilidades de comportamiento y motivación (Dumoulin 2011). La elección del programa se debería comparar con las implicaciones de recursos de los programas individuales supervisados de forma intensiva y con el coste de oportunidad que representa. Se necesita un juicio clínico cuidadoso sobre qué tipo de programa se podría aplicar realmente en la práctica diaria y en los diferentes países con sus diferentes sistemas de prestación de asistencia sanitaria. El otro brazo del ensayo sería un tratamiento de control, por ejemplo una explicación de la anatomía y fisiología de la vejiga y el suelo pélvico, o asesoramiento sobre buenos hábitos de vaciamiento de la vejiga y el estilo de vida, con la misma explicación y asesoramiento en ambos brazos. Un ensayo de este tipo requeriría una financiación considerable y múltiples centros de reclutamiento. Un análisis económico formal y una evaluación del proceso (p.ej. para comprobar la fidelidad de la intervención) también sería una parte importante de un ensayo de este tipo.
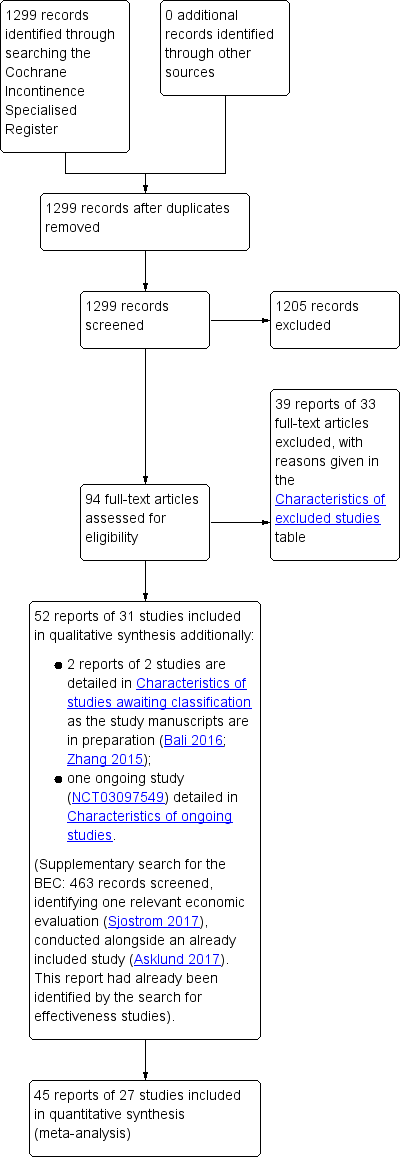
PRISMA study flow diagram.
Risk of bias summary: review authors' judgements about each risk of bias item for each included study.
Risk of bias graph: review authors' judgements about each risk of bias item presented as percentages across all included studies.
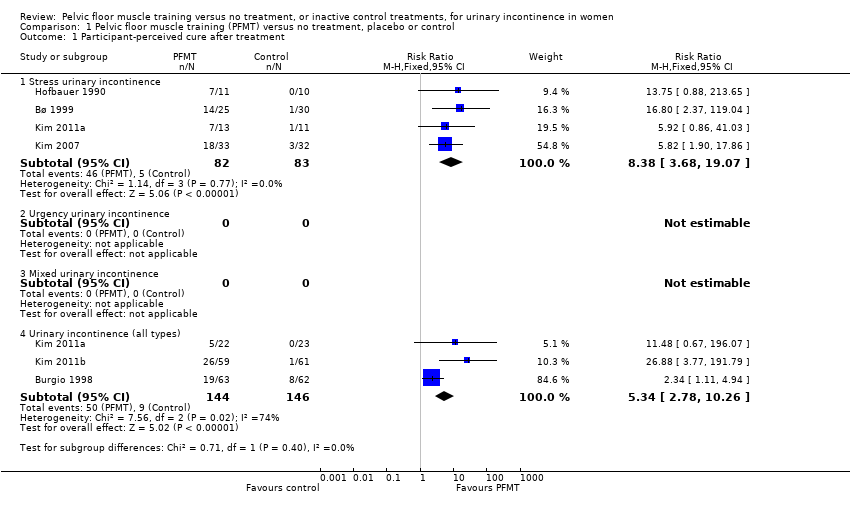
Comparison 1 Pelvic floor muscle training (PFMT) versus no treatment, placebo or control, Outcome 1 Participant‐perceived cure after treatment.

Comparison 1 Pelvic floor muscle training (PFMT) versus no treatment, placebo or control, Outcome 2 Participant‐perceived cure or improvement after treatment.

Comparison 1 Pelvic floor muscle training (PFMT) versus no treatment, placebo or control, Outcome 3 Urinary incontinence‐specific symptom measures (King's Health Questionnaire/severity measure after treatment).
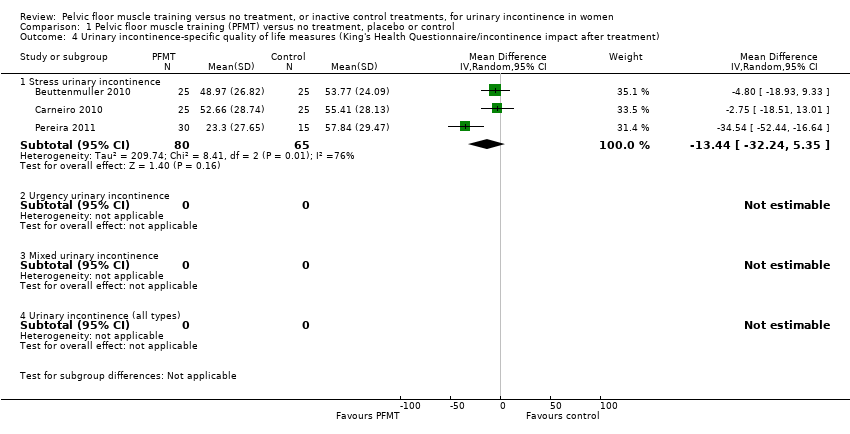
Comparison 1 Pelvic floor muscle training (PFMT) versus no treatment, placebo or control, Outcome 4 Urinary incontinence‐specific quality of life measures (King's Health Questionnaire/incontinence impact after treatment).

Comparison 1 Pelvic floor muscle training (PFMT) versus no treatment, placebo or control, Outcome 5 Urinary incontinence‐specific quality of life measures (King's Health Questionnaire/physical limitation).

Comparison 1 Pelvic floor muscle training (PFMT) versus no treatment, placebo or control, Outcome 6 Quality of life measures – not condition specific (King's Health Questionnaire/general health score).

Comparison 1 Pelvic floor muscle training (PFMT) versus no treatment, placebo or control, Outcome 7 Urinary incontinence‐specific symptom measures (Incontinence Modular Questionnaire Urinary Incontinence short form).

Comparison 1 Pelvic floor muscle training (PFMT) versus no treatment, placebo or control, Outcome 8 Urinary incontinence‐specific quality of life measures (Incontinence Modular Questionnaire Lower Urinary Tract Symptoms Quality of Life).

Comparison 1 Pelvic floor muscle training (PFMT) versus no treatment, placebo or control, Outcome 9 Urinary incontinence‐specific symptom measures (Urinary Distress Inventory short form).

Comparison 1 Pelvic floor muscle training (PFMT) versus no treatment, placebo or control, Outcome 10 Urinary incontinence‐specific quality of life measures (Incontinence Impact Questionnaire short form).

Comparison 1 Pelvic floor muscle training (PFMT) versus no treatment, placebo or control, Outcome 11 Urinary incontinence‐specific quality of life measures (Incontinence Impact Questionnaire long form).

Comparison 1 Pelvic floor muscle training (PFMT) versus no treatment, placebo or control, Outcome 12 Urinary incontinence‐specific quality of life measures (Incontinence of Quality of Life questionnaire).

Comparison 1 Pelvic floor muscle training (PFMT) versus no treatment, placebo or control, Outcome 13 Participant‐perceived cure at up to 1 year.

Comparison 1 Pelvic floor muscle training (PFMT) versus no treatment, placebo or control, Outcome 14 Participant‐perceived cure or improvement at up to 1 year.

Comparison 1 Pelvic floor muscle training (PFMT) versus no treatment, placebo or control, Outcome 15 Urinary incontinence‐specific symptom measures at 1 year (Urinary Distress Inventory long form).

Comparison 1 Pelvic floor muscle training (PFMT) versus no treatment, placebo or control, Outcome 16 Urinary incontinence‐specific quality of life measures at 1 year (Incontinence Impact Questionnaire long form).

Comparison 1 Pelvic floor muscle training (PFMT) versus no treatment, placebo or control, Outcome 17 Participant‐perceived satisfaction.

Comparison 1 Pelvic floor muscle training (PFMT) versus no treatment, placebo or control, Outcome 18 Perception of improvement (visual analogue scale).
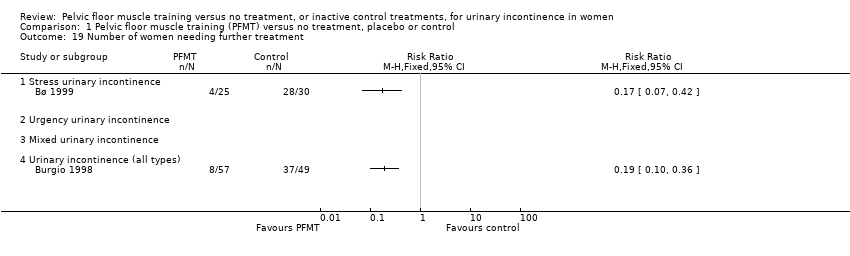
Comparison 1 Pelvic floor muscle training (PFMT) versus no treatment, placebo or control, Outcome 19 Number of women needing further treatment.

Comparison 1 Pelvic floor muscle training (PFMT) versus no treatment, placebo or control, Outcome 20 Number of leakage episodes in 24 hours.

Comparison 1 Pelvic floor muscle training (PFMT) versus no treatment, placebo or control, Outcome 21 Number of micturitions during the day (frequency).

Comparison 1 Pelvic floor muscle training (PFMT) versus no treatment, placebo or control, Outcome 22 Number of micturitions during the night (nocturia).

Comparison 1 Pelvic floor muscle training (PFMT) versus no treatment, placebo or control, Outcome 23 Short (up to 1 hour) pad test measured as grams of urine.

Comparison 1 Pelvic floor muscle training (PFMT) versus no treatment, placebo or control, Outcome 24 Long (24 hours) pad test measured as grams of urine.

Comparison 1 Pelvic floor muscle training (PFMT) versus no treatment, placebo or control, Outcome 25 Number cured on short pad test (objective) after treatment.

Comparison 1 Pelvic floor muscle training (PFMT) versus no treatment, placebo or control, Outcome 26 Number cured or improved on short pad test (objective) after treatment.

Comparison 1 Pelvic floor muscle training (PFMT) versus no treatment, placebo or control, Outcome 27 Number of women with sex life spoilt by urinary incontinence.
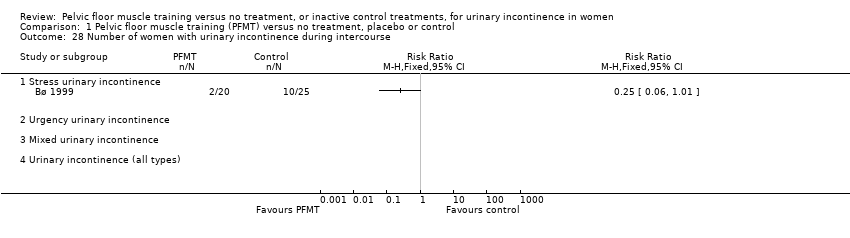
Comparison 1 Pelvic floor muscle training (PFMT) versus no treatment, placebo or control, Outcome 28 Number of women with urinary incontinence during intercourse.
| Pelvic floor muscle training compared to control for stress urinary incontinence in women | ||||||
| Patient or population: women with SUI | ||||||
| Outcomes | Anticipated absolute effects* (95% CI) | Relative effect | № of participants | Quality of the evidence | Comments | |
| Risk with no treatment, placebo or control | Risk with PFMT | |||||
| Participant‐perceived cure after treatment | 60 per 1000a | 505 per 1000 | RR 8.38 | 165 | ⊕⊕⊕⊕ | — |
| Participant‐perceived cure or improvement after treatment | 114 per 1000a | 720 per 1000 | RR 6.33 | 242 | ⊕⊕⊕⊝ | — |
| Number of leakage episodes in 24 hours | The mean number of leakage episodes in 24 hours ranged from 1.07 to 3.61 episodes | MD 1.23 episodes lower | — | 432 | ⊕⊕⊕⊝ | — |
| Short (up to 1 hour) pad test measured as grams of urine | The mean short (up to 1 hour) pad test measured as grams of urine ranged from 3.64 to 38.70 g | MD 9.71 g lower | — | 185 | ⊕⊕⊕⊝ | — |
| GRADE A UI‐specific symptom measures Treatment duration: 4–12 weeks | 3 different Grade A psychometrically robust symptom questionnaires were used by trialists including KHQ severity domain (3 trials; n = 65), ICIQ‐UI Short Form (3 trials; n = 98) and UDI (1 trial; n = 17). Participants in the PFMT group reported significant improvement in UI symptoms. | — | (7 RCTs) | ⊕⊕⊕⊝ | — | |
| GRADE A UI‐specific QoL measures Treatment duration: 6 weeks to 6 months | 5 different Grade A psychometrically robust QoL questionnaires were used by trialists including KHQ impact domain (3 trials; n = 65), KHQ physical limitation domain (3 trials; n = 65); ICIQ‐LUTSqol (1 trial; n = 60); IIQ (1 trial; n = 17); I‐QOL (1 trial; n = 24). Participants in the PFMT group reported significant improvement in UI‐specific QoL except for the KHQ impact after treatment; however with considerable heterogeneity (I² = 76%). | — | (6 RCTs) | ⊕⊕⊝⊝ | — | |
| *The risk in the intervention group (and its 95% confidence interval) is based on the assumed risk in the comparison group and the relative effect of the intervention (and its 95% CI). CI: confidence interval; I‐QOL: Incontinence of Quality of Life questionnaire; ICIQ‐LUTSqol: ICIQ Lower Urinary Tract Symptoms Quality of Life; ICIQ‐UI Short Form: Incontinence Modular Questionnaire Urinary Incontinence Short Form; IIQ: Incontinence Impact Questionnaire; KHQ: King's Health Questionnaire; MD: mean difference; PFMT: pelvic floor muscle training; QoL: quality of life; RCT: randomised controlled trial; RR: risk ratio; SUI: stress urinary incontinence; UDI: Urinary Distress Inventory; UI: urinary incontinence. | ||||||
| GRADE Working Group grades of evidence | ||||||
| aAssumed risk based on number of events. bLarge RR and confidence interval in two trials. cRandom sequence generation and allocation concealment at high risk in one trial (Lagro‐Janssen 1991a). dBlinding of outcome assessor unclear in one trial, for which the participants filled web‐based questionnaires with no face‐to‐face interaction with the researcher group (Asklund 2017). eRandom sequence generation and allocation concealment at high risk in one trial (Lagro‐Janssen 1991a). fAllocation concealment and incomplete outcome data unclear in three trials (Burns 1993; Firra 2013; McLean 2013). gBlinding of outcome assessment unclear in two trials (Asklund 2017; McLean 2013), and at high risk in one trial (Firra 2013). hBaseline comparability at high risk in one trial, but not for this outcome and not for this subgroup (urinary frequency for the urge incontinent subgroup only, Firra 2013). iConsiderable heterogeneity (I² higher than 75%). jRandom sequence generation unclear, and blinding of outcome assessment at high risk in one trial (Pereira 2011). kAllocation concealment and incomplete outcome data unclear in two trials (McLean 2013; Pereira 2011). lDowngraded for being considered a self‐reported measure. mRandom sequence generation, allocation concealment, incomplete data and blinding of outcome assessor unclear for one trial (Carneiro 2010). nAllocation concealment and incomplete outcome data unclear in one trial (Pereira 2011). oUnclear for bias except baseline comparability and selective reporting (Beuttenmuller 2010). | ||||||
| Pelvic floor muscle training compared to control for urinary incontinence (all types) in women | ||||||
| Patient or population: women with UI (all types) | ||||||
| Outcomes | Anticipated absolute effects* (95% CI) | Relative effect | № of participants | Quality of the evidence | Comments | |
| Risk with no treatment, placebo or control | Risk with PFMT | |||||
| Participant‐perceived cure after treatment | 62 per 1000a | 329 per 1000 | RR 5.34 | 290 | ⊕⊕⊕⊝ | — |
| Participant‐perceived cure or improvement after treatment | 288 per 1000a | 687 per 1000 | RR 2.39 | 166 | ⊕⊕⊕⊝ | — |
| Number of leakage episodes in 24 hours | The mean number of leakage episodes in 24 hours ranged from 1.06 to 2.50 | MD 1 episode lower | — | 349 | ⊕⊕⊕⊝ | — |
| Short (up to 1 hour) pad test measured as grams of urine | The mean short (up to 1 hour) pad test measured as grams of urine ranged from 5.10 g to 8.40 g | MD 3.72 g lower | — | 146 | ⊕⊕⊕⊝ | — |
| GRADE A UI‐specific symptom measures Treatment duration: 12 weeks | 1 Grade A psychometrically robust symptom questionnaire was used by 1 trial (n = 63); the UDI. Participant in the PFMT group reported significant improvement in UI‐specific symptoms. | — | (1 RCT) | ⊕⊕⊕⊝ | — | |
| GRADE A UI‐specific QoL measures Treatment duration: 6–12 weeks | 4 different Grade A psychometrically robust QoL questionnaires were used by trialists including the IIQ short form (2 trials; n = 91), the IIQ long form (1 trial; n = 24); I‐QOL (1 trial; n = 17). Participant in the PFMT group reported significant improvement in UI‐specific QoL. | — | (4 RCTs) | ⊕⊕⊝⊝ | — | |
| *The risk in the intervention group (and its 95% confidence interval) is based on the assumed risk in the comparison group and the relative effect of the intervention (and its 95% CI). CI: confidence interval; I‐QOL: Incontinence of Quality of Life questionnaire; IIQ: Incontinence Impact Questionnaire; KHQ: King's Health Questionnaire; MD: mean difference; PFMT: pelvic floor muscle training; QoL: quality of life; RCT: randomised controlled trial; RR: risk ratio; UDI: Urinary Distress Inventory; UI: urinary incontinence. | ||||||
| GRADE Working Group grades of evidence | ||||||
| aAssumed risk based on number of events. bAllocation concealment unclear in two trials (Burgio 1998 which was the biggest trial, and in Kim 2007). cIncomplete outcome data and blinding of outcome assessor unclear for two trials (Kim 2007; Kim 2011a). dConsiderable heterogeneity (I² higher than 75%). eAllocation concealment unclear in both trials (Burgio 1998; Diokno 2010). fBaseline comparability at high risk for one trial, with older participants in the PFMT group (Diokno 2010). gDowngraded for being considered a self‐reported measure. hAllocation concealment unclear in one trial (Burgio 1998). iIncomplete outcome data, blinding of participant and personnel, baseline comparability for a different outcome unclear in Celiker Tosun 2015 (PFMT group presenting lower impact on quality of life and higher night‐time urinary frequency). jRandom sequence generation and allocation concealment unclear in one trial (Yoon 2003). kOnly one trial of a small sample size. lBlinding of outcome assessor and baseline comparability at high risk in one trial (PFMT group older (P = 0.06) and presenting higher impact on quality of life (P = 0.06); Leong 2015). mHigh risk for incomplete outcome data and blinding of outcome assessment (Sar 2009). | ||||||
| Pelvic floor muscle training compared to control for urgency urinary incontinence in women | ||||||
| Patient or population: UUI in women | ||||||
| Outcomes | Anticipated absolute effects* (95% CI) | Relative effect | № of participants | Quality of the evidence | Comments | |
| Risk with no treatment, placebo or control | Risk with PFMT | |||||
| Participant‐perceived cure after treatment | — | — | — | (0 studies) | — | — |
| Participant‐perceived cure or improvement after treatment | — | — | — | (0 studies) | — | — |
| Number of leakage episodes in 24 hours | The mean number of leakage episodes in 24 hours was 2.60 | MD 1.83 episodes lower | — | 12 | ⊕⊕⊝⊝ | — |
| Short (up to 1 hour) pad test measured as grams of urine | — | — | — | (0 studies) | — | — |
| GRADE A UI‐specific symptom measures | — | — | (0 studies) | — | — | |
| GRADE A UI‐specific QoL measures | — | — | (0 studies) | — | — | |
| *The risk in the intervention group (and its 95% confidence interval) is based on the assumed risk in the comparison group and the relative effect of the intervention (and its 95% CI). CI: confidence interval; MD: mean difference; PFMT: pelvic floor muscle training; QoL: quality of life; RCT: randomised controlled trial; UI: urinary incontinence; UUI: urgency urinary incontinence. | ||||||
| GRADE Working Group grades of evidence | ||||||
| aBlinding of outcome assessor and baseline comparability for a different outcome at high risk (urinary frequency higher for the PFMT group, Firra 2013). bBlock randomisation not properly specified, and allocation concealment and attrition bias unclear (Firra 2013). | ||||||
| Outcome or subgroup title | No. of studies | No. of participants | Statistical method | Effect size |
| 1 Participant‐perceived cure after treatment Show forest plot | 6 | Risk Ratio (M‐H, Fixed, 95% CI) | Subtotals only | |
| 1.1 Stress urinary incontinence | 4 | 165 | Risk Ratio (M‐H, Fixed, 95% CI) | 8.38 [3.68, 19.07] |
| 1.2 Urgency urinary incontinence | 0 | 0 | Risk Ratio (M‐H, Fixed, 95% CI) | 0.0 [0.0, 0.0] |
| 1.3 Mixed urinary incontinence | 0 | 0 | Risk Ratio (M‐H, Fixed, 95% CI) | 0.0 [0.0, 0.0] |
| 1.4 Urinary incontinence (all types) | 3 | 290 | Risk Ratio (M‐H, Fixed, 95% CI) | 5.34 [2.78, 10.26] |
| 2 Participant‐perceived cure or improvement after treatment Show forest plot | 5 | Risk Ratio (M‐H, Fixed, 95% CI) | Subtotals only | |
| 2.1 Stress urinary incontinence | 3 | 242 | Risk Ratio (M‐H, Fixed, 95% CI) | 6.33 [3.88, 10.33] |
| 2.2 Urgency urinary incontinence | 0 | 0 | Risk Ratio (M‐H, Fixed, 95% CI) | 0.0 [0.0, 0.0] |
| 2.3 Mixed urinary incontinence | 0 | 0 | Risk Ratio (M‐H, Fixed, 95% CI) | 0.0 [0.0, 0.0] |
| 2.4 Urinary incontinence (all types) | 2 | 166 | Risk Ratio (M‐H, Fixed, 95% CI) | 2.39 [1.64, 3.47] |
| 3 Urinary incontinence‐specific symptom measures (King's Health Questionnaire/severity measure after treatment) Show forest plot | 3 | Mean Difference (IV, Fixed, 95% CI) | Subtotals only | |
| 3.1 Stress urinary incontinence | 3 | 145 | Mean Difference (IV, Fixed, 95% CI) | ‐13.14 [‐21.10, ‐5.18] |
| 3.2 Urgency urinary incontinence | 0 | 0 | Mean Difference (IV, Fixed, 95% CI) | 0.0 [0.0, 0.0] |
| 3.3 Mixed urinary incontinence | 0 | 0 | Mean Difference (IV, Fixed, 95% CI) | 0.0 [0.0, 0.0] |
| 3.4 Urinary incontinence (all types) | 0 | 0 | Mean Difference (IV, Fixed, 95% CI) | 0.0 [0.0, 0.0] |
| 4 Urinary incontinence‐specific quality of life measures (King's Health Questionnaire/incontinence impact after treatment) Show forest plot | 3 | Mean Difference (IV, Random, 95% CI) | Subtotals only | |
| 4.1 Stress urinary incontinence | 3 | 145 | Mean Difference (IV, Random, 95% CI) | ‐13.44 [‐32.24, 5.35] |
| 4.2 Urgency urinary incontinence | 0 | 0 | Mean Difference (IV, Random, 95% CI) | 0.0 [0.0, 0.0] |
| 4.3 Mixed urinary incontinence | 0 | 0 | Mean Difference (IV, Random, 95% CI) | 0.0 [0.0, 0.0] |
| 4.4 Urinary incontinence (all types) | 0 | 0 | Mean Difference (IV, Random, 95% CI) | 0.0 [0.0, 0.0] |
| 5 Urinary incontinence‐specific quality of life measures (King's Health Questionnaire/physical limitation) Show forest plot | 3 | Mean Difference (IV, Fixed, 95% CI) | Subtotals only | |
| 5.1 Stress urinary incontinence | 3 | 145 | Mean Difference (IV, Fixed, 95% CI) | ‐11.89 [‐20.55, ‐3.23] |
| 5.2 Urgency urinary incontinence | 0 | 0 | Mean Difference (IV, Fixed, 95% CI) | 0.0 [0.0, 0.0] |
| 5.3 Mixed urinary incontinence | 0 | 0 | Mean Difference (IV, Fixed, 95% CI) | 0.0 [0.0, 0.0] |
| 5.4 Urinary incontinence (all types) | 0 | 0 | Mean Difference (IV, Fixed, 95% CI) | 0.0 [0.0, 0.0] |
| 6 Quality of life measures – not condition specific (King's Health Questionnaire/general health score) Show forest plot | 3 | Mean Difference (IV, Fixed, 95% CI) | Subtotals only | |
| 6.1 Stress urinary incontinence | 3 | 145 | Mean Difference (IV, Fixed, 95% CI) | 1.81 [‐3.40, 7.03] |
| 6.2 Urgency urinary incontinence | 0 | 0 | Mean Difference (IV, Fixed, 95% CI) | 0.0 [0.0, 0.0] |
| 6.3 Mixed urinary incontinence | 0 | 0 | Mean Difference (IV, Fixed, 95% CI) | 0.0 [0.0, 0.0] |
| 6.4 Urinary incontinence (all types) | 0 | 0 | Mean Difference (IV, Fixed, 95% CI) | 0.0 [0.0, 0.0] |
| 7 Urinary incontinence‐specific symptom measures (Incontinence Modular Questionnaire Urinary Incontinence short form) Show forest plot | 4 | Mean Difference (IV, Fixed, 95% CI) | Subtotals only | |
| 7.1 Stress urinary incontinence | 3 | 196 | Mean Difference (IV, Fixed, 95% CI) | ‐3.45 [‐4.39, ‐2.52] |
| 7.2 Urgency urinary incontinence | 0 | 0 | Mean Difference (IV, Fixed, 95% CI) | 0.0 [0.0, 0.0] |
| 7.3 Mixed urinary incontinence | 1 | 12 | Mean Difference (IV, Fixed, 95% CI) | ‐3.97 [‐7.85, ‐0.09] |
| 7.4 Urinary incontinence (all types) | 0 | 0 | Mean Difference (IV, Fixed, 95% CI) | 0.0 [0.0, 0.0] |
| 8 Urinary incontinence‐specific quality of life measures (Incontinence Modular Questionnaire Lower Urinary Tract Symptoms Quality of Life) Show forest plot | 1 | Mean Difference (IV, Fixed, 95% CI) | Totals not selected | |
| 8.1 Stress urinary incontinence | 1 | Mean Difference (IV, Fixed, 95% CI) | 0.0 [0.0, 0.0] | |
| 8.2 Urgency urinary incontinence | 0 | Mean Difference (IV, Fixed, 95% CI) | 0.0 [0.0, 0.0] | |
| 8.3 Mixed urinary incontinence | 0 | Mean Difference (IV, Fixed, 95% CI) | 0.0 [0.0, 0.0] | |
| 8.4 Urinary incontinence (all types) | 0 | Mean Difference (IV, Fixed, 95% CI) | 0.0 [0.0, 0.0] | |
| 9 Urinary incontinence‐specific symptom measures (Urinary Distress Inventory short form) Show forest plot | 2 | Mean Difference (IV, Fixed, 95% CI) | Totals not selected | |
| 9.1 Stress urinary incontinence | 1 | Mean Difference (IV, Fixed, 95% CI) | 0.0 [0.0, 0.0] | |
| 9.2 Urgency urinary incontinence | 0 | Mean Difference (IV, Fixed, 95% CI) | 0.0 [0.0, 0.0] | |
| 9.3 Mixed urinary incontinence | 0 | Mean Difference (IV, Fixed, 95% CI) | 0.0 [0.0, 0.0] | |
| 9.4 Urinary incontinence (all types) | 1 | Mean Difference (IV, Fixed, 95% CI) | 0.0 [0.0, 0.0] | |
| 10 Urinary incontinence‐specific quality of life measures (Incontinence Impact Questionnaire short form) Show forest plot | 3 | Mean Difference (IV, Random, 95% CI) | Subtotals only | |
| 10.1 Stress urinary incontinence | 1 | 35 | Mean Difference (IV, Random, 95% CI) | ‐19.7 [‐30.63, ‐8.77] |
| 10.2 Urgency urinary incontinence | 0 | 0 | Mean Difference (IV, Random, 95% CI) | 0.0 [0.0, 0.0] |
| 10.3 Mixed urinary incontinence | 0 | 0 | Mean Difference (IV, Random, 95% CI) | 0.0 [0.0, 0.0] |
| 10.4 Urinary Incontinence (all types) | 2 | 176 | Mean Difference (IV, Random, 95% CI) | ‐7.54 [‐14.70, ‐0.39] |
| 11 Urinary incontinence‐specific quality of life measures (Incontinence Impact Questionnaire long form) Show forest plot | 1 | Mean Difference (IV, Fixed, 95% CI) | Totals not selected | |
| 11.1 Stress urinary incontinence | 0 | Mean Difference (IV, Fixed, 95% CI) | 0.0 [0.0, 0.0] | |
| 11.2 Urgency urinary incontinence | 0 | Mean Difference (IV, Fixed, 95% CI) | 0.0 [0.0, 0.0] | |
| 11.3 Mixed urinary incontinence | 0 | Mean Difference (IV, Fixed, 95% CI) | 0.0 [0.0, 0.0] | |
| 11.4 Urinary incontinence (all types) | 1 | Mean Difference (IV, Fixed, 95% CI) | 0.0 [0.0, 0.0] | |
| 12 Urinary incontinence‐specific quality of life measures (Incontinence of Quality of Life questionnaire) Show forest plot | 2 | Mean Difference (IV, Fixed, 95% CI) | Totals not selected | |
| 12.1 Stress urinary incontinence | 1 | Mean Difference (IV, Fixed, 95% CI) | 0.0 [0.0, 0.0] | |
| 12.2 Urgency urinary incontinence | 0 | Mean Difference (IV, Fixed, 95% CI) | 0.0 [0.0, 0.0] | |
| 12.3 Mixed urinary incontinence | 0 | Mean Difference (IV, Fixed, 95% CI) | 0.0 [0.0, 0.0] | |
| 12.4 Urinary incontinence (all types) | 1 | Mean Difference (IV, Fixed, 95% CI) | 0.0 [0.0, 0.0] | |
| 13 Participant‐perceived cure at up to 1 year Show forest plot | 1 | Risk Ratio (M‐H, Fixed, 95% CI) | Totals not selected | |
| 13.1 Stress urinary incontinence | 0 | Risk Ratio (M‐H, Fixed, 95% CI) | 0.0 [0.0, 0.0] | |
| 13.2 Urgency urinary incontinence | 0 | Risk Ratio (M‐H, Fixed, 95% CI) | 0.0 [0.0, 0.0] | |
| 13.3 Mixed urinary incontinence | 0 | Risk Ratio (M‐H, Fixed, 95% CI) | 0.0 [0.0, 0.0] | |
| 13.4 Urinary incontinence (all types) | 1 | Risk Ratio (M‐H, Fixed, 95% CI) | 0.0 [0.0, 0.0] | |
| 14 Participant‐perceived cure or improvement at up to 1 year Show forest plot | 1 | Risk Ratio (M‐H, Fixed, 95% CI) | Totals not selected | |
| 14.1 Stress urinary incontinence | 1 | Risk Ratio (M‐H, Fixed, 95% CI) | 0.0 [0.0, 0.0] | |
| 14.2 Urgency urinary incontinence | 0 | Risk Ratio (M‐H, Fixed, 95% CI) | 0.0 [0.0, 0.0] | |
| 14.3 Mixed urinary incontinence | 0 | Risk Ratio (M‐H, Fixed, 95% CI) | 0.0 [0.0, 0.0] | |
| 14.4 Urinary incontinence (all types) | 0 | Risk Ratio (M‐H, Fixed, 95% CI) | 0.0 [0.0, 0.0] | |
| 15 Urinary incontinence‐specific symptom measures at 1 year (Urinary Distress Inventory long form) Show forest plot | 1 | Mean Difference (IV, Fixed, 95% CI) | Totals not selected | |
| 15.1 Stress urinary incontinence | 0 | Mean Difference (IV, Fixed, 95% CI) | 0.0 [0.0, 0.0] | |
| 15.2 Urgency urinary incontinence | 0 | Mean Difference (IV, Fixed, 95% CI) | 0.0 [0.0, 0.0] | |
| 15.3 Mixed urinary incontinence | 0 | Mean Difference (IV, Fixed, 95% CI) | 0.0 [0.0, 0.0] | |
| 15.4 Urinary incontinence (all types) | 1 | Mean Difference (IV, Fixed, 95% CI) | 0.0 [0.0, 0.0] | |
| 16 Urinary incontinence‐specific quality of life measures at 1 year (Incontinence Impact Questionnaire long form) Show forest plot | 1 | Mean Difference (IV, Fixed, 95% CI) | Totals not selected | |
| 16.1 Stress urinary incontinence | 0 | Mean Difference (IV, Fixed, 95% CI) | 0.0 [0.0, 0.0] | |
| 16.2 Urgency urinary incontinence | 0 | Mean Difference (IV, Fixed, 95% CI) | 0.0 [0.0, 0.0] | |
| 16.3 Mixed urinary incontinence | 0 | Mean Difference (IV, Fixed, 95% CI) | 0.0 [0.0, 0.0] | |
| 16.4 Urinary incontinence (all types) | 1 | Mean Difference (IV, Fixed, 95% CI) | 0.0 [0.0, 0.0] | |
| 17 Participant‐perceived satisfaction Show forest plot | 3 | Risk Ratio (M‐H, Fixed, 95% CI) | Subtotals only | |
| 17.1 Stress urinary incontinence | 2 | 105 | Risk Ratio (M‐H, Fixed, 95% CI) | 5.32 [2.63, 10.74] |
| 17.2 Urgency urinary incontinence | 0 | 0 | Risk Ratio (M‐H, Fixed, 95% CI) | 0.0 [0.0, 0.0] |
| 17.3 Mixed urinary incontinence | 0 | 0 | Risk Ratio (M‐H, Fixed, 95% CI) | 0.0 [0.0, 0.0] |
| 17.4 Urinary incontinence (all types) | 1 | 108 | Risk Ratio (M‐H, Fixed, 95% CI) | 2.77 [1.74, 4.41] |
| 18 Perception of improvement (visual analogue scale) Show forest plot | 1 | Mean Difference (IV, Fixed, 95% CI) | Totals not selected | |
| 18.1 Stress urinary incontinence | 0 | Mean Difference (IV, Fixed, 95% CI) | 0.0 [0.0, 0.0] | |
| 18.2 Urgency urinary incontinence | 0 | Mean Difference (IV, Fixed, 95% CI) | 0.0 [0.0, 0.0] | |
| 18.3 Mixed urinary incontinence | 0 | Mean Difference (IV, Fixed, 95% CI) | 0.0 [0.0, 0.0] | |
| 18.4 Urinary incontinence (all types) | 1 | Mean Difference (IV, Fixed, 95% CI) | 0.0 [0.0, 0.0] | |
| 19 Number of women needing further treatment Show forest plot | 2 | Risk Ratio (M‐H, Fixed, 95% CI) | Totals not selected | |
| 19.1 Stress urinary incontinence | 1 | Risk Ratio (M‐H, Fixed, 95% CI) | 0.0 [0.0, 0.0] | |
| 19.2 Urgency urinary incontinence | 0 | Risk Ratio (M‐H, Fixed, 95% CI) | 0.0 [0.0, 0.0] | |
| 19.3 Mixed urinary incontinence | 0 | Risk Ratio (M‐H, Fixed, 95% CI) | 0.0 [0.0, 0.0] | |
| 19.4 Urinary incontinence (all types) | 1 | Risk Ratio (M‐H, Fixed, 95% CI) | 0.0 [0.0, 0.0] | |
| 20 Number of leakage episodes in 24 hours Show forest plot | 11 | Mean Difference (IV, Random, 95% CI) | Subtotals only | |
| 20.1 Stress urinary incontinence | 7 | 432 | Mean Difference (IV, Random, 95% CI) | ‐1.23 [‐1.78, ‐0.68] |
| 20.2 Urge urinary incontinence | 1 | 12 | Mean Difference (IV, Random, 95% CI) | ‐1.83 [‐2.65, ‐1.01] |
| 20.3 Mixed urinary incontinence | 0 | 0 | Mean Difference (IV, Random, 95% CI) | 0.0 [0.0, 0.0] |
| 20.4 Urinary incontinence (all types) | 4 | 349 | Mean Difference (IV, Random, 95% CI) | ‐1.00 [‐1.37, ‐0.64] |
| 21 Number of micturitions during the day (frequency) Show forest plot | 4 | Mean Difference (IV, Random, 95% CI) | Subtotals only | |
| 21.1 Stress urinary incontinence | 1 | 21 | Mean Difference (IV, Random, 95% CI) | ‐0.60 [‐3.09, 1.89] |
| 21.2 Urgency urinary incontinence | 1 | 12 | Mean Difference (IV, Random, 95% CI) | ‐0.24 [‐3.43, 2.95] |
| 21.3 Mixed urinary incontinence | 0 | 0 | Mean Difference (IV, Random, 95% CI) | 0.0 [0.0, 0.0] |
| 21.4 Urinary incontinence (all types) | 3 | 187 | Mean Difference (IV, Random, 95% CI) | ‐2.32 [‐3.21, ‐1.43] |
| 22 Number of micturitions during the night (nocturia) Show forest plot | 3 | Mean Difference (IV, Fixed, 95% CI) | Subtotals only | |
| 22.1 Stress urinary incontinence | 0 | 0 | Mean Difference (IV, Fixed, 95% CI) | 0.0 [0.0, 0.0] |
| 22.2 Urgency urinary incontinence | 0 | 0 | Mean Difference (IV, Fixed, 95% CI) | 0.0 [0.0, 0.0] |
| 22.3 Mixed urinary incontinence | 0 | 0 | Mean Difference (IV, Fixed, 95% CI) | 0.0 [0.0, 0.0] |
| 22.4 Urinary incontinence (all types) | 3 | 187 | Mean Difference (IV, Fixed, 95% CI) | ‐0.03 [‐0.46, 0.40] |
| 23 Short (up to 1 hour) pad test measured as grams of urine Show forest plot | 6 | Mean Difference (IV, Random, 95% CI) | Subtotals only | |
| 23.1 Stress urinary incontinence | 4 | 185 | Mean Difference (IV, Random, 95% CI) | ‐9.71 [‐18.92, ‐0.50] |
| 23.2 Urgency urinary incontinence | 0 | 0 | Mean Difference (IV, Random, 95% CI) | 0.0 [0.0, 0.0] |
| 23.3 Mixed urinary incontinence | 0 | 0 | Mean Difference (IV, Random, 95% CI) | 0.0 [0.0, 0.0] |
| 23.4 Urinary incontinence (all types) | 2 | 146 | Mean Difference (IV, Random, 95% CI) | ‐3.72 [‐5.46, ‐1.98] |
| 24 Long (24 hours) pad test measured as grams of urine Show forest plot | 3 | Mean Difference (IV, Fixed, 95% CI) | Subtotals only | |
| 24.1 Stress urinary incontinence | 1 | 55 | Mean Difference (IV, Fixed, 95% CI) | ‐27.5 [‐61.24, 6.24] |
| 24.2 Urgency urinary incontinence | 0 | 0 | Mean Difference (IV, Fixed, 95% CI) | 0.0 [0.0, 0.0] |
| 24.3 Mixed urinary incontinence | 0 | 0 | Mean Difference (IV, Fixed, 95% CI) | 0.0 [0.0, 0.0] |
| 24.4 Urinary incontinence (all types) | 2 | 89 | Mean Difference (IV, Fixed, 95% CI) | ‐5.89 [‐18.23, 6.44] |
| 25 Number cured on short pad test (objective) after treatment Show forest plot | 3 | Risk Ratio (M‐H, Fixed, 95% CI) | Subtotals only | |
| 25.1 Stress urinary incontinence | 3 | 135 | Risk Ratio (M‐H, Fixed, 95% CI) | 7.50 [2.89, 19.47] |
| 25.2 Urgency urinary incontinence | 0 | 0 | Risk Ratio (M‐H, Fixed, 95% CI) | 0.0 [0.0, 0.0] |
| 25.3 Mixed urinary incontinence | 0 | 0 | Risk Ratio (M‐H, Fixed, 95% CI) | 0.0 [0.0, 0.0] |
| 25.4 Urinary incontinence (all types) | 0 | 0 | Risk Ratio (M‐H, Fixed, 95% CI) | 0.0 [0.0, 0.0] |
| 26 Number cured or improved on short pad test (objective) after treatment Show forest plot | 3 | Risk Ratio (M‐H, Fixed, 95% CI) | Subtotals only | |
| 26.1 Stress urinary incontinence | 3 | 96 | Risk Ratio (M‐H, Fixed, 95% CI) | 8.22 [3.17, 21.28] |
| 26.2 Urgency urinary incontinence | 0 | 0 | Risk Ratio (M‐H, Fixed, 95% CI) | 0.0 [0.0, 0.0] |
| 26.3 Mixed urinary incontinence | 0 | 0 | Risk Ratio (M‐H, Fixed, 95% CI) | 0.0 [0.0, 0.0] |
| 26.4 Urinary incontinence (all types) | 0 | 0 | Risk Ratio (M‐H, Fixed, 95% CI) | 0.0 [0.0, 0.0] |
| 27 Number of women with sex life spoilt by urinary incontinence Show forest plot | 1 | Risk Ratio (M‐H, Fixed, 95% CI) | Totals not selected | |
| 27.1 Stress urinary incontinence | 1 | Risk Ratio (M‐H, Fixed, 95% CI) | 0.0 [0.0, 0.0] | |
| 27.2 Urgency urinary incontinence | 0 | Risk Ratio (M‐H, Fixed, 95% CI) | 0.0 [0.0, 0.0] | |
| 27.3 Mixed urinary incontinence | 0 | Risk Ratio (M‐H, Fixed, 95% CI) | 0.0 [0.0, 0.0] | |
| 27.4 Urinary incontinence (all types) | 0 | Risk Ratio (M‐H, Fixed, 95% CI) | 0.0 [0.0, 0.0] | |
| 28 Number of women with urinary incontinence during intercourse Show forest plot | 1 | Risk Ratio (M‐H, Fixed, 95% CI) | Totals not selected | |
| 28.1 Stress urinary incontinence | 1 | Risk Ratio (M‐H, Fixed, 95% CI) | 0.0 [0.0, 0.0] | |
| 28.2 Urgency urinary incontinence | 0 | Risk Ratio (M‐H, Fixed, 95% CI) | 0.0 [0.0, 0.0] | |
| 28.3 Mixed urinary incontinence | 0 | Risk Ratio (M‐H, Fixed, 95% CI) | 0.0 [0.0, 0.0] | |
| 28.4 Urinary incontinence (all types) | 0 | Risk Ratio (M‐H, Fixed, 95% CI) | 0.0 [0.0, 0.0] | |