Ventilación no invasiva con presión positiva (PPCVR o VNIPP a dos niveles) para el edema pulmonar cardiogénico
References
References to studies included in this review
References to studies excluded from this review
References to ongoing studies
Additional references
References to other published versions of this review
Characteristics of studies
Characteristics of included studies [ordered by study ID]
Jump to:
| Methods | Single centre randomised controlled trial, parallel design, unblinded, using ITT approach. No patients were lost to follow up. Setting: RICU or CCU. | |
| Participants | 129 participants. Causes: systolic, diastolic or valvular heart failure. | |
| Interventions | CPAP group. N=44. | |
| Outcomes |
| |
| Notes | ||
| Risk of bias | ||
| Bias | Authors' judgement | Support for judgement |
| Random sequence generation (selection bias) | Unclear risk | The method used was not reported. |
| Allocation concealment (selection bias) | Unclear risk | The method used was not reported. |
| Incomplete outcome data (attrition bias) | Low risk | |
| Selective reporting (reporting bias) | Low risk | |
| Detection bias | Unclear risk | Not reported. |
| Adherence to the intention‐to‐treat principle | Low risk | |
| Methods | Randomised controlled trial, parallel design, unblinded, using ITT approach. No patients were lost to follow up. Setting: ICU. | |
| Participants | 22 participants, with age 63.4±4.6 years in BILEVEL group and 64.3±5.6 in standard medical care group. All patients underwent cardiosurgery procedure (6 ‐ CABG, 16 ‐ valves replacement). Causes: HF, Mitral valve dysfunction and arrhythmias. | |
| Interventions | BILEVEL group: EPAP=5.1±0.3 cm H2O; e IPAP= 9.8±1.1 cmH2O. N=11. | |
| Outcomes |
| |
| Notes | Mask: full face mask. | |
| Risk of bias | ||
| Bias | Authors' judgement | Support for judgement |
| Random sequence generation (selection bias) | Unclear risk | The method used was not reported. |
| Allocation concealment (selection bias) | Unclear risk | The method used was not reported. |
| Incomplete outcome data (attrition bias) | Low risk | |
| Selective reporting (reporting bias) | Low risk | |
| Detection bias | Unclear risk | Not reported. |
| Adherence to the intention‐to‐treat principle | Low risk | |
| Methods | Single centre randomised controlled trial (used a computer‐generated random number sequence in closed envelopes with identification numbers that were stored in emergency room), parallel design, unblinded, using ITT approach. No patients were lost to follow up. Written consent was obtained from the patients' relatives at the start of the protocol. Setting: emergency department. | |
| Participants | 46 participants (23 males and 23 females), with age 77.3±7.3 years in BILEVEL group and 76.8±7 in CPAP group. Diagnosis criteria: bilateral rales , and typical findings of congestion on chest radiograph, without a history suggesting pulmonary aspiration or pneumonia, SaO2<90% with O2 mask>5l/min via reservoir face mask, dyspnoea, BR>30b/min, use accessory muscles or paradoxical abdominal motion in association with tachycardia, HR>100b/min, cardiac gallops. History: heart failure, coronary artery disease, diabetes, hypertension, COPD, chronic atrial fibrillation and chronic kidney failure. Causes: respiratory infections, hypertension, tachyarrhythmia, other. Excluded patients: patients required endotracheal intubation immediately or already intubated, presenting a respiratory or cardiac arrest, cardiogenic shock (SBP<90mmHg), or at the time of admission had an acute coronary syndrome, patients unresponsive, with diagnosis of pneumonia, agitated, and unable to cooperate or if they had any condition that precluded application of a face mask. | |
| Interventions | CPAP group: PEEP=10 cmH2O. N=22, TIME=103±45 minutes. | |
| Outcomes |
| |
| Notes | Mask: face mask. | |
| Risk of bias | ||
| Bias | Authors' judgement | Support for judgement |
| Random sequence generation (selection bias) | Low risk | |
| Allocation concealment (selection bias) | Low risk | |
| Incomplete outcome data (attrition bias) | Low risk | |
| Selective reporting (reporting bias) | Low risk | |
| Detection bias | Unclear risk | Not reported |
| Adherence to the intention‐to‐treat principle | Low risk | |
| Methods | Single centre randomised controlled trial (used a computer‐generated random number sequence in closed envelopes with identification numbers that were stored in emergency room), parallel design, unblinded, using ITT approach. No losses to follow up. Written consent was obtained from the patients' relatives at the start of the protocol. Setting: Niguarda Hospital Emergency Department ‐ Milan ‐ Italy. | |
| Participants | 36 participants (12 males and 24 females), with age 76.8±6.6 years in BILEVEL group and 76.8±6.9 in CPAP group. Diagnosis criteria: typical findings of congestion on chest radiograph and widespread rales without a history suggesting pulmonary aspiration or pneumonia, SaO2<90% with O2 mask >5l/min, dyspnoea, BR >30b/min, use accessory muscles or paradoxical abdominal motion in association with tachycardia, HR>100b/min, cardiac gallop. History: heart failure, acute myocardial infarction, diabetes, hypertension. Causes : respiratory infections, hypertension, tachyarrhythmia, myocardial infarction, others. Excluded patients: patients with PaCO2 <45mmHg, required endotracheal intubation or already intubated, presenting a respiratory or cardiac arrest, cardiogenic shock (SBP<90mmHg), severe renal failure, presenting clinical and history findings of chronic obstructive pulmonary disease or previously enrolled in other studies. | |
| Interventions | CPAP group: PEEP=10 cmH2O. N=18, TIME=220±82 minutes. | |
| Outcomes |
| |
| Notes | Mask: face mask. | |
| Risk of bias | ||
| Bias | Authors' judgement | Support for judgement |
| Random sequence generation (selection bias) | Low risk | |
| Allocation concealment (selection bias) | Low risk | |
| Incomplete outcome data (attrition bias) | Low risk | |
| Selective reporting (reporting bias) | Low risk | |
| Detection bias | Unclear risk | Not reported. |
| Adherence to the intention‐to‐treat principle | Low risk | |
| Methods | Single centre randomised controlled trial (random selection of a coloured cap), parallel design, unblinded, lack of intention‐to‐treat analysis confirmed on study assessment. Loss to follow up: no patients in standard medical care group and one patient in CPAP group. Patients or next‐of‐kin were aware through informed consent. Setting: emergency department or ward to the intensive care unit (ICU). | |
| Participants | 40 participants (13 males and 27 females), with age 75±6 years in standard medical care group and 76±6 in CPAP group. Diagnosis criteria: dyspnoea of sudden onset with typical finds on chest radiographs and widespread rales without a history suggesting pulmonary aspiration or infection, jugular venous pressure elevated and third heart sound. Causes: acute myocardial infarction, myocardial ischaemia, congestive heart failure. Excluded patients: acute myocardial infarction with shock, SBP<90mmHg, severe stenotic valvular disease, chronic airflow obstruction with known carbon dioxide retention. | |
| Interventions | CPAP group: PEEP= 10 cmH2O. N=19, TIME=9.3±4.9 hours. | |
| Outcomes |
| |
| Notes | Mask: face mask. | |
| Risk of bias | ||
| Bias | Authors' judgement | Support for judgement |
| Random sequence generation (selection bias) | High risk | |
| Allocation concealment (selection bias) | High risk | |
| Incomplete outcome data (attrition bias) | Low risk | |
| Selective reporting (reporting bias) | Low risk | |
| Detection bias | Unclear risk | Not reported |
| Adherence to the intention‐to‐treat principle | High risk | |
| Methods | Multicenter randomised controlled trial (2 university hospitals). Randomization procedure: random numbers produced by Microsoft Excel, assignments were concealed in an opaque envelope. Parallel design, unblinded, using ITT approach. No reported loss to follow up. Patients or next‐of‐kin were aware through informed consent, but in 17 cases, the patient gave verbal consent. Setting: emergency department. | |
| Participants | 60 participants (23 males and 37 females), with age 74.6±11.1 years in standard medical care group, 74.9±12.2 in CPAP group and 76±8.4 in BILEVEL group. Diagnosis criteria: BR >23 bpm, Rx consistent with pulmonary oedema, pH <7,35, widespread pulmonary crepitations and diaphoresis. History: heart failure, ischaemic heart disease, DM, Hypertension, COPD. Excluded patients: Hypotension (SBP<90mmHg), T>38oC, patients requiring thrombolysis for myocardial infarction or dialysis for renal impairment, patients with impaired consciousness or with dementia. | |
| Interventions | CPAP group: PEEP=10 cm H2O. N=20. | |
| Outcomes |
| |
| Notes | Mask: full face mask. | |
| Risk of bias | ||
| Bias | Authors' judgement | Support for judgement |
| Random sequence generation (selection bias) | Low risk | |
| Allocation concealment (selection bias) | Low risk | |
| Incomplete outcome data (attrition bias) | Low risk | |
| Selective reporting (reporting bias) | Low risk | |
| Detection bias | Unclear risk | Not reported |
| Adherence to the intention‐to‐treat principle | Low risk | |
| Methods | Multicenter randomised controlled trial (6 centres). Randomization procedure: randomisation computer‐generated; sealed envelopes were used to randomly assign patients to their treatment group. Parallel design, using ITT approach. Blindness only of the investigators. No patient were lost to follow‐up. Informed consent was obtained of the all patients. Setting: intensive care unit (ICU). | |
| Participants | 123 participants, but only a subgroup with 42 participants had CPO. Diagnosis criteria: acute respiratory insufficiency (PaO2/FiO2<300 with O2 =10l/min, bilateral lung infiltrates on a posteroanterior chest radiograph, randomisation within 3 hours after the criteria were first fulfilled. Because a cardiogenic mechanism contributing to the pulmonary oedema might have had a substantial influence on the study results, the randomisation was stratified based on whether there was an underlying cardiac disease. Causes: ischaemia, arrhythmias, fluid overload, hypertension, valvular disease, pneumonia, aspiration, systemic inflammatory response syndrome (SIRS), shock, other. Excluded patients: younger than 18 years, intubation was refused or contraindicated, history of COPD, acute respiratory acidosis (defined as a pH<7,30 and PaCO2 > 50 mmHg, systolic blood pressure less than 90 mmHg under optimal therapy (fluid repletion), ventricular arrhythmias, coma or seizures, life‐threatening hypoxaemia, use of epinephrine or norepinephrine, and the inability to clear copious airway secretions. | |
| Interventions | CPAP group: PEEP= 7,5 cmH2O with increase or decrease 2,5 cmH2O. N=22, TIME=6 hours or more. | |
| Outcomes |
| |
| Notes | Mask: full face mask. | |
| Risk of bias | ||
| Bias | Authors' judgement | Support for judgement |
| Random sequence generation (selection bias) | Low risk | |
| Allocation concealment (selection bias) | Low risk | |
| Incomplete outcome data (attrition bias) | Low risk | |
| Selective reporting (reporting bias) | Low risk | |
| Detection bias | Low risk | |
| Adherence to the intention‐to‐treat principle | Low risk | |
| Methods | Single centre randomised controlled trial (according to a random sequence previously generated from a table of random numbers, the assignments were placed in closed boxes, with identification numbers, stored in the HDU), parallel design, unblinded, lack of intention‐to‐treat analysis. Two patients were lost (Two patients refused) to follow up. Written consent was obtained from the patients. Setting: High Dependency Unit (HDU) of the Emergency Department. | |
| Participants | 52 participants (23 males and 29 females), with age 74.2±9.7 years in BILEVEL group and 76.7±9.2 in CPAP group. Diagnosis criteria: rapid onset of symptoms,severe dyspnoea at rest, respiratory rate 30 breaths/min, use of accessory respiratory muscles, oxygen saturation by pulse oximetry (Spo2) 90% with a fraction of inspired oxygen (Fio2) of 60% via a Venturi mask, radiologic findings of ACPE. Causes : hypertensive crisis, tachyarrhythmia, chronic Ischaemic cardiomyopathy, dilated cardiomyopathy and valvular heart disease. Excluded patients: acute coronary syndrome on hospital admission,18 haemodynamic instability (systolic BP 90 mm Hg with dopamine or dobutamine infusion 5 g/kg/min) or life‐threatening arrhythmias, need for immediate endotracheal intubation (respiratory arrest, bradypnoea, or gasping for air), inability to protect the airways, impaired sensorium (unconsciousness or agitation), inability to clear secretions, respiratory tract infection, recent oesophageal/gastric surgery, GI bleeding, facial deformities, hematologic malignancy or cancer with an Eastern Cooperative Oncology Group performance status 2, chronic respiratory failure necessitating long‐term oxygen therapy, diagnosis of myocardial infarction, pulmonary embolism, pneumonia, exacerbation of COPD, pneumothorax in the previous 3 months, and denial or refusal of intubation. | |
| Interventions | CPAP group: PEEP = 8.8±1.9 cmH2O. N = 27, TIME= 8.1±8.3 hours. | |
| Outcomes |
| |
| Notes | Mask: face mask. | |
| Risk of bias | ||
| Bias | Authors' judgement | Support for judgement |
| Random sequence generation (selection bias) | Low risk | |
| Allocation concealment (selection bias) | Low risk | |
| Incomplete outcome data (attrition bias) | Low risk | |
| Selective reporting (reporting bias) | Low risk | |
| Detection bias | Unclear risk | Not reported |
| Adherence to the intention‐to‐treat principle | High risk | |
| Methods | Multicenter (3 ‐ Italy) randomised controlled trial (according to a random sequence previously generated from a table of random numbers, the assignments were placed in closed boxes, each with an identification number and were stored in the ED), parallel design, unblinded, using intention‐to‐treat analysis. Written consent was obtained from patients’ next of kin if patients were unable to give informed consent due to the severity of their disease. Setting: Emergency Department. | |
| Participants | 80 adults participants with age 76.55±9.48 years in BILEVEL group and 77.25±9,17 in CPAP group, with acute respiratory failure due to severe ACPE. Diagnosis criteria: severe dyspnoea at rest, respiratory rate > 30 breaths/min, use of accessory respiratory muscles, PaO2/FiO2 < 200 despite oxygen via Venturi mask with a FiO2 of 60%, radiologic findings of ACPE. Causes : hypertensive crisis, dysrhythmias, UA/NSTEMI, respiratory infections. Exclusion criteria: STEMI (patients with unstable angina/Non‐ST elevation MI were included in the study protocol),haemodynamic instability (systolic arterial pressure 90 mmHg), need for immediate ETI (respiratory arrest, bradypnoea), Inability to protect the airways, impaired sensorium (severe agitation or unconsciousness), COPD, exacerbation, pulmonary embolism, pneumonia, recent oesophageal‐gastric surgery, gastrointestinal bleeding, facial deformities, hematological malignancy or cancer with ECOG performance status > 2. | |
| Interventions | CPAP group: PEEP = 8.88±1.77 cmH2O. N = 40, TIME = 8.46±7.14 hours. | |
| Outcomes |
| |
| Notes | Mask: face mask. | |
| Risk of bias | ||
| Bias | Authors' judgement | Support for judgement |
| Random sequence generation (selection bias) | Low risk | |
| Allocation concealment (selection bias) | Low risk | |
| Incomplete outcome data (attrition bias) | Unclear risk | Not reported if there were drop‐outs over the monitoring of patients. |
| Selective reporting (reporting bias) | High risk | |
| Detection bias | Unclear risk | Not reported |
| Adherence to the intention‐to‐treat principle | Low risk | |
| Methods | Multicenter (3 ‐ Spain), prospective, randomised (randomly allocated within 24‐hours, using a computer‐generated table for each centre), controlled trial, parallel‐group, using intention‐to‐treat analysis. No patient were lost to follow‐up. Informed consent was obtained in all cases. Setting: ICU. | |
| Participants | Group of patients with acute hypoxaemic respiratory failure whose sub‐group contained 30 patients with pulmonary oedema cardiogenic (10 males and 20 females), with age 76±9 years in standard medical care group and 71±13 in BILEVEL group. Diagnosis criteria: dyspnoea of sudden onset with physical findings consistent with pulmonary oedema, such as widespread rales with or without third heart sound, and typical findings of congestion on a chest x‐ray. Exclusion criteria: hypercapnia (PaCO2 of more than 45 mm Hg) on admission; need for emergency intubation; recent oesophageal, facial, or cranial trauma or surgery; severely decreased consciousness (a Glasgow coma score of 11 or less); severe haemodynamic instability despite fluid repletion and use of vasoactive agents; a lack of cooperation; tracheotomy or other upper airway disorders; severe ventricular arrhythmia or myocardial ischaemia; active upper gastrointestinal bleeding; an inability to clear respiratory secretions; and more than one severe organ dysfunction in addition to respiratory failure. | |
| Interventions | BILEVEL group. N=15. | |
| Outcomes |
| |
| Notes | Mask: face mask or nasal mask. | |
| Risk of bias | ||
| Bias | Authors' judgement | Support for judgement |
| Random sequence generation (selection bias) | Low risk | |
| Allocation concealment (selection bias) | Unclear risk | The method used was not reported. |
| Incomplete outcome data (attrition bias) | Low risk | |
| Selective reporting (reporting bias) | Unclear risk | Not submitted multiple planning outcomes reported on results. |
| Detection bias | Unclear risk | Not reported |
| Adherence to the intention‐to‐treat principle | Low risk | |
| Methods | Randomised controlled trial. Losses to follow up not reported. Informed consent not described. Setting: Cardiac Care Unit (CCU). | |
| Participants | 40 participants with age 80±7 in CPAP group and 76±9 in BILEVEL group.Diagnosis criteria: patients with acute cardiogenic pulmonary oedema. | |
| Interventions | CPAP group: PEEP = 8±2 cmH2O. N = 21. | |
| Outcomes |
| |
| Notes | ||
| Risk of bias | ||
| Bias | Authors' judgement | Support for judgement |
| Random sequence generation (selection bias) | Unclear risk | The method used was not reported. |
| Allocation concealment (selection bias) | Unclear risk | The method used was not reported. |
| Incomplete outcome data (attrition bias) | Unclear risk | Not reported if there were drop‐outs over the monitoring of patients. |
| Selective reporting (reporting bias) | Low risk | |
| Detection bias | Unclear risk | Not reported. |
| Adherence to the intention‐to‐treat principle | Low risk | |
| Methods | Single centre (France) randomised controlled trial (by balanced blocks of random numbers was provided by telephone using sealed opaque envelopes), parallel design, unblinded, not using ITT approach by Cochrane ‐ All patients after randomisation. Two patients (in the CPAP group) refused the ongoing use of their data once their condition stabilised and were not analysed. Informed consent was obtained from patients or their surrogates. Setting: out‐of‐hospital medical emergencies is the responsibility of the "Service d'Aide Médicale Urgente" (SAMU) and continued on ICU. | |
| Participants | 124 participants randomised, 122 analysed (52 males and 70 females), with age 79.3±10.5 years in standard medical care group and 79.4±10.7 in CPAP group. Inclusion criteria: 18 years or older with clinical symptoms of ACPE such as orthopnoea, diffuse crackles without evidence of pulmonary aspiration or infection, pulse oximetry (SpO2) less than 90% and a respiratory rate greater than 25 breaths per minute. Excluded patients: cardiovascular collapse or an impaired level of consciousness, acute myocardial infarction, or if they had an immediate need for intubation. Patient with a history of gastric surgery (b8 days) and patients vomiting were also excluded | |
| Interventions | CPAP group: PEEP= 10 cmH2O. N=60. | |
| Outcomes |
| |
| Notes | Mask: face mask. | |
| Risk of bias | ||
| Bias | Authors' judgement | Support for judgement |
| Random sequence generation (selection bias) | Low risk | |
| Allocation concealment (selection bias) | Low risk | |
| Incomplete outcome data (attrition bias) | Low risk | |
| Selective reporting (reporting bias) | Low risk | |
| Detection bias | Unclear risk | Not reported. |
| Adherence to the intention‐to‐treat principle | High risk | |
| Methods | Multicenter, open, prospective, randomised, controlled trial, parallel‐group trial with three treatment groups: | |
| Participants | 1156 participants, 56.9% were women, with age 79±9 years in standard medical care group and 78±10 in CPAP group and 77±10 in BILEVEL group. Diagnosis criteria: age of more than 16 years, a clinical diagnosis of acute cardiogenic pulmonary oedema, pulmonary oedema shown by a chest radiograph, a respiratory rate of more than 20 breaths per minute, and an arterial hydrogen ion concentration of greater than 45 nmol per litre (pH <7.35). Excluded patients: patients requirement for a lifesaving or emergency intervention, such as primary percutaneous coronary intervention; inability to give consent; or previous recruitment into the trial. | |
| Interventions | CPAP group: PEEP= 10±4 cmH2O. N=346. Time = 2.2±1.5hours. | |
| Outcomes |
| |
| Notes | Although the study reports that held ITT, analyses submitted have not included all randomised patients (follow‐up bias), as well as, it was not described as the total distribution of randomisation by group. Results were presented in the format completely different from other studies included, making impossible their inclusion in meta‐analyses (variables dicotômicas acute myocardial infarction and Intolerance to the allocated treatment not possessed N total to perform ITT or were analysed in times different from those envisaged in this review ‐ mortality and intubation in 7 or 30 days). Continuous variables were presented just as mean value of the difference between 0 and 1 hour after the intervention and not as mean and standard deviation. However the author, although asked, did not send the data in the format required to include in Meta‐analysis. | |
| Risk of bias | ||
| Bias | Authors' judgement | Support for judgement |
| Random sequence generation (selection bias) | Low risk | |
| Allocation concealment (selection bias) | Low risk | |
| Incomplete outcome data (attrition bias) | Low risk | |
| Selective reporting (reporting bias) | Low risk | |
| Detection bias | Low risk | |
| Adherence to the intention‐to‐treat principle | High risk | |
| Methods | Single centre randomised controlled trial (by balanced blocks using sealed envelopes), parallel design, unblinded, using ITT approach. No patients were lost to follow up. Informed consent was obtained of the patients. Setting: emergency department and continued in the high dependency unit. | |
| Participants | 58 participants (26 males and 32 females), with age 78±2 years in standard medical care group and 77±2 in CPAP group. Diagnosis criteria: acute onset of breathlessness, BR>20bpm, bilateral basal crackles or chest auscultation, Rx typical of pulmonary oedema. Causes: left ventricular systolic dysfunction and hypertensive crisis; the CPAP group had more severe disease with a slightly greater acidosis and hypercapnia. Excluded patients: patients with radiograph consistent with pneumonia or pneumothorax, or if they had received pre‐hospital treatment with intervention other than oxygen, diuretics or opiates. | |
| Interventions | CPAP group: PEEP= 7.5 cmH2O. N=27, TIME= minimum of 6 hours. | |
| Outcomes |
| |
| Notes | Mask: full face mask. | |
| Risk of bias | ||
| Bias | Authors' judgement | Support for judgement |
| Random sequence generation (selection bias) | Unclear risk | The method used was not reported. |
| Allocation concealment (selection bias) | Low risk | |
| Incomplete outcome data (attrition bias) | Low risk | |
| Selective reporting (reporting bias) | Low risk | |
| Detection bias | Unclear risk | Not reported |
| Adherence to the intention‐to‐treat principle | Low risk | |
| Methods | Multicenter randomised controlled trial, in three teaching hospitals in France. The randomisation protocol was computer generated and equalised in groups of 10 patients, parallel design, unblinded, using ITT approach. No patients were lost to follow up. Patients or their next of kin gave written informed consent. Setting: emergency department. | |
| Participants | 89 participants (37 males and 51 females), with age 84±6 years in standard medical care group and 84±6 in CPAP group. Diagnosis criteria: Age similar or more than 75 year, acute hypoxaemic respiratory failure (PaO2/ FiO2<300 despite O2> 8l/min for 15 minutes), BR> 25bpm, contraction of accessory muscles, clinical examination: systolic and/or diastolic hypertension, widespread crackles or wheezing; medical record : previous cardiomyopathy, and/or acute dyspnoea with progressive orthopnoea; electrocardiographic tracing (Q waves and/or abnormalities in the T wave and ST segment; left ventricular hypertrophy, bundle branch block, atrial fibrillation); and chest radiography ( cardiac enlargement with a cardiothoracic ratio>50%, and/or pulmonary congestion with Kerley B lines, alveolar filing, pleural effusions) compatible with a diagnosis of cardiogenic pulmonary oedema. Causes: Tachyarrythymia, acute Ischaemic heart disease, hypertensive crises, respiratory tract infection, undiagnosed. Exclusion criteria: Glasgow Coma Scale less or similar 7, SpO2 similar or less 85% despite oxygen, haemodynamic instability, chronic respiratory insufficiency. | |
| Interventions | CPAP group: PEEP= 7.5 cmH2O. N=43, TIME=8±6 hours. | |
| Outcomes |
| |
| Notes | Mask: face mask. | |
| Risk of bias | ||
| Bias | Authors' judgement | Support for judgement |
| Random sequence generation (selection bias) | Low risk | |
| Allocation concealment (selection bias) | Low risk | |
| Incomplete outcome data (attrition bias) | Low risk | |
| Selective reporting (reporting bias) | High risk | |
| Detection bias | Unclear risk | Not reported |
| Adherence to the intention‐to‐treat principle | Low risk | |
| Methods | Single centre randomised controlled trial (from a previously computer‐generated list), parallel design, unblinded, lack of intention‐to‐treat analysis confirmed on study assessment. Four patients were lost to follow up. Informed consent was obtained of the patients. Setting: emergency department. | |
| Participants | 42 patients were randomised, but 4 patients did not meet inclusion criteria following randomisation. Therefore, study entry 38 participants (13 males and 25 females), with age 68.5±15 years in standard medical care group and 67.4±15 in BILEVEL group. Diagnosis criteria: tachypnoea, BR>30bpm, diaphoresis or accessory muscle use, pulmonary rales, distended neck veins, peripheral oedema, history CHF (congestive heart failure) and radiograph findings of the pulmonary oedema. Causes: acute congestive heart failure. Excluded patients: patients with radiograph were found not to have CHF or required immediate intubation. | |
| Interventions | BILEVEL group: EPAP= cm H2O e IPAP= cmH2O. N=21, time= 2 hours. | |
| Outcomes |
| |
| Notes | Mask:nasal or face mask. | |
| Risk of bias | ||
| Bias | Authors' judgement | Support for judgement |
| Random sequence generation (selection bias) | Low risk | |
| Allocation concealment (selection bias) | Unclear risk | The method used was not reported. |
| Incomplete outcome data (attrition bias) | Low risk | |
| Selective reporting (reporting bias) | Low risk | |
| Detection bias | High risk | |
| Adherence to the intention‐to‐treat principle | High risk | |
| Methods | Single centre randomised controlled trial, parallel design, unblinded, using ITT approach. Losses to follow up not reported. Informed consent not described. | |
| Participants | 27 participants. Diagnosis criteria: patients with acute cardiogenic pulmonary oedema. Patients with myocardial infarction at presentation were excluded. | |
| Interventions | CPAP group: PEEP=10 cmH2O. N=14. | |
| Outcomes |
| |
| Notes | ||
| Risk of bias | ||
| Bias | Authors' judgement | Support for judgement |
| Random sequence generation (selection bias) | Unclear risk | The method used was not reported. |
| Allocation concealment (selection bias) | Unclear risk | The method used was not reported. |
| Incomplete outcome data (attrition bias) | Unclear risk | Not reported if there were drop‐outs over the monitoring of patients. |
| Selective reporting (reporting bias) | Low risk | |
| Detection bias | Unclear risk | Not reported. |
| Adherence to the intention‐to‐treat principle | Low risk | |
| Methods | Single centre randomised controlled trial, parallel design, unblinded, lack of intention‐to‐treat analysis confirmed on study assessment. 15 patients in CPAP group and 10 patients in O2 group were lost to follow up. Infomed consent was obtained of the patients. Setting: intensive care unit. Wash out of 30 minutes. | |
| Participants | 80 patients were randomised, but 25 patients did not meet inclusion criteria following randomisation. Therefore, study entry 55 patients (50 males and 5 females), with age 74.1±8.8 years in standard medical care group and 73.4±8.2 in CPAP group. Diagnosis criteria: Radiologic evidence of acute interstitial or alveolar oedema of cardiac origin, tachypnoea, BR>22bpm, intercostal or suprasternal retractions, PaO2/FiO2 > 200, P(A‐a)O2>200. Causes: CHF, dilated cardiomyopathy, Ischaemic heart disease, hypertensive cardiovascular disease, acute myocardial infarction. Excluded patients: patients unresponsive to speech or unable to maintain a patent airway and who had cardiogenic shock, signs of lung infection, evidence pulmonary embolism, chronic lung disease with CO2 retention at rest. | |
| Interventions | CPAP group: PEEP=3.75±1.76 cmH2O in first hour (pressure was applied by connecting a serial CPAP valve ‐2,5 cm, 5 cm, 7,5 cm, 10 cm, 12,5 cm ‐ to the face mask at each 30 min interval. N=25, TIME=6 hours. | |
| Outcomes |
| |
| Notes | Mask: face mask. | |
| Risk of bias | ||
| Bias | Authors' judgement | Support for judgement |
| Random sequence generation (selection bias) | Unclear risk | The method used was not reported. |
| Allocation concealment (selection bias) | Unclear risk | The method used was not reported. |
| Incomplete outcome data (attrition bias) | High risk | |
| Selective reporting (reporting bias) | Low risk | |
| Detection bias | Unclear risk | Not reported. |
| Adherence to the intention‐to‐treat principle | High risk | |
| Methods | Single centre randomised controlled trial, parallel design, unblinded, using ITT approach. No losses to follow up were reported. Informed consent not reported. Setting: emergency department or the patient was recruited during hospitalisation. Wash out of 30 minutes. | |
| Participants | 100 participants (90 males and 10 females), with age 73±9 years in standard medical care group and 72±8 in CPAP group. Diagnosis criteria: dyspnoea and tachypnoea, BR>22bpm, use of accessory respiratory muscles, PaO2/FiO2 between 200 and 400, P(A‐a)O2< 250. Rx bilateral diffuse interstitial or alveolar oedema and most rales, and without history aspiration or infection. Causes: CHF, dilated cardiomyopathy, Ischaemic heart disease, hypertensive crisis, acute myocardial infarction. Excluded patients: patients unresponsive, unable to maintain a patent airway and who had cardiogenic shock, ventricular septal rupture, any severe stenotic valvular disease or chronic lung disease. | |
| Interventions | CPAP group: PEEP=3.75±1.7 cmH2O in first hour (pressure was applied by connecting a serial CPAP valve ‐2,5 cm, 5 cm, 7,5 cm, 10 cm, 12,5 cm ‐ to the face mask at each 30 min interval. N=41, TIME=6 hours. | |
| Outcomes |
| |
| Notes | Mask: face mask. | |
| Risk of bias | ||
| Bias | Authors' judgement | Support for judgement |
| Random sequence generation (selection bias) | Unclear risk | The method used was not reported. |
| Allocation concealment (selection bias) | Unclear risk | The method used was not reported. |
| Incomplete outcome data (attrition bias) | Low risk | |
| Selective reporting (reporting bias) | Unclear risk | Not submitted multiple planning outcomes reported on results. |
| Detection bias | Unclear risk | Not reported. |
| Adherence to the intention‐to‐treat principle | Low risk | |
| Methods | Randomised controlled trial. Losses to follow up not reported. Informed consent not described. | |
| Participants | 84 consecutive patients with respiratory failure due to severe cardiogenic pulmonary oedema were randomly assigned to receive either pressure support ventilation plus positive end expiratory pressure or continuous positive airway pressure. Lack of intention‐to‐treat analysis confirmed on study assessment. 3 patients in CPAP group and 1 patients in BILEVEL group were lost after randomisation (a case of respiratory failure by aspiration pneumonia, a re‐acute CPE and two declined to continue participating in the study). | |
| Interventions | CPAP group: time= 107±57 min. N=42. | |
| Outcomes |
| |
| Notes | Mask: face mask | |
| Risk of bias | ||
| Bias | Authors' judgement | Support for judgement |
| Random sequence generation (selection bias) | Low risk | |
| Allocation concealment (selection bias) | Low risk | |
| Incomplete outcome data (attrition bias) | Low risk | |
| Selective reporting (reporting bias) | Unclear risk | Not submitted multiple planning outcomes reported on results. |
| Detection bias | Low risk | |
| Adherence to the intention‐to‐treat principle | High risk | |
| Methods | Single centre randomised controlled trial (the randomisation sequence was generated by a table of random numbers, the assignments were placed in closed envelopes with identification numbers that were stored in the intensive‐care unit), parallel design, unblinded, lack of intention‐to‐treat analysis confirmed on study assessment. Two patients in standard medical care group and one patient in BILEVEL group were lost to follow up. Patients or next‐of‐kin were aware through informed consent. Setting: emergency department or ward to the intensive care unit (ICU). | |
| Participants | 40 participants went randomised, but 3 patients were excluded from the analysis. Therefore, study entry 37 patients (19 males and 18 females), with age 78.5±5 years in standard medical care group, 75.3±11 in BILEVEL group. Diagnosis criteria: dyspnoea of sudden onset with physical findings consistent with pulmonary oedema (widespread rales with or without third heart sound) and typical findings of congestion on a chest radiograph. History: heart failure, acute myocardial infarction, Hypertension, diabetes mellitus, chronic obstructive pulmonary disease. Causes: acute myocardial infarction, hypertensive crisis, hypervolaemia,unstable angina, tachyarrhythmia, respiratory‐tract infection, treatment non‐compliance. Excluded patients: cardiogenic shock (SBP < 90mmHg), severe acute or chronic airflow obstruction without evidence of cardiogenic pulmonary oedema, severe chronic renal failure, neurological impairment, acute myocardial infarction necessitating thrombolysis, evidence of pneumonia, immediate need for intubation, and absence of pulmonary oedema on a first chest radiograph. | |
| Interventions | BILEVEL group: EPAP= 5 cm H2O e IPAP= 15.2±2.4 cmH2O. N=19, time= 254±90 min. | |
| Outcomes |
| |
| Notes | Mask: face mask. | |
| Risk of bias | ||
| Bias | Authors' judgement | Support for judgement |
| Random sequence generation (selection bias) | Low risk | |
| Allocation concealment (selection bias) | Low risk | |
| Incomplete outcome data (attrition bias) | Low risk | |
| Selective reporting (reporting bias) | Unclear risk | Not reported. |
| Detection bias | Unclear risk | Not reported. |
| Adherence to the intention‐to‐treat principle | High risk | |
| Methods | Single centre randomised controlled trial (computer random number sequence), parallel design, double‐blind, lack of intention‐to‐treat analysis confirmed on study assessment. 4 patients in CPAP group and 5 patients in BILEVEL group were lost to follow up. Patients or next‐of‐kin were aware through informed consent. Single blind. Setting: emergency department and ICU. | |
| Participants | 36 participants (11 males and 25 females), with age 76±7 years in CPAP group and 77±12 in BILEVEL group. Diagnosis criteria: moderate‐to‐severe dyspnoea, BR>30bpm, use of accessory respiratory muscles or paradoxical abdominal motion in combination with tachycardia (heart rate of >100 bpm), cardiac gallops, bilateral rales, and typical findings of congestion on a chest radiograph, without a history suggesting pulmonary aspiration or infection. Causes: acute myocardial infarction, left bundle‐branch block, coronary artery disease. Excluded patients: already intubated, suffering a respiratory or cardiac arrest, had an unstable cardiac rhythm, or a systolic blood pressure (BP)<90mmHg, patients unresponsive, agitated, and unable to cooperate, or if they had any condition that precluded application of a face mask. | |
| Interventions | CPAP group: PEEP=10 cmH2O. N=13, TIME= 6.4±5.8 hours. | |
| Outcomes |
| |
| Notes | Mask: nasal mask. | |
| Risk of bias | ||
| Bias | Authors' judgement | Support for judgement |
| Random sequence generation (selection bias) | Low risk | |
| Allocation concealment (selection bias) | Unclear risk | The method used was not reported. |
| Incomplete outcome data (attrition bias) | High risk | |
| Selective reporting (reporting bias) | Low risk | |
| Detection bias | Unclear risk | Not reported. |
| Adherence to the intention‐to‐treat principle | High risk | |
| Methods | Multicenter randomised controlled trial (3 centres), randomisation procedure: allocation to treatment was stratified for centre and based on block randomisation of 10 consecutive study numbers. Parallel design, single blind. Lack of intention‐to‐treat analysis confirmed on study assessment, eleven patients were withdrawn because no informed consent was obtained (n7) or because they were lost to follow‐up. Patients or next‐of‐kin gave written informed consent. Setting: emergency department. | |
| Participants | 109 participants (57 males and 52 females), with age 77.6±9.4 years in CPAP group and 77.7±9.2 in BILEVEL group. Diagnosis criteria: association of sudden onset of dyspnoea; presence of bilateral rales on auscultation, with no medical history suggesting pulmonary aspiration or infection; or congestion found on chest radiograph. Furthermore, patients had to present 2 of the following severity criteria of respiratory failure: respiratory frequency greater than 30 breaths/min; pulse oxymetry saturation (SpO2) below 90%, with oxygen at greater than 5 L per minute through reservoir facemask; and use of accessory muscles (Patrick scale 3). Causes: acute myocardial infarction, treatment noncompliance, respiratory tract infection, myocardial ischaemia, hypertensive emergency, previous pulmonary oedema. Excluded patients: out‐of‐hospital use CPAP or BILEVEL, temperature above 39°C, altered mental state, severe acute or chronic airflow obstruction, with no evidence of pulmonary oedema, chronic renal failure, evidence of pneumonia, acute myocardial infarction necessitating thrombolysis or primary angioplasty, immediate indication for tracheal intubation, respiratory or cardiac arrest, SpO2 < 85% with 100% FiO2, decreased alertness or major agitation requiring sedation, clinical signs of exhaustion: active contraction of the respiratory accessory muscles, with paradoxic abdominal or thoracic motion. | |
| Interventions | CPAP group: PEEP=7.7±2.1 cmH2O. N=59, TIME= 2.3 hours. | |
| Outcomes |
| |
| Notes | Mask: full face mask. | |
| Risk of bias | ||
| Bias | Authors' judgement | Support for judgement |
| Random sequence generation (selection bias) | Low risk | |
| Allocation concealment (selection bias) | Low risk | |
| Incomplete outcome data (attrition bias) | Low risk | |
| Selective reporting (reporting bias) | Low risk | |
| Detection bias | Low risk | |
| Adherence to the intention‐to‐treat principle | High risk | |
| Methods | Multicenter randomised controlled trial (5 centres), randomisation procedure: the randomisation schedule had a block design for each centre and was generated by an independent statistician who used random numbers (because the level of PaCO2 might have a substantial influence on the study results, the randomisation was balanced according to whether the patients had an admission PaCO2< or >45mmHg), parallel design, unblinded, using ITT approach. No patients were lost to follow up. Patients or next‐of‐kin were aware through informed consent. Setting: emergency department. | |
| Participants | 130 participants (101 males and 29 females), with age 73.1±8.3 years in standard medical care group and 72.1±9.1 in BILEVEL group. Diagnosis criteria: dyspnoea of sudden onset with BR>30bpm, PaO2/FiO2<250, typical finds on chest radiographs (congestion) and physical signs of pulmonary oedema (widespread rales) without a history suggesting pulmonary aspiration or infection. Causes: acute acute myocardial infarction, hypertension, hyperthermia (but not showing any signs of pulmonary infection), arrhythmia, aortic stenosis, mitral regurgitation. Excluded patients: immediate need for endotracheal intubation, severe sensorial impairment, shock, ventricular arrhythmias, life threatening hypoxia (SaO2<80%), acute myocardial infarction necessitating thrombolysis, severe chronic renal failure and pneumothorax. | |
| Interventions | BILEVEL group: EPAP=6.1±3.2 cm H2O e IPAP= 14.5±21,1cmH2O. N=65, time= 11.4±3.6 hours. | |
| Outcomes |
| |
| Notes | Mask: full face mask. | |
| Risk of bias | ||
| Bias | Authors' judgement | Support for judgement |
| Random sequence generation (selection bias) | Low risk | |
| Allocation concealment (selection bias) | Low risk | |
| Incomplete outcome data (attrition bias) | Low risk | |
| Selective reporting (reporting bias) | Low risk | |
| Detection bias | Unclear risk | Not reported. |
| Adherence to the intention‐to‐treat principle | Low risk | |
| Methods | Single centre randomised controlled trial (computer random number sequence in closed envelopes), parallel design, unblinded, not using ITT approach. Loss to follow up not reported. Patients or guardians were aware through informed consent. Setting: in hospital. | |
| Participants | 26 participants (10 males and 16 females), with mean age 69±7 years. Diagnosis criteria: dyspnoea of acute onset or worsening, respiration rate more or similar 25 bpm, Rx compatible with pulmonary congestion. Causes: acute myocardial infarction, hypertensive emergencies, acute ischaemic heart disease, infectious endocarditis or undetermined. Excluded patients: SBP less than 90mmHg, arrhythmias requiring electric cardioversion, decreased consciousness level, bradypnoea, lack of cooperation or agitation, repetitive vomiting, upper digestive haemorrhage, facial deformities or any other decompensated respiratory disease. | |
| Interventions | CPAP group: PEEP= 7.5 cmH2O. N=9, TIME=170±90min. | |
| Outcomes |
| |
| Notes | Outcome 6 was poorly reported as a brief comment: BILEVEL group more cooperated and related less dyspnoea. | |
| Risk of bias | ||
| Bias | Authors' judgement | Support for judgement |
| Random sequence generation (selection bias) | Low risk | |
| Allocation concealment (selection bias) | Low risk | |
| Incomplete outcome data (attrition bias) | Unclear risk | Not reported. |
| Selective reporting (reporting bias) | Low risk | |
| Detection bias | Unclear risk | Not reported. |
| Adherence to the intention‐to‐treat principle | High risk | |
| Methods | Single centre randomised controlled trial (the patients were randomised with sealed envelopes ‐ nine per envelope ‐ using a 3:3:3 assignment scheme), parallel design, lack of intention‐to‐treat analysis confirmed on study assessment. Two patients in BILEVEL group and one patients in O2 group were lost to follow up. Patients or guardians were aware through informed consent. Setting: in emergency department. Wash out of 6 minutes. | |
| Participants | 83 participants went randomised, but 3 patients did not meet inclusion criteria for study entry. Therefore, study entry 80 patients (34 males and 46 females), with age 65±15 years in standard medical care group, 61±17 in CPAP group and 66+/‐14 in BILEVEL group. Diagnosis criteria: More than 16 years, acute onset of severe respiratory distress (BR>25rpm), associated tachycardia and diaphoresis and findings of pulmonary congestion on physical examination and chest Rx 2 hours after randomisation. Causes: acute myocardial infarction, myocardial ischaemia, crisis hypertensive, progressive heart failure, hypervolaemia (20%with CPO severe). Excluded patients: SBP < 90mmHg, decrease consciousness level, intractable vomiting, acute myocardial infarction with persistent ST segment elevation, pulmonary embolism, COPD, pneumonia or pneumothorax . | |
| Interventions | CPAP group: PEEP=11±2 cmH2O. N=27, TIME=102±41min. | |
| Outcomes |
| |
| Notes | Mask: face mask. CPAP or BILEVEL with FiO2=50%. | |
| Risk of bias | ||
| Bias | Authors' judgement | Support for judgement |
| Random sequence generation (selection bias) | Low risk | |
| Allocation concealment (selection bias) | Low risk | |
| Incomplete outcome data (attrition bias) | Low risk | |
| Selective reporting (reporting bias) | Low risk | |
| Detection bias | Unclear risk | Not reported. |
| Adherence to the intention‐to‐treat principle | High risk | |
| Methods | Single centre randomised controlled trial. The patients were randomly assigned to 1 of 2 group by opening 1 of 40 sealed envelopes. Parallel design, unblinded, using ITT approach. Loss to follow up not reported. Informed consent not described. Wash out of 10 minutes. Setting: intensive care unit (ICU). | |
| Participants | 40 participants (13 males and 17 females), with age 73±9 years in standard medical care group and 74±9 in CPAP group. Diagnosis criteria: respiratory failure and clinical and radiologic evidence of acute alveolar pulmonary oedema of cardiac origin, dyspnoea, signs increase respiratory work (intercostal and suprasternal retractions or use of accessory respiration muscles), respiratory rate of more than 25 bpm. PaO2/FiO2<200. Causes: severe heart failure primarily after acute myocardial infarction, acute exacerbation of chronic left ventricular dysfunction, ventricular arrhythmia or acute valve incompetence. Excluded patients: patients unresponsive to speech or unable to maintain patent airway, with lung infection, pulmonary embolism, chronic lung disease with CO2 retention at rest or after treatment PaO2<50mmHg, PaCO2>55mmHg, BR>35bpm. | |
| Interventions | CPAP group: PEEP= 10 cmH2O. N=20, TIME=180min. | |
| Outcomes |
| |
| Notes | Mask: face mask. | |
| Risk of bias | ||
| Bias | Authors' judgement | Support for judgement |
| Random sequence generation (selection bias) | Unclear risk | The method used was not reported. |
| Allocation concealment (selection bias) | Low risk | |
| Incomplete outcome data (attrition bias) | Low risk | |
| Selective reporting (reporting bias) | Unclear risk | Not submitted multiple planning outcomes reported on results. |
| Detection bias | Unclear risk | Not reported. |
| Adherence to the intention‐to‐treat principle | Low risk | |
| Methods | Single centre randomised controlled trial (according to their numerical order on list that had been predetermined by lot), parallel design, unblinded, using ITT approach. No losses to follow up. Informed consent was obtained. Setting: mobile intensive care unit teams in the patient's home or during delivery to the emergency department. | |
| Participants | 40 patients went randomised (19 males and 21 females), with age 73±7 years in standard medical care group and 72+/‐6 in BILEVEL group. Diagnosis criteria: symptoms and signs of pulmonary oedema accompanied by oxygen saturation of < 90% measured by pulse oximetry, prior to oxygen administration. Echocardiographics findings: moderate aortic stenosis, moderate mitral regurgitation, ejection fraction. Excluded patients: previous treatment with nitrates above 40 mg/d, or mononitrate or long‐acting trinitrates administered more than twice daily or short acting trinitrates administered more than three times a day; previous treatment with furosemide> 80 mg/d; hypotension (blood pressure <110/70 mmHg); previous adverse effect of nitrates; ST elevations consistent with acute myocardial infarction on baseline ECG; and absence of pulmonary oedema on chest radiograph obtained on arrival to the emergency department. | |
| Interventions | BILEVEL group: EPAP= 4.2±3,.cm H2O, e IPAP=9.3±2.3 cmH2O + ISDN = 3.5±2.5mg. N=20, time=at least 50 minutes. | |
| Outcomes |
| |
| Notes | ||
| Risk of bias | ||
| Bias | Authors' judgement | Support for judgement |
| Random sequence generation (selection bias) | Low risk | |
| Allocation concealment (selection bias) | Unclear risk | The method used was not reported. |
| Incomplete outcome data (attrition bias) | Low risk | |
| Selective reporting (reporting bias) | Low risk | |
| Detection bias | Unclear risk | Not reported. |
| Adherence to the intention‐to‐treat principle | Low risk | |
| Methods | Single centre randomised controlled trial, parallel design, unblinded, using ITT approach. Loss to follow up not reported. Patients or guardians were aware through informed consent. Setting: intensive care unit (ICU). | |
| Participants | 30 participants (22 males and 8 females), with age 64±9 years in standard medical care group and 69+/‐10 in CPAP group. Diagnosis criteria: dyspnoea of sudden onset, PaO2<80mmHg with FiO2>ou= 50%, typical finds on chest radiographs, and widespread rales without a history suggesting pulmonary aspiration or infection. Causes: acute myocardial infarction, prior myocardial infarction, cardiomyopathy, mitral valve regurgitation. Exclusion criteria: complicated with aspiration and/or pneumonia, immediate need for endotracheal intubation, shock, and life‐threatening hypoxia at study entry. | |
| Interventions | CPAP group: PEEP= 7±3 cmH2O. N=15, TIME=11.9±8.4hours. | |
| Outcomes |
| |
| Notes | Mask: nasal mask. | |
| Risk of bias | ||
| Bias | Authors' judgement | Support for judgement |
| Random sequence generation (selection bias) | Unclear risk | The method used was not reported. |
| Allocation concealment (selection bias) | Unclear risk | The method used was not reported. |
| Incomplete outcome data (attrition bias) | Low risk | |
| Selective reporting (reporting bias) | Unclear risk | Not submitted multiple planning outcomes reported on results. |
| Detection bias | Unclear risk | Not reported. |
| Adherence to the intention‐to‐treat principle | Low risk | |
| Methods | Single centre randomised controlled trial (by envelope method), parallel design, unblinded, using ITT approach. No patients were lost after randomisation. Patient's next of kin were aware through informed consent. Setting: coronary care unit (CCU). | |
| Participants | 22 participants (17 males and 5 females), with age 75±10 years in standard medical care group and 74±11 in CPAP group. Diagnosis criteria: dyspnoea of sudden onset, PaO2<80mmHg with FiO2= 50%, typical finds on chest radiographs and widespread rales without a history suggesting pulmonary aspiration or infection, typical chest pain 30 minutes creatine kinase twice a least the normal, ECG changes consistent with acute myocardial infarction. Causes: Acute myocardial infarction. Exclusion criteria: complicated with aspiration and/or pneumonia, immediate need for endotracheal intubation, shock, and life‐threatening hypoxia at study entry. | |
| Interventions | CPAP group: PEEP= 7±3 cmH2O. N=11, TIME=48hours. | |
| Outcomes |
| |
| Notes | Mask: nasal mask. | |
| Risk of bias | ||
| Bias | Authors' judgement | Support for judgement |
| Random sequence generation (selection bias) | Unclear risk | The method used was not reported. |
| Allocation concealment (selection bias) | Low risk | |
| Incomplete outcome data (attrition bias) | Low risk | |
| Selective reporting (reporting bias) | Low risk | |
| Detection bias | Unclear risk | Not reported. |
| Adherence to the intention‐to‐treat principle | Low risk | |
| Methods | Single centre randomised controlled trial (through opaque and sealed envelopes by batches of 20 envelopes), parallel design with placebo, single blind, using ITT approach. None patient went lost. Informed consent was obtained of the patients. Setting: emergency department and intensive care unit (ICU). | |
| Participants | 8 participants (5 males and 3 females), with age 77.5±8.38 years. Diagnosis criteria: orthopnoea, bibasilar crackles, bilateral perihilar infiltrates on chest radiograph with cardiomegaly and a compatible clinical history; age more than 18 years, acute onset of moderate‐to‐severe dyspnoea, BR>30 or < 10bpm, hypoxaemia (PaO2 <55mmHg) or need for O2 supplementation, pH<7,33. Excluded patients: immediate indication for endotracheal intubation, major unrest, haemodynamic instability, facial or thoracic trauma, lack of cooperation, difficult adaptation of a facial mask, pulmonary embolism, retrosternal pain suggestive of a acute myocardial infarction. | |
| Interventions | BILEVEL group: EPAP= 6.1±1.5 cmH2O e IPAP= 16.5±1.5 cmH2O. N=3, time= 77.33±16.25 minutes. | |
| Outcomes |
| |
| Notes | Mask: face mask. | |
| Risk of bias | ||
| Bias | Authors' judgement | Support for judgement |
| Random sequence generation (selection bias) | Unclear risk | The method used was not reported. |
| Allocation concealment (selection bias) | Low risk | |
| Incomplete outcome data (attrition bias) | Low risk | |
| Selective reporting (reporting bias) | Low risk | |
| Detection bias | Unclear risk | Not reported. |
| Adherence to the intention‐to‐treat principle | Low risk | |
| Methods | Single centre randomised controlled trial, parallel design, unblinded, not using ITT approach. Three patients allocated to the standard group were not followed up because it was obvious on admission that these patients did not suffer from an acute cardiogenic pulmonary oedema. Informed consent was obtained. Setting: mobile intensive care unit teams in the patient's home or during delivery to the emergency department. | |
| Participants | 23 participants (12 males and 11 females), with age 72‐92 years in standard medical care group and 54‐86 in BILEVEL group. Diagnosis criteria: severe dyspnoea and consecutively showed additional clinical signs of ACPE (SaO2< 90% and basal rales). Excluded patients: severe uncontrolled agitation, angina, obvious ST elevation in the ECG, emesis and aspiration, cardiogenic shock, life threatening arrhythmias, coma or any obvious need for intubation. | |
| Interventions | BILEVEL group: EPAP= 5 cm H2O e IPAP= 12.5±1.2 cmH2O. N=10. | |
| Outcomes |
| |
| Notes | Mask: Face mask. | |
| Risk of bias | ||
| Bias | Authors' judgement | Support for judgement |
| Random sequence generation (selection bias) | High risk | |
| Allocation concealment (selection bias) | High risk | Inadequate |
| Incomplete outcome data (attrition bias) | Low risk | |
| Selective reporting (reporting bias) | Unclear risk | Not submitted multiple planning outcomes reported on results. |
| Detection bias | Unclear risk | Not reported. |
| Adherence to the intention‐to‐treat principle | High risk | |
ITT ‐ intention to treat; SaO2 ‐ arterial saturation of oxygen; O2 ‐ oxygen; l/min ‐ litre per minute;
BR ‐ breath rate; b/min ‐ breaths per minute; HR ‐ heart rate; b/min ‐ beats per minute; Rx ‐ radiograph;
CHF ‐ congestive heart failure; CPO ‐ cardiogenic pulmonary oedema; ISDN ‐ isosorbide dinitrate; FiO2 ‐ fraction of inspired oxygen; P(A‐a)O2 ‐ alveolar‐arterial oxygen gradient; PaCO2 ‐ carbon dioxide tension of arterial blood; PaO2 ‐ partial pressure of oxygen in arterial blood; CO2 ‐ carbon dioxide; pH ‐ potential of hydrogen; BP ‐ blood pressure; ICU ‐ intensive care unit; SBP ‐ systolic blood pressure; N ‐ number; IPAP ‐ inspiratory positive airway pressure; EPAP ‐ expiratory positive airway pressure; BILEVEL ‐ bilevel positive airway pressure; PEEP ‐ positive expiratory end pressure; CPAP ‐ continuous positive airway pressure; SMC ‐ standard medical care; STEMI ‐ ST segment elevation myocardial infarction.
Characteristics of excluded studies [ordered by study ID]
Jump to:
| Study | Reason for exclusion |
| The clinical situation is different. | |
| The clinical situation is different. | |
| It is not a RCT or QRCT. | |
| It is not a RCT or QRCT. | |
| The clinical situation is different. | |
| It is not a RCT or QRCT. | |
| It is not a RCT or QRCT. | |
| It is not a RCT or QRCT. | |
| It is not a RCT or QRCT. | |
| It is not a RCT or QRCT. | |
| The outcomes did not meet the inclusion criteria. | |
| Study with dogs. | |
| Study involve other kind of ventilatory support (PAV) | |
| It is not a RCT or QRCT. | |
| The clinical situation is different. | |
| Study involve other kind of ventilatory support (invasive mechanical ventilation). | |
| It is not a RCT or QRCT. | |
| It is a letter commenting the L'Her's article. | |
| The outcomes did not meet the inclusion criteria. | |
| Compare NPPV vs. mechanical ventilation. | |
| It is not a RCT or QRCT. | |
| It is not a RCT or QRCT. | |
| It is not a RCT or QRCT. | |
| This is study is in patients with acute respiratory failure and include a subgroup with pulmonary edema (inclusion criteria not clear for cardiogenic pulmonary edema). However, although the author have been contected, he is not replay. | |
| It is a letter commenting the Nava's article. | |
| It is not a RCT or QRCT. | |
| It is not a RCT or QRCT. | |
| The clinical situation is different. | |
| It is not a RCT or QRCT. | |
| It is not a RCT or QRCT. | |
| It is not a RCT or QRCT. | |
| The clinical situation is different. | |
| The end point doesn't similar commended in protocol. | |
| It is the same study published in New England in 2008 by Gray et al. | |
| It is not a RCT or QRCT. | |
| It is not a RCT or QRCT. | |
| It is a letter to the editor. | |
| It is not a RCT or QRCT. | |
| It is not a RCT or QRCT. | |
| It is not a RCT or QRCT. | |
| It is a letter to the editor. | |
| It is not a RCT or QRCT. | |
| It is not a RCT or QRCT. | |
| It is not a RCT or QRCT. | |
| It is not a RCT or QRCT. | |
| It is not a RCT or QRCT. | |
| It is a letter to the editor. | |
| It is not a RCT or QRCT. | |
| It is not a RCT or QRCT. | |
| It is not a RCT or QRCT. | |
| It is not a RCT or QRCT. | |
| It is not a RCT or QRCT. | |
| It is not a RCT or QRCT. | |
| It is a letter to the editor. | |
| The outcomes did not meet the inclusion criteria. | |
| It is not a RCT or QRCT. | |
| It is not a RCT or QRCT. | |
| It is not a RCT or QRCT. | |
| This is study is in acute respiratory failure and include only two patients with cardiogenic pulmonary edema that received NPPV and nobody received CPAP or SMC. | |
| It is not a RCT or QRCT. | |
| It is not a RCT or QRCT. | |
| The study test only different oxygen masks. | |
| It is not a RCT or QRCT. | |
| It is a RCT, but only compared two different brands of CPAP equipment. | |
| It is not a RCT or QRCT. | |
| It is a RCT, it is Chinese paper whose data was translated by Cochrane, but dichotomous variables advocated not were analyzed and the continuous variables analysis happened in different period of advocated ‐ 2hs and 24hs after the start of the intervention. | |
| It is not a RCT or QRCT. | |
| It is not a RCT or QRCT. | |
| It is a Poster of Congress. Did not assess relevant outcomes. | |
| It is not a RCT or QRCT. | |
| It is not a RCT or QRCT. | |
| The clinical situation is different. It was conducted in patients with COPD or asthma. | |
| The outcomes did not meet the inclusion criteria. | |
| It is not a RCT or QRCT. | |
| It is not a RCT or QRCT. | |
| It is not a RCT or QRCT. | |
| It is not a RCT or QRCT. | |
| The outcomes did not meet the inclusion criteria. | |
| It is not a RCT or QRCT. | |
| It is not a RCT or QRCT. | |
| It is not a RCT or QRCT. | |
| It is not a RCT or QRCT. | |
| It is not a RCT or QRCT. | |
| It is a brief presentation of RCT published in The New England in 2008 by Gray et al. | |
| The study compares CPAP vs. mechanical ventilation. | |
| It is a letter to the editor with comment about noninvasive ventilation. | |
| It is not a RCT or QRCT. | |
| It is not a RCT or QRCT. | |
| It is not a RCT or QRCT. | |
| It is an article of review. | |
| It is not a RCT or QRCT. | |
| It is not a RCT or QRCT. | |
| The clinical situation is different. | |
| It is a RCT, but this study cross‐over, the groups were compared in different times were different from those described in this review. | |
| It is not a RCT or QRCT. | |
| It is not a RCT or QRCT. | |
| The outcomes did not meet the inclusion criteria. | |
| It is not a RCT or QRCT. | |
| It is not a RCT or QRCT. | |
| It is not a RCT or QRCT. | |
| It is not a RCT or QRCT. | |
| The clinical situation is different. | |
| It is not a RCT or QRCT. | |
| It is a RCT, but compared CPAP vs.PAV. | |
| It is a letter to the editor . | |
| It is not a RCT or QRCT. | |
| It is not a RCT or QRCT. | |
| It is not a RCT or QRCT. | |
| It is not a RCT or QRCT. | |
| It is not a RCT or QRCT. | |
| It is not a RCT or QRCT. | |
| It is not a RCT or QRCT. | |
| The clinical situation is different. It was conducted in patients with chronic congestive heart failure. | |
| It is a letter to the editor. | |
| It is a RCT, but compared It is a RCT, but compared NPPV as a method of weaning. | |
| The study compares CPAP vs. mechanical ventilation. | |
| It is a RCT, but compared It is a RCT, but compared CPAP vs.invasive mechanical ventilation | |
| The outcomes did not meet the inclusion criteria. | |
| It is not a RCT or QRCT. | |
| It is not a RCT or QRCT. | |
| It is not a RCT or QRCT. | |
| This is study is in acute respiratory failure and include a subgroup with cardiogenic pulmonary oedema. However, although the author have been contected, he is not replay. | |
| It is a letter to the editor. | |
| This is study is in acute respiratory failure and include a subgroup with cardiogenic pulmonary oedema. However, although the author have been contected, he is not replay. | |
| It is not a RCT or QRCT. | |
| The end point doesn’t similar commended in protocol. |
108 excluded.
Characteristics of ongoing studies [ordered by study ID]
Jump to:
| Trial name or title | Effect of Continuous Positive Airway Pressure on Short Term Inhospital Prognosis for Acute Pulmonary Edema |
| Methods | Allocation: Randomised |
| Participants | Adults with acute cardiogenic pulmonary oedema |
| Interventions |
|
| Outcomes | Death, tracheal intubation and mechanical ventilation rates, persistence of inclusion criteria for respiratory distress and shock until H2, reappearance of inclusion criteria after H2. [ Time Frame: 48 hours ] Brain natriuretic factor value curves from H0, H6 and H24; composite criteria without intubation rate; clinical and biological parameters evolution during the first 48 hours, myocardial infarction rate, CPAP non tol [ Time Frame: H0, H6, H24, H48 ] |
| Starting date | November 6, 2007 |
| Contact information | |
| Notes |
| Trial name or title | Noninvasive Mechanical Ventilation in Acute Cardiogenic Pulmonary Edema |
| Methods | Allocation: Randomised |
| Participants | Adults with acute cardiogenic pulmonary oedema |
| Interventions | Other: standard therapy (ST) |
| Outcomes | Number of patients who were intubated, arterial blood gases, respiratory rate, blood pressure, cardiac output, intrapulmonary shunt, A‐a oxygen gradient, heart rate, and dyspnoea duration of hospital and ICU stay and mortality [ Time Frame: Hospital stay ] |
| Starting date | April 8, 2009 |
| Contact information | |
| Notes |
Data and analyses
| Outcome or subgroup title | No. of studies | No. of participants | Statistical method | Effect size |
| 1 NPPV (CPAP and BILEVEL) x SMC Show forest plot | 20 | 1107 | Risk Ratio (M‐H, Random, 95% CI) | 0.66 [0.48, 0.89] |
| Analysis 1.1  Comparison 1 Hospital mortality, Outcome 1 NPPV (CPAP and BILEVEL) x SMC. | ||||
| 2 NPPV (CPAP and BILEVEL) X SMC ‐ sensitivity analysis Show forest plot | 18 | 1023 | Risk Ratio (M‐H, Random, 95% CI) | 0.65 [0.46, 0.91] |
| Analysis 1.2  Comparison 1 Hospital mortality, Outcome 2 NPPV (CPAP and BILEVEL) X SMC ‐ sensitivity analysis. | ||||
| 3 NPPV (CPAP and BILEVEL) X SMC‐ ED place Show forest plot | 9 | 717 | Risk Ratio (M‐H, Random, 95% CI) | 0.55 [0.36, 0.86] |
| Analysis 1.3 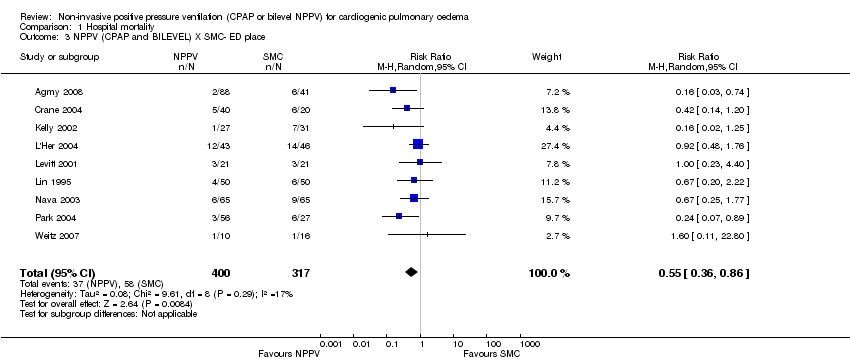 Comparison 1 Hospital mortality, Outcome 3 NPPV (CPAP and BILEVEL) X SMC‐ ED place. | ||||
| 4 NPPV (CPAP and BILEVEL) X SMC ‐ ICU place Show forest plot | 7 | 365 | Risk Ratio (M‐H, Random, 95% CI) | 0.48 [0.28, 0.83] |
| Analysis 1.4  Comparison 1 Hospital mortality, Outcome 4 NPPV (CPAP and BILEVEL) X SMC ‐ ICU place. | ||||
| 5 NPPV (CPAP and BILEVEL) X SMC ‐ in patients hypercanics ‐ baseline Show forest plot | 9 | 603 | Risk Ratio (M‐H, Random, 95% CI) | 0.60 [0.40, 0.88] |
| Analysis 1.5  Comparison 1 Hospital mortality, Outcome 5 NPPV (CPAP and BILEVEL) X SMC ‐ in patients hypercanics ‐ baseline. | ||||
| 6 CPAP x SMC Show forest plot | 13 | 699 | Risk Ratio (M‐H, Random, 95% CI) | 0.60 [0.39, 0.94] |
| Analysis 1.6  Comparison 1 Hospital mortality, Outcome 6 CPAP x SMC. | ||||
| 7 CPAP X SMC ‐ sensitivity analysis Show forest plot | 12 | 659 | Risk Difference (M‐H, Random, 95% CI) | ‐0.12 [‐0.19, ‐0.04] |
| Analysis 1.7  Comparison 1 Hospital mortality, Outcome 7 CPAP X SMC ‐ sensitivity analysis. | ||||
| 8 BILEVEL X SMC Show forest plot | 11 | 506 | Risk Ratio (M‐H, Random, 95% CI) | 0.65 [0.39, 1.09] |
| Analysis 1.8  Comparison 1 Hospital mortality, Outcome 8 BILEVEL X SMC. | ||||
| 9 BILEVEL X SMC ‐ sensitivity analysis Show forest plot | 9 | 458 | Risk Ratio (M‐H, Random, 95% CI) | 0.63 [0.37, 1.09] |
| Analysis 1.9  Comparison 1 Hospital mortality, Outcome 9 BILEVEL X SMC ‐ sensitivity analysis. | ||||
| 10 BILEVEL X SMC ‐ in patients hypercanics ‐ baseline Show forest plot | 7 | 401 | Risk Ratio (M‐H, Random, 95% CI) | 0.59 [0.34, 1.02] |
| Analysis 1.10  Comparison 1 Hospital mortality, Outcome 10 BILEVEL X SMC ‐ in patients hypercanics ‐ baseline. | ||||
| 11 BILEVEL X SMC ‐ in patients hypercanics Show forest plot | 2 | 104 | Risk Ratio (M‐H, Random, 95% CI) | 0.20 [0.04, 0.86] |
| Analysis 1.11  Comparison 1 Hospital mortality, Outcome 11 BILEVEL X SMC ‐ in patients hypercanics. | ||||
| 12 CPAP X BILEVEL Show forest plot | 12 | 694 | Risk Ratio (M‐H, Random, 95% CI) | 1.10 [0.61, 1.97] |
| Analysis 1.12  Comparison 1 Hospital mortality, Outcome 12 CPAP X BILEVEL. | ||||
| 13 CPAP X BILEVEL ‐ in patients hypercanics ‐ baseline Show forest plot | 9 | 518 | Risk Ratio (M‐H, Random, 95% CI) | 0.98 [0.45, 2.14] |
| Analysis 1.13  Comparison 1 Hospital mortality, Outcome 13 CPAP X BILEVEL ‐ in patients hypercanics ‐ baseline. | ||||
| 14 CPAP X BILEVEL ‐ in patients hypercanics Show forest plot | 2 | 98 | Risk Ratio (M‐H, Random, 95% CI) | 1.06 [0.33, 3.37] |
| Analysis 1.14  Comparison 1 Hospital mortality, Outcome 14 CPAP X BILEVEL ‐ in patients hypercanics. | ||||
| Outcome or subgroup title | No. of studies | No. of participants | Statistical method | Effect size |
| 1 NPPV (CPAP and BILEVEL) X SMC Show forest plot | 22 | 1261 | Risk Ratio (M‐H, Random, 95% CI) | 0.52 [0.36, 0.75] |
| Analysis 2.1  Comparison 2 EETI rate, Outcome 1 NPPV (CPAP and BILEVEL) X SMC. | ||||
| 2 NPPV (CPAP and BILEVEL) X SMC ‐ sensitivity analysis Show forest plot | 20 | 1195 | Risk Ratio (M‐H, Random, 95% CI) | 0.53 [0.37, 0.78] |
| Analysis 2.2  Comparison 2 EETI rate, Outcome 2 NPPV (CPAP and BILEVEL) X SMC ‐ sensitivity analysis. | ||||
| 3 NPPV (CPAP and BILEVEL) X SMC ‐ in patients hypercapnics ‐ baseline Show forest plot | 9 | 621 | Risk Ratio (M‐H, Random, 95% CI) | 0.44 [0.25, 0.77] |
| Analysis 2.3  Comparison 2 EETI rate, Outcome 3 NPPV (CPAP and BILEVEL) X SMC ‐ in patients hypercapnics ‐ baseline. | ||||
| 4 CPAP X SMC Show forest plot | 14 | 825 | Risk Ratio (M‐H, Random, 95% CI) | 0.47 [0.33, 0.67] |
| Analysis 2.4  Comparison 2 EETI rate, Outcome 4 CPAP X SMC. | ||||
| 5 CPAP X SMC ‐ sensitivity analysis Show forest plot | 13 | 785 | Risk Ratio (M‐H, Random, 95% CI) | 0.48 [0.34, 0.67] |
| Analysis 2.5  Comparison 2 EETI rate, Outcome 5 CPAP X SMC ‐ sensitivity analysis. | ||||
| 6 BILEVEL X SMC Show forest plot | 12 | 536 | Risk Ratio (M‐H, Random, 95% CI) | 0.55 [0.26, 1.17] |
| Analysis 2.6  Comparison 2 EETI rate, Outcome 6 BILEVEL X SMC. | ||||
| 7 BILEVEL X SMC ‐ sensitivity analysis Show forest plot | 10 | 470 | Risk Ratio (M‐H, Random, 95% CI) | 0.45 [0.26, 0.80] |
| Analysis 2.7  Comparison 2 EETI rate, Outcome 7 BILEVEL X SMC ‐ sensitivity analysis. | ||||
| 8 BILEVEL X SMC ‐ in patients hypercapnics ‐ baseline Show forest plot | 7 | 401 | Risk Ratio (M‐H, Random, 95% CI) | 0.47 [0.22, 0.97] |
| Analysis 2.8  Comparison 2 EETI rate, Outcome 8 BILEVEL X SMC ‐ in patients hypercapnics ‐ baseline. | ||||
| 9 BILEVEL X SMC ‐ in patients hypercapnics Show forest plot | 3 | 120 | Risk Ratio (M‐H, Random, 95% CI) | 0.28 [0.12, 0.69] |
| Analysis 2.9  Comparison 2 EETI rate, Outcome 9 BILEVEL X SMC ‐ in patients hypercapnics. | ||||
| 10 CPAP X BILEVEL Show forest plot | 13 | 721 | Risk Ratio (M‐H, Random, 95% CI) | 1.04 [0.55, 1.97] |
| Analysis 2.10  Comparison 2 EETI rate, Outcome 10 CPAP X BILEVEL. | ||||
| 11 CPAP X BILEVEL ‐ in patients hypercapnics ‐ baseline Show forest plot | 9 | 518 | Risk Ratio (M‐H, Random, 95% CI) | 1.17 [0.58, 2.33] |
| Analysis 2.11  Comparison 2 EETI rate, Outcome 11 CPAP X BILEVEL ‐ in patients hypercapnics ‐ baseline. | ||||
| 12 CPAP X BILEVEL ‐ in patients hypercapnics Show forest plot | 2 | 98 | Risk Ratio (M‐H, Random, 95% CI) | 0.92 [0.26, 3.21] |
| Analysis 2.12  Comparison 2 EETI rate, Outcome 12 CPAP X BILEVEL ‐ in patients hypercapnics. | ||||
| Outcome or subgroup title | No. of studies | No. of participants | Statistical method | Effect size |
| 1 NPPV (CPAP and BILEVEL) X SMC Show forest plot | 8 | 461 | Risk Ratio (M‐H, Random, 95% CI) | 1.24 [0.79, 1.95] |
| Analysis 3.1  Comparison 3 Incidence of acute myocardial infarction (during intervention), Outcome 1 NPPV (CPAP and BILEVEL) X SMC. | ||||
| 2 CPAP X SMC Show forest plot | 3 | 152 | Risk Ratio (M‐H, Random, 95% CI) | 0.91 [0.37, 2.24] |
| Analysis 3.2  Comparison 3 Incidence of acute myocardial infarction (during intervention), Outcome 2 CPAP X SMC. | ||||
| 3 BILEVEL X SMC Show forest plot | 7 | 356 | Risk Ratio (M‐H, Random, 95% CI) | 1.40 [0.78, 2.49] |
| Analysis 3.3  Comparison 3 Incidence of acute myocardial infarction (during intervention), Outcome 3 BILEVEL X SMC. | ||||
| 4 CPAP X BILEVEL Show forest plot | 7 | 409 | Risk Ratio (M‐H, Random, 95% CI) | 0.66 [0.39, 1.10] |
| Analysis 3.4  Comparison 3 Incidence of acute myocardial infarction (during intervention), Outcome 4 CPAP X BILEVEL. | ||||
| 5 BILEVEL X SMC ‐ heterogeneity analysis Show forest plot | 6 | 316 | Risk Ratio (M‐H, Random, 95% CI) | 1.14 [0.69, 1.88] |
| Analysis 3.5  Comparison 3 Incidence of acute myocardial infarction (during intervention), Outcome 5 BILEVEL X SMC ‐ heterogeneity analysis. | ||||
| Outcome or subgroup title | No. of studies | No. of participants | Statistical method | Effect size |
| 1 NPPV (CPAP and BILEVEL) X SMC Show forest plot | 4 | 154 | Risk Ratio (M‐H, Random, 95% CI) | 0.70 [0.11, 4.26] |
| Analysis 4.1  Comparison 4 Incidence of acute myocardial infarction (after intervention), Outcome 1 NPPV (CPAP and BILEVEL) X SMC. | ||||
| 2 CPAP X SMC Show forest plot | 2 | 99 | Risk Ratio (M‐H, Random, 95% CI) | 1.08 [0.11, 10.23] |
| Analysis 4.2  Comparison 4 Incidence of acute myocardial infarction (after intervention), Outcome 2 CPAP X SMC. | ||||
| 3 BILEVEL X SMC Show forest plot | 3 | 65 | Risk Ratio (M‐H, Random, 95% CI) | 0.52 [0.02, 11.54] |
| Analysis 4.3  Comparison 4 Incidence of acute myocardial infarction (after intervention), Outcome 3 BILEVEL X SMC. | ||||
| 4 CPAP X BILEVEL Show forest plot | 2 | 68 | Risk Ratio (M‐H, Random, 95% CI) | 1.57 [0.57, 4.32] |
| Analysis 4.4  Comparison 4 Incidence of acute myocardial infarction (after intervention), Outcome 4 CPAP X BILEVEL. | ||||
| Outcome or subgroup title | No. of studies | No. of participants | Statistical method | Effect size |
| 1 NPPV (CPAP and BILEVEL) X SMC Show forest plot | 13 | 1848 | Risk Ratio (M‐H, Random, 95% CI) | 0.47 [0.29, 0.77] |
| Analysis 5.1  Comparison 5 Intolerance to allocated treatment, Outcome 1 NPPV (CPAP and BILEVEL) X SMC. | ||||
| 2 NPPV (CPAP and BILEVEL) X SMC ‐ heterogeneity analysis Show forest plot | 12 | 692 | Risk Ratio (M‐H, Random, 95% CI) | 0.42 [0.30, 0.58] |
| Analysis 5.2  Comparison 5 Intolerance to allocated treatment, Outcome 2 NPPV (CPAP and BILEVEL) X SMC ‐ heterogeneity analysis. | ||||
| 3 CPAP X SMC Show forest plot | 9 | 1304 | Risk Ratio (M‐H, Random, 95% CI) | 0.55 [0.36, 0.85] |
| Analysis 5.3  Comparison 5 Intolerance to allocated treatment, Outcome 3 CPAP X SMC. | ||||
| 4 BILEVEL X SMC Show forest plot | 7 | 995 | Risk Ratio (M‐H, Random, 95% CI) | 0.58 [0.24, 1.42] |
| Analysis 5.4  Comparison 5 Intolerance to allocated treatment, Outcome 4 BILEVEL X SMC. | ||||
| 5 CPAP X BILEVEL Show forest plot | 3 | 894 | Risk Ratio (M‐H, Random, 95% CI) | 0.94 [0.35, 2.53] |
| Analysis 5.5  Comparison 5 Intolerance to allocated treatment, Outcome 5 CPAP X BILEVEL. | ||||
| Outcome or subgroup title | No. of studies | No. of participants | Statistical method | Effect size |
| 1 NPPV (CPAP and BILEVEL) X SMC Show forest plot | 10 | 542 | Mean Difference (IV, Random, 95% CI) | ‐0.80 [‐2.10, 0.51] |
| Analysis 6.1 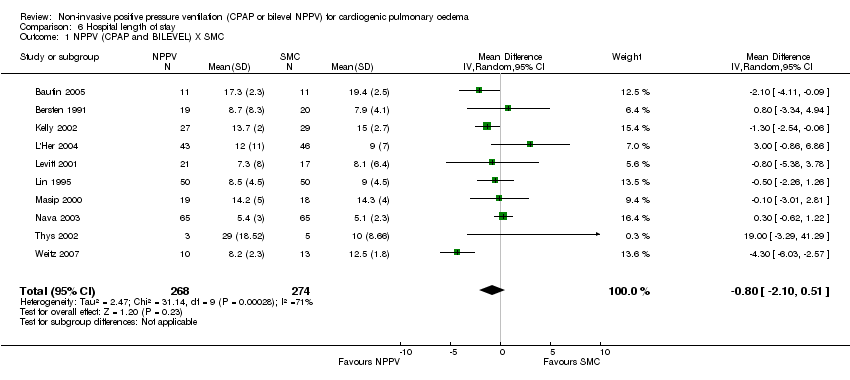 Comparison 6 Hospital length of stay, Outcome 1 NPPV (CPAP and BILEVEL) X SMC. | ||||
| 2 NPPV (CPAP and BILEVEL) X SMC ‐ heterogeneity analysis Show forest plot | 9 | 519 | Mean Difference (IV, Random, 95% CI) | ‐0.38 [‐1.35, 0.58] |
| Analysis 6.2  Comparison 6 Hospital length of stay, Outcome 2 NPPV (CPAP and BILEVEL) X SMC ‐ heterogeneity analysis. | ||||
| 3 CPAP X SMC Show forest plot | 5 | 337 | Mean Difference (IV, Random, 95% CI) | ‐0.51 [‐1.69, 0.67] |
| Analysis 6.3  Comparison 6 Hospital length of stay, Outcome 3 CPAP X SMC. | ||||
| 4 BILEVEL X SMC Show forest plot | 7 | 311 | Mean Difference (IV, Random, 95% CI) | ‐1.38 [‐3.38, 0.62] |
| Analysis 6.4  Comparison 6 Hospital length of stay, Outcome 4 BILEVEL X SMC. | ||||
| 5 CPAP X BILEVEL Show forest plot | 6 | 402 | Mean Difference (IV, Random, 95% CI) | ‐0.46 [‐1.99, 1.07] |
| Analysis 6.5  Comparison 6 Hospital length of stay, Outcome 5 CPAP X BILEVEL. | ||||
| Outcome or subgroup title | No. of studies | No. of participants | Statistical method | Effect size |
| 1 NPPV (CPAP and BILEVEL) X SMC Show forest plot | 6 | 222 | Mean Difference (IV, Random, 95% CI) | ‐0.89 [‐1.33, ‐0.45] |
| Analysis 7.1  Comparison 7 ICU length of stay, Outcome 1 NPPV (CPAP and BILEVEL) X SMC. | ||||
| 2 CPAP X SMC Show forest plot | 3 | 169 | Mean Difference (IV, Random, 95% CI) | ‐1.09 [‐1.63, ‐0.56] |
| Analysis 7.2  Comparison 7 ICU length of stay, Outcome 2 CPAP X SMC. | ||||
| 3 BILEVEL X SMC Show forest plot | 3 | 53 | Std. Mean Difference (IV, Random, 95% CI) | ‐0.65 [‐1.37, 0.06] |
| Analysis 7.3  Comparison 7 ICU length of stay, Outcome 3 BILEVEL X SMC. | ||||
| 4 CPAP X BILEVEL Show forest plot | 3 | 159 | Mean Difference (IV, Random, 95% CI) | 0.31 [‐0.78, 1.40] |
| Analysis 7.4  Comparison 7 ICU length of stay, Outcome 4 CPAP X BILEVEL. | ||||
| Outcome or subgroup title | No. of studies | No. of participants | Statistical method | Effect size |
| 1 NPPV (CPAP and BILEVEL) X SMC Show forest plot | 9 | 438 | Mean Difference (IV, Random, 95% CI) | ‐2.86 [‐3.85, ‐1.87] |
| Analysis 8.1  Comparison 8 Breath rate after one hour, Outcome 1 NPPV (CPAP and BILEVEL) X SMC. | ||||
| 2 CPAP X SMC Show forest plot | 7 | 300 | Mean Difference (IV, Random, 95% CI) | ‐2.39 [‐3.70, ‐1.07] |
| Analysis 8.2  Comparison 8 Breath rate after one hour, Outcome 2 CPAP X SMC. | ||||
| 3 BILEVEL X SMC Show forest plot | 6 | 254 | Mean Difference (IV, Random, 95% CI) | ‐3.52 [‐4.80, ‐2.23] |
| Analysis 8.3  Comparison 8 Breath rate after one hour, Outcome 3 BILEVEL X SMC. | ||||
| 4 CPAP X BILEVEL Show forest plot | 5 | 218 | Mean Difference (IV, Random, 95% CI) | 0.57 [1.00, 2.13] |
| Analysis 8.4  Comparison 8 Breath rate after one hour, Outcome 4 CPAP X BILEVEL. | ||||
| Outcome or subgroup title | No. of studies | No. of participants | Statistical method | Effect size |
| 1 NPPV (CPAP and BILEVEL) X SMC Show forest plot | 9 | 438 | Mean Difference (IV, Random, 95% CI) | ‐4.01 [‐8.16, 0.15] |
| Analysis 9.1  Comparison 9 Heart rate after one hour, Outcome 1 NPPV (CPAP and BILEVEL) X SMC. | ||||
| 2 NPPV (CPAP and BILEVEL) X SMC ‐ heterogeneity analysis Show forest plot | 7 | 329 | Mean Difference (IV, Random, 95% CI) | ‐3.79 [‐6.88, ‐0.70] |
| Analysis 9.2 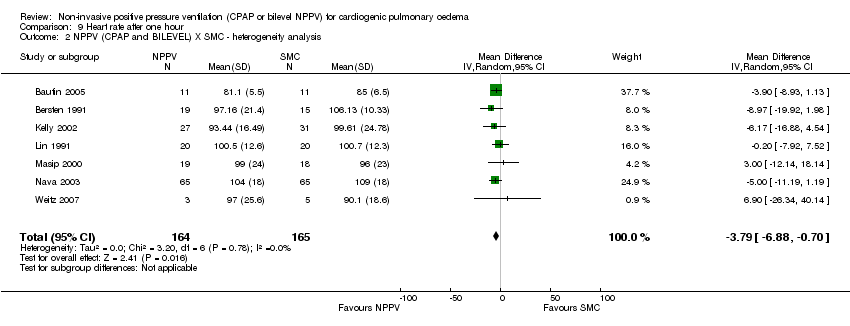 Comparison 9 Heart rate after one hour, Outcome 2 NPPV (CPAP and BILEVEL) X SMC ‐ heterogeneity analysis. | ||||
| 3 CPAP X SMC Show forest plot | 7 | 300 | Mean Difference (IV, Random, 95% CI) | ‐4.45 [‐10.81, 1.92] |
| Analysis 9.3  Comparison 9 Heart rate after one hour, Outcome 3 CPAP X SMC. | ||||
| 4 CPAP X SMC ‐ heterogeneity analysis Show forest plot | 5 | 191 | Mean Difference (IV, Random, 95% CI) | ‐4.10 [‐8.93, 0.72] |
| Analysis 9.4  Comparison 9 Heart rate after one hour, Outcome 4 CPAP X SMC ‐ heterogeneity analysis. | ||||
| 5 BILEVEL X SMC Show forest plot | 6 | 254 | Mean Difference (IV, Random, 95% CI) | ‐4.21 [‐7.77, ‐0.65] |
| Analysis 9.5  Comparison 9 Heart rate after one hour, Outcome 5 BILEVEL X SMC. | ||||
| 6 CPAP X BILEVEL Show forest plot | 4 | 182 | Mean Difference (IV, Random, 95% CI) | ‐0.56 [‐5.22, 4.11] |
| Analysis 9.6  Comparison 9 Heart rate after one hour, Outcome 6 CPAP X BILEVEL. | ||||
| Outcome or subgroup title | No. of studies | No. of participants | Statistical method | Effect size |
| 1 NPPV (CPAP and BILEVEL) X SMC Show forest plot | 6 | 182 | Mean Difference (IV, Random, 95% CI) | ‐1.64 [‐7.83, 4.56] |
| Analysis 10.1  Comparison 10 Sistolic blood pressure after one hour, Outcome 1 NPPV (CPAP and BILEVEL) X SMC. | ||||
| 2 CPAP X SMC Show forest plot | 6 | 211 | Mean Difference (IV, Random, 95% CI) | 0.12 [‐6.56, 6.81] |
| Analysis 10.2  Comparison 10 Sistolic blood pressure after one hour, Outcome 2 CPAP X SMC. | ||||
| 3 BILEVEL X SMC Show forest plot | 4 | 87 | Mean Difference (IV, Random, 95% CI) | 1.93 [‐7.94, 11.80] |
| Analysis 10.3  Comparison 10 Sistolic blood pressure after one hour, Outcome 3 BILEVEL X SMC. | ||||
| 4 CPAP X BILEVEL Show forest plot | 4 | 182 | Mean Difference (IV, Random, 95% CI) | ‐1.17 [‐10.79, 8.44] |
| Analysis 10.4  Comparison 10 Sistolic blood pressure after one hour, Outcome 4 CPAP X BILEVEL. | ||||
| 5 CPAP X BILEVEL ‐ heterogeneity analysis Show forest plot | 3 | 136 | Mean Difference (IV, Random, 95% CI) | 2.57 [‐4.30, 9.44] |
| Analysis 10.5  Comparison 10 Sistolic blood pressure after one hour, Outcome 5 CPAP X BILEVEL ‐ heterogeneity analysis. | ||||
| Outcome or subgroup title | No. of studies | No. of participants | Statistical method | Effect size |
| 1 NPPV (CPAP and BILEVEL) X SMC Show forest plot | 5 | 138 | Mean Difference (IV, Random, 95% CI) | ‐1.49 [‐6.43, 3.45] |
| Analysis 11.1  Comparison 11 Diastolic blood pressure after one hour, Outcome 1 NPPV (CPAP and BILEVEL) X SMC. | ||||
| 2 CPAP X SMC Show forest plot | 5 | 167 | Mean Difference (IV, Random, 95% CI) | ‐0.92 [‐9.10, 7.27] |
| Analysis 11.2  Comparison 11 Diastolic blood pressure after one hour, Outcome 2 CPAP X SMC. | ||||
| 3 CPAP X SMC ‐ heterogeneity analysis Show forest plot | 3 | 107 | Mean Difference (IV, Random, 95% CI) | ‐7.32 [‐12.79, ‐1.86] |
| Analysis 11.3  Comparison 11 Diastolic blood pressure after one hour, Outcome 3 CPAP X SMC ‐ heterogeneity analysis. | ||||
| 4 BILEVEL X SMC Show forest plot | 4 | 87 | Mean Difference (IV, Random, 95% CI) | ‐0.96 [‐6.09, 4.16] |
| Analysis 11.4  Comparison 11 Diastolic blood pressure after one hour, Outcome 4 BILEVEL X SMC. | ||||
| 5 CPAP X BILEVEL Show forest plot | 4 | 182 | Mean Difference (IV, Random, 95% CI) | ‐2.60 [‐9.58, 4.37] |
| Analysis 11.5  Comparison 11 Diastolic blood pressure after one hour, Outcome 5 CPAP X BILEVEL. | ||||
| 6 CPAP X BILEVEL ‐ heterogeneity analysis Show forest plot | 2 | 62 | Mean Difference (IV, Random, 95% CI) | ‐7.86 [‐13.03, ‐2.70] |
| Analysis 11.6  Comparison 11 Diastolic blood pressure after one hour, Outcome 6 CPAP X BILEVEL ‐ heterogeneity analysis. | ||||
| Outcome or subgroup title | No. of studies | No. of participants | Statistical method | Effect size |
| 1 NPPV (CPAP and BILEVEL) X SMC Show forest plot | 3 | 256 | Mean Difference (IV, Random, 95% CI) | ‐2.41 [‐8.27, 3.45] |
| Analysis 12.1  Comparison 12 Mean blood pressure after one hour, Outcome 1 NPPV (CPAP and BILEVEL) X SMC. | ||||
| 2 CPAP X SMC Show forest plot | 1 | 89 | Mean Difference (IV, Random, 95% CI) | 3.00 [‐5.31, 11.31] |
| Analysis 12.2  Comparison 12 Mean blood pressure after one hour, Outcome 2 CPAP X SMC. | ||||
| 3 BILEVEL X SMC Show forest plot | 2 | 167 | Mean Difference (IV, Random, 95% CI) | ‐5.42 [‐11.60, 0.76] |
| Analysis 12.3  Comparison 12 Mean blood pressure after one hour, Outcome 3 BILEVEL X SMC. | ||||
| 4 CPAP X BILEVEL Show forest plot | 1 | 80 | Mean Difference (IV, Random, 95% CI) | ‐4.40 [‐13.25, 4.45] |
| Analysis 12.4  Comparison 12 Mean blood pressure after one hour, Outcome 4 CPAP X BILEVEL. | ||||
| Outcome or subgroup title | No. of studies | No. of participants | Statistical method | Effect size |
| 1 NPPV (CPAP and BILEVEL) X SMC Show forest plot | 4 | 140 | Mean Difference (IV, Random, 95% CI) | 10.04 [1.09, 19.00] |
| Analysis 13.1  Comparison 13 PaO2 (mmHg) after one hour, Outcome 1 NPPV (CPAP and BILEVEL) X SMC. | ||||
| 2 CPAP X SMC Show forest plot | 5 | 177 | Mean Difference (IV, Random, 95% CI) | ‐2.64 [‐25.87, 20.59] |
| Analysis 13.2  Comparison 13 PaO2 (mmHg) after one hour, Outcome 2 CPAP X SMC. | ||||
| 3 CPAP X SMC ‐ heterogeneity analysis Show forest plot | 3 | 117 | Mean Difference (IV, Random, 95% CI) | ‐22.09 [‐34.35, ‐9.83] |
| Analysis 13.3  Comparison 13 PaO2 (mmHg) after one hour, Outcome 3 CPAP X SMC ‐ heterogeneity analysis. | ||||
| 4 BILEVEL X SMC Show forest plot | 3 | 79 | Mean Difference (IV, Random, 95% CI) | 4.79 [‐11.11, 20.69] |
| Analysis 13.4  Comparison 13 PaO2 (mmHg) after one hour, Outcome 4 BILEVEL X SMC. | ||||
| 5 CPAP X BILEVEL Show forest plot | 3 | 136 | Mean Difference (IV, Random, 95% CI) | ‐27.00 [‐44.75, ‐9.25] |
| Analysis 13.5  Comparison 13 PaO2 (mmHg) after one hour, Outcome 5 CPAP X BILEVEL. | ||||
| Outcome or subgroup title | No. of studies | No. of participants | Statistical method | Effect size |
| 1 NPPV (CPAP and BILEVEL) X SMC Show forest plot | 15 | 11329 | Risk Ratio (M‐H, Random, 95% CI) | 0.85 [0.63, 1.16] |
| Analysis 14.1  Comparison 14 Adverse events, Outcome 1 NPPV (CPAP and BILEVEL) X SMC. | ||||
| 1.1 Skin damage | 11 | 594 | Risk Ratio (M‐H, Random, 95% CI) | 6.62 [1.20, 36.55] |
| 1.2 Pneumonia | 3 | 232 | Risk Ratio (M‐H, Random, 95% CI) | 0.35 [0.05, 2.20] |
| 1.3 Pulmonary aspiration | 5 | 1255 | Risk Ratio (M‐H, Random, 95% CI) | 1.58 [0.06, 38.61] |
| 1.4 Gastrointestinal Bleeding | 3 | 192 | Risk Ratio (M‐H, Random, 95% CI) | 1.37 [0.27, 6.89] |
| 1.5 Gastric distention | 8 | 484 | Risk Ratio (M‐H, Random, 95% CI) | 13.26 [0.82, 215.12] |
| 1.6 Vomiting | 5 | 1229 | Risk Ratio (M‐H, Random, 95% CI) | 1.06 [0.46, 2.47] |
| 1.7 Asphyxia | 2 | 170 | Risk Ratio (M‐H, Random, 95% CI) | 3.0 [0.12, 72.31] |
| 1.8 Pneumothorax | 6 | 1474 | Risk Ratio (M‐H, Random, 95% CI) | 0.72 [0.08, 6.89] |
| 1.9 Conjunctivitis | 2 | 147 | Risk Ratio (M‐H, Random, 95% CI) | 0.0 [0.0, 0.0] |
| 1.10 Sinusitis | 2 | 219 | Risk Ratio (M‐H, Random, 95% CI) | 3.0 [0.12, 72.31] |
| 1.11 Disconfort with mask | 7 | 512 | Risk Ratio (M‐H, Random, 95% CI) | 5.39 [0.97, 30.09] |
| 1.12 Hypotension | 1 | 1030 | Risk Ratio (M‐H, Random, 95% CI) | 0.82 [0.58, 1.16] |
| 1.13 Arrhythmia | 1 | 1027 | Risk Ratio (M‐H, Random, 95% CI) | 0.83 [0.50, 1.38] |
| 1.14 Progressive respiratory distress | 2 | 1122 | Risk Ratio (M‐H, Random, 95% CI) | 0.58 [0.37, 0.89] |
| 1.15 Cardiorespiratory arrest | 3 | 1252 | Risk Ratio (M‐H, Random, 95% CI) | 0.60 [0.29, 1.26] |
| 1.16 Neurological failure (coma) | 1 | 90 | Risk Ratio (M‐H, Random, 95% CI) | 0.10 [0.01, 0.71] |
| 1.17 Eye irritation | 1 | 40 | Risk Ratio (M‐H, Random, 95% CI) | 0.0 [0.0, 0.0] |
| 1.18 Stroke | 1 | 130 | Risk Ratio (M‐H, Random, 95% CI) | 0.0 [0.0, 0.0] |
| 1.19 Seizures | 1 | 130 | Risk Ratio (M‐H, Random, 95% CI) | 0.33 [0.01, 8.03] |
| 2 NPPV (CPAP and BILEVEL) X SMC ‐ AFTER 2000 Show forest plot | 11 | 10703 | Risk Ratio (M‐H, Random, 95% CI) | 0.87 [0.63, 1.19] |
| Analysis 14.2  Comparison 14 Adverse events, Outcome 2 NPPV (CPAP and BILEVEL) X SMC ‐ AFTER 2000. | ||||
| 2.1 Skin damage | 8 | 492 | Risk Ratio (M‐H, Random, 95% CI) | 6.62 [1.20, 36.55] |
| 2.2 Pneumonia | 2 | 152 | Risk Ratio (M‐H, Random, 95% CI) | 0.35 [0.05, 2.20] |
| 2.3 Pulmonary aspiration | 2 | 1095 | Risk Ratio (M‐H, Random, 95% CI) | 1.58 [0.06, 38.61] |
| 2.4 Gastrointestinal Bleeding | 2 | 170 | Risk Ratio (M‐H, Random, 95% CI) | 2.32 [0.35, 15.42] |
| 2.5 Gastric distention | 4 | 302 | Risk Ratio (M‐H, Random, 95% CI) | 13.26 [0.82, 215.12] |
| 2.6 Vomiting | 5 | 1229 | Risk Ratio (M‐H, Random, 95% CI) | 1.06 [0.46, 2.47] |
| 2.7 Asphyxia | 1 | 130 | Risk Ratio (M‐H, Random, 95% CI) | 3.0 [0.12, 72.31] |
| 2.8 Pneumothorax | 5 | 1434 | Risk Ratio (M‐H, Random, 95% CI) | 0.72 [0.08, 6.89] |
| 2.9 Conjunctivitis | 2 | 147 | Risk Ratio (M‐H, Random, 95% CI) | 0.0 [0.0, 0.0] |
| 2.10 Sinusitis | 2 | 219 | Risk Ratio (M‐H, Random, 95% CI) | 3.0 [0.12, 72.31] |
| 2.11 Disconfort with mask | 7 | 512 | Risk Ratio (M‐H, Random, 95% CI) | 5.39 [0.97, 30.09] |
| 2.12 Hypotension | 1 | 1030 | Risk Ratio (M‐H, Random, 95% CI) | 0.82 [0.58, 1.16] |
| 2.13 Arrhythmia | 1 | 1027 | Risk Ratio (M‐H, Random, 95% CI) | 0.83 [0.50, 1.38] |
| 2.14 Progressive respiratory distress | 2 | 1122 | Risk Ratio (M‐H, Random, 95% CI) | 0.58 [0.37, 0.89] |
| 2.15 Cardiorespiratory arrest | 3 | 1252 | Risk Ratio (M‐H, Random, 95% CI) | 0.60 [0.29, 1.26] |
| 2.16 Neurological failure (coma) | 1 | 90 | Risk Ratio (M‐H, Random, 95% CI) | 0.10 [0.01, 0.71] |
| 2.17 Eye irritation | 1 | 40 | Risk Ratio (M‐H, Random, 95% CI) | 0.0 [0.0, 0.0] |
| 2.18 Stroke | 1 | 130 | Risk Ratio (M‐H, Random, 95% CI) | 0.0 [0.0, 0.0] |
| 2.19 Seizures | 1 | 130 | Risk Ratio (M‐H, Random, 95% CI) | 0.33 [0.01, 8.03] |
| 3 CPAP X SMC Show forest plot | 10 | 7133 | Risk Ratio (M‐H, Random, 95% CI) | 0.63 [0.45, 0.87] |
| Analysis 14.3  Comparison 14 Adverse events, Outcome 3 CPAP X SMC. | ||||
| 3.1 Skin damage | 7 | 343 | Risk Ratio (M‐H, Random, 95% CI) | 3.0 [0.13, 69.52] |
| 3.2 Pneumonia | 1 | 80 | Risk Ratio (M‐H, Random, 95% CI) | 0.0 [0.0, 0.0] |
| 3.3 Pulmonary aspiration | 5 | 908 | Risk Ratio (M‐H, Random, 95% CI) | 0.0 [0.0, 0.0] |
| 3.4 Gastrointestinal Bleeding | 1 | 22 | Risk Ratio (M‐H, Random, 95% CI) | 0.33 [0.02, 7.39] |
| 3.5 Gastric distention | 7 | 447 | Risk Ratio (M‐H, Random, 95% CI) | 11.00 [0.64, 189.65] |
| 3.6 Vomiting | 3 | 785 | Risk Ratio (M‐H, Random, 95% CI) | 0.93 [0.34, 2.54] |
| 3.7 Asphyxia | 1 | 40 | Risk Ratio (M‐H, Random, 95% CI) | 0.0 [0.0, 0.0] |
| 3.8 Pneumothorax | 5 | 998 | Risk Ratio (M‐H, Random, 95% CI) | 0.0 [0.0, 0.0] |
| 3.9 Conjunctivitis | 2 | 147 | Risk Ratio (M‐H, Random, 95% CI) | 0.0 [0.0, 0.0] |
| 3.10 Sinusitis | 1 | 89 | Risk Ratio (M‐H, Random, 95% CI) | 0.0 [0.0, 0.0] |
| 3.11 Disconfort with mask | 3 | 265 | Risk Ratio (M‐H, Random, 95% CI) | 0.0 [0.0, 0.0] |
| 3.12 Hypotension | 1 | 684 | Risk Ratio (M‐H, Random, 95% CI) | 0.83 [0.55, 1.25] |
| 3.13 Arrhythmia | 1 | 682 | Risk Ratio (M‐H, Random, 95% CI) | 0.55 [0.28, 1.09] |
| 3.14 Progressive respiratory distress | 2 | 776 | Risk Ratio (M‐H, Random, 95% CI) | 0.53 [0.31, 0.92] |
| 3.15 Cardiorespiratory arrest | 2 | 777 | Risk Ratio (M‐H, Random, 95% CI) | 0.41 [0.18, 0.91] |
| 3.16 Neurological failure (coma) | 1 | 90 | Risk Ratio (M‐H, Random, 95% CI) | 0.10 [0.01, 0.71] |
| 4 BILEVEL X SMC Show forest plot | 8 | 6823 | Risk Ratio (M‐H, Random, 95% CI) | 1.05 [0.76, 1.46] |
| Analysis 14.4  Comparison 14 Adverse events, Outcome 4 BILEVEL X SMC. | ||||
| 4.1 Skin damage | 6 | 296 | Risk Ratio (M‐H, Random, 95% CI) | 7.16 [1.27, 40.50] |
| 4.2 Nosocomial pneumonia | 2 | 152 | Risk Ratio (M‐H, Random, 95% CI) | 0.35 [0.05, 2.20] |
| 4.3 Disconfort with mask | 5 | 274 | Risk Ratio (M‐H, Random, 95% CI) | 5.39 [0.97, 30.09] |
| 4.4 Gastrointestinal bleeding | 2 | 170 | Risk Ratio (M‐H, Random, 95% CI) | 2.32 [0.35, 15.42] |
| 4.5 Gastric dilatation | 2 | 64 | Risk Ratio (M‐H, Random, 95% CI) | 15.87 [0.96, 262.30] |
| 4.6 Vomiting | 5 | 848 | Risk Ratio (M‐H, Random, 95% CI) | 1.21 [0.47, 3.11] |
| 4.7 Claustrophobia | 1 | 130 | Risk Ratio (M‐H, Random, 95% CI) | 3.0 [0.12, 72.31] |
| 4.8 Pneumothorax | 2 | 832 | Risk Ratio (M‐H, Random, 95% CI) | 1.01 [0.11, 9.63] |
| 4.9 Eye irritation | 1 | 40 | Risk Ratio (M‐H, Random, 95% CI) | 0.0 [0.0, 0.0] |
| 4.10 Sinusitis | 1 | 130 | Risk Ratio (M‐H, Random, 95% CI) | 3.0 [0.12, 72.31] |
| 4.11 Cardiac arrest | 2 | 830 | Risk Ratio (M‐H, Random, 95% CI) | 0.96 [0.25, 3.61] |
| 4.12 Stroke | 1 | 130 | Risk Ratio (M‐H, Random, 95% CI) | 0.0 [0.0, 0.0] |
| 4.13 Seizures | 1 | 130 | Risk Ratio (M‐H, Random, 95% CI) | 0.33 [0.01, 8.03] |
| 4.14 Gastric aspiration | 1 | 704 | Risk Ratio (M‐H, Random, 95% CI) | 3.09 [0.13, 75.50] |
| 4.15 Hypotension | 1 | 698 | Risk Ratio (M‐H, Random, 95% CI) | 0.82 [0.54, 1.23] |
| 4.16 Arrhythmia | 1 | 695 | Risk Ratio (M‐H, Random, 95% CI) | 1.10 [0.64, 1.90] |
| 4.17 Progressive respiratory distress | 1 | 700 | Risk Ratio (M‐H, Random, 95% CI) | 0.61 [0.36, 1.03] |
| 5 CPAP X BILEVEL Show forest plot | 5 | 7593 | Risk Ratio (M‐H, Random, 95% CI) | 1.18 [0.94, 1.48] |
| Analysis 14.5  Comparison 14 Adverse events, Outcome 5 CPAP X BILEVEL. | ||||
| 5.1 Skin damage | 5 | 790 | Risk Ratio (M‐H, Random, 95% CI) | 0.64 [0.19, 2.16] |
| 5.2 Pneumothorax | 2 | 715 | Risk Ratio (M‐H, Random, 95% CI) | 2.89 [0.12, 70.63] |
| 5.3 Pulmonary aspiration | 3 | 796 | Risk Ratio (M‐H, Random, 95% CI) | 2.88 [0.12, 70.43] |
| 5.4 Gastric distension | 3 | 172 | Risk Ratio (M‐H, Random, 95% CI) | 1.49 [0.56, 4.00] |
| 5.5 Vomiting | 4 | 857 | Risk Ratio (M‐H, Random, 95% CI) | 0.97 [0.43, 2.19] |
| 5.6 Disconfort with mask | 4 | 735 | Risk Ratio (M‐H, Random, 95% CI) | 1.03 [0.53, 2.00] |
| 5.7 Increased breathing discomfort | 1 | 576 | Risk Ratio (M‐H, Random, 95% CI) | 1.42 [0.67, 3.02] |
| 5.8 Hypotension | 2 | 758 | Risk Ratio (M‐H, Random, 95% CI) | 0.98 [0.65, 1.48] |
| 5.9 Arrhythmia | 1 | 677 | Risk Ratio (M‐H, Random, 95% CI) | 2.00 [1.02, 3.92] |
| 5.10 Progressive respiratory distress | 1 | 679 | Risk Ratio (M‐H, Random, 95% CI) | 1.19 [0.64, 2.21] |
| 5.11 Cardiorespiratory arrest | 1 | 678 | Risk Ratio (M‐H, Random, 95% CI) | 1.61 [0.59, 4.38] |
| 5.12 Pharyngeal damage | 1 | 80 | Risk Ratio (M‐H, Random, 95% CI) | 0.95 [0.06, 14.69] |
| 5.13 Cough | 1 | 80 | Risk Ratio (M‐H, Random, 95% CI) | 0.32 [0.01, 7.57] |
| Outcome or subgroup title | No. of studies | No. of participants | Statistical method | Effect size |
| 1 NPPV (CPAP and BILEVEL) X SMC Show forest plot | 21 | 2263 | Risk Ratio (M‐H, Random, 95% CI) | 0.72 [0.55, 0.94] |
| Analysis 15.1  Comparison 15 Hospital or 7‐day mortality, Outcome 1 NPPV (CPAP and BILEVEL) X SMC. | ||||
| Outcome or subgroup title | No. of studies | No. of participants | Statistical method | Effect size |
| 1 NPPV (CPAP and BILEVEL) X SMC Show forest plot | 22 | 2387 | Risk Ratio (M‐H, Random, 95% CI) | 0.75 [0.60, 0.95] |
| Analysis 16.1  Comparison 16 Hospital or 30‐day mortality, Outcome 1 NPPV (CPAP and BILEVEL) X SMC. | ||||
| Outcome or subgroup title | No. of studies | No. of participants | Statistical method | Effect size |
| 1 NPPV (CPAP and BILEVEL) X SMC Show forest plot | 23 | 2417 | Risk Ratio (M‐H, Random, 95% CI) | 0.55 [0.38, 0.78] |
| Analysis 17.1  Comparison 17 General or 7‐day ETI rate, Outcome 1 NPPV (CPAP and BILEVEL) X SMC. | ||||

QUOROM statement flow diagram of 2005

Figure 4. PRISMA statement flow diagram of 2011

Risk of bias summary: review authors' judgements about each risk of bias item for each included study.

Risk of bias graph: review authors' judgements about each risk of bias item presented as percentages across all included studies.

Funnel plot of comparison: 1 Hospital Mortality, outcome: 1.1 NPPV (CPAP and BILEVEL) x SMC.

Comparison 1 Hospital mortality, Outcome 1 NPPV (CPAP and BILEVEL) x SMC.
Comparison 1 Hospital mortality, Outcome 2 NPPV (CPAP and BILEVEL) X SMC ‐ sensitivity analysis.
Comparison 1 Hospital mortality, Outcome 3 NPPV (CPAP and BILEVEL) X SMC‐ ED place.
Comparison 1 Hospital mortality, Outcome 4 NPPV (CPAP and BILEVEL) X SMC ‐ ICU place.
Comparison 1 Hospital mortality, Outcome 5 NPPV (CPAP and BILEVEL) X SMC ‐ in patients hypercanics ‐ baseline.
Comparison 1 Hospital mortality, Outcome 6 CPAP x SMC.
Comparison 1 Hospital mortality, Outcome 7 CPAP X SMC ‐ sensitivity analysis.
Comparison 1 Hospital mortality, Outcome 8 BILEVEL X SMC.
Comparison 1 Hospital mortality, Outcome 9 BILEVEL X SMC ‐ sensitivity analysis.
Comparison 1 Hospital mortality, Outcome 10 BILEVEL X SMC ‐ in patients hypercanics ‐ baseline.
Comparison 1 Hospital mortality, Outcome 11 BILEVEL X SMC ‐ in patients hypercanics.
Comparison 1 Hospital mortality, Outcome 12 CPAP X BILEVEL.
Comparison 1 Hospital mortality, Outcome 13 CPAP X BILEVEL ‐ in patients hypercanics ‐ baseline.
Comparison 1 Hospital mortality, Outcome 14 CPAP X BILEVEL ‐ in patients hypercanics.
Comparison 2 EETI rate, Outcome 1 NPPV (CPAP and BILEVEL) X SMC.
Comparison 2 EETI rate, Outcome 2 NPPV (CPAP and BILEVEL) X SMC ‐ sensitivity analysis.
Comparison 2 EETI rate, Outcome 3 NPPV (CPAP and BILEVEL) X SMC ‐ in patients hypercapnics ‐ baseline.
Comparison 2 EETI rate, Outcome 4 CPAP X SMC.
Comparison 2 EETI rate, Outcome 5 CPAP X SMC ‐ sensitivity analysis.
Comparison 2 EETI rate, Outcome 6 BILEVEL X SMC.
Comparison 2 EETI rate, Outcome 7 BILEVEL X SMC ‐ sensitivity analysis.
Comparison 2 EETI rate, Outcome 8 BILEVEL X SMC ‐ in patients hypercapnics ‐ baseline.
Comparison 2 EETI rate, Outcome 9 BILEVEL X SMC ‐ in patients hypercapnics.
Comparison 2 EETI rate, Outcome 10 CPAP X BILEVEL.
Comparison 2 EETI rate, Outcome 11 CPAP X BILEVEL ‐ in patients hypercapnics ‐ baseline.
Comparison 2 EETI rate, Outcome 12 CPAP X BILEVEL ‐ in patients hypercapnics.
Comparison 3 Incidence of acute myocardial infarction (during intervention), Outcome 1 NPPV (CPAP and BILEVEL) X SMC.
Comparison 3 Incidence of acute myocardial infarction (during intervention), Outcome 2 CPAP X SMC.
Comparison 3 Incidence of acute myocardial infarction (during intervention), Outcome 3 BILEVEL X SMC.
Comparison 3 Incidence of acute myocardial infarction (during intervention), Outcome 4 CPAP X BILEVEL.
Comparison 3 Incidence of acute myocardial infarction (during intervention), Outcome 5 BILEVEL X SMC ‐ heterogeneity analysis.
Comparison 4 Incidence of acute myocardial infarction (after intervention), Outcome 1 NPPV (CPAP and BILEVEL) X SMC.
Comparison 4 Incidence of acute myocardial infarction (after intervention), Outcome 2 CPAP X SMC.
Comparison 4 Incidence of acute myocardial infarction (after intervention), Outcome 3 BILEVEL X SMC.
Comparison 4 Incidence of acute myocardial infarction (after intervention), Outcome 4 CPAP X BILEVEL.
Comparison 5 Intolerance to allocated treatment, Outcome 1 NPPV (CPAP and BILEVEL) X SMC.
Comparison 5 Intolerance to allocated treatment, Outcome 2 NPPV (CPAP and BILEVEL) X SMC ‐ heterogeneity analysis.
Comparison 5 Intolerance to allocated treatment, Outcome 3 CPAP X SMC.
Comparison 5 Intolerance to allocated treatment, Outcome 4 BILEVEL X SMC.
Comparison 5 Intolerance to allocated treatment, Outcome 5 CPAP X BILEVEL.
Comparison 6 Hospital length of stay, Outcome 1 NPPV (CPAP and BILEVEL) X SMC.
Comparison 6 Hospital length of stay, Outcome 2 NPPV (CPAP and BILEVEL) X SMC ‐ heterogeneity analysis.
Comparison 6 Hospital length of stay, Outcome 3 CPAP X SMC.
Comparison 6 Hospital length of stay, Outcome 4 BILEVEL X SMC.
Comparison 6 Hospital length of stay, Outcome 5 CPAP X BILEVEL.
Comparison 7 ICU length of stay, Outcome 1 NPPV (CPAP and BILEVEL) X SMC.
Comparison 7 ICU length of stay, Outcome 2 CPAP X SMC.
Comparison 7 ICU length of stay, Outcome 3 BILEVEL X SMC.
Comparison 7 ICU length of stay, Outcome 4 CPAP X BILEVEL.
Comparison 8 Breath rate after one hour, Outcome 1 NPPV (CPAP and BILEVEL) X SMC.
Comparison 8 Breath rate after one hour, Outcome 2 CPAP X SMC.
Comparison 8 Breath rate after one hour, Outcome 3 BILEVEL X SMC.
Comparison 8 Breath rate after one hour, Outcome 4 CPAP X BILEVEL.
Comparison 9 Heart rate after one hour, Outcome 1 NPPV (CPAP and BILEVEL) X SMC.
Comparison 9 Heart rate after one hour, Outcome 2 NPPV (CPAP and BILEVEL) X SMC ‐ heterogeneity analysis.
Comparison 9 Heart rate after one hour, Outcome 3 CPAP X SMC.
Comparison 9 Heart rate after one hour, Outcome 4 CPAP X SMC ‐ heterogeneity analysis.
Comparison 9 Heart rate after one hour, Outcome 5 BILEVEL X SMC.
Comparison 9 Heart rate after one hour, Outcome 6 CPAP X BILEVEL.
Comparison 10 Sistolic blood pressure after one hour, Outcome 1 NPPV (CPAP and BILEVEL) X SMC.
Comparison 10 Sistolic blood pressure after one hour, Outcome 2 CPAP X SMC.
Comparison 10 Sistolic blood pressure after one hour, Outcome 3 BILEVEL X SMC.
Comparison 10 Sistolic blood pressure after one hour, Outcome 4 CPAP X BILEVEL.
Comparison 10 Sistolic blood pressure after one hour, Outcome 5 CPAP X BILEVEL ‐ heterogeneity analysis.
Comparison 11 Diastolic blood pressure after one hour, Outcome 1 NPPV (CPAP and BILEVEL) X SMC.
Comparison 11 Diastolic blood pressure after one hour, Outcome 2 CPAP X SMC.
Comparison 11 Diastolic blood pressure after one hour, Outcome 3 CPAP X SMC ‐ heterogeneity analysis.
Comparison 11 Diastolic blood pressure after one hour, Outcome 4 BILEVEL X SMC.
Comparison 11 Diastolic blood pressure after one hour, Outcome 5 CPAP X BILEVEL.
Comparison 11 Diastolic blood pressure after one hour, Outcome 6 CPAP X BILEVEL ‐ heterogeneity analysis.
Comparison 12 Mean blood pressure after one hour, Outcome 1 NPPV (CPAP and BILEVEL) X SMC.
Comparison 12 Mean blood pressure after one hour, Outcome 2 CPAP X SMC.
Comparison 12 Mean blood pressure after one hour, Outcome 3 BILEVEL X SMC.
Comparison 12 Mean blood pressure after one hour, Outcome 4 CPAP X BILEVEL.
Comparison 13 PaO2 (mmHg) after one hour, Outcome 1 NPPV (CPAP and BILEVEL) X SMC.
Comparison 13 PaO2 (mmHg) after one hour, Outcome 2 CPAP X SMC.
Comparison 13 PaO2 (mmHg) after one hour, Outcome 3 CPAP X SMC ‐ heterogeneity analysis.
Comparison 13 PaO2 (mmHg) after one hour, Outcome 4 BILEVEL X SMC.
Comparison 13 PaO2 (mmHg) after one hour, Outcome 5 CPAP X BILEVEL.
Comparison 14 Adverse events, Outcome 1 NPPV (CPAP and BILEVEL) X SMC.
Comparison 14 Adverse events, Outcome 2 NPPV (CPAP and BILEVEL) X SMC ‐ AFTER 2000.
Comparison 14 Adverse events, Outcome 3 CPAP X SMC.
Comparison 14 Adverse events, Outcome 4 BILEVEL X SMC.
Comparison 14 Adverse events, Outcome 5 CPAP X BILEVEL.
Comparison 15 Hospital or 7‐day mortality, Outcome 1 NPPV (CPAP and BILEVEL) X SMC.
Comparison 16 Hospital or 30‐day mortality, Outcome 1 NPPV (CPAP and BILEVEL) X SMC.
Comparison 17 General or 7‐day ETI rate, Outcome 1 NPPV (CPAP and BILEVEL) X SMC.
| Non‐invasive positive pressure ventilation (CPAP and bilevel NPPV) for cardiogenic pulmonary oedema | ||||||
| Patient or population: patients with cardiogenic pulmonary oedema | ||||||
| Outcomes | Illustrative comparative risks* (95% CI) | Relative effect | No of Participants | Quality of the evidence | Comments | |
| Assumed risk | Corresponding risk | |||||
| Control | Non‐invasive positive pressure ventilation (CPAP and bilevel NPPV) | |||||
| Hospital mortalityY | Study population1 | RR 0.66 | 1107 | ⊕⊕⊕⊕ | ||
| 204 per 1000 | 135 per 1000 | |||||
| Moderate1 | ||||||
| 200 per 1000 | 132 per 1000 | |||||
| Endotracheal intubation rate | Study population | RR 0.52 | 1261 | ⊕⊕⊝⊝ | ||
| 249 per 1000 | 130 per 1000 | |||||
| Moderate | ||||||
| 300 per 1000 | 156 per 1000 | |||||
| Incidence of acute myocardial infarction (During intervention) | Study population | RR 1.24 | 461 | ⊕⊕⊕⊝ | ||
| 153 per 1000 | 190 per 1000 | |||||
| Moderate | ||||||
| 169 per 1000 | 210 per 1000 | |||||
| Incidence of acute myocardial infarction (After intervention) | Study population | RR 0.7 | 154 | ⊕⊝⊝⊝ | ||
| 26 per 1000 | 18 per 1000 | |||||
| Moderate | ||||||
| 13 per 1000 | 9 per 1000 | |||||
| Intolerance to allocated treatment | Study population | RR 0.47 | 1848 | ⊕⊕⊕⊝ | ||
| 234 per 1000 | 110 per 1000 | |||||
| Moderate | ||||||
| 350 per 1000 | 165 per 1000 | |||||
| Hospital length of stay | The mean hospital length of stay in the intervention groups was | 542 | ⊕⊝⊝⊝ | |||
| Intensive care unit length of stay (Copy) | The mean intensive care unit length of stay (copy) in the intervention groups was | 222 | ⊕⊕⊝⊝ | |||
| *The basis for the assumed risk (e.g. the median control group risk across studies) is provided in footnotes. The corresponding risk (and its 95% confidence interval) is based on the assumed risk in the comparison group and the relative effect of the intervention (and its 95% CI). | ||||||
| GRADE Working Group grades of evidence | ||||||
| 1 The most studies have mixed populations (with different levels of severity and co‐morbidities). | ||||||
| Study | IPAP level (cmH2O) | EPAP in bievel NPPV (cmH2O) | PEEP in CPAP (cmH2O) | Time of bilevel NPPV (hours) | Time of CPAP (hours) |
| 5.1 (SD 0.3) | 9.8 (SD 1.1) | ||||
| 5 | 10 | 1.6 (SD 0.6) | 1.7 (SD 0.7) | ||
| 5 | 10 | 3.41 (SD 1.1) | 3.6 (SD 1.3) | ||
| 10 | 9.3 (SD 4.9) | ||||
| Crane 2004 | 15 | 5 | 10 | ||
| Ferrari 2007 | 15 (SD 3.1) | 7 (SD 1.2) | 8.8 (SD 1.9) | 6.0 (SD 4.7) | 8.1 (SD 8.3) |
| Ferrari 2009 | 14 (SD 3.1) | 6.7 (SD 1.4) | 8.8 (SD 1.7) | 5.9 (SD 4.0) | 8.4 (SD 7.1) |
| Fontanella 2010 | 18 (SD 3) | 10 (SD 2) | 8 (SD 2) | ||
| Frontin 2010 | 10 | ||||
| Gray 2009 | 14 (SD 5) | 7 (SD 3) | 10 (SD 4) | 2.0 (SD 1.3) | 2.2 (SD 1.5) |
| Kelly 2002 | 7.5 | ||||
| L'Her 2004 | 7.5 | 8 (SD 6) | |||
| Liesching 2003 | 12 | 4 | 10 | ||
| Martin‐Bermudez 2002 | 1.3 (SD 0.8) | 1.8 (SD 1) | |||
| Masip 2000 | 15.2 (SD 2.4) | 5 | 4.2 (SD 1.5) | ||
| Mehta 1997 | 14.35 (SD 1.73) | 5 | 10.08 (SD 1.24) | 7.1 (SD 4.7) | 6.4 (SD 5.8) |
| Moritz 2007 | 12 (SD 3.2) | 4.9 (SD 0.9) | 7.7 (SD 2.1) | 2.8 | 2.3 |
| Nava 2003 | 14.5 (SD 21.1) | 6.1 (SD 3.2) | 11.4 (SD 3.6) | ||
| Park 2001 | 12 | 4 | 7.5 | 2.5 (SD 0.6) | 2.8 (SD 1.5) |
| Park 2004 | 17 (SD 2) | 11 (SD 2) | 11 (SD 2) | 2.0 (SD 1.0) | 1.7 (SD 0.6) |
| Rasanen 1985 | 10 | ||||
| Sharon 2000 | 9.3 (SD 2.3) | 4.2 (SD 3.1) | |||
| Takeda 1997 | 11.9 (SD 8.4) | ||||
| Thys 2002 | 16.5 (SD 3.3) | 6.1 (SD 1.5) | 1.2 (SD 0.2) | ||
| Weitz 2007 | 12.5 (SD 1.2) | 5 | |||
| CPAP ‐ continuous positive airway pressure; EPAP ‐ expiratory positive airway pressure; IPAP ‐ inspiratory positive airway pressure; PEEP ‐ positive expiratory end pressure; SD ‐ standard deviation; * statistically significant. | |||||
| Adverse events | Number of events (CPAP) | Total number CPAP | Number of event (bilevel NPPV) | Total number (bilevel NPPV) | RR (95% CI) |
| Skin damage | 2 | 472 | 17 | 458 | 0.06 (0.01, 0.43)* |
| Pneumonia | 0 | 40 | 1 | 76 | 0.63 (0.03, 15.03) |
| Pulmonary aspiration | 0 | 476 | 1 | 383 | 0.27 (0.01, 6.57) |
| Gastric distention | 5 | 178 | 8 | 51 | 0.18 (0.06, 0.52)* |
| GI bleeding | 0 | 11 | 3 | 85 | 1.02 (0.06, 18.63) |
| Vomitting | 7 | 381 | 9 | 419 | 0.86 (0.32, 2.27) |
| Pneumothorax | 0 | 440 | 1 | 430 | 0.33 (0.01, 7.97) |
| Asphyxia/claustrophobia | 0 | 20 | 1 | 65 | 1.05 (0.04, 24.76) |
| Mask discomfort | 15 | 364 | 22 | 440 | 0.82 (0.43, 1.57) |
| Sinusitis | 0 | 43 | 1 | 65 | 0.50 (0.02, 12.00) |
| Conjunctivitis | 0 | 70 | |||
| Eye irritation | 0 | 20 | |||
| Cardiac arrest | 6 | 333 | 13 | 410 | 0.57 (0.22, 1.48) |
| Stroke | 0 | 65 | |||
| Seizure | 0 | 65 | |||
| Hypotension | 36 | 332 | 37 | 346 | 1.01 (0.66, 1.56) |
| Arrhythmia requiring treatment | 12 | 332 | 25 | 345 | 0.50 (0.25, 0.98)* |
| Progressive respiratory distress | 17 | 333 | 21 | 346 | 0.84 (0.45, 1.57) |
| Increase breathing discomfort | 16 | 287 | 19 | 291 | 0.85 (0.45, 1.63) |
| CI ‐ confidence interval; CPAP ‐ continuous positive airway pressure; RR ‐ relative risk; SD ‐ standard deviation; * statistically significant.. | |||||
| Adverse events | Studies | NPPV group | SMC group | RR (95% CI) |
| Skin damage | 11 studies (Rasanen 1985, Bersten 1991, Takeda 1998, Masip 2000, Kelly 2002, Thys 2002, Nava 2003, Crane 2004, L'Her 2004, Park 2004, Bautin 2005) | 17/318 | 0/276 | 6.62 (1.20, 36.55)* |
| Pneumonia | 3 study (Lin 1991, Nava 2003, Bautin 2005) | 1/116 | 4/116 | 0.35 (0.05, 2.20) |
| Pulmonary aspiration | 5 studies (Rasanen 1985, Bersten 1991, Lin 1991, Kelly 2002, Gray 2008) | 1/787 | 0/468 | 1.58 (0.06, 38,61) |
| Gastrointestinal | 3 study (Takeda 1998, Masip 2000, Nava 2003) | 3/96 | 2/96 | 1,37 (0.27, 6.89) |
| Gastric distension | 8 studies (Rasanen 1985, Bersten 1991, Lin 1991, Takeda 1998, Thys 2002, Park 2004, L'Her 2004, Frotin 2010) | 13/253 | 0/231 | 13.26 ( 0.82, 215.12) |
| Vomiting | 5 studies (Masip 2000, Thys 2002, Crane 2004, Park 2004, Gray 2008) | 16/800 | 8/429 | 1.06 (0.46, 2.47) |
| Asphyxia | 2 study (Bersten 1991, Nava 2003) | 1/85 | 0/85 | 3.00 (0.12, 72.31) |
| Pneumothorax | 6 studies (Bersten 1991, Kelly 2002, Nava 2003, L'Her 2004, Gray 2008, Frotin 2010) | 1/894 | 1/580 | 0.72 (0.08, 6.89) |
| Conjunctivitis | 2 studies (Kelly 2002, L'Her 2004) | 0/70 | 0/77 | inestimable |
| Sinusitis | 2 study (Nava 2003, L'Her 2004) | 1/108 | 0/111 | 3.00 (0.12, 72.31) |
| Mask discomfort | 7 study (Masip 2000, Nava 2003, L'Her 2004, Park 2004, Bautin 2005, Weitz 2007, Frotin 2010) | 7/265 | 0/247 | 5.39 (0.97, 30.09) |
| Hypotension | 1 study (Gray 2008) | 73/678 | 46/352 | 0.82 (0.58, 1.16) |
| Arrhythmia | 1 study (Gray 2008) | 37/677 | 23/350 | 0.83 (0.50, 1.38) |
| Progressive respiratory distress | 2 studies (L'Her 2004, Gray 2008) | 39/722 | 36/400 | 0.58 (0.37, 0.89)* |
| Neurological failure (coma) | 1 study (L'Her 2004) | 1/44 | 11/46 | 0,10 (0.01, 0,71)* |
| Cardiorespiratory arrest | 3 studies (Nava 2003, L'Her 2004, Gray 2008) | 21/786 | 22/466 | 0.60 (0.29, 1.26) |
| Eye irritation | 1 study (Masip 2000) | 0/20 | 0/20 | inestimable |
| Stroke | 1 study (Nava 2003) | 0/65 | 0/65 | inestimable |
| Seizure | 1 study (Nava 2003) | 0/65 | 1/65 | 0.33 (0.01, 8.03) |
| CI ‐ confidence interval; NPPV ‐ noninvasive positive pressure ventilation; RR ‐ relative risk; SMC ‐ standard medical care; * statistically significant. | ||||
| Adverse Events | Studies | CPAP group | SMC group | RR (95% CI) |
| Skin damage | 7 studies (Rasanen 1985, Bersten 1991, Takeda 1998, Kelly 2002, Crane 2004, L'Her 2004, and Park 2004) | 1/168 | 0/175 | 3.00 (0.13, 69.52) |
| Pneumonia | 1 study (Lin 1991) | 0/40 | 0/40 | inestimable |
| Pulmonary aspiration | 5 studies (Rasanen 1985, Bersten 1991, Lin 1991, Kelly 2002, Gray 2008) | 0/440 | 0/468 | inestimable |
| Gastrointestinal | 1 study (Takeda 1998) | 0/11 | 1/11 | 0.33 (0.02,7.39) |
| Gastric distension | 7 studies (Rasanen 1985, Bersten 1991, Lin 1991, Takeda 1998, Park 2004, L'Her 2004, Frotin 2010) | 5/221 | 0/226 | 11.00 ( 0.64, 189.65) |
| Vomiting | 3 studies (Crane 2004, Park 2004, Gray 2008) | 7/381 | 8/404 | 0.93 (0.34, 2.54) |
| Asphyxia | 1 study (Bersten 1991) | 0/20 | 0/20 | inestimable |
| Pneumothorax | 5 studies (Bersten 1991, Kelly 2002, L'Her 2004, Gray 2008, Frotin 2010) | 0/483 | 0/515 | inestimable |
| Conjunctivitis | 2 studies (Kelly 2002, L'Her 2004) | 0/70 | 0/77 | inestimable |
| Sinusitis | 1 study (L'Her 2004) | 0/43 | 0/46 | inestimable |
| Mask discomfort | 3 studies (L'Her 2004, Park 2004, Frotin 2010) | 0/130 | 0/135 | inestimable |
| Hypotension | 1 study (Gray 2008) | 36/332 | 46/352 | 0.83 (0.55, 1.25) |
| Arrhythmia | 1 study (Gray 2008) | 12/332 | 23/350 | 0.55 (0.28, 1.09) |
| Progressive respiratory distress | 2 studies (L'Her 2004, Gray 2008) | 18/376 | 36/400 | 0.53 (0.31, 0.92)* |
| Neurological failure (coma) | 1 study (L'Her 2004) | 1/44 | 11/46 | 0,10 (0.01, 0,71)* |
| Cardiorespiratory arrest | 2 studies (L'Her 2004, Gray 2008) | 8/376 | 21/401 | 0.41 (0.18, 0.91)* |
| CI ‐ confidence interval; CPAP ‐ continuous positive airway pressure; RR ‐ relative risk; SMC ‐ standard medical care; * statistically significant. | ||||
| Adverse Events | Studies | Bilevel NPPV Group | SMC Group | RR (95% CI) |
| Skin damage | 6 studies (Masip 2000, Thys 2002, Nava 2003, Crane 2004, Park 2004, Bautin 2005) | 16/148 | 0/148 | 7.16 (1.27, 40.50)* |
| Pneumonia | 2 study (Nava 2003, Bautin 2005) | 1/76 | 4/76 | 0.35 (0.05, 2.20) |
| Gastrointestinal | 2 studies (Nava 2003, Masip 2000) | 3/85 | 1/85 | 2.32 (0.35, 15.42) |
| Gastric distension | 2 studies (Thys 2002, Park 2004) | 8/32 | 0/32 | 15.87 (0.96, 262.30) |
| Vomiting | 5 studies (Masip 2000, Thys 2002, Crane 2004, Park 2004, Gray 2008) | 9/419 | 8/429 | 1.21 (0.47, 3.11) |
| Pneumothorax | 2 study (Nava 2003, Gray 2008) | 1/411 | 1/421 | 1.01 (0.11, 9.63) |
| Eye irritation | 1 study (Masip 2000) | 0/20 | 0/20 | inestimable |
| Sinusitis | 1 study (Nava 2003) | 1/65 | 0/65 | 3.00 (0.12, 72.31) |
| Mask discomfort | 5 studies (Masip 2000, Nava 2003, Park 2004, Bautin 2005, Weitz 2007) | 7/135 | 0/139 | 5.39 (0.97, 30.09) |
| Claustrophobia | 1 study (Nava 2003) | 1/65 | 0/65 | 3.00 (0.12, 72.31) |
| Cardiac arrest | 2 study (Nava 2003, Gray 2008) | 13/410 | 17/420 | 0.96 (0.25, 3.61) |
| Stroke | 1 study (Nava 2003) | 0/65 | 0/65 | inestimable |
| Seizure | 1 study (Nava 2003) | 0/65 | 1/65 | 0.33 (0.01, 8.03) |
| Pulmonary aspiration | 1 studies (Gray 2008) | 1/347 | 0/357 | 3.09 (0.13, 75.50) |
| Hypotension | 1 study (Gray 2008) | 37/346 | 46/352 | 0.82 (0.54, 1.23) |
| Arrhythmia | 1 study (Gray 2008) | 25/345 | 23/350 | 1.10 (0.64, 1.90) |
| Progressive respiratory distress | 1 study (Gray 2008) | 21/346 | 35/354 | 0.61 (0.36, 1.03) |
| CI ‐ confidence interval; NPPV ‐ noninvasive positive pressure ventilation; RR ‐ relative risk; SMC ‐ standard medical care; * statistically significant. | ||||
| Adverse events | Sstudies | Bilevel NPPV group | CPAP group | RR (95% CI) |
| Skin damage | 5 studies (Mehta 1997, Martin‐Bermudez 2002, Crane 2004, Park 2004, Gray 2008) | 4/400 | 6/390 | 0.64 (0.19, 2.16) |
| Pulmonary aspiration | 3 studies (Mehta 1997, Martin‐Bermudez 2002, Gray 2008) | 1/407 | 0/389 | 2.88 (0.12, 70.43) |
| Gastric distension | 3 studies (Mehta 1997, Martin‐Bermudez 2002, Park 2004) | 8/89 | 5/83 | 1.49 (0.56, 4.00) |
| Vomiting | 4 studies (Martin‐Bermudez 2002, Crane 2004, Park 2004, Gray 2008) | 11/437 | 11/420 | 0.97 (0.43, 2.19) |
| Pneumothorax | 2 studies (Mehta 1997, Gray 2008) | 1/365 | 0/350 | 2.89 (0.12, 70.63) |
| Mask discomfort | 4 studies (Mehta 1997, Martin‐Bermudez 2002, Park 2004, Gray 2008) | 17/375 | 16/360 | 1.03 (0.53, 2.00) |
| Increased breathing discomfort | 1 study (Gray 2008) | 16/291 | 11/285 | 1.42 (0.67, 3.02) |
| Hypotension | 2 studies (Martin‐Bermudez 2002, Gray 2008) | 41/387 | 40/371 | 0.98 (0.65, 1.48) |
| Arrhythmia | 1 study (Gray 2008) | 25/345 | 12/332 | 2.00 (1.02, 3.92)* |
| Progressive respiratory distress | 1 study (Gray 2008) | 21/346 | 17/333 | 1.19 (0.64, 2.21) |
| Cardiorespiratory arrest | 1 study (Gray 2008) | 10/345 | 6/333 | 1.61 (0.59, 4.38) |
| Pharyngeal damage | 1 study (Martin‐Bermudez 2002) | 1/41 | 1/39 | 0.95 (0.06, 14.69) |
| Cough | 1 study (Martin‐Bermudez 2002) | 1/41 | 1/39 | 0.32 (0.01, 7.57) |
| CI ‐ confidence interval; CPAP ‐ continuous positive airway pressure; NPPV ‐ noninvasive positive pressure ventilation; RR ‐ relative risk; SMC ‐ standard medical care; * statistically significant. | ||||
| Outcome or subgroup title | No. of studies | No. of participants | Statistical method | Effect size |
| 1 NPPV (CPAP and BILEVEL) x SMC Show forest plot | 20 | 1107 | Risk Ratio (M‐H, Random, 95% CI) | 0.66 [0.48, 0.89] |
| 2 NPPV (CPAP and BILEVEL) X SMC ‐ sensitivity analysis Show forest plot | 18 | 1023 | Risk Ratio (M‐H, Random, 95% CI) | 0.65 [0.46, 0.91] |
| 3 NPPV (CPAP and BILEVEL) X SMC‐ ED place Show forest plot | 9 | 717 | Risk Ratio (M‐H, Random, 95% CI) | 0.55 [0.36, 0.86] |
| 4 NPPV (CPAP and BILEVEL) X SMC ‐ ICU place Show forest plot | 7 | 365 | Risk Ratio (M‐H, Random, 95% CI) | 0.48 [0.28, 0.83] |
| 5 NPPV (CPAP and BILEVEL) X SMC ‐ in patients hypercanics ‐ baseline Show forest plot | 9 | 603 | Risk Ratio (M‐H, Random, 95% CI) | 0.60 [0.40, 0.88] |
| 6 CPAP x SMC Show forest plot | 13 | 699 | Risk Ratio (M‐H, Random, 95% CI) | 0.60 [0.39, 0.94] |
| 7 CPAP X SMC ‐ sensitivity analysis Show forest plot | 12 | 659 | Risk Difference (M‐H, Random, 95% CI) | ‐0.12 [‐0.19, ‐0.04] |
| 8 BILEVEL X SMC Show forest plot | 11 | 506 | Risk Ratio (M‐H, Random, 95% CI) | 0.65 [0.39, 1.09] |
| 9 BILEVEL X SMC ‐ sensitivity analysis Show forest plot | 9 | 458 | Risk Ratio (M‐H, Random, 95% CI) | 0.63 [0.37, 1.09] |
| 10 BILEVEL X SMC ‐ in patients hypercanics ‐ baseline Show forest plot | 7 | 401 | Risk Ratio (M‐H, Random, 95% CI) | 0.59 [0.34, 1.02] |
| 11 BILEVEL X SMC ‐ in patients hypercanics Show forest plot | 2 | 104 | Risk Ratio (M‐H, Random, 95% CI) | 0.20 [0.04, 0.86] |
| 12 CPAP X BILEVEL Show forest plot | 12 | 694 | Risk Ratio (M‐H, Random, 95% CI) | 1.10 [0.61, 1.97] |
| 13 CPAP X BILEVEL ‐ in patients hypercanics ‐ baseline Show forest plot | 9 | 518 | Risk Ratio (M‐H, Random, 95% CI) | 0.98 [0.45, 2.14] |
| 14 CPAP X BILEVEL ‐ in patients hypercanics Show forest plot | 2 | 98 | Risk Ratio (M‐H, Random, 95% CI) | 1.06 [0.33, 3.37] |
| Outcome or subgroup title | No. of studies | No. of participants | Statistical method | Effect size |
| 1 NPPV (CPAP and BILEVEL) X SMC Show forest plot | 22 | 1261 | Risk Ratio (M‐H, Random, 95% CI) | 0.52 [0.36, 0.75] |
| 2 NPPV (CPAP and BILEVEL) X SMC ‐ sensitivity analysis Show forest plot | 20 | 1195 | Risk Ratio (M‐H, Random, 95% CI) | 0.53 [0.37, 0.78] |
| 3 NPPV (CPAP and BILEVEL) X SMC ‐ in patients hypercapnics ‐ baseline Show forest plot | 9 | 621 | Risk Ratio (M‐H, Random, 95% CI) | 0.44 [0.25, 0.77] |
| 4 CPAP X SMC Show forest plot | 14 | 825 | Risk Ratio (M‐H, Random, 95% CI) | 0.47 [0.33, 0.67] |
| 5 CPAP X SMC ‐ sensitivity analysis Show forest plot | 13 | 785 | Risk Ratio (M‐H, Random, 95% CI) | 0.48 [0.34, 0.67] |
| 6 BILEVEL X SMC Show forest plot | 12 | 536 | Risk Ratio (M‐H, Random, 95% CI) | 0.55 [0.26, 1.17] |
| 7 BILEVEL X SMC ‐ sensitivity analysis Show forest plot | 10 | 470 | Risk Ratio (M‐H, Random, 95% CI) | 0.45 [0.26, 0.80] |
| 8 BILEVEL X SMC ‐ in patients hypercapnics ‐ baseline Show forest plot | 7 | 401 | Risk Ratio (M‐H, Random, 95% CI) | 0.47 [0.22, 0.97] |
| 9 BILEVEL X SMC ‐ in patients hypercapnics Show forest plot | 3 | 120 | Risk Ratio (M‐H, Random, 95% CI) | 0.28 [0.12, 0.69] |
| 10 CPAP X BILEVEL Show forest plot | 13 | 721 | Risk Ratio (M‐H, Random, 95% CI) | 1.04 [0.55, 1.97] |
| 11 CPAP X BILEVEL ‐ in patients hypercapnics ‐ baseline Show forest plot | 9 | 518 | Risk Ratio (M‐H, Random, 95% CI) | 1.17 [0.58, 2.33] |
| 12 CPAP X BILEVEL ‐ in patients hypercapnics Show forest plot | 2 | 98 | Risk Ratio (M‐H, Random, 95% CI) | 0.92 [0.26, 3.21] |
| Outcome or subgroup title | No. of studies | No. of participants | Statistical method | Effect size |
| 1 NPPV (CPAP and BILEVEL) X SMC Show forest plot | 8 | 461 | Risk Ratio (M‐H, Random, 95% CI) | 1.24 [0.79, 1.95] |
| 2 CPAP X SMC Show forest plot | 3 | 152 | Risk Ratio (M‐H, Random, 95% CI) | 0.91 [0.37, 2.24] |
| 3 BILEVEL X SMC Show forest plot | 7 | 356 | Risk Ratio (M‐H, Random, 95% CI) | 1.40 [0.78, 2.49] |
| 4 CPAP X BILEVEL Show forest plot | 7 | 409 | Risk Ratio (M‐H, Random, 95% CI) | 0.66 [0.39, 1.10] |
| 5 BILEVEL X SMC ‐ heterogeneity analysis Show forest plot | 6 | 316 | Risk Ratio (M‐H, Random, 95% CI) | 1.14 [0.69, 1.88] |
| Outcome or subgroup title | No. of studies | No. of participants | Statistical method | Effect size |
| 1 NPPV (CPAP and BILEVEL) X SMC Show forest plot | 4 | 154 | Risk Ratio (M‐H, Random, 95% CI) | 0.70 [0.11, 4.26] |
| 2 CPAP X SMC Show forest plot | 2 | 99 | Risk Ratio (M‐H, Random, 95% CI) | 1.08 [0.11, 10.23] |
| 3 BILEVEL X SMC Show forest plot | 3 | 65 | Risk Ratio (M‐H, Random, 95% CI) | 0.52 [0.02, 11.54] |
| 4 CPAP X BILEVEL Show forest plot | 2 | 68 | Risk Ratio (M‐H, Random, 95% CI) | 1.57 [0.57, 4.32] |
| Outcome or subgroup title | No. of studies | No. of participants | Statistical method | Effect size |
| 1 NPPV (CPAP and BILEVEL) X SMC Show forest plot | 13 | 1848 | Risk Ratio (M‐H, Random, 95% CI) | 0.47 [0.29, 0.77] |
| 2 NPPV (CPAP and BILEVEL) X SMC ‐ heterogeneity analysis Show forest plot | 12 | 692 | Risk Ratio (M‐H, Random, 95% CI) | 0.42 [0.30, 0.58] |
| 3 CPAP X SMC Show forest plot | 9 | 1304 | Risk Ratio (M‐H, Random, 95% CI) | 0.55 [0.36, 0.85] |
| 4 BILEVEL X SMC Show forest plot | 7 | 995 | Risk Ratio (M‐H, Random, 95% CI) | 0.58 [0.24, 1.42] |
| 5 CPAP X BILEVEL Show forest plot | 3 | 894 | Risk Ratio (M‐H, Random, 95% CI) | 0.94 [0.35, 2.53] |
| Outcome or subgroup title | No. of studies | No. of participants | Statistical method | Effect size |
| 1 NPPV (CPAP and BILEVEL) X SMC Show forest plot | 10 | 542 | Mean Difference (IV, Random, 95% CI) | ‐0.80 [‐2.10, 0.51] |
| 2 NPPV (CPAP and BILEVEL) X SMC ‐ heterogeneity analysis Show forest plot | 9 | 519 | Mean Difference (IV, Random, 95% CI) | ‐0.38 [‐1.35, 0.58] |
| 3 CPAP X SMC Show forest plot | 5 | 337 | Mean Difference (IV, Random, 95% CI) | ‐0.51 [‐1.69, 0.67] |
| 4 BILEVEL X SMC Show forest plot | 7 | 311 | Mean Difference (IV, Random, 95% CI) | ‐1.38 [‐3.38, 0.62] |
| 5 CPAP X BILEVEL Show forest plot | 6 | 402 | Mean Difference (IV, Random, 95% CI) | ‐0.46 [‐1.99, 1.07] |
| Outcome or subgroup title | No. of studies | No. of participants | Statistical method | Effect size |
| 1 NPPV (CPAP and BILEVEL) X SMC Show forest plot | 6 | 222 | Mean Difference (IV, Random, 95% CI) | ‐0.89 [‐1.33, ‐0.45] |
| 2 CPAP X SMC Show forest plot | 3 | 169 | Mean Difference (IV, Random, 95% CI) | ‐1.09 [‐1.63, ‐0.56] |
| 3 BILEVEL X SMC Show forest plot | 3 | 53 | Std. Mean Difference (IV, Random, 95% CI) | ‐0.65 [‐1.37, 0.06] |
| 4 CPAP X BILEVEL Show forest plot | 3 | 159 | Mean Difference (IV, Random, 95% CI) | 0.31 [‐0.78, 1.40] |
| Outcome or subgroup title | No. of studies | No. of participants | Statistical method | Effect size |
| 1 NPPV (CPAP and BILEVEL) X SMC Show forest plot | 9 | 438 | Mean Difference (IV, Random, 95% CI) | ‐2.86 [‐3.85, ‐1.87] |
| 2 CPAP X SMC Show forest plot | 7 | 300 | Mean Difference (IV, Random, 95% CI) | ‐2.39 [‐3.70, ‐1.07] |
| 3 BILEVEL X SMC Show forest plot | 6 | 254 | Mean Difference (IV, Random, 95% CI) | ‐3.52 [‐4.80, ‐2.23] |
| 4 CPAP X BILEVEL Show forest plot | 5 | 218 | Mean Difference (IV, Random, 95% CI) | 0.57 [1.00, 2.13] |
| Outcome or subgroup title | No. of studies | No. of participants | Statistical method | Effect size |
| 1 NPPV (CPAP and BILEVEL) X SMC Show forest plot | 9 | 438 | Mean Difference (IV, Random, 95% CI) | ‐4.01 [‐8.16, 0.15] |
| 2 NPPV (CPAP and BILEVEL) X SMC ‐ heterogeneity analysis Show forest plot | 7 | 329 | Mean Difference (IV, Random, 95% CI) | ‐3.79 [‐6.88, ‐0.70] |
| 3 CPAP X SMC Show forest plot | 7 | 300 | Mean Difference (IV, Random, 95% CI) | ‐4.45 [‐10.81, 1.92] |
| 4 CPAP X SMC ‐ heterogeneity analysis Show forest plot | 5 | 191 | Mean Difference (IV, Random, 95% CI) | ‐4.10 [‐8.93, 0.72] |
| 5 BILEVEL X SMC Show forest plot | 6 | 254 | Mean Difference (IV, Random, 95% CI) | ‐4.21 [‐7.77, ‐0.65] |
| 6 CPAP X BILEVEL Show forest plot | 4 | 182 | Mean Difference (IV, Random, 95% CI) | ‐0.56 [‐5.22, 4.11] |
| Outcome or subgroup title | No. of studies | No. of participants | Statistical method | Effect size |
| 1 NPPV (CPAP and BILEVEL) X SMC Show forest plot | 6 | 182 | Mean Difference (IV, Random, 95% CI) | ‐1.64 [‐7.83, 4.56] |
| 2 CPAP X SMC Show forest plot | 6 | 211 | Mean Difference (IV, Random, 95% CI) | 0.12 [‐6.56, 6.81] |
| 3 BILEVEL X SMC Show forest plot | 4 | 87 | Mean Difference (IV, Random, 95% CI) | 1.93 [‐7.94, 11.80] |
| 4 CPAP X BILEVEL Show forest plot | 4 | 182 | Mean Difference (IV, Random, 95% CI) | ‐1.17 [‐10.79, 8.44] |
| 5 CPAP X BILEVEL ‐ heterogeneity analysis Show forest plot | 3 | 136 | Mean Difference (IV, Random, 95% CI) | 2.57 [‐4.30, 9.44] |
| Outcome or subgroup title | No. of studies | No. of participants | Statistical method | Effect size |
| 1 NPPV (CPAP and BILEVEL) X SMC Show forest plot | 5 | 138 | Mean Difference (IV, Random, 95% CI) | ‐1.49 [‐6.43, 3.45] |
| 2 CPAP X SMC Show forest plot | 5 | 167 | Mean Difference (IV, Random, 95% CI) | ‐0.92 [‐9.10, 7.27] |
| 3 CPAP X SMC ‐ heterogeneity analysis Show forest plot | 3 | 107 | Mean Difference (IV, Random, 95% CI) | ‐7.32 [‐12.79, ‐1.86] |
| 4 BILEVEL X SMC Show forest plot | 4 | 87 | Mean Difference (IV, Random, 95% CI) | ‐0.96 [‐6.09, 4.16] |
| 5 CPAP X BILEVEL Show forest plot | 4 | 182 | Mean Difference (IV, Random, 95% CI) | ‐2.60 [‐9.58, 4.37] |
| 6 CPAP X BILEVEL ‐ heterogeneity analysis Show forest plot | 2 | 62 | Mean Difference (IV, Random, 95% CI) | ‐7.86 [‐13.03, ‐2.70] |
| Outcome or subgroup title | No. of studies | No. of participants | Statistical method | Effect size |
| 1 NPPV (CPAP and BILEVEL) X SMC Show forest plot | 3 | 256 | Mean Difference (IV, Random, 95% CI) | ‐2.41 [‐8.27, 3.45] |
| 2 CPAP X SMC Show forest plot | 1 | 89 | Mean Difference (IV, Random, 95% CI) | 3.00 [‐5.31, 11.31] |
| 3 BILEVEL X SMC Show forest plot | 2 | 167 | Mean Difference (IV, Random, 95% CI) | ‐5.42 [‐11.60, 0.76] |
| 4 CPAP X BILEVEL Show forest plot | 1 | 80 | Mean Difference (IV, Random, 95% CI) | ‐4.40 [‐13.25, 4.45] |
| Outcome or subgroup title | No. of studies | No. of participants | Statistical method | Effect size |
| 1 NPPV (CPAP and BILEVEL) X SMC Show forest plot | 4 | 140 | Mean Difference (IV, Random, 95% CI) | 10.04 [1.09, 19.00] |
| 2 CPAP X SMC Show forest plot | 5 | 177 | Mean Difference (IV, Random, 95% CI) | ‐2.64 [‐25.87, 20.59] |
| 3 CPAP X SMC ‐ heterogeneity analysis Show forest plot | 3 | 117 | Mean Difference (IV, Random, 95% CI) | ‐22.09 [‐34.35, ‐9.83] |
| 4 BILEVEL X SMC Show forest plot | 3 | 79 | Mean Difference (IV, Random, 95% CI) | 4.79 [‐11.11, 20.69] |
| 5 CPAP X BILEVEL Show forest plot | 3 | 136 | Mean Difference (IV, Random, 95% CI) | ‐27.00 [‐44.75, ‐9.25] |
| Outcome or subgroup title | No. of studies | No. of participants | Statistical method | Effect size |
| 1 NPPV (CPAP and BILEVEL) X SMC Show forest plot | 15 | 11329 | Risk Ratio (M‐H, Random, 95% CI) | 0.85 [0.63, 1.16] |
| 1.1 Skin damage | 11 | 594 | Risk Ratio (M‐H, Random, 95% CI) | 6.62 [1.20, 36.55] |
| 1.2 Pneumonia | 3 | 232 | Risk Ratio (M‐H, Random, 95% CI) | 0.35 [0.05, 2.20] |
| 1.3 Pulmonary aspiration | 5 | 1255 | Risk Ratio (M‐H, Random, 95% CI) | 1.58 [0.06, 38.61] |
| 1.4 Gastrointestinal Bleeding | 3 | 192 | Risk Ratio (M‐H, Random, 95% CI) | 1.37 [0.27, 6.89] |
| 1.5 Gastric distention | 8 | 484 | Risk Ratio (M‐H, Random, 95% CI) | 13.26 [0.82, 215.12] |
| 1.6 Vomiting | 5 | 1229 | Risk Ratio (M‐H, Random, 95% CI) | 1.06 [0.46, 2.47] |
| 1.7 Asphyxia | 2 | 170 | Risk Ratio (M‐H, Random, 95% CI) | 3.0 [0.12, 72.31] |
| 1.8 Pneumothorax | 6 | 1474 | Risk Ratio (M‐H, Random, 95% CI) | 0.72 [0.08, 6.89] |
| 1.9 Conjunctivitis | 2 | 147 | Risk Ratio (M‐H, Random, 95% CI) | 0.0 [0.0, 0.0] |
| 1.10 Sinusitis | 2 | 219 | Risk Ratio (M‐H, Random, 95% CI) | 3.0 [0.12, 72.31] |
| 1.11 Disconfort with mask | 7 | 512 | Risk Ratio (M‐H, Random, 95% CI) | 5.39 [0.97, 30.09] |
| 1.12 Hypotension | 1 | 1030 | Risk Ratio (M‐H, Random, 95% CI) | 0.82 [0.58, 1.16] |
| 1.13 Arrhythmia | 1 | 1027 | Risk Ratio (M‐H, Random, 95% CI) | 0.83 [0.50, 1.38] |
| 1.14 Progressive respiratory distress | 2 | 1122 | Risk Ratio (M‐H, Random, 95% CI) | 0.58 [0.37, 0.89] |
| 1.15 Cardiorespiratory arrest | 3 | 1252 | Risk Ratio (M‐H, Random, 95% CI) | 0.60 [0.29, 1.26] |
| 1.16 Neurological failure (coma) | 1 | 90 | Risk Ratio (M‐H, Random, 95% CI) | 0.10 [0.01, 0.71] |
| 1.17 Eye irritation | 1 | 40 | Risk Ratio (M‐H, Random, 95% CI) | 0.0 [0.0, 0.0] |
| 1.18 Stroke | 1 | 130 | Risk Ratio (M‐H, Random, 95% CI) | 0.0 [0.0, 0.0] |
| 1.19 Seizures | 1 | 130 | Risk Ratio (M‐H, Random, 95% CI) | 0.33 [0.01, 8.03] |
| 2 NPPV (CPAP and BILEVEL) X SMC ‐ AFTER 2000 Show forest plot | 11 | 10703 | Risk Ratio (M‐H, Random, 95% CI) | 0.87 [0.63, 1.19] |
| 2.1 Skin damage | 8 | 492 | Risk Ratio (M‐H, Random, 95% CI) | 6.62 [1.20, 36.55] |
| 2.2 Pneumonia | 2 | 152 | Risk Ratio (M‐H, Random, 95% CI) | 0.35 [0.05, 2.20] |
| 2.3 Pulmonary aspiration | 2 | 1095 | Risk Ratio (M‐H, Random, 95% CI) | 1.58 [0.06, 38.61] |
| 2.4 Gastrointestinal Bleeding | 2 | 170 | Risk Ratio (M‐H, Random, 95% CI) | 2.32 [0.35, 15.42] |
| 2.5 Gastric distention | 4 | 302 | Risk Ratio (M‐H, Random, 95% CI) | 13.26 [0.82, 215.12] |
| 2.6 Vomiting | 5 | 1229 | Risk Ratio (M‐H, Random, 95% CI) | 1.06 [0.46, 2.47] |
| 2.7 Asphyxia | 1 | 130 | Risk Ratio (M‐H, Random, 95% CI) | 3.0 [0.12, 72.31] |
| 2.8 Pneumothorax | 5 | 1434 | Risk Ratio (M‐H, Random, 95% CI) | 0.72 [0.08, 6.89] |
| 2.9 Conjunctivitis | 2 | 147 | Risk Ratio (M‐H, Random, 95% CI) | 0.0 [0.0, 0.0] |
| 2.10 Sinusitis | 2 | 219 | Risk Ratio (M‐H, Random, 95% CI) | 3.0 [0.12, 72.31] |
| 2.11 Disconfort with mask | 7 | 512 | Risk Ratio (M‐H, Random, 95% CI) | 5.39 [0.97, 30.09] |
| 2.12 Hypotension | 1 | 1030 | Risk Ratio (M‐H, Random, 95% CI) | 0.82 [0.58, 1.16] |
| 2.13 Arrhythmia | 1 | 1027 | Risk Ratio (M‐H, Random, 95% CI) | 0.83 [0.50, 1.38] |
| 2.14 Progressive respiratory distress | 2 | 1122 | Risk Ratio (M‐H, Random, 95% CI) | 0.58 [0.37, 0.89] |
| 2.15 Cardiorespiratory arrest | 3 | 1252 | Risk Ratio (M‐H, Random, 95% CI) | 0.60 [0.29, 1.26] |
| 2.16 Neurological failure (coma) | 1 | 90 | Risk Ratio (M‐H, Random, 95% CI) | 0.10 [0.01, 0.71] |
| 2.17 Eye irritation | 1 | 40 | Risk Ratio (M‐H, Random, 95% CI) | 0.0 [0.0, 0.0] |
| 2.18 Stroke | 1 | 130 | Risk Ratio (M‐H, Random, 95% CI) | 0.0 [0.0, 0.0] |
| 2.19 Seizures | 1 | 130 | Risk Ratio (M‐H, Random, 95% CI) | 0.33 [0.01, 8.03] |
| 3 CPAP X SMC Show forest plot | 10 | 7133 | Risk Ratio (M‐H, Random, 95% CI) | 0.63 [0.45, 0.87] |
| 3.1 Skin damage | 7 | 343 | Risk Ratio (M‐H, Random, 95% CI) | 3.0 [0.13, 69.52] |
| 3.2 Pneumonia | 1 | 80 | Risk Ratio (M‐H, Random, 95% CI) | 0.0 [0.0, 0.0] |
| 3.3 Pulmonary aspiration | 5 | 908 | Risk Ratio (M‐H, Random, 95% CI) | 0.0 [0.0, 0.0] |
| 3.4 Gastrointestinal Bleeding | 1 | 22 | Risk Ratio (M‐H, Random, 95% CI) | 0.33 [0.02, 7.39] |
| 3.5 Gastric distention | 7 | 447 | Risk Ratio (M‐H, Random, 95% CI) | 11.00 [0.64, 189.65] |
| 3.6 Vomiting | 3 | 785 | Risk Ratio (M‐H, Random, 95% CI) | 0.93 [0.34, 2.54] |
| 3.7 Asphyxia | 1 | 40 | Risk Ratio (M‐H, Random, 95% CI) | 0.0 [0.0, 0.0] |
| 3.8 Pneumothorax | 5 | 998 | Risk Ratio (M‐H, Random, 95% CI) | 0.0 [0.0, 0.0] |
| 3.9 Conjunctivitis | 2 | 147 | Risk Ratio (M‐H, Random, 95% CI) | 0.0 [0.0, 0.0] |
| 3.10 Sinusitis | 1 | 89 | Risk Ratio (M‐H, Random, 95% CI) | 0.0 [0.0, 0.0] |
| 3.11 Disconfort with mask | 3 | 265 | Risk Ratio (M‐H, Random, 95% CI) | 0.0 [0.0, 0.0] |
| 3.12 Hypotension | 1 | 684 | Risk Ratio (M‐H, Random, 95% CI) | 0.83 [0.55, 1.25] |
| 3.13 Arrhythmia | 1 | 682 | Risk Ratio (M‐H, Random, 95% CI) | 0.55 [0.28, 1.09] |
| 3.14 Progressive respiratory distress | 2 | 776 | Risk Ratio (M‐H, Random, 95% CI) | 0.53 [0.31, 0.92] |
| 3.15 Cardiorespiratory arrest | 2 | 777 | Risk Ratio (M‐H, Random, 95% CI) | 0.41 [0.18, 0.91] |
| 3.16 Neurological failure (coma) | 1 | 90 | Risk Ratio (M‐H, Random, 95% CI) | 0.10 [0.01, 0.71] |
| 4 BILEVEL X SMC Show forest plot | 8 | 6823 | Risk Ratio (M‐H, Random, 95% CI) | 1.05 [0.76, 1.46] |
| 4.1 Skin damage | 6 | 296 | Risk Ratio (M‐H, Random, 95% CI) | 7.16 [1.27, 40.50] |
| 4.2 Nosocomial pneumonia | 2 | 152 | Risk Ratio (M‐H, Random, 95% CI) | 0.35 [0.05, 2.20] |
| 4.3 Disconfort with mask | 5 | 274 | Risk Ratio (M‐H, Random, 95% CI) | 5.39 [0.97, 30.09] |
| 4.4 Gastrointestinal bleeding | 2 | 170 | Risk Ratio (M‐H, Random, 95% CI) | 2.32 [0.35, 15.42] |
| 4.5 Gastric dilatation | 2 | 64 | Risk Ratio (M‐H, Random, 95% CI) | 15.87 [0.96, 262.30] |
| 4.6 Vomiting | 5 | 848 | Risk Ratio (M‐H, Random, 95% CI) | 1.21 [0.47, 3.11] |
| 4.7 Claustrophobia | 1 | 130 | Risk Ratio (M‐H, Random, 95% CI) | 3.0 [0.12, 72.31] |
| 4.8 Pneumothorax | 2 | 832 | Risk Ratio (M‐H, Random, 95% CI) | 1.01 [0.11, 9.63] |
| 4.9 Eye irritation | 1 | 40 | Risk Ratio (M‐H, Random, 95% CI) | 0.0 [0.0, 0.0] |
| 4.10 Sinusitis | 1 | 130 | Risk Ratio (M‐H, Random, 95% CI) | 3.0 [0.12, 72.31] |
| 4.11 Cardiac arrest | 2 | 830 | Risk Ratio (M‐H, Random, 95% CI) | 0.96 [0.25, 3.61] |
| 4.12 Stroke | 1 | 130 | Risk Ratio (M‐H, Random, 95% CI) | 0.0 [0.0, 0.0] |
| 4.13 Seizures | 1 | 130 | Risk Ratio (M‐H, Random, 95% CI) | 0.33 [0.01, 8.03] |
| 4.14 Gastric aspiration | 1 | 704 | Risk Ratio (M‐H, Random, 95% CI) | 3.09 [0.13, 75.50] |
| 4.15 Hypotension | 1 | 698 | Risk Ratio (M‐H, Random, 95% CI) | 0.82 [0.54, 1.23] |
| 4.16 Arrhythmia | 1 | 695 | Risk Ratio (M‐H, Random, 95% CI) | 1.10 [0.64, 1.90] |
| 4.17 Progressive respiratory distress | 1 | 700 | Risk Ratio (M‐H, Random, 95% CI) | 0.61 [0.36, 1.03] |
| 5 CPAP X BILEVEL Show forest plot | 5 | 7593 | Risk Ratio (M‐H, Random, 95% CI) | 1.18 [0.94, 1.48] |
| 5.1 Skin damage | 5 | 790 | Risk Ratio (M‐H, Random, 95% CI) | 0.64 [0.19, 2.16] |
| 5.2 Pneumothorax | 2 | 715 | Risk Ratio (M‐H, Random, 95% CI) | 2.89 [0.12, 70.63] |
| 5.3 Pulmonary aspiration | 3 | 796 | Risk Ratio (M‐H, Random, 95% CI) | 2.88 [0.12, 70.43] |
| 5.4 Gastric distension | 3 | 172 | Risk Ratio (M‐H, Random, 95% CI) | 1.49 [0.56, 4.00] |
| 5.5 Vomiting | 4 | 857 | Risk Ratio (M‐H, Random, 95% CI) | 0.97 [0.43, 2.19] |
| 5.6 Disconfort with mask | 4 | 735 | Risk Ratio (M‐H, Random, 95% CI) | 1.03 [0.53, 2.00] |
| 5.7 Increased breathing discomfort | 1 | 576 | Risk Ratio (M‐H, Random, 95% CI) | 1.42 [0.67, 3.02] |
| 5.8 Hypotension | 2 | 758 | Risk Ratio (M‐H, Random, 95% CI) | 0.98 [0.65, 1.48] |
| 5.9 Arrhythmia | 1 | 677 | Risk Ratio (M‐H, Random, 95% CI) | 2.00 [1.02, 3.92] |
| 5.10 Progressive respiratory distress | 1 | 679 | Risk Ratio (M‐H, Random, 95% CI) | 1.19 [0.64, 2.21] |
| 5.11 Cardiorespiratory arrest | 1 | 678 | Risk Ratio (M‐H, Random, 95% CI) | 1.61 [0.59, 4.38] |
| 5.12 Pharyngeal damage | 1 | 80 | Risk Ratio (M‐H, Random, 95% CI) | 0.95 [0.06, 14.69] |
| 5.13 Cough | 1 | 80 | Risk Ratio (M‐H, Random, 95% CI) | 0.32 [0.01, 7.57] |
| Outcome or subgroup title | No. of studies | No. of participants | Statistical method | Effect size |
| 1 NPPV (CPAP and BILEVEL) X SMC Show forest plot | 21 | 2263 | Risk Ratio (M‐H, Random, 95% CI) | 0.72 [0.55, 0.94] |
| Outcome or subgroup title | No. of studies | No. of participants | Statistical method | Effect size |
| 1 NPPV (CPAP and BILEVEL) X SMC Show forest plot | 22 | 2387 | Risk Ratio (M‐H, Random, 95% CI) | 0.75 [0.60, 0.95] |
| Outcome or subgroup title | No. of studies | No. of participants | Statistical method | Effect size |
| 1 NPPV (CPAP and BILEVEL) X SMC Show forest plot | 23 | 2417 | Risk Ratio (M‐H, Random, 95% CI) | 0.55 [0.38, 0.78] |