Tapones anales para tratar la incontinencia fecal
References
Referencias de los estudios incluidos en esta revisión
Referencias adicionales
Jump to:
Referencias de otras versiones publicadas de esta revisión
Jump to:
Characteristics of studies
Characteristics of included studies [ordered by study ID]
| Methods | Randomised controlled trial (2:1) | |
| Participants | Forty eight patients took part in the trial (28 children, age > 4 years; and 20 young adults, age 16 to 45 years) | |
| Interventions | 1. Polyurethane anal plug (Conveen, Coloplast) (two sizes) | |
| Outcomes | ‐ Functional Status II‐R ‐SF‐36 ‐ a Patient‐Generated Index of Quality of Life (PGI) ‐ a Carer‐Generated Index (CGI) of Quality of Life ‐ the Dartmouth COOP Charts ‐ a condition‐ specific measure developed for the research ‐ qualitative data: advantages and disadvantages of the plug ‐ health service utilisation data ‐ costs data ‐ evaluation of education package | |
| Notes | 31 (16 children and 15 adults) allocated plugs; 17 (12 children and 5 adults) allocated to no plugs. | |
| Risk of bias | ||
| Bias | Authors' judgement | Support for judgement |
| Allocation concealment (selection bias) | Low risk | A ‐ Adequate |
| Methods | Randomised cross‐over trial | |
| Participants | Adult outpatients (n = 34) attending a specialist colorectal hospital after failure of previous treatment | |
| Interventions | 1. Polyurethane anal plug (Conveen, Coloplast) 37 mm diameter when open | |
| Outcomes | ‐ comfort of inserting plug ‐ comfort of plug in use ‐ comfort of taking plug out ‐ capacity of controlling faecal leakage ‐ preference ‐ patient characteristics which predict when the plug will help the most | |
| Notes | Of the 34 patients offered the plug, 4 refused as they disliked the idea, 2 failed to attend, 8 dropped out after trying first plug, because of discomfort and 9 dropped out after trying one size of plug, refusing to try the second size. 11 patients completed the protocol. | |
| Risk of bias | ||
| Bias | Authors' judgement | Support for judgement |
| Allocation concealment (selection bias) | Unclear risk | B ‐ Unclear |
| Methods | Randomised cross‐over trial | |
| Participants | 38 partially continent or incontinent patients following imperforate anus repair (age > 6 to 15) | |
| Interventions | 1. Polyurethane anal plug (Conveen, Coloplast) (size closed/open diameter of 14.5/38mm or 15.5/45mm; depending on anal canal diameter) | |
| Outcomes | ‐ stool consistency | |
| Notes | 38 patients included. | |
| Risk of bias | ||
| Bias | Authors' judgement | Support for judgement |
| Allocation concealment (selection bias) | Unclear risk | B ‐ Unclear |
| Methods | Randomised cross‐over trial | |
| Participants | 7 patients (4 to 12 yrs; 3 girls and 4 boys) with high type of imperforate anus; and 9 patients with spina bifida (6 to 13 yrs, 2 girls and 7 boys) | |
| Interventions | 1. Polyurethane anal plug (Conveen, Coloplast) (size 12 or 13mm; depending on preference). | |
| Outcomes | ‐ number of stools | |
| Notes | 16 patients included. | |
| Risk of bias | ||
| Bias | Authors' judgement | Support for judgement |
| Allocation concealment (selection bias) | Unclear risk | B ‐ Unclear |
Data and analyses
| Outcome or subgroup title | No. of studies | No. of participants | Statistical method | Effect size | |||||||||
| 1 General health improved ‐ adults Show forest plot | 1 | Risk Ratio (M‐H, Fixed, 95% CI) | Totals not selected | ||||||||||
| Analysis 1.1  Comparison 1 Anal plugs versus no plugs, Outcome 1 General health improved ‐ adults. | |||||||||||||
| 2 Bodily pain improved ‐ adults Show forest plot | 1 | Risk Ratio (M‐H, Fixed, 95% CI) | Totals not selected | ||||||||||
| Analysis 1.2  Comparison 1 Anal plugs versus no plugs, Outcome 2 Bodily pain improved ‐ adults. | |||||||||||||
| 3 Well being (adults) improved Show forest plot | 1 | Risk Ratio (M‐H, Fixed, 95% CI) | Totals not selected | ||||||||||
| Analysis 1.3 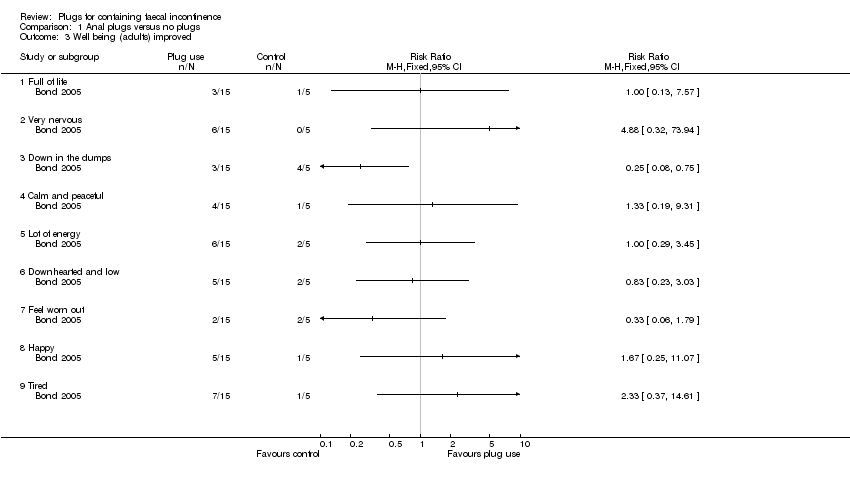 Comparison 1 Anal plugs versus no plugs, Outcome 3 Well being (adults) improved. | |||||||||||||
| 3.1 Full of life | 1 | Risk Ratio (M‐H, Fixed, 95% CI) | 0.0 [0.0, 0.0] | ||||||||||
| 3.2 Very nervous | 1 | Risk Ratio (M‐H, Fixed, 95% CI) | 0.0 [0.0, 0.0] | ||||||||||
| 3.3 Down in the dumps | 1 | Risk Ratio (M‐H, Fixed, 95% CI) | 0.0 [0.0, 0.0] | ||||||||||
| 3.4 Calm and peaceful | 1 | Risk Ratio (M‐H, Fixed, 95% CI) | 0.0 [0.0, 0.0] | ||||||||||
| 3.5 Lot of energy | 1 | Risk Ratio (M‐H, Fixed, 95% CI) | 0.0 [0.0, 0.0] | ||||||||||
| 3.6 Downhearted and low | 1 | Risk Ratio (M‐H, Fixed, 95% CI) | 0.0 [0.0, 0.0] | ||||||||||
| 3.7 Feel worn out | 1 | Risk Ratio (M‐H, Fixed, 95% CI) | 0.0 [0.0, 0.0] | ||||||||||
| 3.8 Happy | 1 | Risk Ratio (M‐H, Fixed, 95% CI) | 0.0 [0.0, 0.0] | ||||||||||
| 3.9 Tired | 1 | Risk Ratio (M‐H, Fixed, 95% CI) | 0.0 [0.0, 0.0] | ||||||||||
| 4 Condition‐specific measures of faecal incontinence improved Show forest plot | 1 | Risk Ratio (M‐H, Fixed, 95% CI) | Totals not selected | ||||||||||
| Analysis 1.4  Comparison 1 Anal plugs versus no plugs, Outcome 4 Condition‐specific measures of faecal incontinence improved. | |||||||||||||
| 4.1 Protection | 1 | Risk Ratio (M‐H, Fixed, 95% CI) | 0.0 [0.0, 0.0] | ||||||||||
| 4.2 Rash/skin problems | 1 | Risk Ratio (M‐H, Fixed, 95% CI) | 0.0 [0.0, 0.0] | ||||||||||
| 4.3 Unpleasant odour | 1 | Risk Ratio (M‐H, Fixed, 95% CI) | 0.0 [0.0, 0.0] | ||||||||||
| 4.4 Staining/smearing | 1 | Risk Ratio (M‐H, Fixed, 95% CI) | 0.0 [0.0, 0.0] | ||||||||||
| 4.5 Bowel movement in undergarments (last two weeks) | 1 | Risk Ratio (M‐H, Fixed, 95% CI) | 0.0 [0.0, 0.0] | ||||||||||
| 4.6 Frequency of unpleasant odours | 1 | Risk Ratio (M‐H, Fixed, 95% CI) | 0.0 [0.0, 0.0] | ||||||||||
| 4.7 Bowel movements in undergarments (on average day) | 1 | Risk Ratio (M‐H, Fixed, 95% CI) | 0.0 [0.0, 0.0] | ||||||||||
| 4.8 Soiled/stained undergarment (on average day) | 1 | Risk Ratio (M‐H, Fixed, 95% CI) | 0.0 [0.0, 0.0] | ||||||||||
| 4.9 Prevents staying away from home | 1 | Risk Ratio (M‐H, Fixed, 95% CI) | 0.0 [0.0, 0.0] | ||||||||||
| 4.10 Must avoid long journeys | 1 | Risk Ratio (M‐H, Fixed, 95% CI) | 0.0 [0.0, 0.0] | ||||||||||
| 4.11 Must always have a toilet nearby | 1 | Risk Ratio (M‐H, Fixed, 95% CI) | 0.0 [0.0, 0.0] | ||||||||||
| 5 Stool frequency Show forest plot | Other data | No numeric data | |||||||||||
| Analysis 1.5
Comparison 1 Anal plugs versus no plugs, Outcome 5 Stool frequency. | |||||||||||||
| 6 Costs Show forest plot | Other data | No numeric data | |||||||||||
| Analysis 1.6
Comparison 1 Anal plugs versus no plugs, Outcome 6 Costs. | |||||||||||||
| 7 Achievement of pseudo‐continence Show forest plot | Other data | No numeric data | |||||||||||
| Analysis 1.7
Comparison 1 Anal plugs versus no plugs, Outcome 7 Achievement of pseudo‐continence. | |||||||||||||
| 8 Intolerance of intervention Show forest plot | Other data | No numeric data | |||||||||||
| Analysis 1.8
Comparison 1 Anal plugs versus no plugs, Outcome 8 Intolerance of intervention. | |||||||||||||
| Outcome or subgroup title | No. of studies | No. of participants | Statistical method | Effect size | |||||||||
| 1 Plug effectiveness: number of people with no soiling Show forest plot | Other data | No numeric data | |||||||||||
| Analysis 2.1
Comparison 2 One type of anal plug versus another type, Outcome 1 Plug effectiveness: number of people with no soiling. | |||||||||||||
| 2 Feeling of security Show forest plot | Other data | No numeric data | |||||||||||
| Analysis 2.2
Comparison 2 One type of anal plug versus another type, Outcome 2 Feeling of security. | |||||||||||||
| 3 Loss of plug Show forest plot | Other data | No numeric data | |||||||||||
| Analysis 2.3
Comparison 2 One type of anal plug versus another type, Outcome 3 Loss of plug. | |||||||||||||
| 4 Inconvenience Show forest plot | Other data | No numeric data | |||||||||||
| Analysis 2.4
Comparison 2 One type of anal plug versus another type, Outcome 4 Inconvenience. | |||||||||||||
| 5 Overall satisfaction Show forest plot | Other data | No numeric data | |||||||||||
| Analysis 2.5
Comparison 2 One type of anal plug versus another type, Outcome 5 Overall satisfaction. | |||||||||||||
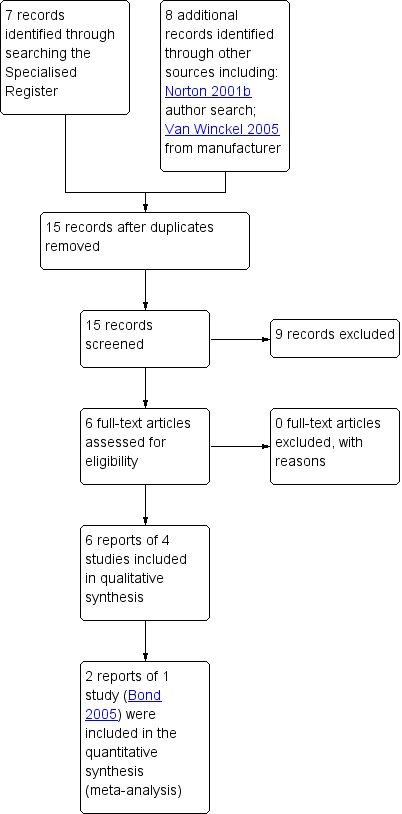
PRISMA study flow diagram.
Comparison 1 Anal plugs versus no plugs, Outcome 1 General health improved ‐ adults.
Comparison 1 Anal plugs versus no plugs, Outcome 2 Bodily pain improved ‐ adults.
Comparison 1 Anal plugs versus no plugs, Outcome 3 Well being (adults) improved.
Comparison 1 Anal plugs versus no plugs, Outcome 4 Condition‐specific measures of faecal incontinence improved.
| Study | |
| Bond 2005 | No differences were observed between control and intervention group |
Comparison 1 Anal plugs versus no plugs, Outcome 5 Stool frequency.
| Study | |
| Bond 2005 | Little or no evidence that the plug led to significant reductions in the overall costs of care |
Comparison 1 Anal plugs versus no plugs, Outcome 6 Costs.
| Study | Anal plug period | Control period |
| Van Winckel 2005 | 6/12 | 0/12 |
Comparison 1 Anal plugs versus no plugs, Outcome 7 Achievement of pseudo‐continence.
| Study | Anal plug period | Control period |
| Van Winckel 2005 | 4/16 | 0/16 |
Comparison 1 Anal plugs versus no plugs, Outcome 8 Intolerance of intervention.
| Study | PU plug | PVA plug |
| Pfrommer 2000 | 15/23 | 14/23 |
Comparison 2 One type of anal plug versus another type, Outcome 1 Plug effectiveness: number of people with no soiling.
| Study | PU plug | PVA plug |
| Pfrommer 2000 | 16/23 | 10/23 |
Comparison 2 One type of anal plug versus another type, Outcome 2 Feeling of security.
| Study | PU plug | PVA plug |
| Pfrommer 2000 | 7/23 | 15/23 |
Comparison 2 One type of anal plug versus another type, Outcome 3 Loss of plug.
| Study | PU plug | PVA plug |
| Pfrommer 2000 | 9/23 | 16/23 |
Comparison 2 One type of anal plug versus another type, Outcome 4 Inconvenience.
| Study | PU plug | PVA plug |
| Pfrommer 2000 | 17/23 | 8/23 |
Comparison 2 One type of anal plug versus another type, Outcome 5 Overall satisfaction.
| Outcome or subgroup title | No. of studies | No. of participants | Statistical method | Effect size |
| 1 General health improved ‐ adults Show forest plot | 1 | Risk Ratio (M‐H, Fixed, 95% CI) | Totals not selected | |
| 2 Bodily pain improved ‐ adults Show forest plot | 1 | Risk Ratio (M‐H, Fixed, 95% CI) | Totals not selected | |
| 3 Well being (adults) improved Show forest plot | 1 | Risk Ratio (M‐H, Fixed, 95% CI) | Totals not selected | |
| 3.1 Full of life | 1 | Risk Ratio (M‐H, Fixed, 95% CI) | 0.0 [0.0, 0.0] | |
| 3.2 Very nervous | 1 | Risk Ratio (M‐H, Fixed, 95% CI) | 0.0 [0.0, 0.0] | |
| 3.3 Down in the dumps | 1 | Risk Ratio (M‐H, Fixed, 95% CI) | 0.0 [0.0, 0.0] | |
| 3.4 Calm and peaceful | 1 | Risk Ratio (M‐H, Fixed, 95% CI) | 0.0 [0.0, 0.0] | |
| 3.5 Lot of energy | 1 | Risk Ratio (M‐H, Fixed, 95% CI) | 0.0 [0.0, 0.0] | |
| 3.6 Downhearted and low | 1 | Risk Ratio (M‐H, Fixed, 95% CI) | 0.0 [0.0, 0.0] | |
| 3.7 Feel worn out | 1 | Risk Ratio (M‐H, Fixed, 95% CI) | 0.0 [0.0, 0.0] | |
| 3.8 Happy | 1 | Risk Ratio (M‐H, Fixed, 95% CI) | 0.0 [0.0, 0.0] | |
| 3.9 Tired | 1 | Risk Ratio (M‐H, Fixed, 95% CI) | 0.0 [0.0, 0.0] | |
| 4 Condition‐specific measures of faecal incontinence improved Show forest plot | 1 | Risk Ratio (M‐H, Fixed, 95% CI) | Totals not selected | |
| 4.1 Protection | 1 | Risk Ratio (M‐H, Fixed, 95% CI) | 0.0 [0.0, 0.0] | |
| 4.2 Rash/skin problems | 1 | Risk Ratio (M‐H, Fixed, 95% CI) | 0.0 [0.0, 0.0] | |
| 4.3 Unpleasant odour | 1 | Risk Ratio (M‐H, Fixed, 95% CI) | 0.0 [0.0, 0.0] | |
| 4.4 Staining/smearing | 1 | Risk Ratio (M‐H, Fixed, 95% CI) | 0.0 [0.0, 0.0] | |
| 4.5 Bowel movement in undergarments (last two weeks) | 1 | Risk Ratio (M‐H, Fixed, 95% CI) | 0.0 [0.0, 0.0] | |
| 4.6 Frequency of unpleasant odours | 1 | Risk Ratio (M‐H, Fixed, 95% CI) | 0.0 [0.0, 0.0] | |
| 4.7 Bowel movements in undergarments (on average day) | 1 | Risk Ratio (M‐H, Fixed, 95% CI) | 0.0 [0.0, 0.0] | |
| 4.8 Soiled/stained undergarment (on average day) | 1 | Risk Ratio (M‐H, Fixed, 95% CI) | 0.0 [0.0, 0.0] | |
| 4.9 Prevents staying away from home | 1 | Risk Ratio (M‐H, Fixed, 95% CI) | 0.0 [0.0, 0.0] | |
| 4.10 Must avoid long journeys | 1 | Risk Ratio (M‐H, Fixed, 95% CI) | 0.0 [0.0, 0.0] | |
| 4.11 Must always have a toilet nearby | 1 | Risk Ratio (M‐H, Fixed, 95% CI) | 0.0 [0.0, 0.0] | |
| 5 Stool frequency Show forest plot | Other data | No numeric data | ||
| 6 Costs Show forest plot | Other data | No numeric data | ||
| 7 Achievement of pseudo‐continence Show forest plot | Other data | No numeric data | ||
| 8 Intolerance of intervention Show forest plot | Other data | No numeric data | ||
| Outcome or subgroup title | No. of studies | No. of participants | Statistical method | Effect size |
| 1 Plug effectiveness: number of people with no soiling Show forest plot | Other data | No numeric data | ||
| 2 Feeling of security Show forest plot | Other data | No numeric data | ||
| 3 Loss of plug Show forest plot | Other data | No numeric data | ||
| 4 Inconvenience Show forest plot | Other data | No numeric data | ||
| 5 Overall satisfaction Show forest plot | Other data | No numeric data | ||