Planes de acción con educación del paciente breve para las exacerbaciones de la enfermedad pulmonar obstructiva crónica
References
Referencias de los estudios incluidos en esta revisión
Referencias de los estudios excluidos de esta revisión
Referencias de los estudios en curso
Referencias adicionales
Referencias de otras versiones publicadas de esta revisión
Characteristics of studies
Characteristics of included studies [ordered by study ID]
Jump to:
| Methods | Study design: parallel group Location, number of centres: participants recruited through their general practitioners and district nurses in catchment area of single hospital in New Zealand Duration of study: 12 months | |
| Participants | N screened: not available N randomised: 96 N completed: 93 (44 INT, 49 UC) M = INT 15 (34%), UC 32 (65%) F = INT 29 (66%), UC 17 (35%) (P < 0.1) Age: INT 71.1 (95% CI 68.7 to 73.5), UC 69.1 (95% CI 63.5 to 74.7) Baseline details: FEV1 % PRED 35.4 (95% CI 31.6 to 39.2), UC 34.3 (95% CI 31.2 to 37.4) Smoking exposure PYH: INT 35.4 (95% CI 29.4 to 41.4), UC 48.2 (95% CI 39.1 to 57.3) (P = 0.03) Inclusion criteria: diagnosis of moderate or severe COPD, aged 55 years or older,at least 1 hospital admission or 2 acute exacerbations of COPD requiring GP care during previous 12 months. Mini Mental State Examination (MMSE) score ≥ 23 Exclusion criteria: terminal illness, coexisting lung cancer, admission to hospital with cardiac disease within previous 12 months, receiving home oxygen therapy | |
| Interventions | Intervention: A generic care plan was developed by a group comprising a general practitioner, a community‐based respiratory nurse, a respiratory physician, an emergency department consultant, the local St John's Ambulance paramedical staff director and the after hours GP service director. This results in 5 separate sections within the plan with specific instructions for patient and/or career, GP and/or community nurse, ambulance service, and emergency department and medical staff of Dunedin Hospital. Although sections showed significant overlap, it was recognised that the language and content of each section had to be appropriate for different users of the plan. Thereafter, the care plan was individualised and was 'signed off' for each participant allocated to the intervention group. This was done on the basis of an interview between participant and respiratory nurse (FRS), a review of hospital notes in relation to previous admissions by the respiratory specialist (DRT) and a review by the participant's own GP. Control: UC = usual care by own GP Treatment period: 12 months Follow‐up time points: 3, 6, 9 and 12 months | |
| Outcomes | Primary outcomes: utilisation of primary care services and hospital admissions; quality of life as measured by St George's Respiratory Questionnaire (SGRQ) | |
| Notes | Not stated if hospital admissions were COPD‐related or all‐cause Funding: Study was supported by South Link Health Inc., a non‐profit consortium of general practitioners. | |
| Risk of bias | ||
| Bias | Authors' judgement | Support for judgement |
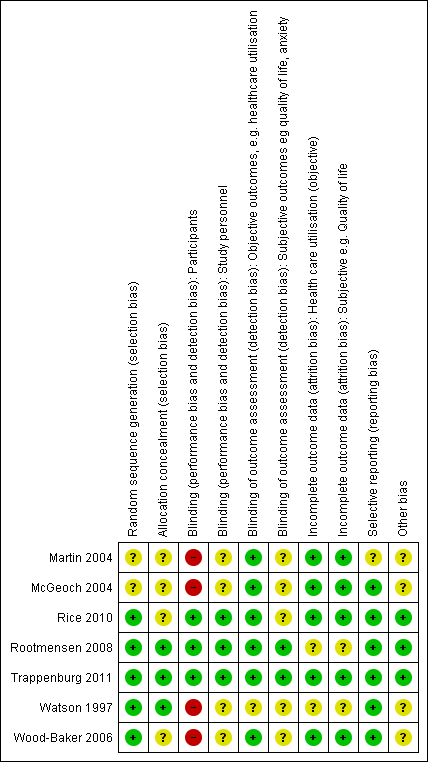
| Random sequence generation (selection bias) | Unclear risk | "Patients were randomly assigned to the intervention (care plan) or control (usual care) groups". No method of randomisation was described. |
| Allocation concealment (selection bias) | Unclear risk | No method of allocation was published. |
| Blinding (performance bias and detection bias) | High risk | Participants were not blinded to the care plan intervention. Lack of blinding may have affected participants' perception for quality of life measurements. |
| Blinding (performance bias and detection bias) | Unclear risk | Study personnel were not blinded to the care plan intervention. "All patients (both intervention and control groups) were visited by the research nurse (DMcN) at the study start and thereafter at three, six and 12 months to provide routine support, and, for the care plan group, further education regarding use of the plan." |
| Blinding of outcome assessment (detection bias) | Low risk | All participants (both intervention and control groups) were visited by the research nurse (DMcN) at the study start and thereafter at 3, 6 and 12 months. |
| Blinding of outcome assessment (detection bias) | Unclear risk | Research nurse who administered quality of life questionnaires was not blinded. |
| Incomplete outcome data (attrition bias) | Low risk | GP visits: data for 41/44 INT, 47/49 UC participants. Ambulance call data for 42/44 INT, 47/49 UC. Hospital admission data for 44/44 INT, 49/49 UC |
| Incomplete outcome data (attrition bias) | Low risk | 96 participants were recruited, 93 completed the study, 3 withdrew for personal reasons (group allocation unknown). |
| Selective reporting (reporting bias) | Unclear risk | The study protocol is not available, and it is not clear whether published reports include all expected outcomes, including those that were prespecified. |
| Other bias | Unclear risk | Number of practices from which participants were recruited is not available. Pilot study, no sample size calculation performed and no attempt made to examine clustering within practices |
| Methods | Study design: parallel‐group cluster‐randomised study in an intervention group of practices and a control group of practices Location, number of centres: participants attending 2 groups of general practices in Christchurch, New Zealand Duration of study: 12 months. Year study performed: July 2002‐December 2003 | |
| Participants | N screened: 257 N randomised: 159 N completed: 152. INT 84, 1 died, 1 withdrew consent; CONTROL 68, 2 died, 2 withdrew consent, 1 unable to be contacted M = INT 45 (52%), CONTROL 49 (67%) Age: INT 69.8 (11.6), CONTROL 72.1 (9.9) Baseline details: current smoker INT 27 (31%), CONTROL 17 (23%); ex‐smoker INT 59 (69%), CONTROL 56 (77%); pneumococcal vaccination (last 5 years) INT 34 (40%), CONTROL 30 (43%); FEV1 % predicted INT 54.6 (18.7), CONTROL 53.1 (18.1); BMI INT 25.9 (4.6), CONTROL 25.4 (4.1); HADS anxiety INT 6.2 (4.2), CONTROL 5.3 (3.6); HADS depression INT 4.6 (3.7), CONTROL 4.1 (2.9); SGRQ total INT 43.3 (18.8), CONTROL 36.8 (17.6); P = 0.03 Exclusion criteria: unable/unwilling to sign consent, primary diagnosis asthma, other primary functionally limiting disease, other medical condition likely to affect patient mortality, hospital level residential care, already using self‐management plan, on domiciliary O2, attending GP who already uses self‐management plans more than occasionally, exacerbation of COPD requiring increased treatment within 6 weeks or admission to general hospital within 3 months, cognitive impairment as per 3 MS < 75%, alpha1‐antitrypsin deficiency | |
| Interventions | Intervention: AP intervention: usual care and individual standardised educational session from practice nurse or respiratory educator on the use of a self‐management plan, which includes methods of early recognition of exacerbations and appropriate self‐initiated interventions including antibiotics and short course oral corticosteroids; instruction to make early contact with GP. Control: usual care, specifically denied access to written self‐management plan. Non‐standard education on smoking cessation, exercise, controlling breathlessness, nutrition, use of inhaled therapy and immunisation was given according to practice standards. Treatment period: 12 months Follow‐up time points: assessments at baseline, 12 months; telephone interviews at 3, 6 and 9 months | |
| Outcomes | Medications: % people used courses of antibiotics and oral steroids at 6 and 12 months
In each scenario, investigators assessed 3 self‐management domains of medication use, healthcare‐seeking decisions and self‐care. They scored each of 13 items per situation on a 3‐point scale (0–2), separately scoring responses for knowledge (knowing what to do) and actions (whether participants would actually do the task and when they would do it), yielding a maximum possible score of 26 for each in all 3 situations. Study visits at baseline and at 12 months, with telephone interviews at 3, 6 and 9 months | |
| Notes | Funding: Study was funded by Pegasus Health, an independent practitioner association, The Canterbury Respiratory Research Trust and The Asthma and Respiratory Foundation of New Zealand. No funding was received from any pharmaceutical company. | |
| Risk of bias | ||
| Bias | Authors' judgement | Support for judgement |
| Random sequence generation (selection bias) | Unclear risk | Randomisation sequence generation was not described. Practices were randomised via 1 investigator. Individual participants were also randomised by a random numbers table if too many were included in a single practice. Participants were screened after randomisation by standardised history and spirometry. |
| Allocation concealment (selection bias) | Unclear risk | Participants were allocated by practice attendance, but information on allocation of practices was not available. If too many patients were identified in each practice, a random numbers table was used to allocate individual participants. An aspect of concern regarding this method was that if the same GP was implementing both intervention and usual care, confounding between treatment methods may occur, possibly diluting effects of active intervention. |
| Blinding (performance bias and detection bias) | High risk | Researchers were unable to blind participants to educational intervention; patient questionnaire outcomes may be influenced by perception of receiving extra intervention. |
| Blinding (performance bias and detection bias) | Unclear risk | Nursing staff administering assessments were not blinded to whether participants were included in intervention or control groups. |
| Blinding of outcome assessment (detection bias) | Low risk | Although it was not clear how healthcare utilisation data were collected, this was unlikely to be affected by bias. |
| Blinding of outcome assessment (detection bias) | Unclear risk | Nursing staff administering assessments were not blinded to whether participants were included in intervention or control groups; this may potentially affect collection of questionnaire data. |
| Incomplete outcome data (attrition bias) | Low risk | Analysis: INT 84/86 (1 death, 1 WD consent), CONTROL 70/73 (2 WD consent, 1 no contact). Small losses to follow‐up, balanced across groups |
| Incomplete outcome data (attrition bias) | Low risk | Analysis: INT 84/86 (1 death, 1 WD consent), CONTROL 70/73 (2 WD consent, 1 no contact). Small losses to follow‐up, balanced across groups |
| Selective reporting (reporting bias) | Low risk | Study protocol was not available, but all expected outcomes were reported. |
| Other bias | Unclear risk | Sample size calculation was based on the assumption that about 10 patients would be recruited for each surgery, and that no additional between‐participant variation would be due to clustered‐randomisation of surgeries. Analysis of the 12‐month change in outcome variables was based on a mixed‐model repeated measures ANOVA. This analysis enabled estimation of any additional variation in outcome measures as a consequence of clustered‐randomisation of surgeries rather than individuals. Analyses of outcome variables showed no additional variation from this source beyond that anticipated by between‐participant variation. Analysis of the 12‐month change in outcome variables was based on a mixed‐model repeated measures ANOVA. This analysis enabled estimation of any additional variation in outcome measures as a consequence of clustered‐randomisation of surgeries rather than individuals. Analyses of outcome variables showed no additional variation from this source beyond that anticipated by between‐participant variation. For this reason, all analyses were based on use of participants as replicates. When baseline differences in outcome measures were evident, ANCOVA for repeated measures was used to test the relative effects of treatments. |
| Methods | Study design: parallel‐group randomised controlled trial Location, number of centres: United States of America. Five Veteran Affairs medical centres Duration of study: 12 months | |
| Participants | N screened: 1739 eligible, 1316 attempted telephone contact N randomised: 743 (AP 372, UC 371) N completed: AP 336 completed 1 year, 36 deaths; UC 323 completed 1 year, 48 deaths Baseline characteristics: mean age, years (SD) AP 69.1 (9.4), UC 70.7 (9.7); male, n (%) AP 363 (97.6), UC 365 (98.4); mean FEV1, % predicted (SD) AP 36.1 (14.5), UC 38.1 (14.4); current smoker, n (%) AP 80 (21.6), UC 85 (23.0); hospitalised for COPD in the past year, n (%) AP 133 (35.8), UC 145 (39.1); ED visit for COPD in the past year, n (%) AP 218 (58.6), UC 195 (52.6); systemic steroid for COPD in the past year, n (%) AP 210 (56.6), UC 197 (53.5); home oxygen, n (%) AP 200 (53.9), UC 209 (56.6); number in group AP 372, UC 371 Inclusion criteria: diagnosis of COPD and 1 or more of the following during previous year: (1) hospital admission or ED visit for COPD; (2) long‐term home oxygen use; (3) course of systemic corticosteroids for COPD. Additional inclusion criteria: ability to complete the consent process, postbronchodilator spirometry showing FEV1 < 70% predicted, FEV1/FVC < 0.70 Exclusion criteria: any condition that might preclude effective participation in the study or that would reduce life expectancy to less than a year. No access to a telephone | |
| Interventions | AP group: education: attended a single 1 to 1.5‐hour group educational session conducted by a case manager; respiratory therapist completed a 1‐day training session. Educational content: ACCP material on general information about COPD, causes, symptoms and treatment of exacerbations, direct observation of inhaler techniques, review and adjustment of outpatient COPD medications, smoking cessation counselling when appropriate, recommendations concerning influenza and pneumococcal vaccinations, encouragement of regular exercise, instruction in hand hygiene. Telephone call follow‐up: case manager monthly phone calls to reinforce general principles of COPD management, review details of the action plan and answer questions. Action plan: individualised written action plan including: (1) description of signs and symptoms of an exacerbation that should prompt initiation of self‐treatment, (2) refillable prescriptions for prednisone and an oral antibiotic, (3) contact information for a case manager, and (4) telephone number of the 24‐hour VA help line. Participants were instructed to begin action plan medications for symptoms that were substantially worse than usual. UC group: education: received 1‐page handout containing a summary of the principles of COPD care according to published guidelines. Telephone call follow‐up: given telephone number for 24‐hour VA nursing help line, a service available to all VA patients. No action plan Follow‐up time points: assessment at baseline and at 12 months. Educational session for AP participants only at the start of the trial, monthly phone calls by a case manager to participants in the AP group; participants were encouraged to contact case manager when they used action plan medications or if they had questions regarding their action plan. | |
| Outcomes | Primary outcome: combined number of hospital admissions and ED visits for COPD All outcomes
| |
| Notes | Details of method, intervention and usual care obtained from online supplement | |
| Risk of bias | ||
| Bias | Authors' judgement | Support for judgement |
| Random sequence generation (selection bias) | Low risk | Online data supplement reports methods of sequence generation as "assigned subjects in equal proportions to each of the two treatment arms by permuted‐block randomisation". |
| Allocation concealment (selection bias) | Unclear risk | No details of allocation concealment were given in the paper or in the trial registration entry. |
| Blinding (performance bias and detection bias) | Low risk | Participants were not blinded, but this is not likely to affect mortality or primary outcomes of healthcare utilisation measures (objective). |
| Blinding (performance bias and detection bias) | Low risk | Assessors were blinded: "Blinded pulmonologists independently reviewed all discharge summaries and ED reports and assigned a primary cause for each". |
| Blinding of outcome assessment (detection bias) | Low risk | Assessors were blinded: "Blinded pulmonologists independently reviewed all discharge summaries and ED reports and assigned a primary cause for each". Mortaility, healthcare utilisation measures, objective data. Thus low risk of bias |
| Blinding of outcome assessment (detection bias) | Unclear risk | SGRQ self‐administered patient assessment, with greater potential for bias with lack of blinding |
| Incomplete outcome data (attrition bias) | Low risk | The status of all 743 participants was determined after 1 year. |
| Incomplete outcome data (attrition bias) | Low risk | Only reason for missing data was death (48 in usual care, 36 in intervention). Investigators were unable to perform intention‐to‐treat analysis. |
| Selective reporting (reporting bias) | Low risk | All primary and secondary outcomes were reported in trial registration. |
| Other bias | Low risk | No other issues of bias are known. |
| Methods | Study design: parallel group Location, number of centres: single centre, pulmonary outpatient recruitment, Netherlands Duration of study: outcome assessment after 6 months | |
| Participants | N screened: 805 outpatient files screened, 386 excluded on previous respiratory nurse contact, 187 patients did not attend outpatient appointment, 19 refused to participate (2 because information on purpose of study was postponed), 22 other reasons given N randomised: 191 (111 COPD) N completed: 157 COPD and asthma. INT 11 did not receive intervention, 13 withdrew consent, 4 died. CONTROL 14 withdrew consent, 3 died M = 105 (55%) F = 86 (45%) Age: AP asthma and COPD mean 60 (SD 15), CONTROL asthma and COPD mean 61 (SD 15) Baseline details: COPD severity GOLD classification ‐ AP GOLD 1/2 = 33 (57%), 3/4 = 22 (39%), CONTROL GOLD 0 = 6 (11%), 1/2 = 30 (55%), 3/4 = 18 (33%); mean FEV1 % predicted AP 57 (SD 19), CONTROL 64 (SD 26); mean FEV1/IVC AP = 0.47 (SD 0.12), CONTROL = 0.50 (SD 0.16) Inclusion criteria: diagnosis of asthma or COPD by respiratory physician, age over 18, ability to understand Dutch questionnaires, never consulted a pulmonary nurse Exclusion criteria: none listed | |
| Interventions | Intervention: AP = protocol‐based 45‐minute educational programme on individual basis given by experienced pulmonary nurse. Content (in checklist): information on COPD, underlying pathophysiology, action and proper use of medications and oxygen, avoiding triggers, influenza vaccination, self‐monitoring instructions, smoking cessation. Individual instructions on how to prevent and act for management of exacerbation. Inhalation technique checked. Emergency oral steroids and antibiotics provided to some participants Control: usual care | |
| Outcomes | Primary specified outcomes • Knowledge ‐ self‐administered 18‐item questionnaire designed by trialists, including items from 4 previously used questionnaires referenced plus self‐formulated questions. Response true/false/do not know. Score 0‐100% • Inhalation technique ‐ scored by blinded well‐trained observer from videotape demonstration by patient. Score 0‐100% from previously validated criteria • Self‐management knowledge ‐ self‐administered questionnaire on 3 exacerbation scenarios, questions adapted from validated interview‐based questionnaire • Exacerbation incidence ‐ definition exacerbation = worsening of respiratory symptoms that required treatment with oral steroids as judged and prescribed by general practitioner or pulmonary physician Outpatient Clinic Satisfaction Questionnaire ‐ Pulmonology (OCSQ‐P) was used to measure satisfaction with care ‐ general and pulmonary physician subscales | |
| Notes | Funding: Netherlands Asthma Foundation | |
| Risk of bias | ||
| Bias | Authors' judgement | Support for judgement |
| Random sequence generation (selection bias) | Low risk | Randomisation procedure was based on a minimisation procedure. Minimisation factors were diagnosis (asthma or COPD), treated or not by pulmonary physician in previous 2 years |
| Allocation concealment (selection bias) | Low risk | Randomised in advance of clinic attendance. Randomisation results were reported to pulmonary physician just before the participant's visit. |
| Blinding (performance bias and detection bias) | Low risk | Participants were masked for the trial objective to avoid more favourable assessment of participants in additional care group. Participants were told they would be informed about the additional research question only after follow‐up because informing during recruitment would affect the results. Participants asked after visit about length of consultation to detect potential differences in attention between groups. "The number of visits and duration of the first visit were the same for both groups”. |
| Blinding (performance bias and detection bias) | Low risk | Investigators "used blind observers to assess adequacy of inhalational techniques”. |
| Blinding of outcome assessment (detection bias) | Low risk | Outcome assessors were blinded to outcomes. |
| Blinding of outcome assessment (detection bias) | Low risk | Outcome assessors were blinded to outcomes. |
| Incomplete outcome data (attrition bias) | Unclear risk | No data were measured for participants with COPD. Exacerbation frequency was measured but was not available for COPD only. |
| Incomplete outcome data (attrition bias) | Unclear risk | Data were available for only 90 of 117 participants with COPD randomised. |
| Selective reporting (reporting bias) | Low risk | The study protocol is not available, but it is clear that published reports include all expected outcomes, including those prespecified. |
| Other bias | Low risk | No other issues of bias are known. |
| Methods | Study design: parallel‐group randomised controlled trial Location, number of centres: Netherlands, University Medical Centre Ultrecht. Participants were recruited from 7 regional hospitals and 5 general practices in the Netherlands. Duration of study: 6 months | |
| Participants | N screened: 391 N randomised: 233 (AP 111, UC 122) N completed: AP 91 completed 6 months, 21 dropped out (11 withdrew consent, 2 died, 5 comorbidity, 2 moved/logistics, 1 invalid); UC 102 completed 6 months, 20 dropped out (15 withdrew consent, 2 died, 2 comorbidity, 1 invalid) Baseline characteristics: mean age, years (SD) AP 66.1 (11.2), UC 65.1 (10.0); male, n (%) AP 65 (59), UC 69 (57); mean FEV1, % predicted (SD) AP 56.7 (20.3), UC 56.5 (20.6); current smoker, n (%) AP 31 (28), UC 37 (30); hospitalised for COPD in past year, n (%) AP 22 (20), UC 21 (18); number in group AP 111, UC 122; BMI (SD) AP 26.1 (5.5), UC 26.7 (6.5); living alone, n (%) AP 27 (23), UC 22 (18); education: lower secondary or less, n (%) AP 69 (62), UC 83 (68); higher secondary, n (%) AP 29 (26), UC 31 (25); college/university, n (%) AP 13 (12), UC 8 (7); GOLD stage: I, n (%) AP 14 (13), UC 13 (11); II, n (%) AP 55 (50), UC 58 (47); III, n (%) AP 30 (27), UC 38 (31); IV, n (%) AP 11 (10), UC 12 (10); FEV1, mean (SD) AP 1.55 (0.60), UC 1.59 (0.71); FVC, mean (SD) AP 3.03 (0.79), UC 3.17 (0.91); recruited from: GP, n (%) AP 18 (16), UC 17 (14); outpatient clinic, n (%) AP 93 (84), UC 105 (86) Inclusion criteria: postbronchodilator ratio of forced expiratory volume in 1 second to forced vital capacity (FEV1/FVC) < 70%. Age > 40 years. Smoking history > 20 years or 15 pack‐years. Diagnosis of COPD as a major functionally limiting disease. Current use of bronchodilator therapy Exclusion criteria: primary diagnosis of asthma. Primary diagnosis of cardiac disease. Presence of disease that could affect mortality or participation in the study (e.g. confusional states) | |
| Interventions | AP group: At inclusion, participants were seen by the nurse case manager (respiratory nurse), who systematically checked and discussed; aspects of COPD care: vaccination, optimisation of medication, inhalation techniques, exercise, nutritional aspects, smoking (cessation) and exacerbation management. Participants in the AP group were encouraged to contact their case manager if they needed further information or wanted to ask a question. Two standardised reinforcement sessions were held by telephone at 1 and 4 months to evaluate participant understanding of and adherence to AP and, when needed, additional information was provided. An action plan for participants was individualised by a respiratory nurse and included: (1) a list of important contact persons and telephone numbers; resource persons: family physician, respiratory physician and respiratory nurse; (2) stable symptom severity (individual stable/normal green zone symptom status); (3) regular medication/lifestyle prescriptions (green zone); (4) additional medication/breathing exercises and energy preservation in case of symptom increase (yellow zone, orange zone); (5) a name contact person/telephone number in case of an exacerbation (orange zone). For individual participants, it was optional for the case manager (in consultation with the attending physician) to provide self‐treatment medication (course of corticosteroids and/or antibiotics). Participants also received usual care, which included pharmacological and non‐pharmacological care according to the most recent evidence‐based guidelines. UC group: At inclusion, participants were seen by a nurse case manager (respiratory nurse), who systematically checked and discussed aspects of COPD care: vaccination, optimisation of medication, inhalation techniques, exercise, nutritional aspects, smoking (cessation) and exacerbation management. No additional contacts with nurse educator. Participants in control group did not receive additional telephone sessions. Participants did not receive an action plan. Received usual care including pharmacological and non‐pharmacological care according to the most recent evidence‐based guidelines Follow‐up time points: assessments at baseline and at 6 months. All participants were contacted by telephone monthly; participants in the AP group received additional telephone follow‐up at 1 and 4 months to evaluate understanding and adherence to the action plan. | |
| Outcomes | Primary outcome: time to recovery of health status in the event of an exacerbation All outcomes • Number of exacerbations • Time to recovery from exacerbation • Exacerbation rates • Anthonisen classification of COPD exacerbations • Percentage of exacerbations reported to a healthcare provider • Number respiratory‐related hospital admissions • Hospital days • Emergency room visits • Scheduled visits • Unscheduled visits • Telephone calls to respiratory or family physicians • Symptom diary • Health‐related quality of life • Anxiety and depression • Self‐management exacerbation‐related self‐efficacy* | |
| Notes | Funding: not declared in protocol/trial registration or in results publication *Exacerbation‐related self‐efficacy measured by study‐developed questionnaire, consisting of 11 items for which confidence in self‐management capability in the occurrence of an exacerbation is graded on a 5‐point Likert scale. Lower scores indicate high confidence in adequate exacerbation‐related self‐management behaviour. No validity or responsiveness data published for this questionnaire | |
| Risk of bias | ||
| Bias | Authors' judgement | Support for judgement |
| Random sequence generation (selection bias) | Low risk | "Randomisation was carried out using the minimisation technique to balance the control and intervention groups for centre and gender." Probably done, as earlier reports from the same study authors clearly describe randomisation stratified by centre and gender |
| Allocation concealment (selection bias) | Low risk | "To conceal the assignment sequence, a central web‐based service was used." Probably done, as earlier reports from the same investigators clearly describe use of a central web‐based service for allocation concealment |
| Blinding (performance bias and detection bias) | Low risk | "The modified informed consent procedure (postponed information) meant that patients were unaware of the major aim of the study." Probably done. Postponing receipt of information from participants allowed for adequate blinding of participants. Risk of cross‐contamination between members of intervention and control groups was reduced by stratification of randomisation by centre |
| Blinding (performance bias and detection bias) | Low risk | Health professionals would have been aware of which participants were receiving the intervention. This is unlikely to be a significant source of bias. |
| Blinding of outcome assessment (detection bias) | Low risk | "All patients were contacted for monthly evaluation by telephone to assess healthcare utilisation and to evaluate proper use of the diary (figure 1)" (healthcare utilisation). Assessors were not blinded, as participants may have disclosed whether or not they were receiving an action plan. "To ensure rigorous and complete exacerbation counts, all diaries were reviewed by three blinded investigators who adjudicated events by consensus" (exacerbations). Unclear from information in the diary whether assessors would have been aware if the participant was receiving an action plan |
| Blinding of outcome assessment (detection bias) | Low risk | "All patients were instructed to record daily in a diary whether symptoms were increased over their baseline condition" (patient‐reported outcomes). Participants were unaware of the major aim of the study, hence self‐reported outcomes were unlikely to be biased. |
| Incomplete outcome data (attrition bias) | Low risk | Drop‐outs 19% intervention and 16% control group. Reasons for withdrawals were given and were balanced in both groups. |
| Incomplete outcome data (attrition bias) | Low risk | Drop‐outs 19% intervention and 16% control group. Reasons for withdrawals were given and were balanced in both groups. |
| Selective reporting (reporting bias) | Low risk | Medical Research Council Dyspnoea Scale (MRC scale) was reported as a secondary outcome in the protocol but is not listed in the report. All other outcomes listed in the protocol are reported. |
| Other bias | Low risk | No other issues of bias |
| Methods | Study design: Parallel‐group randomised study Location, number of centres: New Zealand, 12 practices, 22 GPs Duration of study: 6‐month follow‐up. Year study performed: 1993‐July 1994 Time points: follow‐up at 6 and 12 months | |
| Participants | Diagnosis: COPD defined according to American Thoracic Society: diagnosis of COPD as major functionally limiting disease; smoking history > 10 pack‐years; FEV1 < 65%; FEV1/FVC < 70%; current use of bronchodilator therapy Baseline details Control: age 67 (SD 8), male 67%; married 37%; current smoker 33%; FEV1 % predicted 36 (SD 16); access to nebuliser 26%; own a peak flow meter 70%; influenza vaccine in last year 44% Participation in study | |
| Interventions | Action plan (AP) intervention: AP = recognition of respiratory symptoms when well and during exacerbations of COPD and medication instructions for worsening symptoms, a booklet on self‐management; supply of prednisone and antibiotic from GP. The booklet, "A Guide to Living Positively With COPD", was developed and circulated among participants' GPs and family. Covered smoking cessation, control of breathlessness, exercise, daily activities, diet, sleep, clearing of mucus, planning for future, medications, O2 and contact details for support services | |
| Outcomes | Daily diary cards, which rated respiratory status as usual, mild, moderate or severe; prednisone use, antibiotic use and contact with GP, PN, hospital specialist, pharmacist. Participants were interviewed about access to and use of treatments, services and self‐management strategies. FEV1 and FVC spirometry HRQoL: SGRQ
Outcomes were reported as absolute means and standard deviations from baseline. | |
| Notes | Funding: Study was funded in part by the Southern Regional Health Authority. Additional funding and resources were provided by The Canterbury Respiratory Research Group. 85% of participants were given AP by practice nurse (PN), 15% by GP. 90% positive acceptability for AP. Time to provide AP 10‐20 minutes 40%, 20‐30 minutes 35%. 94% GPs and PNs had no difficulty explaining action plan use to participants. | |
| Risk of bias | ||
| Bias | Authors' judgement | Support for judgement |
| Random sequence generation (selection bias) | Low risk | Participants meeting entry criteria were randomly allocated to the intervention or control group. Permuted block randomisation was used, in blocks of 10. Order within the block was randomly generated by a computer. |
| Allocation concealment (selection bias) | Low risk | Participant level allocated by research staff according to randomisation list. GPs and PNs recruited participants and were blind to group allocation. |
| Blinding (performance bias and detection bias) | High risk | Participants could not be blinded to allocation. Participants completed daily diary cards recording healthcare utilisation and symptoms. Knowledge of allocation to intervention may have biased reporting. |
| Blinding (performance bias and detection bias) | Unclear risk | Study staff was not blinded. |
| Blinding of outcome assessment (detection bias) | Unclear risk | Participants completed daily diary cards recording healthcare utilisation. |
| Blinding of outcome assessment (detection bias) | Unclear risk | Exit study visit in clinic for QoL was provided by study staff who were not blinded. |
| Incomplete outcome data (attrition bias) | Unclear risk | 60 randomised, 56 completed. Group allocation status of 13 withdrawals was not given. |
| Incomplete outcome data (attrition bias) | Unclear risk | 60 randomised, 56 completed. Group allocation status of 13 withdrawals was not given. Reasons: 4 participants offended by questionnaires; 3 experienced complications associated with concurrent medical problems; 3 believed the study protocol was too demanding; 1 left the country; 2 died. |
| Selective reporting (reporting bias) | Low risk | The study protocol is not available, but it appears that published reports include all expected outcomes, including those prespecified. |
| Other bias | Unclear risk | Baseline access to and use of a variety of treatments, services and self‐management strategies showed no statistically significant differences between groups, except for influenza vaccination in last year: 72% INT, 44% CONTROL |
| Methods | Study design: parallel‐group cluster‐randomised trial Location: All GPs registered with Southern Tasmanian Division of General Practitioners (N = 255) were contacted and invited to participate. Duration of study: 12 months. Year study performed: 2002 | |
| Participants | N screened: 262 Inclusion criteria: diagnosis of COPD as primary functionally limiting illness, aged > 50 years, tobacco smoking history > 10 pack‐years, FEV1 < 65% predicted and/or FEV1/FVC ratio < 70% Exclusion criteria: nursing home residents | |
| Interventions | Intervention: Action plan (AP) ‐ COPD information booklet and individual educational session with respiratory nurse (covered basic COPD pathology, smoking cessation, immunisations, nutrition, exercise, clearing of mucus from lungs, control of breathlessness during ADLs, stress management, medications, correct use of inhalers and contact details of community support services). Also written self‐management plan listing maintenance medications and individual AP based on early recognition of exacerbations. 76% of participants received instructions to start short course oral corticosteroids and an antibiotic; remaining 24% received instructions to initiate antibiotics only (N = 10), double dose of inhaled corticosteroids and start antibiotic (2), initiate short course oral corticosteroids only (1) or contact GP (3). Prescriptions were provided as necessary. All were encouraged to present to GP early during exacerbation. | |
| Outcomes | Health‐related QoL: absolute mean and standard deviation at baseline and mean change in SGRQ and standard deviation at 6 and 12 months Outcome measurement: 3, 6, 9 and 12 months, 6 and 12 month assessments were face‐to‐face at GP, surgery or participant's home, 3 and 9 months by standardised telephone interviews | |
| Notes | Not stated if hospitalisation or ED visits were related to COPD or all‐cause Funding: not known | |
| Risk of bias | ||
| Bias | Authors' judgement | Support for judgement |
| Random sequence generation (selection bias) | Low risk | Practices were randomised to intervention (action plan) or control group by a computer‐generated randomisation software package. |
| Allocation concealment (selection bias) | Unclear risk | Practice level was allocated but no information was published on method of allocation to groups. |
| Blinding (performance bias and detection bias) | High risk | Participants could not be blinded to allocation. Participants completed daily diary cards to record healthcare utilisation and symptoms. Knowledge of allocation to intervention may have biased reporting. |
| Blinding (performance bias and detection bias) | Unclear risk | Study staff were not blinded. |
| Blinding of outcome assessment (detection bias) | Low risk | Objective assessments were not likely to be affected by lack of blinding. |
| Blinding of outcome assessment (detection bias) | Unclear risk | Study visits for QoL were handled by study staff who were not blinded. |
| Incomplete outcome data (attrition bias) | Low risk | INT 67 randomised, 5 died, 8 withdrew for personal reasons. 61 completed 6‐month and 54 completed 12‐month assessment. CONTROL 72 randomised, 4 died, 8 withdrew for personal reasons, 2 lost to follow‐up. 62 completed 6‐month and 58 completed 12‐month assessment. Similar proportions in both groups completed. |
| Incomplete outcome data (attrition bias) | Low risk | INT 67 randomised, 5 died, 8 withdrew for personal reasons. 61 completed 6‐month and 54 completed 12‐month assessment. CONTROL 72 randomised, 4 died, 8 withdrew for personal reasons, 2 lost to follow‐up. 62 completed 6‐month and 58 completed 12‐month assessment. Similar proportions in both groups completed. |
| Selective reporting (reporting bias) | Low risk | The study protocol is available, and published reports include all expected outcomes, including those prespecified. |
| Other bias | Unclear risk | Unit of randomisation was participant's GP. Intervention and control groups were similar in terms of age, smoking history, airways limitation and QoL scores. Analysis did not take into account clustering by GP. |
ACCP: American College of Chest Physicians; ADLs: activities of daily living; ANCOVA: analysis of covariance; ANOVA: analysis of variance; AP: action plan; ATS: American Thoracic Society; BMI: body mass index;CI: confidence interval; COPD: chronic obstructive pulmonary disease; COPD‐SMI: COPD Self‐Management Interview; ED: emergency department; F: female; FEV1: forced expiratory volume in one second; FVC: forced vital capacity; GOLD: Global Initiative for Chronic Obstructive Lung Disease; GP: general practitioner; HADS: Hospital Anxiety and Depression Scale; HRQoL: health‐related quality of life; INT: intervention; IQR: interquartile range; IVC: inspiratory vital capacity; LABA: long‐acting beta‐agonist; M: male; MMSE: Mini Mental State Examination; MRC: Medical Research Council; OCSQ‐P: Outpatient Clinic Satisfaction Questionnaire ‐ Pulmonology; PN: practice nurse; PRED: prednisone; PYH: pack year history; QoL: quality of life; SABA: short‐acting beta‐agonist; SD: standard deviation; SGRQ: St George's Respiratory Questionnaire; SOB: shortness of breath; UC: usual care; VA: Veterans Administration; WD: withdrawal.
Characteristics of excluded studies [ordered by study ID]
Jump to:
| Study | Reason for exclusion |
| Intervention did not include an action plan. | |
| Action plan was part of a broader self‐management intervention. | |
| This was not a randomised controlled trial (RCT). | |
| Action plan was part of a broader self‐management intervention. | |
| Intervention did not include an action plan. | |
| Intervention did not include an action plan. | |
| Action plan was part of a broader self‐management intervention, and educational intervention was too long (weekly visits over a 2‐month period). | |
| Educational intervention was too long (4× 40‐minute individual training sessions). | |
| Intervention did not involve an action plan. | |
| Action plan was part of a broader self‐management intervention. | |
| This was not a randomised controlled trial (RCT). | |
| Educational intervention was too long (4 weekly telephone sessions 20 minutes each). | |
| Intervention did not include an action plan. | |
| This was not a randomised controlled trial (RCT). | |
| This was not a randomised controlled trial (RCT). | |
| Control group was not given usual care. Action plan was part of a broader self‐management intervention. | |
| Educational intervention was too long (2× 1 hour sessions). | |
| Educational intervention was too long (4 weekly 90‐minute individual sessions). | |
| Study participants included those with a diagnosis of asthma or COPD. Intervention did not include an action plan. | |
| Intervention did not include an action plan. | |
| Action plan was part of a broader self‐management intervention. | |
| Intervention did not include an action plan. | |
| This was not a randomised controlled trial (RCT). | |
| Educational intervention was too long (4× 2.5‐hour sessions). | |
| Action plan was part of a broader self‐management intervention. Control group was not given usual care. | |
| Educational intervention was too long (4× 40‐minute individual sessions). | |
| Action plan was part of a broader self‐management intervention. | |
| Intervention did not include an action plan. | |
| This was not a randomised controlled trial (RCT). | |
| Action plan was part of a broader self‐management intervention. | |
| This was not a randomised controlled trial (RCT). This was a pilot study of the acceptability of a pictorial action plan. | |
| Intervention did not include an action plan. | |
| Educational intervention was too long (8 sessions exceeding 1 hour). | |
| Citation to study was already excluded; educational sessions exceeded 1 hour. | |
| Intervention did not include an action plan. | |
| Intervention did not include an action plan. | |
| Action plan was part of a broader self‐management intervention. | |
| Intervention did not include an action plan. | |
| Intervention did not include an action plan. | |
| Control group was not given usual care. Educational intervention was too long (4× 1.5‐hour sessions). | |
| It was not possible to extract outcome data regarding action plan (AP) only. | |
| Intervention did not include an action plan. |
Characteristics of ongoing studies [ordered by study ID]
Jump to:
| Trial name or title | The effectiveness of pharmacist‐provided self‐management education to patients with chronic obstructive pulmonary disease |
| Methods | Study design: randomised controlled trial Location, number of centres: United States of America. 2 community pharmacies in Worcester, Massachusetts Duration of study: proposed to run for 12 months |
| Participants | N screened: not available N randomised: not available N completed: not available Baseline characteristics: not available Inclusion criteria: current use of an inhaled bronchodilator, aged 40 years or older, smoking history of 10 or more years, diagnosis of chronic obstructive pulmonary disease (COPD) confirmed through spirometry Exclusion criteria: not available |
| Interventions | AP group: education: medication therapy management session that includes a comprehensive medication review (CMR), inhaler technique and correction, presentation of self‐management techniques for COPD, distribution of educational materials about COPD. Action plan: after CMR is completed, the pharmacy will contact the participant's primary care provider to recommend 2 prescriptions: an oral corticosteroid and an antibiotic to keep on file to fill in the event of a COPD exacerbation. Once approval or denial is received, a written action plan is developed and given for each participant, along with a pulse oximeter and digital thermometer. |
| Outcomes | Primary outcomes: COPD‐related hospital admissions, COPD‐related unscheduled healthcare visits, health‐related quality of life |
| Starting date | Not available |
| Contact information | Massachusetts College of Pharmacy and Health Sciences. E‐mail: [email protected] |
| Notes | Efforts to contact first study author regarding details on progress of the study were unsuccessful. No data are available. |
Data and analyses
| Outcome or subgroup title | No. of studies | No. of participants | Statistical method | Effect size |
| 1 Hospitalizations for COPD /100 patient years Show forest plot | 1 | 743 | Rate Ratio (Fixed, 95% CI) | 0.69 [0.47, 1.01] |
| Analysis 1.1  Comparison 1 Action plan versus usual care, Outcome 1 Hospitalizations for COPD /100 patient years. | ||||
| 1.1 Action Plan +phone follow up | 1 | 743 | Rate Ratio (Fixed, 95% CI) | 0.69 [0.47, 1.01] |
| 2 At least 1 hospital admission (12 months) Show forest plot | 2 | 897 | Odds Ratio (M‐H, Fixed, 95% CI) | 0.69 [0.49, 0.97] |
| Analysis 1.2  Comparison 1 Action plan versus usual care, Outcome 2 At least 1 hospital admission (12 months). | ||||
| 2.1 Action Plan | 1 | 154 | Odds Ratio (M‐H, Fixed, 95% CI) | 0.97 [0.31, 3.03] |
| 2.2 Action Plan + Phonecall Follow‐up | 1 | 743 | Odds Ratio (M‐H, Fixed, 95% CI) | 0.66 [0.46, 0.95] |
| 3 at least 1 Hospital Admission (6 months) Show forest plot | 1 | 227 | Odds Ratio (M‐H, Fixed, 95% CI) | 0.83 [0.30, 2.31] |
| Analysis 1.3  Comparison 1 Action plan versus usual care, Outcome 3 at least 1 Hospital Admission (6 months). | ||||
| 3.1 Action Plan with Phone Call Follow‐up | 1 | 227 | Odds Ratio (M‐H, Fixed, 95% CI) | 0.83 [0.30, 2.31] |
| 4 Hospital admission (12 months) Show forest plot | 2 | 205 | Mean Difference (IV, Fixed, 95% CI) | 0.23 [‐0.03, 0.49] |
| Analysis 1.4  Comparison 1 Action plan versus usual care, Outcome 4 Hospital admission (12 months). | ||||
| 4.1 Action Plan | 2 | 205 | Mean Difference (IV, Fixed, 95% CI) | 0.23 [‐0.03, 0.49] |
| 5 Hospital Admission for COPD (6 months) Show forest plot | 1 | 227 | Mean Difference (IV, Fixed, 95% CI) | 0.0 [‐0.08, 0.08] |
| Analysis 1.5 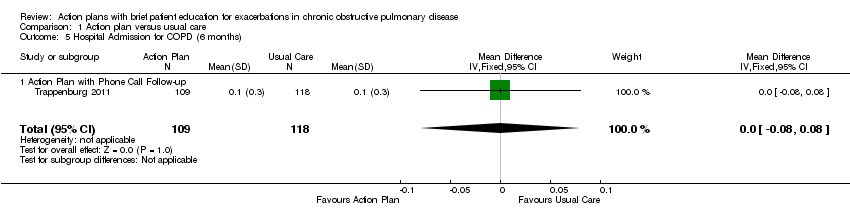 Comparison 1 Action plan versus usual care, Outcome 5 Hospital Admission for COPD (6 months). | ||||
| 5.1 Action Plan with Phone Call Follow‐up | 1 | 227 | Mean Difference (IV, Fixed, 95% CI) | 0.0 [‐0.08, 0.08] |
| 6 Hospitalizations & emergency visits for COPD/100 patient years Show forest plot | 1 | 743 | Rate Ratio (Fixed, 95% CI) | 0.59 [0.44, 0.79] |
| Analysis 1.6 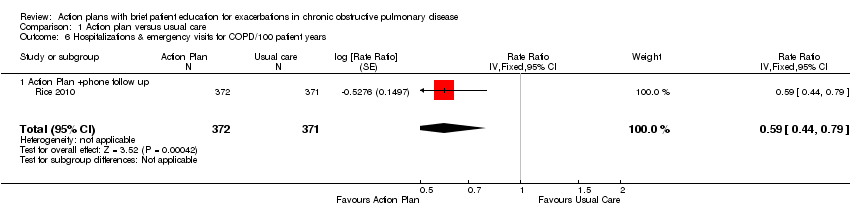 Comparison 1 Action plan versus usual care, Outcome 6 Hospitalizations & emergency visits for COPD/100 patient years. | ||||
| 6.1 Action Plan +phone follow up | 1 | 743 | Rate Ratio (Fixed, 95% CI) | 0.59 [0.44, 0.79] |
| 7 At Least 1 Hospital or Emergency Department Visit for COPD Show forest plot | 1 | 743 | Odds Ratio (M‐H, Fixed, 95% CI) | 0.59 [0.43, 0.80] |
| Analysis 1.7  Comparison 1 Action plan versus usual care, Outcome 7 At Least 1 Hospital or Emergency Department Visit for COPD. | ||||
| 7.1 Action Plan with Phone Call Follow‐up | 1 | 743 | Odds Ratio (M‐H, Fixed, 95% CI) | 0.59 [0.43, 0.80] |
| 8 Emergency department visits for COPD /100 patient years Show forest plot | 1 | 743 | Rate Ratio (Fixed, 95% CI) | 0.49 [0.33, 0.73] |
| Analysis 1.8  Comparison 1 Action plan versus usual care, Outcome 8 Emergency department visits for COPD /100 patient years. | ||||
| 8.1 Action Plan +phone follow up | 1 | 743 | Rate Ratio (Fixed, 95% CI) | 0.49 [0.33, 0.73] |
| 9 Emergency department visit for COPD (12 months) Show forest plot | 2 | 201 | Mean Difference (IV, Random, 95% CI) | 0.37 [‐0.50, 1.24] |
| Analysis 1.9  Comparison 1 Action plan versus usual care, Outcome 9 Emergency department visit for COPD (12 months). | ||||
| 9.1 Action Plan | 2 | 201 | Mean Difference (IV, Random, 95% CI) | 0.37 [‐0.50, 1.24] |
| 10 At least 1 emergency department visit (12 months) Show forest plot | 2 | 897 | Odds Ratio (M‐H, Fixed, 95% CI) | 0.55 [0.38, 0.78] |
| Analysis 1.10  Comparison 1 Action plan versus usual care, Outcome 10 At least 1 emergency department visit (12 months). | ||||
| 10.1 Action Plan | 1 | 154 | Odds Ratio (M‐H, Fixed, 95% CI) | 0.64 [0.25, 1.66] |
| 10.2 Action Plan + Phone Call Follow‐up | 1 | 743 | Odds Ratio (M‐H, Fixed, 95% CI) | 0.53 [0.36, 0.78] |
| 11 Emergency Department Visits for COPD (6 months) Show forest plot | 1 | 227 | Mean Difference (IV, Fixed, 95% CI) | 0.0 [‐0.09, 0.09] |
| Analysis 1.11  Comparison 1 Action plan versus usual care, Outcome 11 Emergency Department Visits for COPD (6 months). | ||||
| 11.1 Action Plan with Phone Call Follow‐up | 1 | 227 | Mean Difference (IV, Fixed, 95% CI) | 0.0 [‐0.09, 0.09] |
| 12 GP visits/phone contacts for COPD (all or urgent) Show forest plot | 3 | Mean Difference (IV, Fixed, 95% CI) | Subtotals only | |
| Analysis 1.12 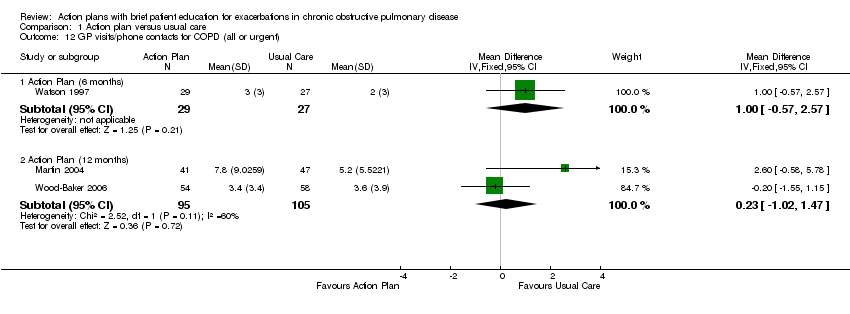 Comparison 1 Action plan versus usual care, Outcome 12 GP visits/phone contacts for COPD (all or urgent). | ||||
| 12.1 Action Plan (6 months) | 1 | 56 | Mean Difference (IV, Fixed, 95% CI) | 1.0 [‐0.57, 2.57] |
| 12.2 Action Plan (12 months) | 2 | 200 | Mean Difference (IV, Fixed, 95% CI) | 0.23 [‐1.02, 1.47] |
| 13 GP visits/phone contacts (total/all non‐COPD) (12 months) Show forest plot | 2 | 200 | Mean Difference (IV, Fixed, 95% CI) | 1.25 [‐1.54, 4.03] |
| Analysis 1.13 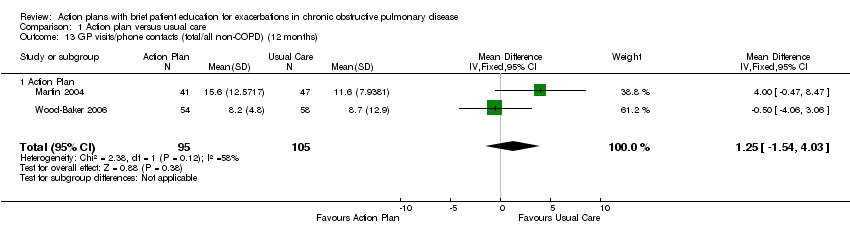 Comparison 1 Action plan versus usual care, Outcome 13 GP visits/phone contacts (total/all non‐COPD) (12 months). | ||||
| 13.1 Action Plan | 2 | 200 | Mean Difference (IV, Fixed, 95% CI) | 1.25 [‐1.54, 4.03] |
| 14 Unscheduled Physician Visits (6 months) Show forest plot | 1 | 227 | Mean Difference (IV, Fixed, 95% CI) | 0.0 [‐0.36, 0.36] |
| Analysis 1.14  Comparison 1 Action plan versus usual care, Outcome 14 Unscheduled Physician Visits (6 months). | ||||
| 14.1 Action Plan with Phonecall Follow‐up | 1 | 227 | Mean Difference (IV, Fixed, 95% CI) | 0.0 [‐0.36, 0.36] |
| 15 Ambulance calls (total) Show forest plot | 1 | 89 | Mean Difference (IV, Fixed, 95% CI) | 1.70 [0.17, 3.23] |
| Analysis 1.15  Comparison 1 Action plan versus usual care, Outcome 15 Ambulance calls (total). | ||||
| 15.1 Action Plan | 1 | 89 | Mean Difference (IV, Fixed, 95% CI) | 1.70 [0.17, 3.23] |
| 16 Total Hospital Days (12 months) Show forest plot | 1 | 743 | Mean Difference (IV, Fixed, 95% CI) | ‐1.10 [0.00, ‐0.20] |
| Analysis 1.16  Comparison 1 Action plan versus usual care, Outcome 16 Total Hospital Days (12 months). | ||||
| 16.1 Action Plan + Phone Call Folow‐up | 1 | 743 | Mean Difference (IV, Fixed, 95% CI) | ‐1.10 [0.00, ‐0.20] |
| 17 Total ICU Days (12 months) Show forest plot | 1 | 743 | Mean Difference (IV, Fixed, 95% CI) | ‐0.30 [‐0.60, ‐0.00] |
| Analysis 1.17  Comparison 1 Action plan versus usual care, Outcome 17 Total ICU Days (12 months). | ||||
| 17.1 Action Plan + Phone Call Folow‐up | 1 | 743 | Mean Difference (IV, Fixed, 95% CI) | ‐0.30 [‐0.60, ‐0.00] |
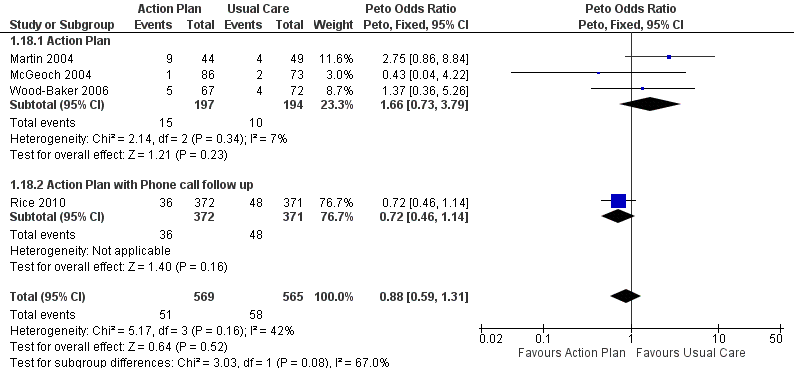
| 18 Mortality (all cause) 12 months Show forest plot | 4 | 1134 | Peto Odds Ratio (Peto, Fixed, 95% CI) | 0.88 [0.59, 1.31] |
| Analysis 1.18 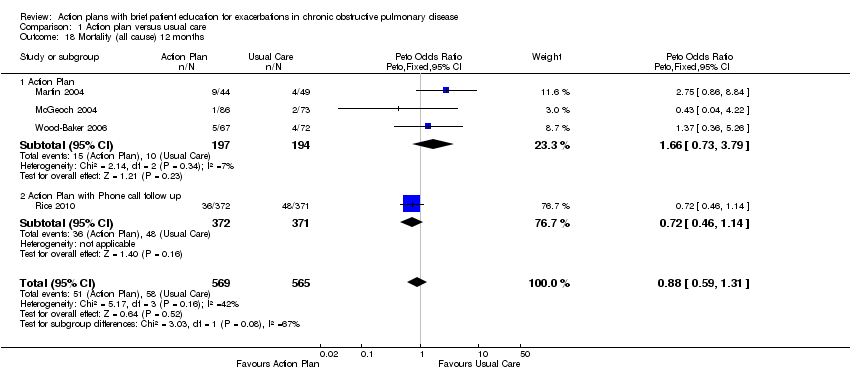 Comparison 1 Action plan versus usual care, Outcome 18 Mortality (all cause) 12 months. | ||||
| 18.1 Action Plan | 3 | 391 | Peto Odds Ratio (Peto, Fixed, 95% CI) | 1.66 [0.73, 3.79] |
| 18.2 Action Plan with Phone call follow up | 1 | 743 | Peto Odds Ratio (Peto, Fixed, 95% CI) | 0.72 [0.46, 1.14] |
| 19 Mortality (all cause) per 100 Patient‐Years (12 months) Show forest plot | 1 | 743 | Mean Difference (IV, Fixed, 95% CI) | ‐3.70 [‐8.86, 1.46] |
| Analysis 1.19  Comparison 1 Action plan versus usual care, Outcome 19 Mortality (all cause) per 100 Patient‐Years (12 months). | ||||
| 19.1 Action Plan with Phone Call Follow‐up | 1 | 743 | Mean Difference (IV, Fixed, 95% CI) | ‐3.70 [‐8.86, 1.46] |
| 20 Mortality (all cause) 6 months Show forest plot | 1 | 229 | Peto Odds Ratio (Peto, Fixed, 95% CI) | 1.06 [0.15, 7.66] |
| Analysis 1.20 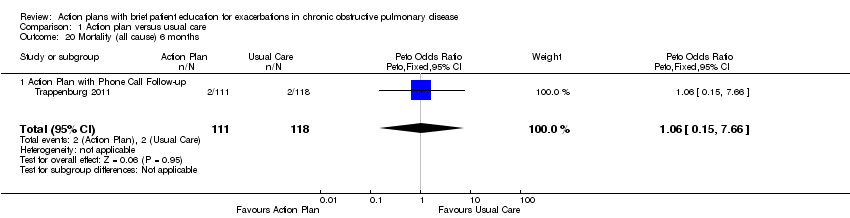 Comparison 1 Action plan versus usual care, Outcome 20 Mortality (all cause) 6 months. | ||||
| 20.1 Action Plan with Phone Call Follow‐up | 1 | 229 | Peto Odds Ratio (Peto, Fixed, 95% CI) | 1.06 [0.15, 7.66] |
| 21 At least 1 course oral steroids for exacerbation Show forest plot | 2 | Odds Ratio (M‐H, Fixed, 95% CI) | Subtotals only | |
| Analysis 1.21  Comparison 1 Action plan versus usual care, Outcome 21 At least 1 course oral steroids for exacerbation. | ||||
| 21.1 Action Plan (6 months) | 1 | 56 | Odds Ratio (M‐H, Fixed, 95% CI) | 6.58 [1.29, 33.62] |
| 21.2 Action Plan (12 months) | 1 | 154 | Odds Ratio (M‐H, Fixed, 95% CI) | 1.27 [0.34, 4.69] |
| 22 Courses of oral corticosteroids (12 months) Show forest plot | 2 | 200 | Mean Difference (IV, Fixed, 95% CI) | 0.74 [0.12, 1.35] |
| Analysis 1.22  Comparison 1 Action plan versus usual care, Outcome 22 Courses of oral corticosteroids (12 months). | ||||
| 22.1 Action Plan | 2 | 200 | Mean Difference (IV, Fixed, 95% CI) | 0.74 [0.12, 1.35] |
| 23 Courses of Corticosteroids (6 months) Show forest plot | 1 | 227 | Mean Difference (IV, Fixed, 95% CI) | 0.0 [‐0.23, 0.23] |
| Analysis 1.23  Comparison 1 Action plan versus usual care, Outcome 23 Courses of Corticosteroids (6 months). | ||||
| 23.1 Action Plan with Phone Call Follow‐up | 1 | 227 | Mean Difference (IV, Fixed, 95% CI) | 0.0 [‐0.23, 0.23] |
| 24 Days on corticosteroids (6 months) Show forest plot | 1 | 56 | Mean Difference (IV, Fixed, 95% CI) | 6.0 [‐5.53, 17.53] |
| Analysis 1.24  Comparison 1 Action plan versus usual care, Outcome 24 Days on corticosteroids (6 months). | ||||
| 24.1 Action Plan | 1 | 56 | Mean Difference (IV, Fixed, 95% CI) | 6.0 [‐5.53, 17.53] |
| 25 Prednisolone mg (12 months) Show forest plot | 1 | 743 | Mean Difference (IV, Fixed, 95% CI) | 779.0 [533.23, 1024.77] |
| Analysis 1.25  Comparison 1 Action plan versus usual care, Outcome 25 Prednisolone mg (12 months). | ||||
| 25.1 Action Plan with Phone Call Follow‐up | 1 | 743 | Mean Difference (IV, Fixed, 95% CI) | 779.0 [533.23, 1024.77] |
| 26 At least 1 course antibiotics for exacerbation Show forest plot | 3 | Peto Odds Ratio (Peto, Fixed, 95% CI) | Subtotals only | |
| Analysis 1.26  Comparison 1 Action plan versus usual care, Outcome 26 At least 1 course antibiotics for exacerbation. | ||||
| 26.1 Action Plan (6 months) | 1 | 56 | Peto Odds Ratio (Peto, Fixed, 95% CI) | 6.51 [2.02, 21.05] |
| 26.2 Action Plan (12 months) | 2 | 293 | Peto Odds Ratio (Peto, Fixed, 95% CI) | 1.65 [1.01, 2.69] |
| 27 Courses of antibiotics (12 months) Show forest plot | 3 | 943 | Mean Difference (IV, Fixed, 95% CI) | 2.26 [1.82, 2.70] |
| Analysis 1.27  Comparison 1 Action plan versus usual care, Outcome 27 Courses of antibiotics (12 months). | ||||
| 27.1 Action Plan | 2 | 200 | Mean Difference (IV, Fixed, 95% CI) | 0.78 [‐0.24, 1.79] |
| 27.2 Action Plan with Phone Call Follow‐up | 1 | 743 | Mean Difference (IV, Fixed, 95% CI) | 2.6 [2.12, 3.08] |
| 28 Courses of Antibiotics (6 months) Show forest plot | 1 | 227 | Mean Difference (IV, Fixed, 95% CI) | 0.0 [‐0.26, 0.26] |
| Analysis 1.28  Comparison 1 Action plan versus usual care, Outcome 28 Courses of Antibiotics (6 months). | ||||
| 28.1 Action Plan with Phone Call Follow‐up | 1 | 227 | Mean Difference (IV, Fixed, 95% CI) | 0.0 [‐0.26, 0.26] |
| 29 Days on antibiotics (6 months) Show forest plot | 1 | 56 | Mean Difference (IV, Fixed, 95% CI) | 6.0 [1.40, 10.60] |
| Analysis 1.29  Comparison 1 Action plan versus usual care, Outcome 29 Days on antibiotics (6 months). | ||||
| 29.1 Action Plan | 1 | 56 | Mean Difference (IV, Fixed, 95% CI) | 6.0 [1.40, 10.60] |
| 30 SGRQ overall score (12 months) Show forest plot | 3 | 1009 | Mean Difference (IV, Fixed, 95% CI) | ‐2.79 [‐4.77, ‐0.82] |
| Analysis 1.30  Comparison 1 Action plan versus usual care, Outcome 30 SGRQ overall score (12 months). | ||||
| 30.1 Action Plan | 2 | 266 | Mean Difference (IV, Fixed, 95% CI) | 0.32 [‐2.70, 3.34] |
| 30.2 Action Plan + Phone Call Follow‐up | 1 | 743 | Mean Difference (IV, Fixed, 95% CI) | ‐5.10 [‐7.70, ‐2.50] |
| 31 SGRQ overall score (6 months) Show forest plot | 4 | 452 | Mean Difference (IV, Fixed, 95% CI) | ‐0.83 [‐2.93, 1.27] |
| Analysis 1.31  Comparison 1 Action plan versus usual care, Outcome 31 SGRQ overall score (6 months). | ||||
| 31.1 Action Plan | 3 | 269 | Mean Difference (IV, Fixed, 95% CI) | ‐0.33 [‐3.03, 2.37] |
| 31.2 Action Plan + Phone Call Follow‐up | 1 | 183 | Mean Difference (IV, Fixed, 95% CI) | ‐1.6 [‐4.94, 1.74] |
| 32 SGRQ symptoms (12 months) Show forest plot | 2 | 266 | Mean Difference (IV, Fixed, 95% CI) | ‐1.84 [‐7.14, 3.47] |
| Analysis 1.32 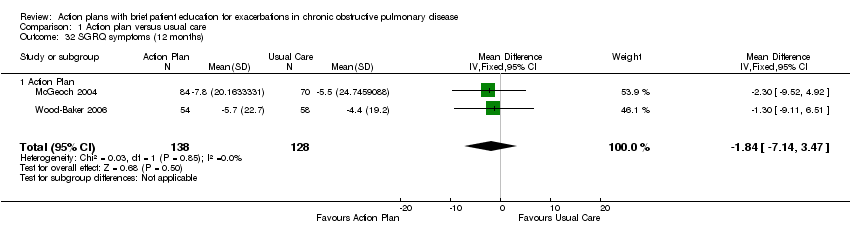 Comparison 1 Action plan versus usual care, Outcome 32 SGRQ symptoms (12 months). | ||||
| 32.1 Action Plan | 2 | 266 | Mean Difference (IV, Fixed, 95% CI) | ‐1.84 [‐7.14, 3.47] |
| 33 SGRQ symptoms (6 months) Show forest plot | 4 | 448 | Mean Difference (IV, Fixed, 95% CI) | ‐2.55 [‐6.92, 1.83] |
| Analysis 1.33  Comparison 1 Action plan versus usual care, Outcome 33 SGRQ symptoms (6 months). | ||||
| 33.1 Action Plan | 3 | 265 | Mean Difference (IV, Fixed, 95% CI) | ‐2.07 [‐8.34, 4.20] |
| 33.2 Action Plan + Phone Call Follow‐up (change from baseline) | 1 | 183 | Mean Difference (IV, Fixed, 95% CI) | ‐3.0 [‐9.10, 3.10] |
| 34 SGRQ activity limitation (12 months) Show forest plot | 2 | 266 | Mean Difference (IV, Fixed, 95% CI) | 2.87 [‐1.26, 7.00] |
| Analysis 1.34  Comparison 1 Action plan versus usual care, Outcome 34 SGRQ activity limitation (12 months). | ||||
| 34.1 Action Plan | 2 | 266 | Mean Difference (IV, Fixed, 95% CI) | 2.87 [‐1.26, 7.00] |
| 35 SGRQ activity limitation (6 months) Show forest plot | 4 | 452 | Mean Difference (IV, Fixed, 95% CI) | 0.88 [‐1.90, 3.67] |
| Analysis 1.35  Comparison 1 Action plan versus usual care, Outcome 35 SGRQ activity limitation (6 months). | ||||
| 35.1 Action Plan | 3 | 269 | Mean Difference (IV, Fixed, 95% CI) | 1.41 [‐1.99, 4.82] |
| 35.2 Action Plan + Phone Call Follow‐up | 1 | 183 | Mean Difference (IV, Fixed, 95% CI) | ‐0.20 [‐5.05, 4.65] |
| 36 SGRQ impact (12 months) Show forest plot | 2 | 266 | Mean Difference (IV, Fixed, 95% CI) | ‐1.04 [‐4.51, 2.43] |
| Analysis 1.36  Comparison 1 Action plan versus usual care, Outcome 36 SGRQ impact (12 months). | ||||
| 36.1 Action Plan | 2 | 266 | Mean Difference (IV, Fixed, 95% CI) | ‐1.04 [‐4.51, 2.43] |
| 37 SGRQ impact score (6 months) Show forest plot | 4 | 452 | Mean Difference (IV, Fixed, 95% CI) | ‐1.26 [‐3.47, 0.95] |
| Analysis 1.37  Comparison 1 Action plan versus usual care, Outcome 37 SGRQ impact score (6 months). | ||||
| 37.1 Action Plan | 3 | 269 | Mean Difference (IV, Fixed, 95% CI) | ‐1.53 [‐4.45, 1.39] |
| 37.2 Action Plan + Phone Call Follow‐up | 1 | 183 | Mean Difference (IV, Fixed, 95% CI) | ‐0.9 [‐4.27, 2.47] |
| 38 SF36 physical function (6 months) Show forest plot | 1 | Mean Difference (IV, Fixed, 95% CI) | Subtotals only | |
| Analysis 1.38  Comparison 1 Action plan versus usual care, Outcome 38 SF36 physical function (6 months). | ||||
| 38.1 Action Plan | 1 | 90 | Mean Difference (IV, Fixed, 95% CI) | 0.30 [‐7.13, 7.73] |
| 39 SF36 role limitation physical (6 months) Show forest plot | 1 | Mean Difference (IV, Fixed, 95% CI) | Subtotals only | |
| Analysis 1.39  Comparison 1 Action plan versus usual care, Outcome 39 SF36 role limitation physical (6 months). | ||||
| 39.1 Action Plan | 1 | 90 | Mean Difference (IV, Fixed, 95% CI) | 9.0 [‐8.07, 26.07] |
| 40 SF36 bodily pain (6 months) Show forest plot | 1 | Mean Difference (IV, Fixed, 95% CI) | Subtotals only | |
| Analysis 1.40 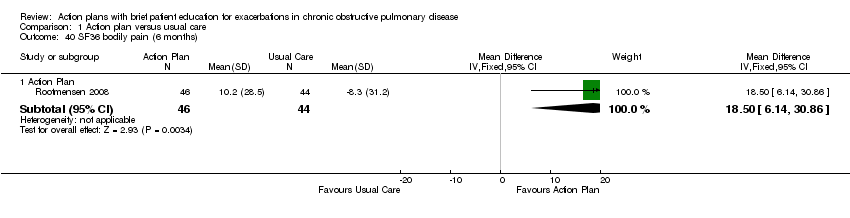 Comparison 1 Action plan versus usual care, Outcome 40 SF36 bodily pain (6 months). | ||||
| 40.1 Action Plan | 1 | 90 | Mean Difference (IV, Fixed, 95% CI) | 18.5 [6.14, 30.86] |
| 41 SF36 general health (6 months) Show forest plot | 1 | Mean Difference (IV, Fixed, 95% CI) | Subtotals only | |
| Analysis 1.41  Comparison 1 Action plan versus usual care, Outcome 41 SF36 general health (6 months). | ||||
| 41.1 Action Plan | 1 | 90 | Mean Difference (IV, Fixed, 95% CI) | 2.60 [‐3.71, 8.91] |
| 42 SF36 vitality (6 months) Show forest plot | 1 | Mean Difference (IV, Fixed, 95% CI) | Subtotals only | |
| Analysis 1.42  Comparison 1 Action plan versus usual care, Outcome 42 SF36 vitality (6 months). | ||||
| 42.1 Action Plan | 1 | 90 | Mean Difference (IV, Fixed, 95% CI) | 1.6 [‐4.73, 7.93] |
| 43 SF36 mental health (6 months) Show forest plot | 1 | Mean Difference (IV, Fixed, 95% CI) | Subtotals only | |
| Analysis 1.43  Comparison 1 Action plan versus usual care, Outcome 43 SF36 mental health (6 months). | ||||
| 43.1 Action Plan | 1 | 90 | Mean Difference (IV, Fixed, 95% CI) | 6.3 [0.64, 11.96] |
| 44 SF36 role limitation emotional (6 months) Show forest plot | 1 | Mean Difference (IV, Fixed, 95% CI) | Subtotals only | |
| Analysis 1.44  Comparison 1 Action plan versus usual care, Outcome 44 SF36 role limitation emotional (6 months). | ||||
| 44.1 Action Plan | 1 | 90 | Mean Difference (IV, Fixed, 95% CI) | 7.5 [‐8.56, 23.56] |
| 45 SF36 social function (6 months) Show forest plot | 1 | Mean Difference (IV, Fixed, 95% CI) | Subtotals only | |
| Analysis 1.45 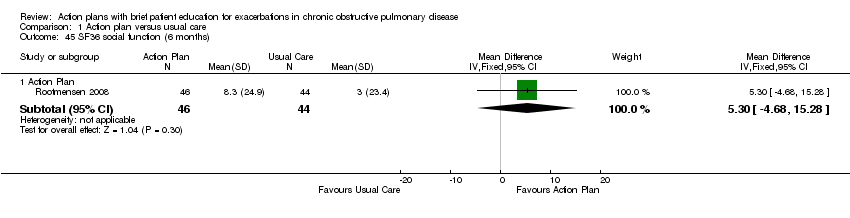 Comparison 1 Action plan versus usual care, Outcome 45 SF36 social function (6 months). | ||||
| 45.1 Action Plan | 1 | 90 | Mean Difference (IV, Fixed, 95% CI) | 5.30 [‐4.68, 15.28] |
| 46 HADS ‐ depression score (12 months) Show forest plot | 1 | Mean Difference (IV, Fixed, 95% CI) | Subtotals only | |
| Analysis 1.46  Comparison 1 Action plan versus usual care, Outcome 46 HADS ‐ depression score (12 months). | ||||
| 46.1 Action Plan | 1 | 154 | Mean Difference (IV, Fixed, 95% CI) | ‐0.25 [‐1.14, 0.64] |
| 47 HADS ‐ depression score (6 months) Show forest plot | 1 | Mean Difference (IV, Fixed, 95% CI) | Subtotals only | |
| Analysis 1.47 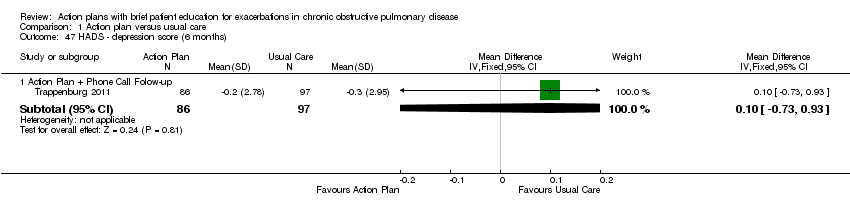 Comparison 1 Action plan versus usual care, Outcome 47 HADS ‐ depression score (6 months). | ||||
| 47.1 Action Plan + Phone Call Folow‐up | 1 | 183 | Mean Difference (IV, Fixed, 95% CI) | 0.10 [‐0.73, 0.93] |
| 48 HADS ‐ anxiety score (12 months) Show forest plot | 1 | Mean Difference (IV, Fixed, 95% CI) | Subtotals only | |
| Analysis 1.48  Comparison 1 Action plan versus usual care, Outcome 48 HADS ‐ anxiety score (12 months). | ||||
| 48.1 Action Plan | 1 | 154 | Mean Difference (IV, Fixed, 95% CI) | 0.14 [‐1.38, 1.66] |
| 49 HADS ‐ anxiety score (6 months) Show forest plot | 1 | Mean Difference (IV, Fixed, 95% CI) | Subtotals only | |
| Analysis 1.49  Comparison 1 Action plan versus usual care, Outcome 49 HADS ‐ anxiety score (6 months). | ||||
| 49.1 Action Plan + Phone Call Follow‐up (change from baseline) | 1 | 183 | Mean Difference (IV, Fixed, 95% CI) | 0.0 [‐0.83, 0.83] |
| 50 Exacerbation knowledge when well (12 months) Show forest plot | 1 | Mean Difference (Fixed, 95% CI) | Subtotals only | |
| Analysis 1.50  Comparison 1 Action plan versus usual care, Outcome 50 Exacerbation knowledge when well (12 months). | ||||
| 50.1 Action Plan | 1 | 154 | Mean Difference (Fixed, 95% CI) | 1.1 [0.46, 1.74] |
| 51 Exacerbation actions when well (12 months) Show forest plot | 1 | Mean Difference (Fixed, 95% CI) | Subtotals only | |
| Analysis 1.51  Comparison 1 Action plan versus usual care, Outcome 51 Exacerbation actions when well (12 months). | ||||
| 51.1 Action Plan | 1 | 154 | Mean Difference (Fixed, 95% CI) | 0.5 [‐0.24, 1.24] |
| 52 Early exacerbation knowledge (12 months) Show forest plot | 1 | Mean Difference (Fixed, 95% CI) | Subtotals only | |
| Analysis 1.52  Comparison 1 Action plan versus usual care, Outcome 52 Early exacerbation knowledge (12 months). | ||||
| 52.1 Action Plan | 1 | 154 | Mean Difference (Fixed, 95% CI) | 1.80 [0.75, 2.85] |
| 53 Early exacerbation actions (12 months) Show forest plot | 1 | Mean Difference (Fixed, 95% CI) | Subtotals only | |
| Analysis 1.53  Comparison 1 Action plan versus usual care, Outcome 53 Early exacerbation actions (12 months). | ||||
| 53.1 Action Plan | 1 | 154 | Mean Difference (Fixed, 95% CI) | 2.3 [0.96, 3.64] |
| 54 Severe exacerbation knowledge (12 months) Show forest plot | 1 | Mean Difference (Fixed, 95% CI) | Subtotals only | |
| Analysis 1.54 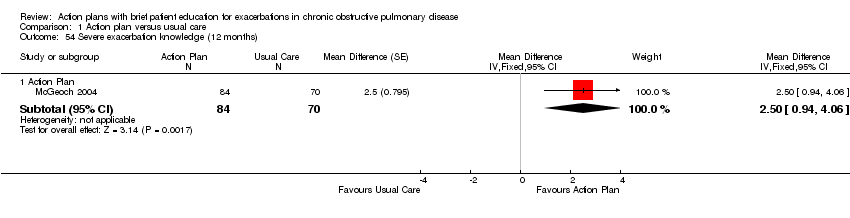 Comparison 1 Action plan versus usual care, Outcome 54 Severe exacerbation knowledge (12 months). | ||||
| 54.1 Action Plan | 1 | 154 | Mean Difference (Fixed, 95% CI) | 2.5 [0.94, 4.06] |
| 55 Severe exacerbation actions (12 months) Show forest plot | 1 | Mean Difference (Fixed, 95% CI) | Subtotals only | |
| Analysis 1.55  Comparison 1 Action plan versus usual care, Outcome 55 Severe exacerbation actions (12 months). | ||||
| 55.1 Action Plan | 1 | 154 | Mean Difference (Fixed, 95% CI) | 1.5 [0.47, 2.53] |
| 56 Self‐management exacerbation actions (6 months) Show forest plot | 1 | Mean Difference (IV, Fixed, 95% CI) | Subtotals only | |
| Analysis 1.56  Comparison 1 Action plan versus usual care, Outcome 56 Self‐management exacerbation actions (6 months). | ||||
| 56.1 Action Plan | 1 | 90 | Mean Difference (IV, Fixed, 95% CI) | ‐5.1 [‐15.26, 5.06] |
| 57 Self‐efficacy for Exacerbation Recognition (6 months) Show forest plot | 1 | Mean Difference (IV, Fixed, 95% CI) | Subtotals only | |
| Analysis 1.57  Comparison 1 Action plan versus usual care, Outcome 57 Self‐efficacy for Exacerbation Recognition (6 months). | ||||
| 57.1 Action Plan + Phone Call Follow‐up | 1 | 183 | Mean Difference (IV, Fixed, 95% CI) | ‐0.70 [‐0.98, ‐0.42] |
| 58 Self‐efficacy for Exacerbation Prevention/Action (6 months) Show forest plot | 1 | Mean Difference (IV, Fixed, 95% CI) | Subtotals only | |
| Analysis 1.58  Comparison 1 Action plan versus usual care, Outcome 58 Self‐efficacy for Exacerbation Prevention/Action (6 months). | ||||
| 58.1 Action Plan + Phone Call Follow‐up | 1 | 183 | Mean Difference (IV, Fixed, 95% CI) | ‐0.90 [‐1.18, ‐0.62] |
| 59 FEV1 % predicted Show forest plot | 2 | Mean Difference (IV, Fixed, 95% CI) | Subtotals only | |
| Analysis 1.59  Comparison 1 Action plan versus usual care, Outcome 59 FEV1 % predicted. | ||||
| 59.1 6 months | 2 | 179 | Mean Difference (IV, Fixed, 95% CI) | 1.83 [‐1.05, 4.71] |
| 59.2 12 months | 1 | 112 | Mean Difference (IV, Fixed, 95% CI) | 2.00 [‐1.89, 5.89] |
| 60 Cost HADM per patient US$ (12 months) Show forest plot | 1 | Mean Difference (IV, Fixed, 95% CI) | Subtotals only | |
| Analysis 1.60 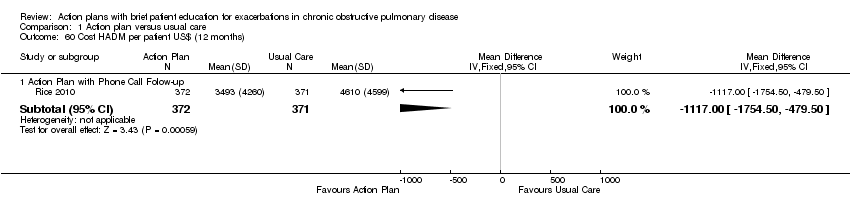 Comparison 1 Action plan versus usual care, Outcome 60 Cost HADM per patient US$ (12 months). | ||||
| 60.1 Action Plan with Phone Call Folow‐up | 1 | 743 | Mean Difference (IV, Fixed, 95% CI) | ‐1117.0 [‐1754.50, ‐479.50] |
| 61 Cost EDV Per Patient US$ (12 months) Show forest plot | 1 | Mean Difference (IV, Fixed, 95% CI) | Subtotals only | |
| Analysis 1.61  Comparison 1 Action plan versus usual care, Outcome 61 Cost EDV Per Patient US$ (12 months). | ||||
| 61.1 Action Plan with Phone Call Follow‐up | 1 | 743 | Mean Difference (IV, Fixed, 95% CI) | ‐141.0 [‐234.31, ‐47.69] |
| 62 Cost Pulmonary Drug Prescriptions per Patient US$ (12 months) Show forest plot | 1 | Mean Difference (IV, Fixed, 95% CI) | Subtotals only | |
| Analysis 1.62  Comparison 1 Action plan versus usual care, Outcome 62 Cost Pulmonary Drug Prescriptions per Patient US$ (12 months). | ||||
| 62.1 Action Plan with Phone Call Follow‐up | 1 | 743 | Mean Difference (IV, Fixed, 95% CI) | 15.00 [‐6.32, 36.32] |

Methodological quality graph: review authors' judgements about each methodological quality item presented as percentages across all included studies.
Methodological quality summary: review authors' judgements about each methodological quality item for each included study.
Forest plot of comparison: 1 Action plan versus usual care, outcome: 1.18 Mortality (all cause) 12 months.
Comparison 1 Action plan versus usual care, Outcome 1 Hospitalizations for COPD /100 patient years.
Comparison 1 Action plan versus usual care, Outcome 2 At least 1 hospital admission (12 months).
Comparison 1 Action plan versus usual care, Outcome 3 at least 1 Hospital Admission (6 months).
Comparison 1 Action plan versus usual care, Outcome 4 Hospital admission (12 months).
Comparison 1 Action plan versus usual care, Outcome 5 Hospital Admission for COPD (6 months).
Comparison 1 Action plan versus usual care, Outcome 6 Hospitalizations & emergency visits for COPD/100 patient years.
Comparison 1 Action plan versus usual care, Outcome 7 At Least 1 Hospital or Emergency Department Visit for COPD.
Comparison 1 Action plan versus usual care, Outcome 8 Emergency department visits for COPD /100 patient years.
Comparison 1 Action plan versus usual care, Outcome 9 Emergency department visit for COPD (12 months).
Comparison 1 Action plan versus usual care, Outcome 10 At least 1 emergency department visit (12 months).
Comparison 1 Action plan versus usual care, Outcome 11 Emergency Department Visits for COPD (6 months).
Comparison 1 Action plan versus usual care, Outcome 12 GP visits/phone contacts for COPD (all or urgent).
Comparison 1 Action plan versus usual care, Outcome 13 GP visits/phone contacts (total/all non‐COPD) (12 months).
Comparison 1 Action plan versus usual care, Outcome 14 Unscheduled Physician Visits (6 months).
Comparison 1 Action plan versus usual care, Outcome 15 Ambulance calls (total).
Comparison 1 Action plan versus usual care, Outcome 16 Total Hospital Days (12 months).
Comparison 1 Action plan versus usual care, Outcome 17 Total ICU Days (12 months).
Comparison 1 Action plan versus usual care, Outcome 18 Mortality (all cause) 12 months.
Comparison 1 Action plan versus usual care, Outcome 19 Mortality (all cause) per 100 Patient‐Years (12 months).
Comparison 1 Action plan versus usual care, Outcome 20 Mortality (all cause) 6 months.
Comparison 1 Action plan versus usual care, Outcome 21 At least 1 course oral steroids for exacerbation.
Comparison 1 Action plan versus usual care, Outcome 22 Courses of oral corticosteroids (12 months).
Comparison 1 Action plan versus usual care, Outcome 23 Courses of Corticosteroids (6 months).
Comparison 1 Action plan versus usual care, Outcome 24 Days on corticosteroids (6 months).
Comparison 1 Action plan versus usual care, Outcome 25 Prednisolone mg (12 months).
Comparison 1 Action plan versus usual care, Outcome 26 At least 1 course antibiotics for exacerbation.
Comparison 1 Action plan versus usual care, Outcome 27 Courses of antibiotics (12 months).
Comparison 1 Action plan versus usual care, Outcome 28 Courses of Antibiotics (6 months).
Comparison 1 Action plan versus usual care, Outcome 29 Days on antibiotics (6 months).
Comparison 1 Action plan versus usual care, Outcome 30 SGRQ overall score (12 months).
Comparison 1 Action plan versus usual care, Outcome 31 SGRQ overall score (6 months).
Comparison 1 Action plan versus usual care, Outcome 32 SGRQ symptoms (12 months).
Comparison 1 Action plan versus usual care, Outcome 33 SGRQ symptoms (6 months).
Comparison 1 Action plan versus usual care, Outcome 34 SGRQ activity limitation (12 months).
Comparison 1 Action plan versus usual care, Outcome 35 SGRQ activity limitation (6 months).
Comparison 1 Action plan versus usual care, Outcome 36 SGRQ impact (12 months).
Comparison 1 Action plan versus usual care, Outcome 37 SGRQ impact score (6 months).
Comparison 1 Action plan versus usual care, Outcome 38 SF36 physical function (6 months).
Comparison 1 Action plan versus usual care, Outcome 39 SF36 role limitation physical (6 months).
Comparison 1 Action plan versus usual care, Outcome 40 SF36 bodily pain (6 months).
Comparison 1 Action plan versus usual care, Outcome 41 SF36 general health (6 months).
Comparison 1 Action plan versus usual care, Outcome 42 SF36 vitality (6 months).
Comparison 1 Action plan versus usual care, Outcome 43 SF36 mental health (6 months).
Comparison 1 Action plan versus usual care, Outcome 44 SF36 role limitation emotional (6 months).
Comparison 1 Action plan versus usual care, Outcome 45 SF36 social function (6 months).
Comparison 1 Action plan versus usual care, Outcome 46 HADS ‐ depression score (12 months).
Comparison 1 Action plan versus usual care, Outcome 47 HADS ‐ depression score (6 months).
Comparison 1 Action plan versus usual care, Outcome 48 HADS ‐ anxiety score (12 months).
Comparison 1 Action plan versus usual care, Outcome 49 HADS ‐ anxiety score (6 months).
Comparison 1 Action plan versus usual care, Outcome 50 Exacerbation knowledge when well (12 months).
Comparison 1 Action plan versus usual care, Outcome 51 Exacerbation actions when well (12 months).
Comparison 1 Action plan versus usual care, Outcome 52 Early exacerbation knowledge (12 months).
Comparison 1 Action plan versus usual care, Outcome 53 Early exacerbation actions (12 months).
Comparison 1 Action plan versus usual care, Outcome 54 Severe exacerbation knowledge (12 months).
Comparison 1 Action plan versus usual care, Outcome 55 Severe exacerbation actions (12 months).
Comparison 1 Action plan versus usual care, Outcome 56 Self‐management exacerbation actions (6 months).
Comparison 1 Action plan versus usual care, Outcome 57 Self‐efficacy for Exacerbation Recognition (6 months).
Comparison 1 Action plan versus usual care, Outcome 58 Self‐efficacy for Exacerbation Prevention/Action (6 months).
Comparison 1 Action plan versus usual care, Outcome 59 FEV1 % predicted.
Comparison 1 Action plan versus usual care, Outcome 60 Cost HADM per patient US$ (12 months).
Comparison 1 Action plan versus usual care, Outcome 61 Cost EDV Per Patient US$ (12 months).
Comparison 1 Action plan versus usual care, Outcome 62 Cost Pulmonary Drug Prescriptions per Patient US$ (12 months).
| Do action plans improve patient outcomes in acute exacerbations of chronic obstructive pulmonary disease | ||||||
| Patient or population: individuals with exacerbations of chronic obstructive pulmonary disease | ||||||
| Outcomes | Anticipated absolute effects* (95% CI) | Relative effect | Number of participants | Quality of the evidence | Comments | |
| Risk with usual care | Risk with action plan | |||||
| Hospitalisations for COPD/100 patient‐years (action plan + phone follow‐up) | Rate ratio 0.69 | 743 | ⊕⊕⊕⊝ | |||
| Hospitalisations and emergency visits for COPD/100 patient‐years (action plan + phone follow‐up) | Rate ratio 0.59 | 743 | ⊕⊕⊕⊕ | |||
| At least 1 hospital admission | 209 per 1000 | 154 per 1000 | Odds ratio 0.69 | 897 | ⊕⊕⊕⊝ | |
| Mortality (all‐cause) | 103 per 1000 | 91 per 1000 | Odds ratio 0.88 | 1134 | ⊕⊕⊕⊝ | |
| Courses of oral corticosteroids | Mean courses of oral corticosteroids were 1.05 | Mean courses of oral corticosteroids in the intervention group were 0.74 more (0.12 more to 1.35 more) | ‐ | 200 | ⊕⊕⊕⊝ | |
| Courses of antibiotics | Mean courses of antibiotics ranged from 1.6 to 3.2 | Mean courses of antibiotics in the intervention group were 2.26 more (1.82 more to 2.7 more) | ‐ | 943 | ⊕⊕⊕⊝ | Not downgraded for presence of substantial heterogeneity, which is explicable by differences in study design |
| Respiratory‐related quality of life: SGRQ overall score | Mean respiratory‐related quality of life: SGRQ overall score ranged from ‐2 to +6 units | Mean respiratory‐related quality of life: SGRQ overall score in the intervention group was 2.82 units lower (0.83 lower to 4.81 lower) | ‐ | 1009 | ⊕⊕⊕⊝ | Not downgraded for presence of substantial heterogeneity, which is explicable by differences in study design |
| Depression score | Mean depression score was ‐0.04 | Mean depression score in the intervention group was 0.25 lower (1.14 lower to 0.64 higher) | ‐ | 154 | ⊕⊕⊝⊝ | |
| *Risk in the intervention group (and its 95% confidence interval) is based on assumed risk in the comparison group and the relative effect of the intervention (and its 95% CI). | ||||||
| GRADE Working Group grades of evidence | ||||||
| aWide confidence interval; effect size includes null. bUnclear risk of bias for two studies for allocation and blinding of assessors. cUnclear risk of bias for three studies for allocation and blinding of assessors. dUnclear risk of bias for one study for allocation and blinding of assessors. | ||||||
| Study ID | Dates | Recruitment/Randomisation unit | Follow‐up | Length SME (educator) | RAN, n/WD, n | Age*, years/ % male | % current smokers | FEV1 % pred* INT‐CONT | QoL INT‐CONT |
| Not known | Consortium practices, New Zealand/participants | 12 months | Single interview, length not stated (respiratory nurse) | 96/26 | 70/51 | n/a | 35‐34 | 57‐51 | |
| 7/2002‐ 12/2003 | 2 groups of practices, New Zealand/practice | 12 months | 1 hour (practice nurse or respiratory educator) | 159/9 | 71/59 | 28 | 55‐53 | 43‐37 | |
| Rootmensen 2008 (all participants) | Not known | 1 hospital pulmonary outpatient clinic, Netherlands/ participants | 6 months | 45 minutes (pulmonary nurse) | 157 (111 COPD)/17 | 60/55 | 12 | 57‐64 | n/a |
| 07/2004‐ 07/2008 | Centralised electronic medical record database/participants | 12 months | 1 to 1.5‐hour group educational session (case manager) | 743/84 | 70/98 | 22 | 36.1‐38.1 | n/a | |
| 12/2008‐ 12/2010 | 8 regional hospitals and 5 general practices/participants (stratified by gender and centre) | 6 months | Single interview, length not stated (nurse case manager). | 233/41 | 66/57 | 29 | 56.7‐56.5 | n/a | |
| 1993‐ 07/1994 | 12 practices, 22 GPs, New Zealand/participants | 6 months | Single interview, length not stated (practice nurse) | 69/13 | 68/65 | 28 | 37‐36 | 43‐39 | |
| 2002‐2003 | 54 GPs, 31 practices, Australia/practice | 12 months | 1 hour (respiratory research nurse) | 139/27 | 70/76 | 42 | 46‐44 | 47‐47 | |
| *: mean; AP: action plan; COPD: chronic obstructive pulmonary disease; FEV1: forced expiratory volume in one second; GP: general practitioner; INT‐CONT: intervention group‐control group; QoL: % impairment quality of life 0‐100; RAN: randomisation; SME: self‐management education; WD: withdrawal or death. | |||||||||
| Individualised AP | Standard written AP | Support for AP during study period | SME (individual/group) | Prescription /supply OCS | Prescription /supply ABS | Written COPD educational component | Comparison | |
| Written | 3‐Monthly visit regarding use of AP | Individual interview with respiratory nurse, length not stated, individualised action plan according to current treatment and symptoms | All had 7‐day supply | All had 7‐day supply | No | Usual care by own GP | ||
| Yes | No | Individual session by practice nurse or respiratory educator in association with GP 1 hour, covering major points of COPD self‐management plan, and use of validated sputum colour charts | Prescription | Prescription | Educational package | Non‐standard education on COPD according to practice standards | ||
| Written | Monthly phone call from nurse | Group 1‐1.5 hours, individualised action plan with respiratory nurse | Yes | Prescription | Usual care + 1‐page summary of principles of COPD care according to published guidelines. No AP | |||
| Oral | No | Individual protocol‐based educational session covering disease, medications, vaccination, smoking cessation and exacerbation management, 45 minutes in length | Oral medication provided to some, % unknown | Oral medication provided to some, % unknown | No | Usual care | ||
| Written | Standardised phone calls at 1 and 4 months | Individualised action plan education, length of session not stated | 2%' | 22% | ✓ COPD information | Usual care ‐ pharmacological and non‐pharmacological care according to most recent evidence‐based guidelines, specifically AP denied. All included participants seen by respiratory nurse, who systematically checked and discussed aspects of COPD care, including vaccination, optimisation of medication, inhalation techniques, exercise, nutritional aspects, smoking (cessation) and exacerbation management. | ||
| Yes | No | Individual session education about use of the action plan with COPD booklet by a senior respiratory outreach nurse; length not stated | Prescription | Prescription | ✓ Guide to living positively with COPD | Usual care by GP, specifically denied access to AP and booklet | ||
| Written | No | Individual educational session with respiratory nurse, covering COPD, smoking cessation, immunisation, nutrition, exercise, sputum clearance, breathing, medication, inhaler use. Individualised action plan developed with GP input. Length not known | 2% | 22% | COPD information booklet | Usual care, COPD information booklet and individual educational session with nurse, but no AP | ||
| ABS: antibiotics; AP: action plan; COPD: chronic obstructive pulmonary disease; GP: general practitioner; OCS: oral corticosteroids; SME: self‐management education. | ||||||||
| Outcome | SF‐36 domain | Mean difference | 95% CI |
| Physical function | 0.30 | ‐7.13 to 7.73 | |
| Role limitation | 9.00 | ‐8.07 to 26.07 | |
| Bodily pain | 18.50 | 6.14 to 30.86 | |
| General health | 2.60 | ‐3.71 to 8.91 | |
| Vitality | 1.60 | ‐4.73 to 7.93 | |
| Social function | 5.30 | ‐4.68 to 15.28 | |
| Role limitation | 7.50 | ‐8.56 to 23.56 | |
| Mental health | 6.30 | 0.64 to 11.96 |
| Outcome | Domain | Follow‐up: months | MD | 95% CI | n |
| Depression | 12 | ‐0.25 | ‐1.14 to 0.64 | 154 | |
| Depression | 6 | 0.10 | ‐0.73 to 0.93 | 183 | |
| Anxiety | 12 | 0.14 | ‐1.38 to 1.66 | 154 | |
| Anxiety | 6 | 0.00 | ‐0.83 to 0.83 | 183 |
| Outcome | Study | Item | Direction improvement | Months | MD | 95% CI | n |
| Self‐management knowledge when well | + | 12 | 1.10 | 0.46 to 1.74 | 154 | ||
| Self‐management actions when well | + | 12 | 0.50 | ‐0.24 to 1.24 | 154 | ||
| Self‐management knowledge early exacerbation | + | 12 | 1.80 | 0.75 to 2.85 | 154 | ||
| Self‐management actions early exacerbation | + | 12 | 2.30 | 0.96 to 3.64 | 154 | ||
| Self‐management knowledge severe exacerbation | + | 12 | 2.50 | 0.94 to 4.06 | 154 | ||
| Self‐management action severe exacerbation | + | 12 | 1.50 | 0.47 to 2.53 | 154 | ||
| Self‐management exacerbation actions | + | 6 | ‐5.10 | ‐15.26 to 5.06 | 90 | ||
| Self‐efficacy for exacerbation recognition | ‐ | 6 | ‐0.70 | ‐0.98 to ‐0.42 | 183 | ||
| Self‐efficacy for exacerbation prevention/action | ‐ | 6 | ‐0.90 | ‐1.18 to ‐0.62 | 183 |
| Outcome or subgroup title | No. of studies | No. of participants | Statistical method | Effect size |
| 1 Hospitalizations for COPD /100 patient years Show forest plot | 1 | 743 | Rate Ratio (Fixed, 95% CI) | 0.69 [0.47, 1.01] |
| 1.1 Action Plan +phone follow up | 1 | 743 | Rate Ratio (Fixed, 95% CI) | 0.69 [0.47, 1.01] |
| 2 At least 1 hospital admission (12 months) Show forest plot | 2 | 897 | Odds Ratio (M‐H, Fixed, 95% CI) | 0.69 [0.49, 0.97] |
| 2.1 Action Plan | 1 | 154 | Odds Ratio (M‐H, Fixed, 95% CI) | 0.97 [0.31, 3.03] |
| 2.2 Action Plan + Phonecall Follow‐up | 1 | 743 | Odds Ratio (M‐H, Fixed, 95% CI) | 0.66 [0.46, 0.95] |
| 3 at least 1 Hospital Admission (6 months) Show forest plot | 1 | 227 | Odds Ratio (M‐H, Fixed, 95% CI) | 0.83 [0.30, 2.31] |
| 3.1 Action Plan with Phone Call Follow‐up | 1 | 227 | Odds Ratio (M‐H, Fixed, 95% CI) | 0.83 [0.30, 2.31] |
| 4 Hospital admission (12 months) Show forest plot | 2 | 205 | Mean Difference (IV, Fixed, 95% CI) | 0.23 [‐0.03, 0.49] |
| 4.1 Action Plan | 2 | 205 | Mean Difference (IV, Fixed, 95% CI) | 0.23 [‐0.03, 0.49] |
| 5 Hospital Admission for COPD (6 months) Show forest plot | 1 | 227 | Mean Difference (IV, Fixed, 95% CI) | 0.0 [‐0.08, 0.08] |
| 5.1 Action Plan with Phone Call Follow‐up | 1 | 227 | Mean Difference (IV, Fixed, 95% CI) | 0.0 [‐0.08, 0.08] |
| 6 Hospitalizations & emergency visits for COPD/100 patient years Show forest plot | 1 | 743 | Rate Ratio (Fixed, 95% CI) | 0.59 [0.44, 0.79] |
| 6.1 Action Plan +phone follow up | 1 | 743 | Rate Ratio (Fixed, 95% CI) | 0.59 [0.44, 0.79] |
| 7 At Least 1 Hospital or Emergency Department Visit for COPD Show forest plot | 1 | 743 | Odds Ratio (M‐H, Fixed, 95% CI) | 0.59 [0.43, 0.80] |
| 7.1 Action Plan with Phone Call Follow‐up | 1 | 743 | Odds Ratio (M‐H, Fixed, 95% CI) | 0.59 [0.43, 0.80] |
| 8 Emergency department visits for COPD /100 patient years Show forest plot | 1 | 743 | Rate Ratio (Fixed, 95% CI) | 0.49 [0.33, 0.73] |
| 8.1 Action Plan +phone follow up | 1 | 743 | Rate Ratio (Fixed, 95% CI) | 0.49 [0.33, 0.73] |
| 9 Emergency department visit for COPD (12 months) Show forest plot | 2 | 201 | Mean Difference (IV, Random, 95% CI) | 0.37 [‐0.50, 1.24] |
| 9.1 Action Plan | 2 | 201 | Mean Difference (IV, Random, 95% CI) | 0.37 [‐0.50, 1.24] |
| 10 At least 1 emergency department visit (12 months) Show forest plot | 2 | 897 | Odds Ratio (M‐H, Fixed, 95% CI) | 0.55 [0.38, 0.78] |
| 10.1 Action Plan | 1 | 154 | Odds Ratio (M‐H, Fixed, 95% CI) | 0.64 [0.25, 1.66] |
| 10.2 Action Plan + Phone Call Follow‐up | 1 | 743 | Odds Ratio (M‐H, Fixed, 95% CI) | 0.53 [0.36, 0.78] |
| 11 Emergency Department Visits for COPD (6 months) Show forest plot | 1 | 227 | Mean Difference (IV, Fixed, 95% CI) | 0.0 [‐0.09, 0.09] |
| 11.1 Action Plan with Phone Call Follow‐up | 1 | 227 | Mean Difference (IV, Fixed, 95% CI) | 0.0 [‐0.09, 0.09] |
| 12 GP visits/phone contacts for COPD (all or urgent) Show forest plot | 3 | Mean Difference (IV, Fixed, 95% CI) | Subtotals only | |
| 12.1 Action Plan (6 months) | 1 | 56 | Mean Difference (IV, Fixed, 95% CI) | 1.0 [‐0.57, 2.57] |
| 12.2 Action Plan (12 months) | 2 | 200 | Mean Difference (IV, Fixed, 95% CI) | 0.23 [‐1.02, 1.47] |
| 13 GP visits/phone contacts (total/all non‐COPD) (12 months) Show forest plot | 2 | 200 | Mean Difference (IV, Fixed, 95% CI) | 1.25 [‐1.54, 4.03] |
| 13.1 Action Plan | 2 | 200 | Mean Difference (IV, Fixed, 95% CI) | 1.25 [‐1.54, 4.03] |
| 14 Unscheduled Physician Visits (6 months) Show forest plot | 1 | 227 | Mean Difference (IV, Fixed, 95% CI) | 0.0 [‐0.36, 0.36] |
| 14.1 Action Plan with Phonecall Follow‐up | 1 | 227 | Mean Difference (IV, Fixed, 95% CI) | 0.0 [‐0.36, 0.36] |
| 15 Ambulance calls (total) Show forest plot | 1 | 89 | Mean Difference (IV, Fixed, 95% CI) | 1.70 [0.17, 3.23] |
| 15.1 Action Plan | 1 | 89 | Mean Difference (IV, Fixed, 95% CI) | 1.70 [0.17, 3.23] |
| 16 Total Hospital Days (12 months) Show forest plot | 1 | 743 | Mean Difference (IV, Fixed, 95% CI) | ‐1.10 [0.00, ‐0.20] |
| 16.1 Action Plan + Phone Call Folow‐up | 1 | 743 | Mean Difference (IV, Fixed, 95% CI) | ‐1.10 [0.00, ‐0.20] |
| 17 Total ICU Days (12 months) Show forest plot | 1 | 743 | Mean Difference (IV, Fixed, 95% CI) | ‐0.30 [‐0.60, ‐0.00] |
| 17.1 Action Plan + Phone Call Folow‐up | 1 | 743 | Mean Difference (IV, Fixed, 95% CI) | ‐0.30 [‐0.60, ‐0.00] |
| 18 Mortality (all cause) 12 months Show forest plot | 4 | 1134 | Peto Odds Ratio (Peto, Fixed, 95% CI) | 0.88 [0.59, 1.31] |
| 18.1 Action Plan | 3 | 391 | Peto Odds Ratio (Peto, Fixed, 95% CI) | 1.66 [0.73, 3.79] |
| 18.2 Action Plan with Phone call follow up | 1 | 743 | Peto Odds Ratio (Peto, Fixed, 95% CI) | 0.72 [0.46, 1.14] |
| 19 Mortality (all cause) per 100 Patient‐Years (12 months) Show forest plot | 1 | 743 | Mean Difference (IV, Fixed, 95% CI) | ‐3.70 [‐8.86, 1.46] |
| 19.1 Action Plan with Phone Call Follow‐up | 1 | 743 | Mean Difference (IV, Fixed, 95% CI) | ‐3.70 [‐8.86, 1.46] |
| 20 Mortality (all cause) 6 months Show forest plot | 1 | 229 | Peto Odds Ratio (Peto, Fixed, 95% CI) | 1.06 [0.15, 7.66] |
| 20.1 Action Plan with Phone Call Follow‐up | 1 | 229 | Peto Odds Ratio (Peto, Fixed, 95% CI) | 1.06 [0.15, 7.66] |
| 21 At least 1 course oral steroids for exacerbation Show forest plot | 2 | Odds Ratio (M‐H, Fixed, 95% CI) | Subtotals only | |
| 21.1 Action Plan (6 months) | 1 | 56 | Odds Ratio (M‐H, Fixed, 95% CI) | 6.58 [1.29, 33.62] |
| 21.2 Action Plan (12 months) | 1 | 154 | Odds Ratio (M‐H, Fixed, 95% CI) | 1.27 [0.34, 4.69] |
| 22 Courses of oral corticosteroids (12 months) Show forest plot | 2 | 200 | Mean Difference (IV, Fixed, 95% CI) | 0.74 [0.12, 1.35] |
| 22.1 Action Plan | 2 | 200 | Mean Difference (IV, Fixed, 95% CI) | 0.74 [0.12, 1.35] |
| 23 Courses of Corticosteroids (6 months) Show forest plot | 1 | 227 | Mean Difference (IV, Fixed, 95% CI) | 0.0 [‐0.23, 0.23] |
| 23.1 Action Plan with Phone Call Follow‐up | 1 | 227 | Mean Difference (IV, Fixed, 95% CI) | 0.0 [‐0.23, 0.23] |
| 24 Days on corticosteroids (6 months) Show forest plot | 1 | 56 | Mean Difference (IV, Fixed, 95% CI) | 6.0 [‐5.53, 17.53] |
| 24.1 Action Plan | 1 | 56 | Mean Difference (IV, Fixed, 95% CI) | 6.0 [‐5.53, 17.53] |
| 25 Prednisolone mg (12 months) Show forest plot | 1 | 743 | Mean Difference (IV, Fixed, 95% CI) | 779.0 [533.23, 1024.77] |
| 25.1 Action Plan with Phone Call Follow‐up | 1 | 743 | Mean Difference (IV, Fixed, 95% CI) | 779.0 [533.23, 1024.77] |
| 26 At least 1 course antibiotics for exacerbation Show forest plot | 3 | Peto Odds Ratio (Peto, Fixed, 95% CI) | Subtotals only | |
| 26.1 Action Plan (6 months) | 1 | 56 | Peto Odds Ratio (Peto, Fixed, 95% CI) | 6.51 [2.02, 21.05] |
| 26.2 Action Plan (12 months) | 2 | 293 | Peto Odds Ratio (Peto, Fixed, 95% CI) | 1.65 [1.01, 2.69] |
| 27 Courses of antibiotics (12 months) Show forest plot | 3 | 943 | Mean Difference (IV, Fixed, 95% CI) | 2.26 [1.82, 2.70] |
| 27.1 Action Plan | 2 | 200 | Mean Difference (IV, Fixed, 95% CI) | 0.78 [‐0.24, 1.79] |
| 27.2 Action Plan with Phone Call Follow‐up | 1 | 743 | Mean Difference (IV, Fixed, 95% CI) | 2.6 [2.12, 3.08] |
| 28 Courses of Antibiotics (6 months) Show forest plot | 1 | 227 | Mean Difference (IV, Fixed, 95% CI) | 0.0 [‐0.26, 0.26] |
| 28.1 Action Plan with Phone Call Follow‐up | 1 | 227 | Mean Difference (IV, Fixed, 95% CI) | 0.0 [‐0.26, 0.26] |
| 29 Days on antibiotics (6 months) Show forest plot | 1 | 56 | Mean Difference (IV, Fixed, 95% CI) | 6.0 [1.40, 10.60] |
| 29.1 Action Plan | 1 | 56 | Mean Difference (IV, Fixed, 95% CI) | 6.0 [1.40, 10.60] |
| 30 SGRQ overall score (12 months) Show forest plot | 3 | 1009 | Mean Difference (IV, Fixed, 95% CI) | ‐2.79 [‐4.77, ‐0.82] |
| 30.1 Action Plan | 2 | 266 | Mean Difference (IV, Fixed, 95% CI) | 0.32 [‐2.70, 3.34] |
| 30.2 Action Plan + Phone Call Follow‐up | 1 | 743 | Mean Difference (IV, Fixed, 95% CI) | ‐5.10 [‐7.70, ‐2.50] |
| 31 SGRQ overall score (6 months) Show forest plot | 4 | 452 | Mean Difference (IV, Fixed, 95% CI) | ‐0.83 [‐2.93, 1.27] |
| 31.1 Action Plan | 3 | 269 | Mean Difference (IV, Fixed, 95% CI) | ‐0.33 [‐3.03, 2.37] |
| 31.2 Action Plan + Phone Call Follow‐up | 1 | 183 | Mean Difference (IV, Fixed, 95% CI) | ‐1.6 [‐4.94, 1.74] |
| 32 SGRQ symptoms (12 months) Show forest plot | 2 | 266 | Mean Difference (IV, Fixed, 95% CI) | ‐1.84 [‐7.14, 3.47] |
| 32.1 Action Plan | 2 | 266 | Mean Difference (IV, Fixed, 95% CI) | ‐1.84 [‐7.14, 3.47] |
| 33 SGRQ symptoms (6 months) Show forest plot | 4 | 448 | Mean Difference (IV, Fixed, 95% CI) | ‐2.55 [‐6.92, 1.83] |
| 33.1 Action Plan | 3 | 265 | Mean Difference (IV, Fixed, 95% CI) | ‐2.07 [‐8.34, 4.20] |
| 33.2 Action Plan + Phone Call Follow‐up (change from baseline) | 1 | 183 | Mean Difference (IV, Fixed, 95% CI) | ‐3.0 [‐9.10, 3.10] |
| 34 SGRQ activity limitation (12 months) Show forest plot | 2 | 266 | Mean Difference (IV, Fixed, 95% CI) | 2.87 [‐1.26, 7.00] |
| 34.1 Action Plan | 2 | 266 | Mean Difference (IV, Fixed, 95% CI) | 2.87 [‐1.26, 7.00] |
| 35 SGRQ activity limitation (6 months) Show forest plot | 4 | 452 | Mean Difference (IV, Fixed, 95% CI) | 0.88 [‐1.90, 3.67] |
| 35.1 Action Plan | 3 | 269 | Mean Difference (IV, Fixed, 95% CI) | 1.41 [‐1.99, 4.82] |
| 35.2 Action Plan + Phone Call Follow‐up | 1 | 183 | Mean Difference (IV, Fixed, 95% CI) | ‐0.20 [‐5.05, 4.65] |
| 36 SGRQ impact (12 months) Show forest plot | 2 | 266 | Mean Difference (IV, Fixed, 95% CI) | ‐1.04 [‐4.51, 2.43] |
| 36.1 Action Plan | 2 | 266 | Mean Difference (IV, Fixed, 95% CI) | ‐1.04 [‐4.51, 2.43] |
| 37 SGRQ impact score (6 months) Show forest plot | 4 | 452 | Mean Difference (IV, Fixed, 95% CI) | ‐1.26 [‐3.47, 0.95] |
| 37.1 Action Plan | 3 | 269 | Mean Difference (IV, Fixed, 95% CI) | ‐1.53 [‐4.45, 1.39] |
| 37.2 Action Plan + Phone Call Follow‐up | 1 | 183 | Mean Difference (IV, Fixed, 95% CI) | ‐0.9 [‐4.27, 2.47] |
| 38 SF36 physical function (6 months) Show forest plot | 1 | Mean Difference (IV, Fixed, 95% CI) | Subtotals only | |
| 38.1 Action Plan | 1 | 90 | Mean Difference (IV, Fixed, 95% CI) | 0.30 [‐7.13, 7.73] |
| 39 SF36 role limitation physical (6 months) Show forest plot | 1 | Mean Difference (IV, Fixed, 95% CI) | Subtotals only | |
| 39.1 Action Plan | 1 | 90 | Mean Difference (IV, Fixed, 95% CI) | 9.0 [‐8.07, 26.07] |
| 40 SF36 bodily pain (6 months) Show forest plot | 1 | Mean Difference (IV, Fixed, 95% CI) | Subtotals only | |
| 40.1 Action Plan | 1 | 90 | Mean Difference (IV, Fixed, 95% CI) | 18.5 [6.14, 30.86] |
| 41 SF36 general health (6 months) Show forest plot | 1 | Mean Difference (IV, Fixed, 95% CI) | Subtotals only | |
| 41.1 Action Plan | 1 | 90 | Mean Difference (IV, Fixed, 95% CI) | 2.60 [‐3.71, 8.91] |
| 42 SF36 vitality (6 months) Show forest plot | 1 | Mean Difference (IV, Fixed, 95% CI) | Subtotals only | |
| 42.1 Action Plan | 1 | 90 | Mean Difference (IV, Fixed, 95% CI) | 1.6 [‐4.73, 7.93] |
| 43 SF36 mental health (6 months) Show forest plot | 1 | Mean Difference (IV, Fixed, 95% CI) | Subtotals only | |
| 43.1 Action Plan | 1 | 90 | Mean Difference (IV, Fixed, 95% CI) | 6.3 [0.64, 11.96] |
| 44 SF36 role limitation emotional (6 months) Show forest plot | 1 | Mean Difference (IV, Fixed, 95% CI) | Subtotals only | |
| 44.1 Action Plan | 1 | 90 | Mean Difference (IV, Fixed, 95% CI) | 7.5 [‐8.56, 23.56] |
| 45 SF36 social function (6 months) Show forest plot | 1 | Mean Difference (IV, Fixed, 95% CI) | Subtotals only | |
| 45.1 Action Plan | 1 | 90 | Mean Difference (IV, Fixed, 95% CI) | 5.30 [‐4.68, 15.28] |
| 46 HADS ‐ depression score (12 months) Show forest plot | 1 | Mean Difference (IV, Fixed, 95% CI) | Subtotals only | |
| 46.1 Action Plan | 1 | 154 | Mean Difference (IV, Fixed, 95% CI) | ‐0.25 [‐1.14, 0.64] |
| 47 HADS ‐ depression score (6 months) Show forest plot | 1 | Mean Difference (IV, Fixed, 95% CI) | Subtotals only | |
| 47.1 Action Plan + Phone Call Folow‐up | 1 | 183 | Mean Difference (IV, Fixed, 95% CI) | 0.10 [‐0.73, 0.93] |
| 48 HADS ‐ anxiety score (12 months) Show forest plot | 1 | Mean Difference (IV, Fixed, 95% CI) | Subtotals only | |
| 48.1 Action Plan | 1 | 154 | Mean Difference (IV, Fixed, 95% CI) | 0.14 [‐1.38, 1.66] |
| 49 HADS ‐ anxiety score (6 months) Show forest plot | 1 | Mean Difference (IV, Fixed, 95% CI) | Subtotals only | |
| 49.1 Action Plan + Phone Call Follow‐up (change from baseline) | 1 | 183 | Mean Difference (IV, Fixed, 95% CI) | 0.0 [‐0.83, 0.83] |
| 50 Exacerbation knowledge when well (12 months) Show forest plot | 1 | Mean Difference (Fixed, 95% CI) | Subtotals only | |
| 50.1 Action Plan | 1 | 154 | Mean Difference (Fixed, 95% CI) | 1.1 [0.46, 1.74] |
| 51 Exacerbation actions when well (12 months) Show forest plot | 1 | Mean Difference (Fixed, 95% CI) | Subtotals only | |
| 51.1 Action Plan | 1 | 154 | Mean Difference (Fixed, 95% CI) | 0.5 [‐0.24, 1.24] |
| 52 Early exacerbation knowledge (12 months) Show forest plot | 1 | Mean Difference (Fixed, 95% CI) | Subtotals only | |
| 52.1 Action Plan | 1 | 154 | Mean Difference (Fixed, 95% CI) | 1.80 [0.75, 2.85] |
| 53 Early exacerbation actions (12 months) Show forest plot | 1 | Mean Difference (Fixed, 95% CI) | Subtotals only | |
| 53.1 Action Plan | 1 | 154 | Mean Difference (Fixed, 95% CI) | 2.3 [0.96, 3.64] |
| 54 Severe exacerbation knowledge (12 months) Show forest plot | 1 | Mean Difference (Fixed, 95% CI) | Subtotals only | |
| 54.1 Action Plan | 1 | 154 | Mean Difference (Fixed, 95% CI) | 2.5 [0.94, 4.06] |
| 55 Severe exacerbation actions (12 months) Show forest plot | 1 | Mean Difference (Fixed, 95% CI) | Subtotals only | |
| 55.1 Action Plan | 1 | 154 | Mean Difference (Fixed, 95% CI) | 1.5 [0.47, 2.53] |
| 56 Self‐management exacerbation actions (6 months) Show forest plot | 1 | Mean Difference (IV, Fixed, 95% CI) | Subtotals only | |
| 56.1 Action Plan | 1 | 90 | Mean Difference (IV, Fixed, 95% CI) | ‐5.1 [‐15.26, 5.06] |
| 57 Self‐efficacy for Exacerbation Recognition (6 months) Show forest plot | 1 | Mean Difference (IV, Fixed, 95% CI) | Subtotals only | |
| 57.1 Action Plan + Phone Call Follow‐up | 1 | 183 | Mean Difference (IV, Fixed, 95% CI) | ‐0.70 [‐0.98, ‐0.42] |
| 58 Self‐efficacy for Exacerbation Prevention/Action (6 months) Show forest plot | 1 | Mean Difference (IV, Fixed, 95% CI) | Subtotals only | |
| 58.1 Action Plan + Phone Call Follow‐up | 1 | 183 | Mean Difference (IV, Fixed, 95% CI) | ‐0.90 [‐1.18, ‐0.62] |
| 59 FEV1 % predicted Show forest plot | 2 | Mean Difference (IV, Fixed, 95% CI) | Subtotals only | |
| 59.1 6 months | 2 | 179 | Mean Difference (IV, Fixed, 95% CI) | 1.83 [‐1.05, 4.71] |
| 59.2 12 months | 1 | 112 | Mean Difference (IV, Fixed, 95% CI) | 2.00 [‐1.89, 5.89] |
| 60 Cost HADM per patient US$ (12 months) Show forest plot | 1 | Mean Difference (IV, Fixed, 95% CI) | Subtotals only | |
| 60.1 Action Plan with Phone Call Folow‐up | 1 | 743 | Mean Difference (IV, Fixed, 95% CI) | ‐1117.0 [‐1754.50, ‐479.50] |
| 61 Cost EDV Per Patient US$ (12 months) Show forest plot | 1 | Mean Difference (IV, Fixed, 95% CI) | Subtotals only | |
| 61.1 Action Plan with Phone Call Follow‐up | 1 | 743 | Mean Difference (IV, Fixed, 95% CI) | ‐141.0 [‐234.31, ‐47.69] |
| 62 Cost Pulmonary Drug Prescriptions per Patient US$ (12 months) Show forest plot | 1 | Mean Difference (IV, Fixed, 95% CI) | Subtotals only | |
| 62.1 Action Plan with Phone Call Follow‐up | 1 | 743 | Mean Difference (IV, Fixed, 95% CI) | 15.00 [‐6.32, 36.32] |