Masaje para promover la salud mental y física en niños menores de seis meses con un desarrollo típico
References
Referencias de los estudios incluidos en esta revisión
Referencias de los estudios excluidos de esta revisión
Referencias adicionales
Referencias de otras versiones publicadas de esta revisión
Characteristics of studies
Characteristics of included studies [ordered by study ID]
Jump to:
| Methods | Design: randomised controlled trial. Setting: community clinic, India. | |
| Participants | 125 healthy infants, n = 25 in each group, 6 weeks +/‐ 1 week of age. | |
| Interventions | Massage infants received (i) herbal oil, (ii) sesame oil, (iii) mustard oil, or (iv) mineral oil for massage daily over four weeks versus a 'no treatment' control group. Massage provider: mothers trained by researchers. Duration of intervention: daily for 4 weeks for 10 minutes each session (short duration of intervention). | |
| Outcomes | Anthropometeric measurements: microhaematocrit; serum proteins, creatinine and creatine phosphokinase; | |
| Notes | Funder not stated. | |
| Risk of bias | ||
| Bias | Authors' judgement | Support for judgement |
| Random sequence generation (selection bias) | Low risk | Random number table divided into 5 groups, n = 25 in each group. |
| Allocation concealment (selection bias) | High risk | Inadequate. |
| Incomplete outcome data (attrition bias) | Low risk | None dropped out. Attendance strictly regulated with mothers attending weekly to have their massage techniques monitored and to return empty oil bottles before collecting their next week's supply of specific oils. |
| Selective reporting (reporting bias) | Low risk | All pre‐specified outcomes reported. |
| Blinding of participants and personnel (performance bias) | High risk | Not possible due to nature of intervention. |
| Blinding of outcome assessment (detection bias) | High risk | Limited to supplying oil in different opaque bottles on different days. Key to oils was opened only at the end of the study. |
| Methods | Design: randomised controlled trial. Setting: community. Public healthcare clinics and Dept of Pediatrics of Yakutiye Research Hospital, Turkey. | |
| Participants | Sample sizes: 175 infants with diagnosed colic (Wessel) randomised into 35 per group of massage, versus sucrose solution, versus herbal tea versus hydrolysed formula versus control. Ages: intervention 2.29 months SD 0.75; Control 2.28 months SD 0.61. Gender: intervention 46% boys; control 34% boys. Massage provider: mothers trained by researchers. | |
| Interventions | Mothers were trained in massage technique and given brochures with written illustrated instructions. Massage ("chiropractic spinal manipulation"), twice a day for 25 minutes duration during symptoms of colic for one week (short duration of intervention). Control group: no treatment. Massage provider: mothers. | |
| Outcomes | Parent report using daily structured diary, onset of crying time, when the intervention was given, cessation of crying time, any side effects. Crying was quantified by length of crying in hours per day for one week before and one week during the intervention. Timing: outcomes assessed after one week of intervention. | |
| Notes | Funder: “we did not receive any financial support for this study” p. 1760 | |
| Risk of bias | ||
| Bias | Authors' judgement | Support for judgement |
| Random sequence generation (selection bias) | Unclear risk | Described as randomised and controlled, but no details given. No further information available from investigator. |
| Allocation concealment (selection bias) | Unclear risk | Unclear, no details given. |
| Incomplete outcome data (attrition bias) | Low risk | Dropouts and losses to follow‐up not stated but intervention was only one week. Results for 35/35 reported for each of the 4 groups (Table 3 p. 1759). |
| Selective reporting (reporting bias) | Low risk | Crying time as the only outcome reported. |
| Blinding of participants and personnel (performance bias) | High risk | Quote “because of the design of the study, blinding was not possible”. |
| Blinding of outcome assessment (detection bias) | High risk | No details given. Comment: blinding not possible and the same paediatrician and nurse were in contact with all study parents. Comment: parent self report (diary) of crying time. |
| Methods | Design: randomised controlled trial. Setting: primary care (post‐natally in hospital then in community). | |
| Participants | Sample sizes: n = 100; intervention n = 50; control n = 50. Ages: one day after birth then daily until 42 days. Gender: in total sample 54% male, 46% female. | |
| Interventions | Duration, dose, type. 15 min once daily for 42 days versus routine (no massage) care (medium‐term duration of intervention). Massage provider: mothers. | |
| Outcomes | Types of outcome: head circumference, length, weight, sleep duration and crying time. Timing of assessment: at 3 days and 42 days of age. | |
| Notes | Funder: not stated. | |
| Risk of bias | ||
| Bias | Authors' judgement | Support for judgement |
| Random sequence generation (selection bias) | High risk | Described as ‘randomly divided’ but no details given. Comment: judged as high risk, no further details available from trial investigator. |
| Allocation concealment (selection bias) | High risk | No apparent attempt to conceal allocation, no details given. Comment: judged as high risk, no further details available from trial investigator. |
| Incomplete outcome data (attrition bias) | High risk | 100/100 results reported. No dropouts reported. Dropouts or losses to follow‐up not addressed in the study report. |
| Selective reporting (reporting bias) | Low risk | All pre‐specified outcomes reported. |
| Blinding of participants and personnel (performance bias) | High risk | Not possible due to nature of intervention. |
| Blinding of outcome assessment (detection bias) | Unclear risk | Methods (article keywords) describe a ‘blind’ study but it is unclear who was blinded and how. |
| Methods | Design: randomised controlled trial. Setting: hospital (research clinic), USA. | |
| Participants | 56 4‐month‐old infants recruited, n = 20 massage, n = 12 no stimulation control group. | |
| Interventions | Massaged infants were given either as single session of 8 minutes of massage, play, versus a no stimulation control group prior to an audiovisual habituation task (brief duration of intervention). Massage provider: investigator. | |
| Outcomes | Average number of seconds of looking on two post habituation trials (PH) and two test trials (T) to yield a post habituation score and a test score. | |
| Notes | Funder: Johnson and Johnson. | |
| Risk of bias | ||
| Bias | Authors' judgement | Support for judgement |
| Random sequence generation (selection bias) | Unclear risk | No details given. |
| Allocation concealment (selection bias) | Unclear risk | Unclear. |
| Incomplete outcome data (attrition bias) | Unclear risk | Unclear. Unclear which groups dropouts came from ( p. 30 "20 further infants were excluded from the study due to excessive crying or fussing n = 12, falling asleep n = 3; experimenter error n = 4 and fatigue n = 1"). Results reported for n = 20 in the massage group, n = 24 in the control 'play' group, n = 12 no stimulation control group. |
| Selective reporting (reporting bias) | Low risk | All pre‐specified outcomes reported. |
| Blinding of participants and personnel (performance bias) | High risk | Not possible due to nature of intervention. |
| Blinding of outcome assessment (detection bias) | Unclear risk | Quote p. 31 "a second observer who was blind to the pre‐habituation treatment of the infants coded the visual fixations of 40% of the sample from the pre‐recorded videos". Comment: unclear if complete blinding was achieved. |
| Methods | Design: randomised controlled trial. Setting: unclear, China. | |
| Participants | 160 newborn infants (n = 80 massage, n = 80 control). | |
| Interventions | Massaged for 15 minutes twice daily over 42 days versus a 'routine care' control group (medium‐term duration of intervention). Massage provider: unclear. | |
| Outcomes | Weight, length and head circumference. | |
| Notes | Funder: unclear. | |
| Risk of bias | ||
| Bias | Authors' judgement | Support for judgement |
| Random sequence generation (selection bias) | High risk | Unclear. Described as randomised but no details given. Comment: judged as high risk, no further details available from trial investigator. |
| Allocation concealment (selection bias) | High risk | No apparent attempt to conceal allocation, no details given. Comment: judged as high risk, no further details available from trial investigator. |
| Incomplete outcome data (attrition bias) | High risk | No dropouts reported. Dropouts or losses to follow‐up not addressed in the study report. |
| Selective reporting (reporting bias) | High risk | Unclear, outcomes of interest not prespecified in this short report; no further details available from trial investigator. |
| Blinding of participants and personnel (performance bias) | High risk | Not blinded at all. |
| Blinding of outcome assessment (detection bias) | High risk | Not blinded at all. |
| Methods | Design: randomised controlled trial. Setting: community after training of parents to carry out massage, Canada. | |
| Participants | 111 first time parent‐infant dyads (newborns). | |
| Interventions | Group I: Massage (n = 31) Massage group: Massage provider: mothers trained by researchers. | |
| Outcomes | 1.Nursing Child Assessment Sleep Activity Record (NCASA) | |
| Notes | Funders: Canadian Nurses’ Foundation, the Alberta Foundation for Nursing Research, the University of Alberta, and the University of Calgary. | |
| Risk of bias | ||
| Bias | Authors' judgement | Support for judgement |
| Random sequence generation (selection bias) | Low risk | Described as randomised, used repeated measures design involving a randomised two‐way layout with treatment factors 'carrying' and 'massage' as two levels to ensure that every dyad had an equal chance of being assigned to one of four groups. |
| Allocation concealment (selection bias) | Low risk | p. 319 "Research associate, who was not involved with the subjects randomly assigned subjects to one of the four groups whenever a subject agreed to enter the study." |
| Incomplete outcome data (attrition bias) | Low risk | 94/111 were present at week 16. Reasons for dropout or loss to follow‐up given. From p. 321 "One infant was intolerant of the intervention (massage), 5 withdrew because they no longer met criteria as infants required hospital, 1 infant still born 4 left family issues 7 study too time consuming Dropouts occurred across all four study groups: |
| Selective reporting (reporting bias) | Low risk | All pre‐specified outcomes reported. |
| Blinding of participants and personnel (performance bias) | High risk | Not possible due to nature of intervention. |
| Blinding of outcome assessment (detection bias) | Low risk | Parents and outcome data collectors were kept apart to insure that observed differences occurred as a result of the treatment. |
| Methods | Design: randomised controlled trial. Setting: community after training of parents to carry out massage, Israel. | |
| Participants | 21 dyads of mothers and full term infants (n = 13 massage; n = 8 control). | |
| Interventions | Massage provider: mothers trained by researchers. Massage therapy was performed daily by the mother for 14 days versus a no treatment control group (short duration of intervention). | |
| Outcomes | 1. Circadian rhythmicity | |
| Notes | Funder: The Academic Research Funds and the Social Science Dean’s scholarships at Bar‐Ilan University. | |
| Risk of bias | ||
| Bias | Authors' judgement | Support for judgement |
| Random sequence generation (selection bias) | Unclear risk | Unclear. |
| Allocation concealment (selection bias) | Unclear risk | Unclear. |
| Incomplete outcome data (attrition bias) | Low risk | 52 mothers were asked to participate with their babies within 2‐3 days post partum. Of this group 50% (n = 26) agreed, 19.9% (n = 5) discontinued after first measurements. Reported a dropout rate of 20% with no significant differences between the two intervention and control groups; |
| Selective reporting (reporting bias) | Low risk | Measurements for sleep rest activity from the actigraph were quoted as mean movement scores using a graph but do not have SDs. Means and SDs later supplied by investigator. |
| Blinding of participants and personnel (performance bias) | High risk | Not possible due to nature of intervention. |
| Blinding of outcome assessment (detection bias) | Unclear risk | Unclear. Actigraph measurements and the 6‐sulphatoxyymelatonin secretions were analysed separately but does not clarify whether the assessors were blind to the participant group. |
| Methods | Design: quasi‐randomised controlled trial. Setting: community (daycare ‐ nursery school), USA. | |
| Participants | 40 full‐term 1 ‐ 3 month old infants, recruited if their adolescent mothers were diagnosed as depressed following delivery. n = 20 massage; n = 20 control. | |
| Interventions | Infants in the intervention group received massage by a researcher (complete face and body using mineral baby oil); the control group infants were rocked (by cradling in the arms of the researcher). Massage delivered for 15 mins a day 2 days a week over 6 weeks. Massage provider: researchers. | |
| Outcomes | 1.Sleep/wake behaviours (Thoman 1981). | |
| Notes | NIMH grants and Johnson and Johnson, Gerber Foundation. | |
| Risk of bias | ||
| Bias | Authors' judgement | Support for judgement |
| Random sequence generation (selection bias) | High risk | Quasi‐randomised, but no additional details of how infants were selected were provided. |
| Allocation concealment (selection bias) | Unclear risk | Unclear, no details given. |
| Incomplete outcome data (attrition bias) | Low risk | No dropout for 40 post‐natally depressed mother‐infant dyads because the infants were being cared for by teachers in a nursery school during the six‐week study (medium‐term duration of intervention). |
| Selective reporting (reporting bias) | Low risk | All pre‐specified outcomes reported. |
| Blinding of participants and personnel (performance bias) | High risk | Not possible due to nature of intervention. Researchers carried out the massage. |
| Blinding of outcome assessment (detection bias) | Unclear risk | Teachers and mother who recorded outcomes were unaware of therapy (mothers) or intent of study (teachers). Comment some attempt at blinding was made although it is implied that teacher knew which therapy was delivered. |
| Methods | Design: randomised controlled trial. Setting: community. Research clinic affiliated to Sun Yat‐sen University, China. | |
| Participants | Sample sizes: n = 180 intervention n = 90; control n = 90. Ages: from birth 0 months group, the 6 month group was excluded as they are outside our age inclusion criteria. Gender: not stated. | |
| Interventions | Motion training, including gross motion and fine motion, was performed on the basis of Johnson infant massage. A set of training programmes adapted to the age and development of infants was used (no details given). In the experimental group, the parents of the infants were trained to massage and motion training. All the parents were given manuals and VCD to learn the procedures. Massage and motion training was performed 1‐2 times every day, lasting for 15 minutes, and motion training for 5 minutes at each time, from birth to 6 months of age. From 6 months of age massage and motion training continued (massage 8 mins, motion training 12 mins). Motion training is included in the Johnson massage method (long duration of intervention). Control group received no intervention (details from trial investigator). Massage provider: trained parents. | |
| Outcomes | Weight (kg) at 0, 1, 6 and 12 months. Length (cm) at 0, 1, 6 and 12 months. (Also weight and length enhancement using comparisons from baseline to 6 months and 6 to 12 months). Developmental quotient (Gessell Developmental Schedule) at 1, 6 and 12 months. | |
| Notes | Funder: declared as 'none'. | |
| Risk of bias | ||
| Bias | Authors' judgement | Support for judgement |
| Random sequence generation (selection bias) | Low risk | Described as randomised p. 286 (by random numbers table, further information from trial investigator). |
| Allocation concealment (selection bias) | High risk | Not concealed (further information from trial investigator). |
| Incomplete outcome data (attrition bias) | High risk | From birth group: 54/90 at one year in the intervention group, 62/90 in the control group. It is unclear how many infants were lost to follow‐up at the 6 month (post‐intervention time point). Losses to follow‐up are reported at post‐intervention, but the reasons for loss to follow‐up are unclear (no details given, trial investigators contacted but don't know the reasons). |
| Selective reporting (reporting bias) | Low risk | Length, body weight and developmental quotient (Gessell DQ) pre‐specified as outcomes and reported. |
| Blinding of participants and personnel (performance bias) | High risk | Not possible due to nature of intervention. Mother in the intervention group knew their allocation, the mothers in the control group did not know the allocation (further information from trial investigator). |
| Blinding of outcome assessment (detection bias) | Unclear risk | Unclear if outcome assessors were blinded. |
| Methods | Design: quasi‐randomised controlled trial. Setting: community after training of parents to carry out massage (parenting class), USA. | |
| Participants | 57 mother‐infant dyads with babies under 9 months intervention n = 27; control n = 30 | |
| Interventions | Mothers trained in the use of infant massage in groups delivered over 45 to 60 minute sessions once a week over 4 weeks (participants encouraged to practice massage on their infants daily in between sessions), plus information about infant development (short duration of intervention). Control group received information about infant development only. | |
| Outcomes | 1. Attachment Q set scored as a continuous variable Massage provider: mothers trained by researchers. | |
| Notes | Funder: unclear. | |
| Risk of bias | ||
| Bias | Authors' judgement | Support for judgement |
| Random sequence generation (selection bias) | High risk | Quasi‐randomised. Used coin flip to assign the first infant and the remaining infants were alternatively allocated to the intervention or control group. |
| Allocation concealment (selection bias) | Unclear risk | Unclear. |
| Incomplete outcome data (attrition bias) | Unclear risk | 12/57 lost over 12 months with no forwarding information. 21 in final intervention group 24 in final control group 21% dropout rate; mothers from both groups who left the study were less educated and had younger infants than those remaining in the study, the groups were otherwise alike demographically. |
| Selective reporting (reporting bias) | Unclear risk | A ‘battery’ of questionnaires was given to all participants before the intervention plus demographic details – after the 4‐week period another ‘battery’ of questionnaire were given to all participants but these data are not part of this study page 45 (only data at 12 months is reported) |
| Blinding of participants and personnel (performance bias) | High risk | Not done due to nature of intervention. |
| Blinding of outcome assessment (detection bias) | High risk | No blinding of outcome assessors. |
| Methods | Design: randomised controlled trial. Setting: unclear, China. | |
| Participants | 400 newborn infants intervention n = 200; control n = 200. | |
| Interventions | Fifteen minutes of massage three times a day for 42 days plus additional method of kneading the back versus a 'no treatment' control group (medium‐term duration of intervention). Massage provider: unclear. | |
| Outcomes | Weight, length and head circumference. Additional measures included grasp of hands, stretch and crook of front arms etc. | |
| Notes | Funder: unclear | |
| Risk of bias | ||
| Bias | Authors' judgement | Support for judgement |
| Random sequence generation (selection bias) | High risk | No details given, no further details available from trial investigator. |
| Allocation concealment (selection bias) | High risk | No apparent attempt to conceal allocation, no details given. Comment: judged as high risk, no further details available from trial investigator. |
| Incomplete outcome data (attrition bias) | High risk | No dropouts reported. Dropouts or losses to follow‐up not addressed in the study report. |
| Selective reporting (reporting bias) | High risk | Unclear. No outcomes pre‐specified. Comment: judged as high risk, no further details available from trial investigator. |
| Blinding of participants and personnel (performance bias) | High risk | Not possible due to nature of intervention. |
| Blinding of outcome assessment (detection bias) | High risk | No details given. Comment: judged as high risk, no further details available from trial investigator. |
| Methods | Design: quasi‐randomised controlled trial. Setting: orphanage, Korea. | |
| Participants | 58 Korean orphaned infants, within 14 days of birth. Intervention n = 30, control n = 28. | |
| Interventions | In addition to receiving the routine orphanage care, infants in the experimental group received 15 min twice a day of auditory (female voice), tactile (massage), and visual (eye‐to‐eye contact) stimulation for 4 weeks, versus a 'usual orphanage care' control group (short duration of intervention). Massage provider: researchers/orphanage staff. | |
| Outcomes | Weight | |
| Notes | Also presents results for six‐month follow‐up. Funder: unclear. | |
| Risk of bias | ||
| Bias | Authors' judgement | Support for judgement |
| Random sequence generation (selection bias) | High risk | First infant assigned by flip of coin then alternately after that. Quasi‐randomised. |
| Allocation concealment (selection bias) | Unclear risk | Unclear. |
| Incomplete outcome data (attrition bias) | Unclear risk | At 6 months 13/58 infants had been lost to the trial because they were adopted (22%). The loss was evenly spread between the groups, impacting on the power of the study. |
| Selective reporting (reporting bias) | Low risk | All pre‐specified outcomes reported. |
| Blinding of participants and personnel (performance bias) | High risk | Not possible due to nature of intervention. |
| Blinding of outcome assessment (detection bias) | Unclear risk | Unclear, the outcome of "illness" was assessed by a nurse who was blind to the infant group assignments. It is unclear if the other outcomes were assessed blindly. Quote p. 431 "although precautions were taken to keep the orphanage staff blind to group assignment (staff members were out of the room during the intervention period), the staff (including the nurse who assessed infant illness) may have been aware of group assignment". |
| Methods | Design: randomised controlled trial and 24‐month follow‐up. Setting: two community hospitals in Southern California, USA. | |
| Participants | 81 primiparous mothers and newborn infants (3rd or 4th days after birth), data for 49 of original 81 infants reported at follow‐up. | |
| Interventions | 1. The unimodal stimulation group received infant massage (5‐7 minutes) once daily (n = 20). All interventions were given until the infants reached 3 months of life (medium‐term duration of intervention). Massage provider: mothers trained by researchers. | |
| Outcomes | Weight (g) Bayley Scales of Infant Development (BSID) Eyberg's Child Behavior Inventory Nursing Child Assessment Teaching Scales (NCATS) Revised Infant Temperament Questionnaire (RITQ) * high score worse At 24 months follow‐up: 1. Bayley Scales of Infant Development (BSID) | |
| Notes | Also presents results for eight‐month follow‐up. Funder: University of California. Follow‐up funder: University of California and Cuddle International. | |
| Risk of bias | ||
| Bias | Authors' judgement | Support for judgement |
| Random sequence generation (selection bias) | Unclear risk | Unclear: states 'randomly assigned'. |
| Allocation concealment (selection bias) | Unclear risk | Unclear. |
| Incomplete outcome data (attrition bias) | Unclear risk | Data for only 41 children at 4, 8 and 24 months representing an attrition rate of 39%, due to families moving out of the area. In the follow‐up study, data were shown at 4 and 8 months only for those 41 infants who had completed the study at 24 months (further information from study investigator). |
| Selective reporting (reporting bias) | Unclear risk | Although all 3 components of the Bayley scales of infant development were administered at 4 and 8 months of age, only findings related to MDI and PDI are presented. |
| Blinding of participants and personnel (performance bias) | High risk | Not possible due to nature of intervention. |
| Blinding of outcome assessment (detection bias) | Low risk | Independent assessors (nurses) who were blind to group assignment (page 72). |
| Methods | Design: randomised controlled trial. Setting: China, community (specialised massage clinic and at home). | |
| Participants | Sample sizes: n = 232; intervention n = 159; control n = 73. Ages: not stated, 0‐2 months. Gender: not stated. | |
| Interventions | Massage 2 ‐3 times daily for 15 mins for at least 3 months (medium‐term duration of intervention). Massage method by Johnson and Johnson. Carried out by parents who were first trained by doctors at a specialist massage centre. Telephone support and contact from doctors in first month. As touch group but without massage – treatment as usual. Massage provider: mothers trained by researchers. | |
| Outcomes | Primary outcome data (Means and SDs): Bayley MDI mental development index, Bayley PDI psychological development index, sleep habits (good, not good, medium), growth (height, weight head circumference, chest circumference) statistical significance only using T and p. Illness (URTI, diarrhoea, anaemia). Timing: outcomes assessed at baseline and at 6 months from start of intervention. | |
| Notes | Funder: not stated. If the babies developed anaemia during the studies they were treated with oral iron supplementations until the Hb levels reached normal and then for one month after. | |
| Risk of bias | ||
| Bias | Authors' judgement | Support for judgement |
| Random sequence generation (selection bias) | High risk | Described in abstract of study as “randomly divided”, but no details given. Comment: judged as high risk, no further details available from trial investigator. |
| Allocation concealment (selection bias) | High risk | No apparent attempt to conceal allocation, no details given Comment: judged as high risk, no further details available from trial investigator. |
| Incomplete outcome data (attrition bias) | High risk | No dropouts reported. Dropouts or losses to follow‐up not addressed in the study report. |
| Selective reporting (reporting bias) | Low risk | All pre‐specified outcomes reported. |
| Blinding of participants and personnel (performance bias) | High risk | Not blinded, not possible due to nature of intervention. |
| Blinding of outcome assessment (detection bias) | High risk | No blinding of outcome assessors. |
| Methods | Design: randomised controlled trial. Setting: China, community (specialised massage clinic and at home). | |
| Participants | Sample sizes: n = 78; intervention n = 49; control n = 29 Ages: not stated 3‐6 months Gender: not stated | |
| Interventions | Massage 2 ‐3 times daily for 15 min for at least 3 months (medium‐term duration of intervention). Massage method by Johnson and Johnson. Carried out by parents who were first trained by doctors at a specialist massage centre. Telephone support and contact from doctors in first month. As touch group but without massage – treatment as usual. Massage provider: parents | |
| Outcomes | Primary outcome data (Means and SDs): MDI mental development index, PDI psychological development index, sleep habits (good, not good, medium), growth (height, weight head circumference, chest circumference), statistical significance only using T and p. Illness (URTI, diarrhoea, anaemia). Timing: outcomes assessed at baseline and at 6 months from start of intervention. | |
| Notes | Funder: not stated If the babies developed anaemia during the studies they were treated with oral iron supplementations until the Hb levels reached normal and then for one month after. | |
| Risk of bias | ||
| Bias | Authors' judgement | Support for judgement |
| Random sequence generation (selection bias) | High risk | Described in abstract of study as “randomly divided”, but no details given. Comment: judged as high risk, no further details available from trial investigator. |
| Allocation concealment (selection bias) | High risk | No apparent attempt to conceal allocation, no details given Comment: judged as high risk, no further details available from trial investigator. |
| Incomplete outcome data (attrition bias) | High risk | No dropouts reported. Dropouts or losses to follow‐up not addressed in the study report. |
| Selective reporting (reporting bias) | Low risk | All pre‐specified outcomes reported. |
| Blinding of participants and personnel (performance bias) | High risk | Not blinded, not possible due to nature of intervention. |
| Blinding of outcome assessment (detection bias) | High risk | No blinding of outcome assessors. |
| Methods | Design: randomised controlled trial. Setting: unclear, China. | |
| Participants | 80 newborn infants: n = 40 intervention; n = 40 control. | |
| Interventions | 15 minutes of massage twice daily over 42 days versus a 'no treatment' control group (medium‐term duration of intervention). Massage provider: unclear. | |
| Outcomes | Weight. | |
| Notes | Paper not fully transcribed. Funder: unclear. | |
| Risk of bias | ||
| Bias | Authors' judgement | Support for judgement |
| Random sequence generation (selection bias) | High risk | No details given. Comment: judged as high risk, no further details available from trial investigator. |
| Allocation concealment (selection bias) | High risk | No apparent attempt to conceal allocation, no details given Comment: judged as high risk, no further details available from trial investigator. |
| Incomplete outcome data (attrition bias) | High risk | No dropouts reported. Dropouts or losses to follow‐up not addressed in the study report. |
| Selective reporting (reporting bias) | High risk | Outcomes not clearly pre‐specified, weight cannot be assessed as there is no description of the measurement methods. Comment: judged as high risk, no further details available from trial investigator. |
| Blinding of participants and personnel (performance bias) | High risk | Not possible due to nature of intervention. |
| Blinding of outcome assessment (detection bias) | High risk | No details given. Comment: judged as high risk, no further details available from trial investigator. |
| Methods | Design: randomised controlled trial. Setting: unclear, China. | |
| Participants | 200 newborn infants: n = 100 intervention; n = 100 control. | |
| Interventions | 15 minutes of massage twice daily over 42 days carried out by nurses versus a 'no treatment' control group (medium‐term duration of intervention). Massage provider: nurses. | |
| Outcomes | Weight, height, head circumference and length of sleep. | |
| Notes | Paper not fully transcribed. Funder: unclear. | |
| Risk of bias | ||
| Bias | Authors' judgement | Support for judgement |
| Random sequence generation (selection bias) | High risk | No details given. Comment: judged as high risk, no further details available from trial investigator. |
| Allocation concealment (selection bias) | High risk | No apparent attempt to conceal allocation, no details given Comment: judged as high risk, no further details available from trial investigator. |
| Incomplete outcome data (attrition bias) | High risk | No dropouts reported. Dropouts or losses to follow‐up not addressed in the study report. |
| Selective reporting (reporting bias) | High risk | Sleep length cannot be assessed as there is no description of the measurement methods. Comment: judged as high risk, no further details available from trial investigator. |
| Blinding of participants and personnel (performance bias) | High risk | Not possible due to nature of intervention. |
| Blinding of outcome assessment (detection bias) | High risk | No details given. Comment: judged as high risk, no further details available from trial investigator. |
| Methods | Design: quasi‐randomised controlled trial. Setting: unclear, China. | |
| Participants | 200 newborn infants: n = 100 intervention; n = 100 control. | |
| Interventions | 15 minutes of massage twice daily over 3 months versus a 'no treatment' control group (medium‐term duration of intervention). Massage provider: unclear. | |
| Outcomes | Weight, height, head circumference and bilirubin. | |
| Notes | Paper not fully transcribed. | |
| Risk of bias | ||
| Bias | Authors' judgement | Support for judgement |
| Random sequence generation (selection bias) | High risk | Quasi‐randomised according to sequence of birth dates. |
| Allocation concealment (selection bias) | High risk | No apparent attempt to conceal allocation, no details given. Comment: judged as high risk, no further details available from trial investigator. |
| Incomplete outcome data (attrition bias) | High risk | No dropouts reported. Dropouts or losses to follow‐up not addressed in the study report. |
| Selective reporting (reporting bias) | High risk | High risk. Neural function and development was assessed but the outcome measure was not validated. Comment: judged as high risk, no further details available from trial investigator. |
| Blinding of participants and personnel (performance bias) | High risk | Not possible due to nature of intervention. |
| Blinding of outcome assessment (detection bias) | High risk | No details given. Comment: judged as high risk, no further details available from trial investigator. |
| Methods | Design: randomised controlled trial. Setting: community, China. | |
| Participants | Sample sizes: n = 200; intervention n = 100; control n = 100. Ages: intervention began one day after birth. Ages not otherwise stated. Gender: intervention 55% male; control 53% male. | |
| Interventions | 3 times daily by trained professional while in hospital starting one day after birth then parents trained to continue massage once discharged from hospital. Duration not stated. No intervention for control group. Massage provider: professionals initially then trained parents. | |
| Outcomes | Infant physical development characteristics including angle at which the infant can rise from a prone position, sight and auditory tracking and ability to smile. Statistical significance only of weight, length and head circumference are reported using X2–sided test with P values. Timing: unclear. | |
| Notes | Funder: not stated. | |
| Risk of bias | ||
| Bias | Authors' judgement | Support for judgement |
| Random sequence generation (selection bias) | High risk | No details given. Comment: judged as high risk, no further details available from trial investigator. |
| Allocation concealment (selection bias) | High risk | No apparent attempt to conceal allocation, no details given Comment: judged as high risk, no further details available from trial investigator. |
| Incomplete outcome data (attrition bias) | High risk | No dropouts reported. Dropouts or losses to follow‐up not addressed in the study report. |
| Selective reporting (reporting bias) | High risk | Weight, length and head circumference were also measured but only reported as being significant. |
| Blinding of participants and personnel (performance bias) | High risk | Not possible due to nature of intervention. |
| Blinding of outcome assessment (detection bias) | High risk | No details given. Comment: judged as high risk, no further details available from trial investigator. |
| Methods | Design: randomised controlled trial. Setting: unclear, China. | |
| Participants | 80 newborn infants; n = 40 intervention; n = 40 control. | |
| Interventions | 15 minutes of massage three times daily for 28 days versus a 'no treatment' control group (short duration of intervention). Massage provider: unclear. | |
| Outcomes | Weight, height, head circumference. | |
| Notes | Paper not fully transcribed. Funder: unclear. | |
| Risk of bias | ||
| Bias | Authors' judgement | Support for judgement |
| Random sequence generation (selection bias) | High risk | No details given. Comment: judged as high risk, no further details available from trial investigator. |
| Allocation concealment (selection bias) | High risk | No apparent attempt to conceal allocation, no details given Comment: judged as high risk, no further details available from trial investigator. |
| Incomplete outcome data (attrition bias) | High risk | No dropouts reported. Dropouts or losses to follow‐up not addressed in the study report. |
| Selective reporting (reporting bias) | High risk | No description of measurement methods, for physical growth results. Comment: judged as high risk, no further details available from trial investigator. |
| Blinding of participants and personnel (performance bias) | High risk | Not possible due to nature of intervention. |
| Blinding of outcome assessment (detection bias) | High risk | No details given. Comment: judged as high risk, no further details available from trial investigator. |
| Methods | Design: randomised controlled trial. Setting: community (clinic based), Iran. | |
| Participants | Sample sizes: n = 100; intervention n = 50; control n = 50. Ages: infants aged 2 months no further details given. Gender: no statistical differences in gender (or other characteristics) at start of study, but no further details given. | |
| Interventions | Mothers trained to massage babies, massage all over the body excluding the eyes and genitals using sesame oil. Twice daily for 10 mins, for 4 weeks (morning and night before sleep) (short duration of intervention). Massage provider: mothers trained by researchers. | |
| Outcomes | Weight, height, head circumference, chest circumference, abdominal circumference, arm length, thigh circumference. Sleep duration in 24 hours before study and at outcome assessment. Number of hours slept at night before and after study. Timing: at 4 weeks. | |
| Notes | Funder: supported by the University of Arak (training and research assistance). | |
| Risk of bias | ||
| Bias | Authors' judgement | Support for judgement |
| Random sequence generation (selection bias) | Low risk | Described as randomly assigned (by random numbers table (further information from trial investigator). Infants were randomly assigned to one of two clinics. |
| Allocation concealment (selection bias) | Low risk | By sealed envelope, (further information from trial investigator). |
| Incomplete outcome data (attrition bias) | Low risk | No dropout or loss to follow‐up. Number of participants in each group n = 50 (further information from trial investigator). |
| Selective reporting (reporting bias) | Low risk | All pre‐specified outcomes reported. |
| Blinding of participants and personnel (performance bias) | High risk | Not possible due to nature of intervention. |
| Blinding of outcome assessment (detection bias) | Low risk | The outcome assessors did not know whether the infants received massage or no massage as the infants were identified by a coded number (further information from trial investigator). |
| Methods | Design: quasi‐randomised controlled trial (randomised on the basis of timing of intervention). Setting: community classes, UK. | |
| Participants | Sample sizes: n = 96; intervention n = 45; control n = 51. Ages: intervention 9 weeks of age (median); control 10 weeks of age (median). Gender: intervention 45.2% male; control 48.4% male. (Mothers who provided massage were recruited from a group with depressive symptoms. | |
| Interventions | Duration 1h. Frequency ideally one session per week if possible. Six session in total (medium‐term duration of intervention). Massage provider: mothers with trained professional supervision in classes (International Association of Infant Massage). | |
| Outcomes | Types of outcome: Infant Characteristic Questionnaire (ICQ), Global ratings for mother‐infant interactions attachment patterns (Strange Situtaion Procedure) and distractibility. Maternal outcomes also reported: Depressive symptoms (EPDS), anxiety (SSAI), bonding scores at 1 year, a baby care questionnaire. Timing of assessment: baseline (9 to 12 weeks of infant age) 19 weeks (infant age), and one year follow‐up. | |
| Notes | Funder: The Foundation for integrated Health. | |
| Risk of bias | ||
| Bias | Authors' judgement | Support for judgement |
| Random sequence generation (selection bias) | High risk | Quote p.190 “prospective block‐controlled randomised design”. Comment: probably done. From investigator "...by block as we needed to ensure that there were sufficient mothers in the support group at any one time (with pure randomisation, we risked having only 1 person in the support "group" or having too many people. So, mothers were contacted and invited to take part in either the massage group OR the support group depending on which arm we were recruiting for at that given timepoint.” |
| Allocation concealment (selection bias) | Unclear risk | No details given. |
| Incomplete outcome data (attrition bias) | Low risk | 14/45 did not complete massage group; 20/50 did not complete the support group, no statistical differences between the groups “A Chi‐square analysis was conducted to investigate differences between the massage and support group in the number of drop‐outs and the numbers who completed all measures at one year, questionnaire measures only at one year or no measures at all at one year. No significant difference was found between the groups (Pearson’s Chi square=5.4, ns).“ data obtained from study investigator. |
| Selective reporting (reporting bias) | Low risk | All pre‐specified outcomes reported. |
| Blinding of participants and personnel (performance bias) | High risk | Not possible due to nature of intervention. |
| Blinding of outcome assessment (detection bias) | Low risk | Quote p. 190 “The interactions were rated using the Global Ratings for Mother–Infant Interactions by a blinded, trained rater.” ICG was completed by mothers therefore there is a possibility of introducing bias. |
| Methods | Design: randomised controlled trial. Setting: community parenting class, UK. | |
| Participants | 34 primiparous depressed mothers and their infants aged 9 weeks. Intervention n = 19; control n = 15. | |
| Interventions | Infant massage for I hour weekly over 5 weeks, plus support group for both intervention and control mothers (medium‐term duration of intervention). Massage provider: mothers trained by researchers. | |
| Outcomes | 1. EPDS | |
| Notes | Funder: unclear. | |
| Risk of bias | ||
| Bias | Authors' judgement | Support for judgement |
| Random sequence generation (selection bias) | Unclear risk | Described as randomised, no details given. |
| Allocation concealment (selection bias) | Unclear risk | Unclear. |
| Incomplete outcome data (attrition bias) | Unclear risk | 7/19 Intervention); 2/15 (control) did not complete, mainly due to inconvenient time of sessions. Dropouts not evenly distributed between the groups. 35% of the sample dropped out because the time of the class was inconvenient (7 from the massage and 2 from the control group did not complete and a further 2 mothers in the massage group and 1 in the control group did not have interactions recorded because their infants were unsettled). Infants who started and did not complete the study were not significantly different demographically from those that completed. Comment: judged as unclear risk of bias as the dropouts were not evenly distributed between the groups. |
| Selective reporting (reporting bias) | Low risk | All pre‐specified outcomes reported. |
| Blinding of participants and personnel (performance bias) | High risk | Not possible due to nature of intervention. |
| Blinding of outcome assessment (detection bias) | Unclear risk | The assessment of mother‐infant interaction scores was completed by the researcher who was aware of the infants' allocation groups, but 10 dyads were coded by an experienced independent rater who was blind to study group and the researcher's reliability ratings were checked against the blinded coder. Two groups of dimensions did not meet the reliability standards and these were eliminated from the study. |
| Methods | Design: randomised controlled trial. Setting: school‐based parent training programme for adolescent mothers, USA. | |
| Participants | Sample sizes: n = 21; intervention n = 9; control n = 16. Ages: intervention 52.71days (SD 24.18); control 84.00 days (SD 64.67). Gender: not stated. | |
| Interventions | Infants massaged daily for approximately 30 min, by mothers trained in massage daily for 2 months (medium‐term duration of intervention). Also enrolled in parent training. Mothers were teenagers. Massage provider: mothers. | |
| Outcomes | Types of outcome: infant PSI child domain, weight/growth scores requested. Maternal: PSI parent domain, MCQ and BDI, a non‐validated physical contact score also reported. Timing of assessment: after 2 months of intervention. | |
| Notes | Funder: unclear ‐ Young Mothers’ program? | |
| Risk of bias | ||
| Bias | Authors' judgement | Support for judgement |
| Random sequence generation (selection bias) | Low risk | Quote p 285 “using a random number table”. |
| Allocation concealment (selection bias) | Low risk | Sealed envelope (further details from trial investigator). |
| Incomplete outcome data (attrition bias) | High risk | 7/9 intervention; 8/16 control completed. Data for only 15 of 25 participants was obtained due to difficulty in tracking participants. Analysis based on these 15 completers. |
| Selective reporting (reporting bias) | Unclear risk | All pre‐specified outcomes reported, except that mothers were asked to complete a worksheet but no worksheets were completed and returned. |
| Blinding of participants and personnel (performance bias) | High risk | No details given but unlikely given the nature of the intervention. |
| Blinding of outcome assessment (detection bias) | High risk | Outcomes assessors were not blind to the allocation (further details from trial investigator). |
| Methods | Design: quasi‐randomised controlled trial. Setting: unclear, China. | |
| Participants | 210 newborn infants: n = 105 intervention; n = 105 control. | |
| Interventions | 15 minutes of massage twice daily over 30 days versus a 'no treatment' control group (short duration of intervention). Massage provider: unclear | |
| Outcomes | Weight. | |
| Notes | Paper not fully transcribed. Funder: unclear. | |
| Risk of bias | ||
| Bias | Authors' judgement | Support for judgement |
| Random sequence generation (selection bias) | High risk | Quasi‐randomised according to sequence of birth time. |
| Allocation concealment (selection bias) | High risk | No apparent attempt to conceal allocation, no details given Comment: judged as high risk, no further details available from trial investigator. |
| Incomplete outcome data (attrition bias) | High risk | No dropouts reported. Dropouts or losses to follow‐up not addressed in the study report. |
| Selective reporting (reporting bias) | High risk | High risk. Unclear which measurements and how measurements were taken. Comment: judged as high risk, no further details available from trial investigator. |
| Blinding of participants and personnel (performance bias) | High risk | Not possible due to nature of intervention. |
| Blinding of outcome assessment (detection bias) | High risk | No details given. Comment: judged as high risk, no further details available from trial investigator. |
| Methods | Design: randomised controlled trial. Setting: unclear, China. | |
| Participants | 80 newborn infants; n = 40 intervention; n = 40 control. | |
| Interventions | 15 minutes of massage twice daily over 28 days versus a 'no treatment' control group (short duration of intervention). Massage provider: unclear. | |
| Outcomes | Weight and height. | |
| Notes | Paper not fully transcribed. Funder: unclear. | |
| Risk of bias | ||
| Bias | Authors' judgement | Support for judgement |
| Random sequence generation (selection bias) | High risk | No details given. Comment: judged as high risk, no further details available from trial investigator. |
| Allocation concealment (selection bias) | High risk | No apparent attempt to conceal allocation, no details given. Comment: judged as high risk, no further details available from trial investigator. |
| Incomplete outcome data (attrition bias) | High risk | No dropouts reported. Dropouts or losses to follow‐up not addressed in the study report. |
| Selective reporting (reporting bias) | High risk | High risk. Unclear how measurements were taken. Comment: judged as high risk, no further details available from trial investigator. |
| Blinding of participants and personnel (performance bias) | High risk | Not possible due to nature of intervention. |
| Blinding of outcome assessment (detection bias) | High risk | No details given. Comment: judged as high risk, no further details available from trial investigator. |
| Methods | Design: randomised controlled trial. Setting: unclear, China. | |
| Participants | 210 newborn infants: n = 105 intervention; n = 105 control. | |
| Interventions | 15 minutes of massage twice daily over 42 days versus a 'no treatment' control group (medium‐term duration of intervention). Massage provider: unclear. | |
| Outcomes | Weight, bilirubin and sleeping time. | |
| Notes | Paper not fully transcribed. Funder: unclear. | |
| Risk of bias | ||
| Bias | Authors' judgement | Support for judgement |
| Random sequence generation (selection bias) | High risk | No details given. Comment: judged as high risk, no further details available from trial investigator. |
| Allocation concealment (selection bias) | High risk | No details given, no apparent attempt to conceal allocation. Comment: judged as high risk, no further details available from trial investigator. |
| Incomplete outcome data (attrition bias) | High risk | No dropouts reported. Dropouts or losses to follow‐up not addressed in the study report. |
| Selective reporting (reporting bias) | High risk | High risk. Unclear how measurements were taken. Comment: judged as high risk, no further details available from trial investigator. |
| Blinding of participants and personnel (performance bias) | High risk | Not possible due to nature of intervention. |
| Blinding of outcome assessment (detection bias) | High risk | No details given. Comment: judged as high risk, no further details available from trial investigator. |
| Methods | Design: randomised controlled trial. Setting: unclear, China. | |
| Participants | 60 newborn infants: n = 30 intervention; n = 30 control. | |
| Interventions | 15 minutes of massage three times daily over 42 days versus a 'no treatment' control group (medium‐term duration of intervention). Massage provider: unclear | |
| Outcomes | Weight. | |
| Notes | Paper not fully transcribed. Funder: unclear. | |
| Risk of bias | ||
| Bias | Authors' judgement | Support for judgement |
| Random sequence generation (selection bias) | High risk | No details given. Comment: judged as high risk, no further details available from trial investigator. |
| Allocation concealment (selection bias) | High risk | No apparent attempt to conceal allocation, no details given Comment: judged as high risk, no further details available from trial investigator. |
| Incomplete outcome data (attrition bias) | High risk | No dropouts reported. Dropouts or losses to follow‐up not addressed in the study report. |
| Selective reporting (reporting bias) | High risk | High risk. Unclear how measurements were taken. Comment: judged as high risk, no further details available from trial investigator. |
| Blinding of participants and personnel (performance bias) | High risk | Not possible due to nature of intervention. |
| Blinding of outcome assessment (detection bias) | High risk | No details given. Comment: judged as high risk, no further details available from trial investigator. |
| Methods | Design: randomised controlled trial. Setting: maternity ward then at home (community). | |
| Participants | Sample sizes: n = 57; intervention n = 27; control n = 30. Ages: commenced within 24 hours of birth. Gender: not stated. | |
| Interventions | Duration, dose, type. 15‐20 min per day started by trained professionals continued daily by the mother after discharge for 2 months (medium‐term duration of intervention). Control group received no massage (routine care only). Massage provider: trained professionals then mothers. | |
| Outcomes | Types of outcome: 0‐3 education development checklist (Capital Institute of Children 0‐3 years old checklist), weight. Timing of assessment: 60 days for development checklist, 2 months for weight. | |
| Notes | Funder: not stated. | |
| Risk of bias | ||
| Bias | Authors' judgement | Support for judgement |
| Random sequence generation (selection bias) | High risk | Described as randomly divided, no further details. |
| Allocation concealment (selection bias) | High risk | No apparent attempt to conceal allocation, no details given Comment: judged as high risk, no further details available from trial investigator. |
| Incomplete outcome data (attrition bias) | High risk | Results for n = 57 are reported (number included in study). No dropouts reported. Dropouts or losses to follow‐up not addressed in the study report. |
| Selective reporting (reporting bias) | Low risk | All outcomes reported. |
| Blinding of participants and personnel (performance bias) | High risk | Not possible due to nature of intervention |
| Blinding of outcome assessment (detection bias) | Unclear risk | Blind outcome assessment (0‐3 development checklist) stated but unclear who is blinded and how. |
| Methods | Design: quasi‐randomised controlled trial. First participant assigned a random number, followed by alternate allocation of subsequent participants. Setting: maternity hospital, USA. | |
| Participants | Sample sizes: n = 40: intervention ATVV n = 16; control n = 10; (tactile only group n = 14). Ages: intervention 36.32 hours (SD 10.50); control 34.29 hours (SD 7.18). Gender: intervention 62.5% male; control 30% male. | |
| Interventions | Duration, dose, type. Infants were randomly assigned to receive one 15 minute session of tactile‐only, versus auditory, tactile, visual, and vestibular, versus no stimulation 30 minutes before feeding (brief duration of intervention). Massage provider: researchers. | |
| Outcomes | Types of outcome: salivary cortisol (μg/dL) and behavioural state. Timing of assessment: salivary cortisol baseline, immediately post‐intervention and 10 min post‐intervention. Behavioural state at baseline, mid intervention post‐intervention (Thoman 1987). | |
| Notes | Funder: the Harris Foundation. | |
| Risk of bias | ||
| Bias | Authors' judgement | Support for judgement |
| Random sequence generation (selection bias) | High risk | Quote p. 27 “via random start in a random numbers table”. Note from investigator: "We used a random start in a random numbers table. The control group was selected when the next even number and the experimental group was selected when the next number was an odd number." Comment: quasi‐randomised. |
| Allocation concealment (selection bias) | Low risk | Study investigator describes allocation by sealed envelopes in a personal communication. |
| Incomplete outcome data (attrition bias) | Low risk | 40/60 contributed to the final salivary cortisol analyses, due to insufficient sample volumes being collected. Comment: sample size was not evenly distributed between the groups at different time points. Behavioural state is only reported for the same numbers of infants for each group and time point as were available for cortisol analysis. Participants for who complete data only was available were analysed. |
| Selective reporting (reporting bias) | Low risk | All pre‐specified outcomes reported. Behavioural analysis: no infants were observed in the indeterminate state category and it was dropped from the analysis. Comment: we considered that it is unlikely that this finding could bias the results of the study. |
| Blinding of participants and personnel (performance bias) | High risk | Comment: unlikely given the nature of the intervention, risk of bias is likely to be high. |
| Blinding of outcome assessment (detection bias) | Low risk | Quote and full details p. 27 “behavioural state was judged by a research assistant who was blinded to group assignment”. Study investigator reports “Blinding of participants and personnel (performance bias) mothers were told which group the baby was assigned to mothers did not observe the protocol. The person judging state wore a head set and turned away while the intervention was conducted. They remained blinded to group assignment because the intervention was stopped while they coded behavioral state” (personal communication). |
| Methods | Design: randomised controlled trial. Setting: unclear, China. | |
| Participants | 124 newborn infants; n = 61 intervention; n = 63 control. | |
| Interventions | 15 ‐ 20 minutes of massage twice daily over three months versus a 'no treatment' control group (medium‐term duration of intervention). Massage provider: unclear. | |
| Outcomes | Duration of sleep; frequency of night wakes and crying; length of crying; length of time for normal sleeping pattern. | |
| Notes | Paper not fully transcribed. Funder: unclear. | |
| Risk of bias | ||
| Bias | Authors' judgement | Support for judgement |
| Random sequence generation (selection bias) | High risk | No details given. Comment: judged as high risk, no further details available from trial investigator. |
| Allocation concealment (selection bias) | High risk | No apparent attempt to conceal allocation, no details given Comment: judged as high risk, no further details available from trial investigator. |
| Incomplete outcome data (attrition bias) | High risk | No dropouts reported. Dropouts or losses to follow‐up not addressed in the study report. |
| Selective reporting (reporting bias) | High risk | Duration of sleep, frequency of night wakes and crying (length of crying) were prespecified outcomes. The paper also included the incidence of sleep disturbances and length of time required to develop a normal sleeping pattern but the significance of these results was not explored in the paper. Comment: judged as high risk, no further details available from trial investigator. |
| Blinding of participants and personnel (performance bias) | High risk | Not possible due to nature of intervention. |
| Blinding of outcome assessment (detection bias) | High risk | No details given. Comment: judged as high risk, no further details available from trial investigator. |
| Methods | Design: randomised controlled trial. Setting: unclear, China. | |
| Participants | 100 newborn infants: n = 50 intervention; n = 50 control. | |
| Interventions | 10 ‐ 15 minutes of massage twice daily over 42 days versus a 'no treatment' control group (medium‐term duration of intervention). Massage provider: unclear. | |
| Outcomes | Weight. | |
| Notes | Paper not fully transcribed. Funder: unclear. | |
| Risk of bias | ||
| Bias | Authors' judgement | Support for judgement |
| Random sequence generation (selection bias) | High risk | No details given. Comment: judged as high risk, no further details available from trial investigator. |
| Allocation concealment (selection bias) | High risk | No apparent attempt to conceal allocation, no details given Comment: judged as high risk, no further details available from trial investigator. |
| Incomplete outcome data (attrition bias) | High risk | No dropouts reported. Dropouts or losses to follow‐up not addressed in the study report. |
| Selective reporting (reporting bias) | High risk | Measurement methods unclear. Comment: judged as high risk, no further details available from trial investigator. |
| Blinding of participants and personnel (performance bias) | High risk | Not possible due to nature of intervention. |
| Blinding of outcome assessment (detection bias) | Low risk | Assessors were blinded. |
| Methods | Design: quasi‐randomised controlled trial. Setting: unclear, China. | |
| Participants | 100 newborn infants: n = 50 intervention; n = 50 control. | |
| Interventions | 15 minutes of massage three times daily over 30 days versus a 'no treatment' control group (short duration of intervention). Massage provider: unclear. | |
| Outcomes | Weight, height and head circumference, means of change scores only, no SD. | |
| Notes | Paper not fully transcribed. Funder: unclear. | |
| Risk of bias | ||
| Bias | Authors' judgement | Support for judgement |
| Random sequence generation (selection bias) | High risk | Quasi‐randomised according to sequence of admission number: even numbers assigned to massage group. Odd numbers assigned to control group. |
| Allocation concealment (selection bias) | High risk | No apparent attempt to conceal allocation, no details given Comment: judged as high risk, no further details available from trial investigator. |
| Incomplete outcome data (attrition bias) | High risk | No dropouts reported. Dropouts or losses to follow‐up not addressed in the study report. |
| Selective reporting (reporting bias) | Unclear risk | All pre‐specified physical growth outcomes are apparently reported, but milk intake was also reported. Comment: we judged this as unclear as it is not clear if reporting of additional outcome measures could bias the study results. |
| Blinding of participants and personnel (performance bias) | High risk | Not possible due to nature of intervention. |
| Blinding of outcome assessment (detection bias) | Low risk | Outcome assessors blinded. |
| Methods | Design: quasi‐randomised controlled trial (assigned to treatment or control on basis of odd and even days of birth). Setting: community (initiated in hospital). China. | |
| Participants | Sample sizes: n = 115; intervention n = 55; control n = 60. Ages: neonates, not otherwise specified. Gender: intervention 45% male; control 45% male. | |
| Interventions | 15‐20 min per session, 2‐3 times a day for 3 months (medium‐term duration of intervention). Care as usual in control group. Massage provider: parents. | |
| Outcomes | Types of outcome: 1 month after birth neonatal behavioral neurological assessment score (NBNA); at 3 months, using adapted China Institute of Psychology and Child Development Center scales mental development index (MDI), psychomotor development index ( PDI) and head circumference measurements. Timing of assessment: 1 month and 3 months. | |
| Notes | Funder: unclear (not stated). | |
| Risk of bias | ||
| Bias | Authors' judgement | Support for judgement |
| Random sequence generation (selection bias) | High risk | Quasi‐randomised by odd and even date of birth |
| Allocation concealment (selection bias) | High risk | No apparent attempt to conceal allocation, no details given Comment: judged as high risk, no further details available from trial investigator. |
| Incomplete outcome data (attrition bias) | High risk | No dropouts reported. Dropouts or losses to follow‐up not addressed in the study report. |
| Selective reporting (reporting bias) | Low risk | All pre‐specified outcomes are apparently reported. |
| Blinding of participants and personnel (performance bias) | High risk | Not possible due to nature of intervention |
| Blinding of outcome assessment (detection bias) | High risk | No details given. Comment: judged as high risk, no further details available from trial investigator. |
ATVV = auditory, tactile, visual, vestibular
BDI = Beck Depression Inventory
EPDS = Edinburgh Postnatal Depression Scale
Hb = haemoglobin
MCQ = Maternal Confidence Questionnaire
SD = standard deviation
SSAI = Spielberger State Anxiety Index
URTI = upper respiratory infection
Duration of intervention
Brief = a single session
Short = intervention took place for up to 4 weeks
Medium‐term = intervention took place for at least 4 weeks and up to 12 weeks
Long = intervention took place for at least 12 weeks and up to 26 weeks
Characteristics of excluded studies [ordered by study ID]
Jump to:
| Study | Reason for exclusion |
| Trial was not randomised | |
| Infants participating in the study were aged between 3 and 14 months (mean 7.1 SD = 3.4)‐ outside of the stated aged range for this review | |
| Large survey | |
| Spanish study of paediatric massage ‐ not a RCT | |
| Study intervention aimed at mothers rather than infants ‐ consisted of free day care for the infants and a rehab program (social, educational, and vocational) plus several mood induction interventions for the mothers, including relaxation, massage therapy, and mother‐infant interaction coaching | |
| Study compared infants who either received light pressure or moderate pressure massage. There was no control group | |
| Not randomised, no control group. | |
| Study compared infant massage and crib vibrator interventions. There was no control group | |
| RCT of Yakson massage versus non‐nutritive sucking , versus control. Excluded as this is a study of pain relief in infants (pain due to heel stick test). | |
| This was a review article of literature, not a RCT | |
| RCT, massage and use of educational toy, control group received no intervention. Infants under 6 months of age. Growth, physical and mental development indices reported. Excluded due to multimodal nature of intervention. | |
| RCT of orphaned infants in Ecuador. Randomly assigned to intervention or control. Outcome was number of days of illness. Excluded as children too old, mean 10.6 month in experimental, 10.4 months in control group. | |
| Not an RCT (non equivalent control group pretest‐post test design). | |
| Non randomised. Employed 'convenient sampling' method that is, mothers who volunteered were in the massage group the control group were mother who did not carry out massage. (Further information from trial investigator). | |
| Dissertation, RCT, massage and control group, outcomes included maternal outcomes of stress, depression and confidence. Excluded as participant group was HIV infected mothers. | |
| This dissertation investigated the effects of infant massage on interactions between high risk infants and their care givers. | |
| RCT, control group (no massage) versus Yakson massage. Excluded as this is a study of pain relief in infants (pain due to heel stick test). | |
| Measured infant affect during the 'still‐face' procedure only | |
| This study was a test procedure for measuring eye contact when infants were touched or not touched | |
| This study compares stroking with tickling and poking on infant eye contact. | |
| Sample comprised HIV‐exposed infants with a lower gestational age and birthweight than normal | |
| Not an RCT (age matched control group who did not receive massage). | |
| Measured tactile stimulation during the still face procedure only | |
| Not an RCT, cross matched control group. | |
| Randomised 'randomly selected', normal and sick term and preterm neonates, compares different types of massage, does not include a no treatment control group. | |
| Randomised experimental animal study. |
RCT: randomised controlled trial
SD: standard deviation
Data and analyses
| Outcome or subgroup title | No. of studies | No. of participants | Statistical method | Effect size |
| 1 Weight Show forest plot | 18 | Mean Difference (IV, Random, 95% CI) | Subtotals only | |
| Analysis 1.1 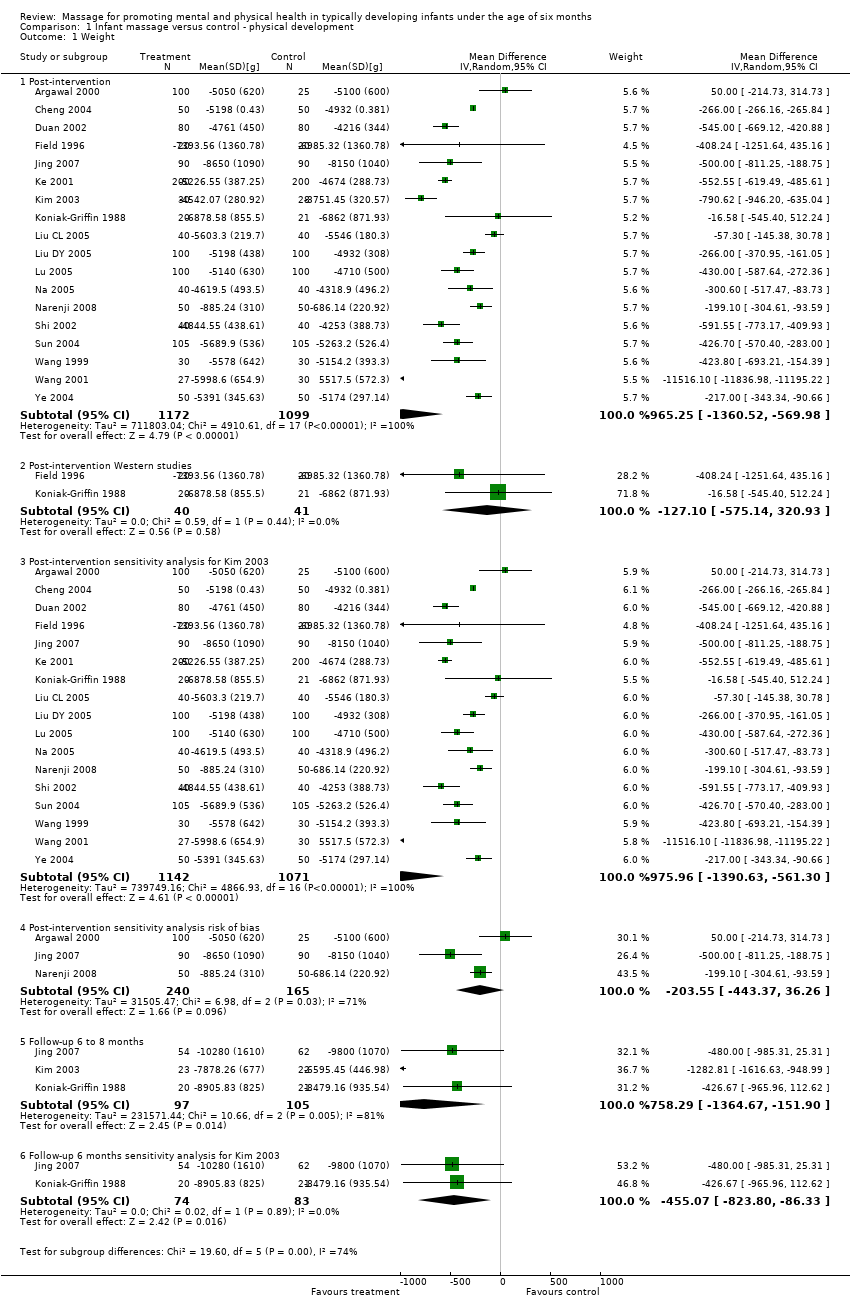 Comparison 1 Infant massage versus control ‐ physical development, Outcome 1 Weight. | ||||
| 1.1 Post‐intervention | 18 | 2271 | Mean Difference (IV, Random, 95% CI) | ‐965.25 [‐1360.52, ‐569.98] |
| 1.2 Post‐intervention Western studies | 2 | 81 | Mean Difference (IV, Random, 95% CI) | ‐127.10 [‐575.14, 320.93] |
| 1.3 Post‐intervention sensitivity analysis for Kim 2003 | 17 | 2213 | Mean Difference (IV, Random, 95% CI) | ‐975.96 [‐1390.63, ‐561.30] |
| 1.4 Post‐intervention sensitivity analysis risk of bias | 3 | 405 | Mean Difference (IV, Random, 95% CI) | ‐203.55 [‐443.37, 36.26] |
| 1.5 Follow‐up 6 to 8 months | 3 | 202 | Mean Difference (IV, Random, 95% CI) | ‐758.29 [‐1364.67, ‐151.90] |
| 1.6 Follow‐up 6 months sensitivity analysis for Kim 2003 | 2 | 157 | Mean Difference (IV, Random, 95% CI) | ‐455.07 [‐823.80, ‐86.33] |
| 2 Weight: subgroup analyses (duration of intervention) Show forest plot | 18 | Mean Difference (IV, Random, 95% CI) | Subtotals only | |
| Analysis 1.2  Comparison 1 Infant massage versus control ‐ physical development, Outcome 2 Weight: subgroup analyses (duration of intervention). | ||||
| 2.1 Post‐intervention subgroup short term | 5 | 443 | Mean Difference (IV, Random, 95% CI) | ‐374.07 [‐654.84, ‐93.31] |
| 2.2 Post‐intervention subgroup medium term | 12 | 1648 | Mean Difference (IV, Random, 95% CI) | ‐1259.19 [‐1807.80, ‐710.58] |
| 2.3 Post‐intervention subgroup long term | 1 | 180 | Mean Difference (IV, Random, 95% CI) | ‐500.00 [‐811.25, ‐188.75] |
| 3 Length Show forest plot | 11 | Mean Difference (IV, Random, 95% CI) | Subtotals only | |
| Analysis 1.3  Comparison 1 Infant massage versus control ‐ physical development, Outcome 3 Length. | ||||
| 3.1 Post‐intervention | 11 | 1683 | Mean Difference (IV, Random, 95% CI) | ‐1.30 [‐1.60, 1.00] |
| 3.2 Post‐intervention sensitivity analysis risk of bias | 3 | 405 | Mean Difference (IV, Random, 95% CI) | ‐0.65 [‐1.20, ‐0.11] |
| 3.3 Follow‐up 6 months | 2 | 161 | Mean Difference (IV, Random, 95% CI) | ‐1.98 [‐4.69, 0.72] |
| 4 Length: subgroup analyses (duration of intervention) Show forest plot | 11 | Mean Difference (IV, Random, 95% CI) | Subtotals only | |
| Analysis 1.4  Comparison 1 Infant massage versus control ‐ physical development, Outcome 4 Length: subgroup analyses (duration of intervention). | ||||
| 4.1 Post‐intervention subgroup short duration | 5 | 443 | Mean Difference (IV, Random, 95% CI) | ‐1.00 [‐1.54, ‐0.47] |
| 4.2 Post‐intervention subgroup medium‐term duration | 5 | 1060 | Mean Difference (IV, Random, 95% CI) | ‐1.51 [‐1.76, ‐1.27] |
| 4.3 Post‐intervention subgroup long duration | 1 | 180 | Mean Difference (IV, Random, 95% CI) | ‐1.13 [‐1.88, ‐0.38] |
| 5 Head circumference Show forest plot | 10 | Mean Difference (IV, Random, 95% CI) | Subtotals only | |
| Analysis 1.5  Comparison 1 Infant massage versus control ‐ physical development, Outcome 5 Head circumference. | ||||
| 5.1 Post‐intervention | 9 | 1423 | Mean Difference (IV, Random, 95% CI) | ‐0.81 [‐1.18, ‐0.45] |
| 5.2 Post‐intervention sensitivity analysis risk of bias | 2 | 225 | Mean Difference (IV, Random, 95% CI) | ‐0.07 [‐0.27, 0.12] |
| 5.3 Follow‐up 6 months | 2 | 160 | Mean Difference (IV, Random, 95% CI) | ‐2.19 [‐3.88, ‐0.49] |
| 6 Head circumference: subgroup analyses (duration of intervention) Show forest plot | 9 | Mean Difference (IV, Random, 95% CI) | Subtotals only | |
| Analysis 1.6  Comparison 1 Infant massage versus control ‐ physical development, Outcome 6 Head circumference: subgroup analyses (duration of intervention). | ||||
| 6.1 Post‐intervention subgroup short | 4 | 363 | Mean Difference (IV, Random, 95% CI) | ‐0.70 [‐1.45, 0.05] |
| 6.2 Post‐intervention subgroup medium‐term | 5 | 1060 | Mean Difference (IV, Random, 95% CI) | ‐0.90 [‐1.16, ‐0.64] |
| 7 Mid arm circumference Show forest plot | 2 | Mean Difference (IV, Random, 95% CI) | Subtotals only | |
| Analysis 1.7  Comparison 1 Infant massage versus control ‐ physical development, Outcome 7 Mid arm circumference. | ||||
| 7.1 Post‐intervention | 2 | 225 | Mean Difference (IV, Random, 95% CI) | ‐0.47 [‐0.80, ‐0.13] |
| 8 Mid leg/thigh circumference Show forest plot | 2 | Mean Difference (IV, Random, 95% CI) | Subtotals only | |
| Analysis 1.8 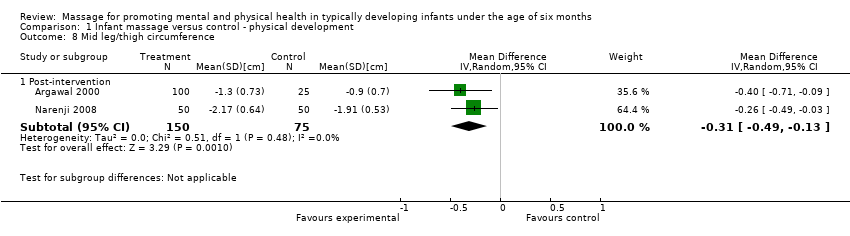 Comparison 1 Infant massage versus control ‐ physical development, Outcome 8 Mid leg/thigh circumference. | ||||
| 8.1 Post‐intervention | 2 | 225 | Mean Difference (IV, Random, 95% CI) | ‐0.31 [‐0.49, ‐0.13] |
| 9 Abdominal circumference Show forest plot | 1 | 100 | Mean Difference (IV, Random, 95% CI) | ‐0.75 [‐1.09, ‐0.41] |
| Analysis 1.9  Comparison 1 Infant massage versus control ‐ physical development, Outcome 9 Abdominal circumference. | ||||
| 9.1 Post‐intervention | 1 | 100 | Mean Difference (IV, Random, 95% CI) | ‐0.75 [‐1.09, ‐0.41] |
| 10 Chest circumference Show forest plot | 1 | 100 | Mean Difference (IV, Random, 95% CI) | ‐0.88 [‐1.22, ‐0.54] |
| Analysis 1.10 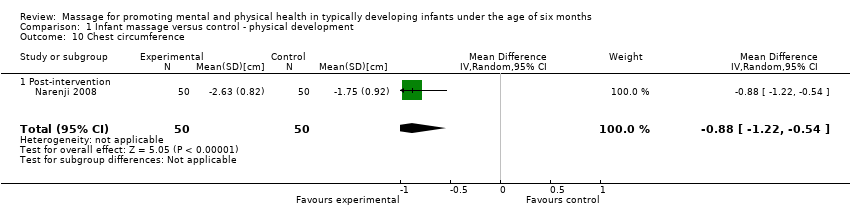 Comparison 1 Infant massage versus control ‐ physical development, Outcome 10 Chest circumference. | ||||
| 10.1 Post‐intervention | 1 | 100 | Mean Difference (IV, Random, 95% CI) | ‐0.88 [‐1.22, ‐0.54] |
| 11 Hormones: cortisol Show forest plot | 2 | Std. Mean Difference (IV, Random, 95% CI) | Subtotals only | |
| Analysis 1.11 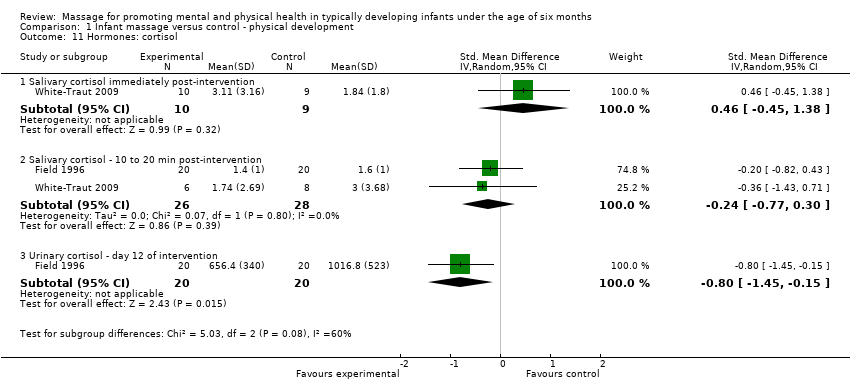 Comparison 1 Infant massage versus control ‐ physical development, Outcome 11 Hormones: cortisol. | ||||
| 11.1 Salivary cortisol immediately post‐intervention | 1 | 19 | Std. Mean Difference (IV, Random, 95% CI) | 0.46 [‐0.45, 1.38] |
| 11.2 Salivary cortisol ‐ 10 to 20 min post‐intervention | 2 | 54 | Std. Mean Difference (IV, Random, 95% CI) | ‐0.24 [‐0.77, 0.30] |
| 11.3 Urinary cortisol ‐ day 12 of intervention | 1 | 40 | Std. Mean Difference (IV, Random, 95% CI) | ‐0.80 [‐1.45, ‐0.15] |
| 12 Hormones: norepinephrine Show forest plot | 1 | Mean Difference (IV, Random, 95% CI) | Subtotals only | |
| Analysis 1.12 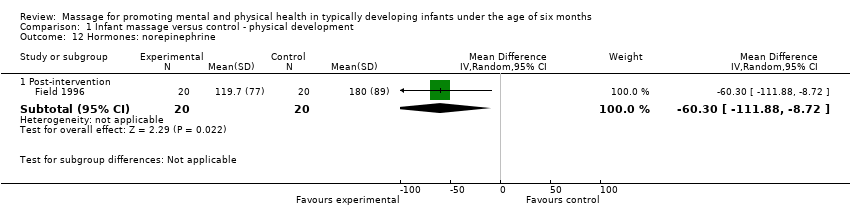 Comparison 1 Infant massage versus control ‐ physical development, Outcome 12 Hormones: norepinephrine. | ||||
| 12.1 Post‐intervention | 1 | 40 | Mean Difference (IV, Random, 95% CI) | ‐60.3 [‐111.88, ‐8.72] |
| 13 Hormones: epinephrine Show forest plot | 1 | Mean Difference (IV, Random, 95% CI) | Subtotals only | |
| Analysis 1.13  Comparison 1 Infant massage versus control ‐ physical development, Outcome 13 Hormones: epinephrine. | ||||
| 13.1 Post‐intervention | 1 | 40 | Mean Difference (IV, Random, 95% CI) | ‐13.00 [‐20.08, ‐5.92] |
| 14 Hormones: serotonin Show forest plot | 1 | Mean Difference (IV, Random, 95% CI) | Subtotals only | |
| Analysis 1.14  Comparison 1 Infant massage versus control ‐ physical development, Outcome 14 Hormones: serotonin. | ||||
| 14.1 Post‐intervention | 1 | 40 | Mean Difference (IV, Random, 95% CI) | ‐295.5 [‐705.25, 114.25] |
| 15 Hormones: 6‐sulphatoxymelatonin secretion Show forest plot | 1 | Mean Difference (IV, Random, 95% CI) | Subtotals only | |
| Analysis 1.15 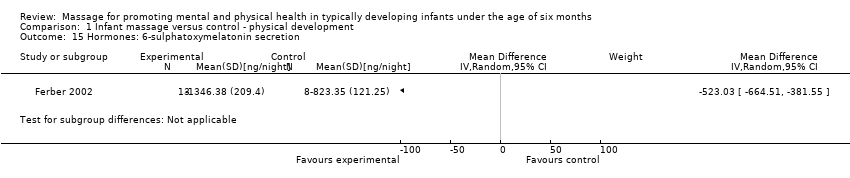 Comparison 1 Infant massage versus control ‐ physical development, Outcome 15 Hormones: 6‐sulphatoxymelatonin secretion. | ||||
| 16 Biochemical markers: Bilirubin (7 days PN) Show forest plot | 2 | 410 | Mean Difference (IV, Random, 95% CI) | ‐38.11 [‐50.61, ‐25.61] |
| Analysis 1.16  Comparison 1 Infant massage versus control ‐ physical development, Outcome 16 Biochemical markers: Bilirubin (7 days PN). | ||||
| 17 Crying or fussing time Show forest plot | 4 | Mean Difference (IV, Random, 95% CI) | Subtotals only | |
| Analysis 1.17 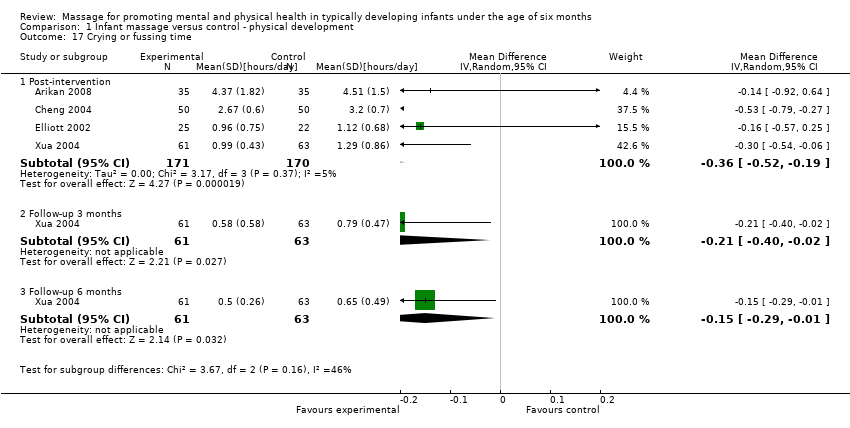 Comparison 1 Infant massage versus control ‐ physical development, Outcome 17 Crying or fussing time. | ||||
| 17.1 Post‐intervention | 4 | 341 | Mean Difference (IV, Random, 95% CI) | ‐0.36 [‐0.52, ‐0.19] |
| 17.2 Follow‐up 3 months | 1 | 124 | Mean Difference (IV, Random, 95% CI) | ‐0.21 [‐0.40, ‐0.02] |
| 17.3 Follow‐up 6 months | 1 | 124 | Mean Difference (IV, Random, 95% CI) | ‐0.15 [‐0.29, ‐0.01] |
| 18 Crying frequency (times) Show forest plot | 1 | Mean Difference (IV, Random, 95% CI) | Subtotals only | |
| Analysis 1.18  Comparison 1 Infant massage versus control ‐ physical development, Outcome 18 Crying frequency (times). | ||||
| 18.1 Post‐intervention | 1 | 124 | Mean Difference (IV, Random, 95% CI) | ‐0.34 [‐0.56, ‐0.12] |
| 18.2 Follow‐up 3 months | 1 | 126 | Mean Difference (IV, Random, 95% CI) | ‐0.19 [‐0.36, ‐0.02] |
| 18.3 Follow‐up 6 months | 1 | 124 | Mean Difference (IV, Random, 95% CI) | ‐0.18 [‐0.35, ‐0.01] |
| 19 Sleep/wake behaviours (Thoman) Show forest plot | 1 | Mean Difference (IV, Random, 95% CI) | Subtotals only | |
| Analysis 1.19 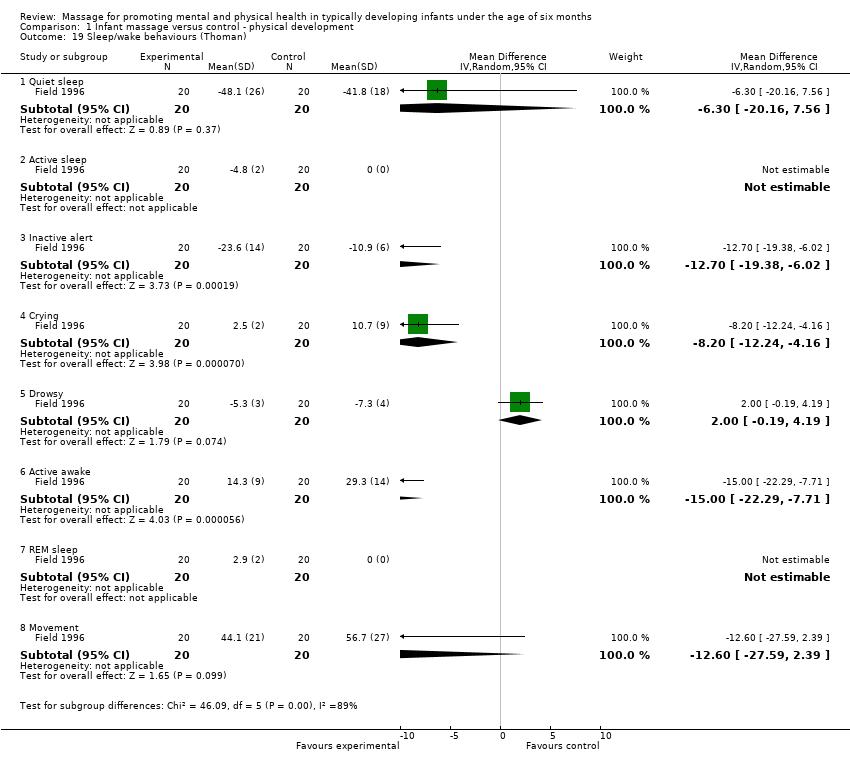 Comparison 1 Infant massage versus control ‐ physical development, Outcome 19 Sleep/wake behaviours (Thoman). | ||||
| 19.1 Quiet sleep | 1 | 40 | Mean Difference (IV, Random, 95% CI) | ‐6.30 [‐20.16, 7.56] |
| 19.2 Active sleep | 1 | 40 | Mean Difference (IV, Random, 95% CI) | 0.0 [0.0, 0.0] |
| 19.3 Inactive alert | 1 | 40 | Mean Difference (IV, Random, 95% CI) | ‐12.70 [‐19.38, ‐6.02] |
| 19.4 Crying | 1 | 40 | Mean Difference (IV, Random, 95% CI) | ‐8.2 [‐12.24, ‐4.16] |
| 19.5 Drowsy | 1 | 40 | Mean Difference (IV, Random, 95% CI) | 2.0 [‐0.19, 4.19] |
| 19.6 Active awake | 1 | 40 | Mean Difference (IV, Random, 95% CI) | ‐15.00 [‐22.29, ‐7.71] |
| 19.7 REM sleep | 1 | 40 | Mean Difference (IV, Random, 95% CI) | 0.0 [0.0, 0.0] |
| 19.8 Movement | 1 | 40 | Mean Difference (IV, Random, 95% CI) | ‐12.60 [‐27.59, 2.39] |
| 20 Behavioural state immediately post‐intervention (Thoman) Show forest plot | 1 | Risk Ratio (M‐H, Random, 95% CI) | Subtotals only | |
| Analysis 1.20 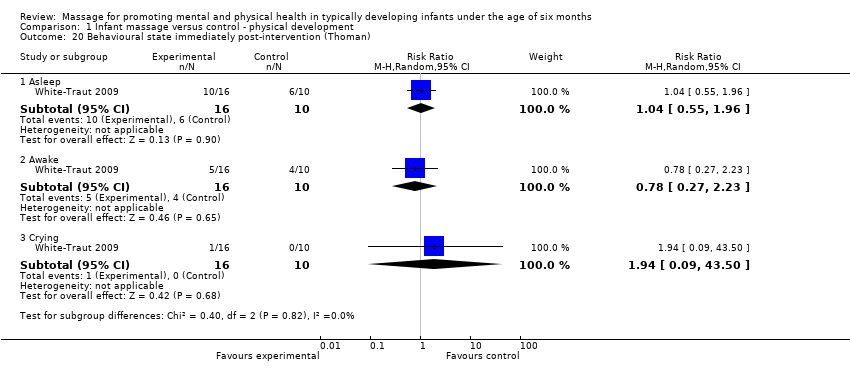 Comparison 1 Infant massage versus control ‐ physical development, Outcome 20 Behavioural state immediately post‐intervention (Thoman). | ||||
| 20.1 Asleep | 1 | 26 | Risk Ratio (M‐H, Random, 95% CI) | 1.04 [0.55, 1.96] |
| 20.2 Awake | 1 | 26 | Risk Ratio (M‐H, Random, 95% CI) | 0.78 [0.27, 2.23] |
| 20.3 Crying | 1 | 26 | Risk Ratio (M‐H, Random, 95% CI) | 1.94 [0.09, 43.50] |
| 21 Sleep duration over 24hr period Show forest plot | 4 | Mean Difference (IV, Random, 95% CI) | Subtotals only | |
| Analysis 1.21  Comparison 1 Infant massage versus control ‐ physical development, Outcome 21 Sleep duration over 24hr period. | ||||
| 21.1 Post‐intervention | 4 | 634 | Mean Difference (IV, Random, 95% CI) | ‐0.91 [‐1.51, ‐0.30] |
| 21.2 Sleep follow‐up 3 months | 1 | 124 | Mean Difference (IV, Random, 95% CI) | ‐1.30 [‐1.81, ‐0.79] |
| 21.3 Sleep follow‐up 6 months | 1 | 124 | Mean Difference (IV, Random, 95% CI) | ‐0.08 [‐0.64, 0.48] |
| 22 Mean increase in 24h sleep Show forest plot | 2 | Std. Mean Difference (IV, Random, 95% CI) | Subtotals only | |
| Analysis 1.22  Comparison 1 Infant massage versus control ‐ physical development, Outcome 22 Mean increase in 24h sleep. | ||||
| 22.1 Post‐intervention | 2 | 225 | Std. Mean Difference (IV, Random, 95% CI) | ‐1.47 [‐4.43, 1.49] |
| 23 Mean increase in duration of night sleep Show forest plot | 2 | Std. Mean Difference (IV, Random, 95% CI) | Subtotals only | |
| Analysis 1.23 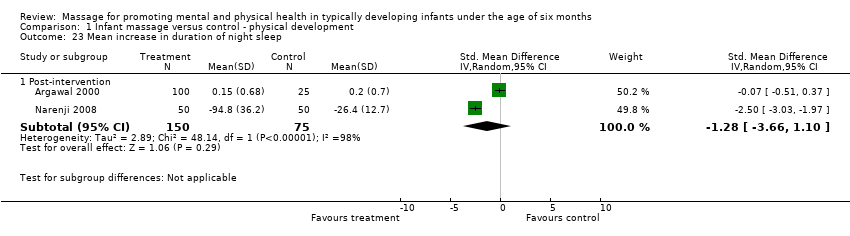 Comparison 1 Infant massage versus control ‐ physical development, Outcome 23 Mean increase in duration of night sleep. | ||||
| 23.1 Post‐intervention | 2 | 225 | Std. Mean Difference (IV, Random, 95% CI) | ‐1.28 [‐3.66, 1.10] |
| 24 Mean increase in duration of day sleep Show forest plot | 1 | Mean Difference (IV, Random, 95% CI) | Subtotals only | |
| Analysis 1.24  Comparison 1 Infant massage versus control ‐ physical development, Outcome 24 Mean increase in duration of day sleep. | ||||
| 24.1 Post‐intervention | 1 | 125 | Mean Difference (IV, Random, 95% CI) | 0.10 [‐0.21, 0.41] |
| 25 Mean increase in duration of first morning sleep after massage Show forest plot | 1 | Mean Difference (IV, Random, 95% CI) | Subtotals only | |
| Analysis 1.25  Comparison 1 Infant massage versus control ‐ physical development, Outcome 25 Mean increase in duration of first morning sleep after massage. | ||||
| 25.1 Post‐intervention | 1 | 125 | Mean Difference (IV, Random, 95% CI) | ‐1.52 [‐1.69, ‐1.35] |
| 26 Sleep (total hours per night) Show forest plot | 1 | 100 | Mean Difference (IV, Random, 95% CI) | ‐0.70 [1.00, ‐0.40] |
| Analysis 1.26  Comparison 1 Infant massage versus control ‐ physical development, Outcome 26 Sleep (total hours per night). | ||||
| 26.1 Post‐intervention | 1 | 100 | Mean Difference (IV, Random, 95% CI) | ‐0.70 [1.00, ‐0.40] |
| 27 Number of naps (total number of naps) Show forest plot | 1 | Mean Difference (IV, Random, 95% CI) | Subtotals only | |
| Analysis 1.27  Comparison 1 Infant massage versus control ‐ physical development, Outcome 27 Number of naps (total number of naps). | ||||
| 28 Number of naps in day Show forest plot | 1 | Mean Difference (IV, Random, 95% CI) | Subtotals only | |
| Analysis 1.28  Comparison 1 Infant massage versus control ‐ physical development, Outcome 28 Number of naps in day. | ||||
| 29 Number of naps at night Show forest plot | 1 | Mean Difference (IV, Random, 95% CI) | Subtotals only | |
| Analysis 1.29  Comparison 1 Infant massage versus control ‐ physical development, Outcome 29 Number of naps at night. | ||||
| 30 Night Wake Frequency (times) Show forest plot | 1 | Mean Difference (IV, Random, 95% CI) | Subtotals only | |
| Analysis 1.30  Comparison 1 Infant massage versus control ‐ physical development, Outcome 30 Night Wake Frequency (times). | ||||
| 30.1 Post‐intervention | 1 | 124 | Mean Difference (IV, Random, 95% CI) | ‐0.48 [‐0.81, ‐0.15] |
| 30.2 Follow‐up 3 months | 1 | 124 | Mean Difference (IV, Random, 95% CI) | ‐0.38 [‐0.63, ‐0.13] |
| 30.3 Follow‐up 6 months | 1 | 124 | Mean Difference (IV, Random, 95% CI) | ‐0.35 [‐0.56, ‐0.14] |
| 31 Night wake duration Show forest plot | 1 | Mean Difference (IV, Random, 95% CI) | Subtotals only | |
| Analysis 1.31 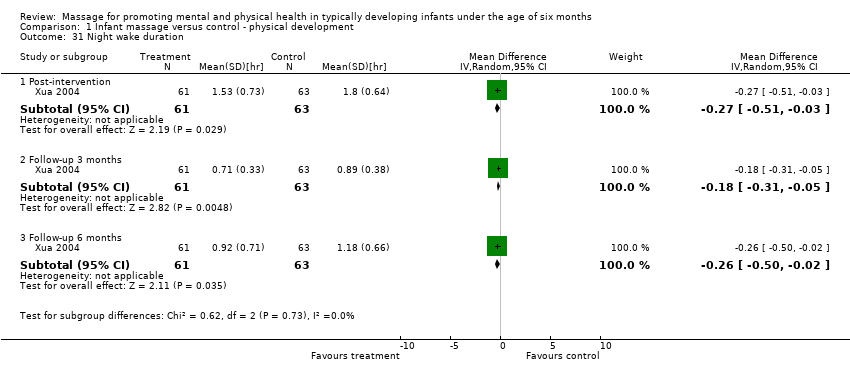 Comparison 1 Infant massage versus control ‐ physical development, Outcome 31 Night wake duration. | ||||
| 31.1 Post‐intervention | 1 | 124 | Mean Difference (IV, Random, 95% CI) | ‐0.27 [‐0.51, ‐0.03] |
| 31.2 Follow‐up 3 months | 1 | 124 | Mean Difference (IV, Random, 95% CI) | ‐0.18 [‐0.31, ‐0.05] |
| 31.3 Follow‐up 6 months | 1 | 124 | Mean Difference (IV, Random, 95% CI) | ‐0.26 [‐0.50, ‐0.02] |
| 32 Blood flow (post intervention) Show forest plot | 1 | Mean Difference (IV, Random, 95% CI) | Subtotals only | |
| Analysis 1.32 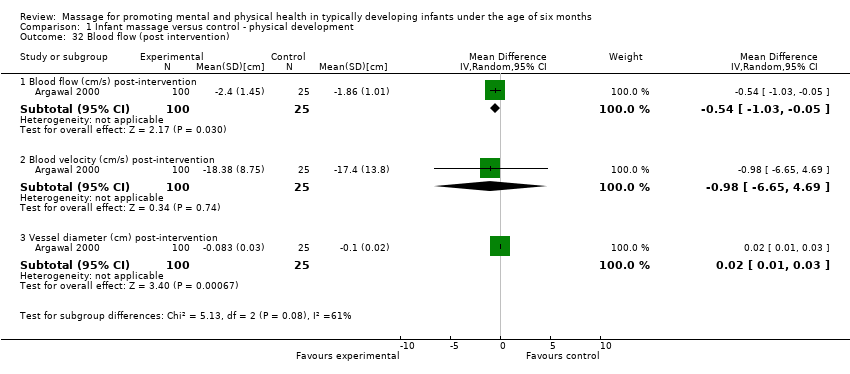 Comparison 1 Infant massage versus control ‐ physical development, Outcome 32 Blood flow (post intervention). | ||||
| 32.1 Blood flow (cm/s) post‐intervention | 1 | 125 | Mean Difference (IV, Random, 95% CI) | ‐0.54 [‐1.03, ‐0.05] |
| 32.2 Blood velocity (cm/s) post‐intervention | 1 | 125 | Mean Difference (IV, Random, 95% CI) | ‐0.98 [‐6.65, 4.69] |
| 32.3 Vessel diameter (cm) post‐intervention | 1 | 125 | Mean Difference (IV, Random, 95% CI) | 0.02 [0.01, 0.03] |
| 33 Formula intake Show forest plot | 1 | Mean Difference (IV, Random, 95% CI) | Subtotals only | |
| Analysis 1.33  Comparison 1 Infant massage versus control ‐ physical development, Outcome 33 Formula intake. | ||||
| 33.1 Post‐intervention (US fl oz converted to ml) | 1 | 40 | Mean Difference (IV, Random, 95% CI) | 70.97 [6.16, 135.78] |
| 34 Illness Show forest plot | 2 | Risk Ratio (M‐H, Random, 95% CI) | Subtotals only | |
| Analysis 1.34  Comparison 1 Infant massage versus control ‐ physical development, Outcome 34 Illness. | ||||
| 34.1 URTI (post intervention) | 2 | 310 | Risk Ratio (M‐H, Random, 95% CI) | 1.19 [0.86, 1.65] |
| 34.2 Anaemia (post intervention) | 2 | 310 | Risk Ratio (M‐H, Random, 95% CI) | 1.49 [0.79, 2.82] |
| 34.3 Diarrhoea (post intervention) | 2 | 310 | Risk Ratio (M‐H, Random, 95% CI) | 0.39 [0.20, 0.76] |
| 35 Illness and clinic visits Show forest plot | 1 | Mean Difference (IV, Random, 95% CI) | Subtotals only | |
| Analysis 1.35  Comparison 1 Infant massage versus control ‐ physical development, Outcome 35 Illness and clinic visits. | ||||
| 35.1 Illness follow‐up 6 months | 1 | 45 | Mean Difference (IV, Random, 95% CI) | ‐8.82 [‐10.62, ‐7.02] |
| 35.2 Clinic visits follow‐up 6 months | 1 | 45 | Mean Difference (IV, Random, 95% CI) | ‐5.98 [‐7.07, ‐4.89] |
| Outcome or subgroup title | No. of studies | No. of participants | Statistical method | Effect size |
| 1 Infant temperament meta‐analyses Show forest plot | 3 | Std. Mean Difference (IV, Random, 95% CI) | Subtotals only | |
| Analysis 2.1  Comparison 2 Infant massage versus control ‐ mental health and development, Outcome 1 Infant temperament meta‐analyses. | ||||
| 1.1 Activity (post‐intervention) | 3 | 121 | Std. Mean Difference (IV, Random, 95% CI) | 0.39 [‐0.34, 1.13] |
| 1.2 Persistence (post‐intervention) | 2 | 81 | Std. Mean Difference (IV, Random, 95% CI) | 0.24 [‐0.20, 0.67] |
| 1.3 Soothability (post‐intervention) | 2 | 80 | Std. Mean Difference (IV, Random, 95% CI) | ‐0.30 [‐0.94, 0.35] |
| 2 Infant temperament (CCTI) post intervention Show forest plot | 1 | Mean Difference (IV, Random, 95% CI) | Subtotals only | |
| Analysis 2.2 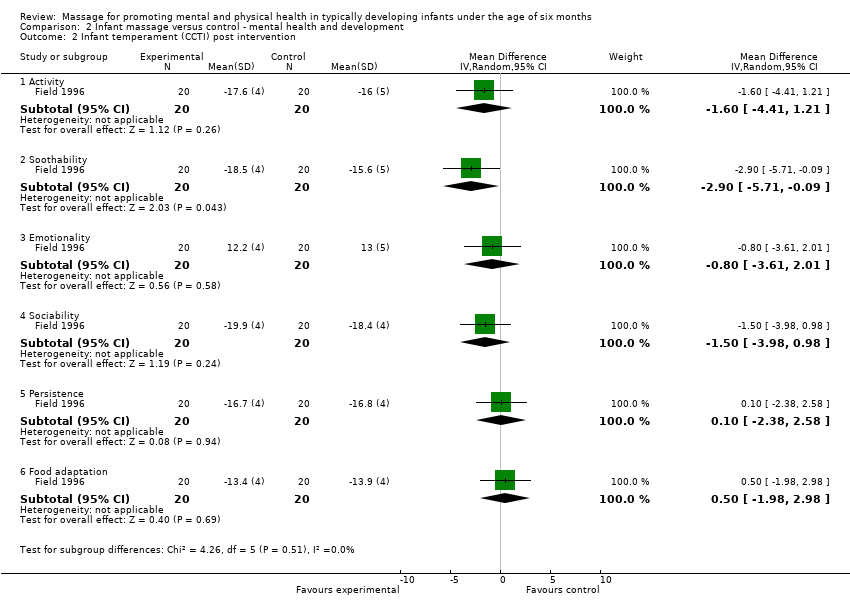 Comparison 2 Infant massage versus control ‐ mental health and development, Outcome 2 Infant temperament (CCTI) post intervention. | ||||
| 2.1 Activity | 1 | 40 | Mean Difference (IV, Random, 95% CI) | ‐1.60 [‐4.41, 1.21] |
| 2.2 Soothability | 1 | 40 | Mean Difference (IV, Random, 95% CI) | ‐2.90 [‐5.71, ‐0.09] |
| 2.3 Emotionality | 1 | 40 | Mean Difference (IV, Random, 95% CI) | ‐0.80 [‐3.61, 2.01] |
| 2.4 Sociability | 1 | 40 | Mean Difference (IV, Random, 95% CI) | ‐1.5 [‐3.98, 0.98] |
| 2.5 Persistence | 1 | 40 | Mean Difference (IV, Random, 95% CI) | 0.10 [‐2.38, 2.58] |
| 2.6 Food adaptation | 1 | 40 | Mean Difference (IV, Random, 95% CI) | 0.5 [‐1.98, 2.98] |
| 3 Infant temperament (Infant behaviour questionnaire (IBQ) post intervention) Show forest plot | 1 | Mean Difference (IV, Random, 95% CI) | Subtotals only | |
| Analysis 2.3  Comparison 2 Infant massage versus control ‐ mental health and development, Outcome 3 Infant temperament (Infant behaviour questionnaire (IBQ) post intervention). | ||||
| 3.1 Activity | 1 | 40 | Mean Difference (IV, Random, 95% CI) | 0.56 [0.08, 1.04] |
| 3.2 Soothability | 1 | 40 | Mean Difference (IV, Random, 95% CI) | 0.03 [‐0.59, 0.65] |
| 3.3 Duration of orienting | 1 | 40 | Mean Difference (IV, Random, 95% CI) | 0.0 [‐0.82, 0.82] |
| 3.4 Distress to limitations | 1 | 40 | Mean Difference (IV, Random, 95% CI) | ‐0.08 [‐0.49, 0.33] |
| 3.5 Fear | 1 | 40 | Mean Difference (IV, Random, 95% CI) | ‐0.06 [‐0.63, 0.51] |
| 3.6 Amount of smiling | 1 | 40 | Mean Difference (IV, Random, 95% CI) | 0.30 [‐0.14, 0.74] |
| 4 Infant temperament questionnaire (revised RITQ (Carey)) post‐intervention 4 months Show forest plot | 1 | Mean Difference (IV, Random, 95% CI) | Subtotals only | |
| Analysis 2.4  Comparison 2 Infant massage versus control ‐ mental health and development, Outcome 4 Infant temperament questionnaire (revised RITQ (Carey)) post‐intervention 4 months. | ||||
| 4.1 Activity | 1 | 41 | Mean Difference (IV, Random, 95% CI) | 0.41 [0.11, 0.71] |
| 4.2 Rhythmicity | 1 | 41 | Mean Difference (IV, Random, 95% CI) | ‐0.19 [‐0.63, 0.25] |
| 4.3 Approach | 1 | 41 | Mean Difference (IV, Random, 95% CI) | 0.17 [‐0.18, 0.52] |
| 4.4 Adaptability | 1 | 41 | Mean Difference (IV, Random, 95% CI) | 0.10 [‐0.30, 0.50] |
| 4.5 Intensity | 1 | 41 | Mean Difference (IV, Random, 95% CI) | 0.19 [‐0.28, 0.66] |
| 4.6 Mood | 1 | 41 | Mean Difference (IV, Random, 95% CI) | 0.31 [‐0.14, 0.76] |
| 4.7 Persistence | 1 | 41 | Mean Difference (IV, Random, 95% CI) | 0.33 [‐0.11, 0.77] |
| 4.8 Distractibility | 1 | 41 | Mean Difference (IV, Random, 95% CI) | 0.28 [‐0.18, 0.74] |
| 4.9 Threshold | 1 | 41 | Mean Difference (IV, Random, 95% CI) | 0.11 [‐0.43, 0.65] |
| 5 Infant temperament questionnaire (revised RITQ (Carey)) follow‐up 8 months Show forest plot | 1 | 369 | Mean Difference (IV, Random, 95% CI) | 0.66 [0.48, 0.84] |
| Analysis 2.5  Comparison 2 Infant massage versus control ‐ mental health and development, Outcome 5 Infant temperament questionnaire (revised RITQ (Carey)) follow‐up 8 months. | ||||
| 5.1 Activity | 1 | 41 | Mean Difference (IV, Random, 95% CI) | 0.25 [‐0.33, 0.83] |
| 5.2 Rhythmicity | 1 | 41 | Mean Difference (IV, Random, 95% CI) | 0.80 [0.12, 1.48] |
| 5.3 Approach | 1 | 41 | Mean Difference (IV, Random, 95% CI) | 0.88 [0.25, 1.51] |
| 5.4 Adaptability | 1 | 41 | Mean Difference (IV, Random, 95% CI) | 0.69 [0.01, 1.37] |
| 5.5 Intensity | 1 | 41 | Mean Difference (IV, Random, 95% CI) | 0.39 [0.02, 0.76] |
| 5.6 Mood | 1 | 41 | Mean Difference (IV, Random, 95% CI) | 1.08 [0.65, 1.51] |
| 5.7 Persistence | 1 | 41 | Mean Difference (IV, Random, 95% CI) | 0.65 [‐0.03, 1.33] |
| 5.8 Distractibility | 1 | 41 | Mean Difference (IV, Random, 95% CI) | 0.72 [0.32, 1.12] |
| 5.9 Threshold | 1 | 41 | Mean Difference (IV, Random, 95% CI) | 0.48 [‐0.27, 1.23] |
| 6 Infant Care Questionnaire post‐intervention Show forest plot | 1 | Mean Difference (IV, Random, 95% CI) | Subtotals only | |
| Analysis 2.6 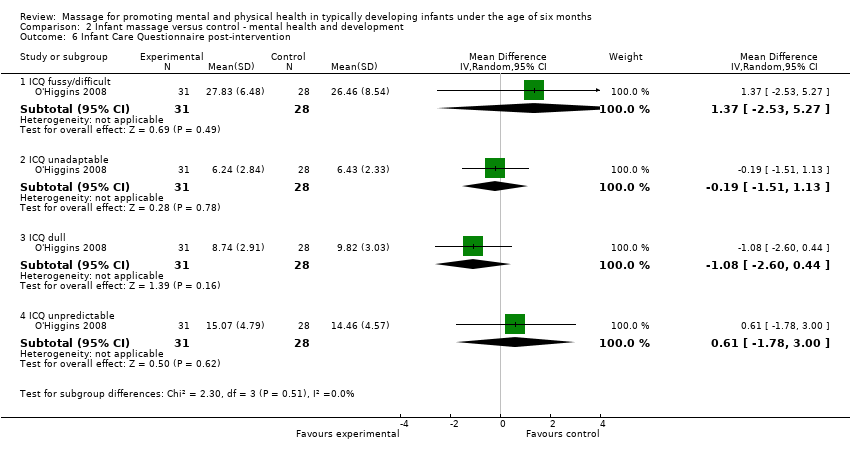 Comparison 2 Infant massage versus control ‐ mental health and development, Outcome 6 Infant Care Questionnaire post‐intervention. | ||||
| 6.1 ICQ fussy/difficult | 1 | 59 | Mean Difference (IV, Random, 95% CI) | 1.37 [‐2.53, 5.27] |
| 6.2 ICQ unadaptable | 1 | 59 | Mean Difference (IV, Random, 95% CI) | ‐0.19 [‐1.51, 1.13] |
| 6.3 ICQ dull | 1 | 59 | Mean Difference (IV, Random, 95% CI) | ‐1.08 [‐2.60, 0.44] |
| 6.4 ICQ unpredictable | 1 | 59 | Mean Difference (IV, Random, 95% CI) | 0.61 [‐1.78, 3.00] |
| 7 Infant Care Questionnaire follow‐up 1 year Show forest plot | 1 | Mean Difference (IV, Random, 95% CI) | Subtotals only | |
| Analysis 2.7 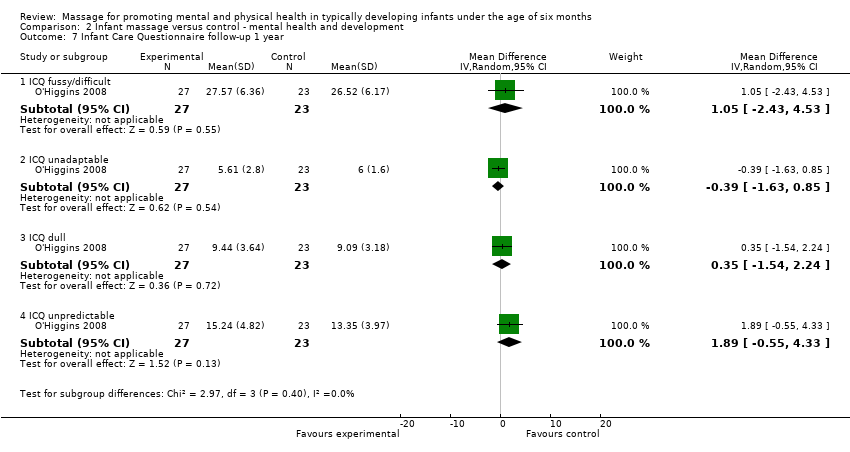 Comparison 2 Infant massage versus control ‐ mental health and development, Outcome 7 Infant Care Questionnaire follow‐up 1 year. | ||||
| 7.1 ICQ fussy/difficult | 1 | 50 | Mean Difference (IV, Random, 95% CI) | 1.05 [‐2.43, 4.53] |
| 7.2 ICQ unadaptable | 1 | 50 | Mean Difference (IV, Random, 95% CI) | ‐0.39 [‐1.63, 0.85] |
| 7.3 ICQ dull | 1 | 50 | Mean Difference (IV, Random, 95% CI) | 0.35 [‐1.54, 2.24] |
| 7.4 ICQ unpredictable | 1 | 50 | Mean Difference (IV, Random, 95% CI) | 1.89 [‐0.55, 4.33] |
| 8 Infant attachment (Q set) Show forest plot | 1 | Mean Difference (IV, Random, 95% CI) | Subtotals only | |
| Analysis 2.8  Comparison 2 Infant massage versus control ‐ mental health and development, Outcome 8 Infant attachment (Q set). | ||||
| 8.1 Follow‐up 1 year | 1 | 39 | Mean Difference (IV, Random, 95% CI) | ‐0.06 [‐0.17, 0.05] |
| 9 Child behaviour (HOME) Show forest plot | 1 | Mean Difference (IV, Random, 95% CI) | Subtotals only | |
| Analysis 2.9  Comparison 2 Infant massage versus control ‐ mental health and development, Outcome 9 Child behaviour (HOME). | ||||
| 9.1 Follow‐up (24 months) | 1 | 25 | Mean Difference (IV, Random, 95% CI) | 0.34 [‐1.92, 2.60] |
| 10 Eyberg Child Behaviour Inventory (ECBI) ‐ Intensity domain Show forest plot | 1 | Mean Difference (IV, Random, 95% CI) | Subtotals only | |
| Analysis 2.10 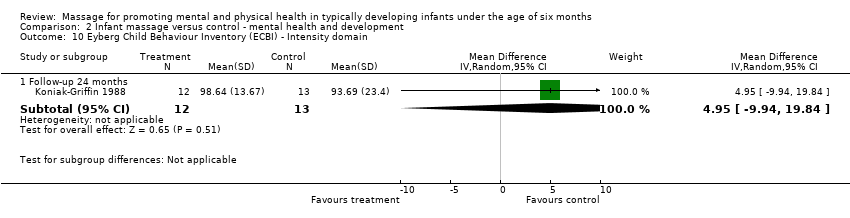 Comparison 2 Infant massage versus control ‐ mental health and development, Outcome 10 Eyberg Child Behaviour Inventory (ECBI) ‐ Intensity domain. | ||||
| 10.1 Follow‐up 24 months | 1 | 25 | Mean Difference (IV, Random, 95% CI) | 4.95 [‐9.94, 19.84] |
| 11 Eyberg Child Behaviour Inventory (ECBI) ‐ Problem domain Show forest plot | 1 | 25 | Mean Difference (IV, Random, 95% CI) | ‐0.19 [‐3.26, 2.88] |
| Analysis 2.11  Comparison 2 Infant massage versus control ‐ mental health and development, Outcome 11 Eyberg Child Behaviour Inventory (ECBI) ‐ Problem domain. | ||||
| 11.1 Follow‐up 24 months | 1 | 25 | Mean Difference (IV, Random, 95% CI) | ‐0.19 [‐3.26, 2.88] |
| 12 Mother and child interaction meta‐analysis ‐ Total NCATS and Murray Global Show forest plot | 4 | Std. Mean Difference (IV, Random, 95% CI) | Subtotals only | |
| Analysis 2.12 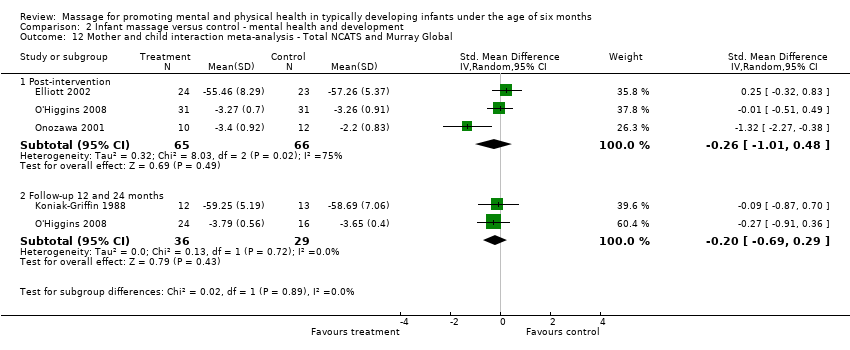 Comparison 2 Infant massage versus control ‐ mental health and development, Outcome 12 Mother and child interaction meta‐analysis ‐ Total NCATS and Murray Global. | ||||
| 12.1 Post‐intervention | 3 | 131 | Std. Mean Difference (IV, Random, 95% CI) | ‐0.26 [‐1.01, 0.48] |
| 12.2 Follow‐up 12 and 24 months | 2 | 65 | Std. Mean Difference (IV, Random, 95% CI) | ‐0.20 [‐0.69, 0.29] |
| 13 Nursing Child Feeding Assessment Scale (NCAFS) ‐ Total Show forest plot | 1 | Mean Difference (IV, Random, 95% CI) | Subtotals only | |
| Analysis 2.13  Comparison 2 Infant massage versus control ‐ mental health and development, Outcome 13 Nursing Child Feeding Assessment Scale (NCAFS) ‐ Total. | ||||
| 13.1 Post‐intervention (16 weeks) | 1 | 47 | Mean Difference (IV, Random, 95% CI) | ‐2.10 [‐6.16, 1.96] |
| 14 Nursing Child Assessment Teaching Scale (NCATS) ‐ Mother Show forest plot | 1 | Std. Mean Difference (IV, Random, 95% CI) | Subtotals only | |
| Analysis 2.14  Comparison 2 Infant massage versus control ‐ mental health and development, Outcome 14 Nursing Child Assessment Teaching Scale (NCATS) ‐ Mother. | ||||
| 14.1 Follow‐up 24 months | 1 | 25 | Std. Mean Difference (IV, Random, 95% CI) | ‐0.18 [‐0.96, 0.61] |
| 15 Nursing Child Assessment Teaching Scale (NCATS) ‐ Child Show forest plot | 1 | 25 | Std. Mean Difference (IV, Random, 95% CI) | 0.35 [‐0.44, 1.14] |
| Analysis 2.15  Comparison 2 Infant massage versus control ‐ mental health and development, Outcome 15 Nursing Child Assessment Teaching Scale (NCATS) ‐ Child. | ||||
| 15.1 Follow‐up 24 months | 1 | 25 | Std. Mean Difference (IV, Random, 95% CI) | 0.35 [‐0.44, 1.14] |
| 16 Maternal sensitivity ‐ warm to cold (Murray) Show forest plot | 2 | Mean Difference (IV, Random, 95% CI) | Subtotals only | |
| Analysis 2.16 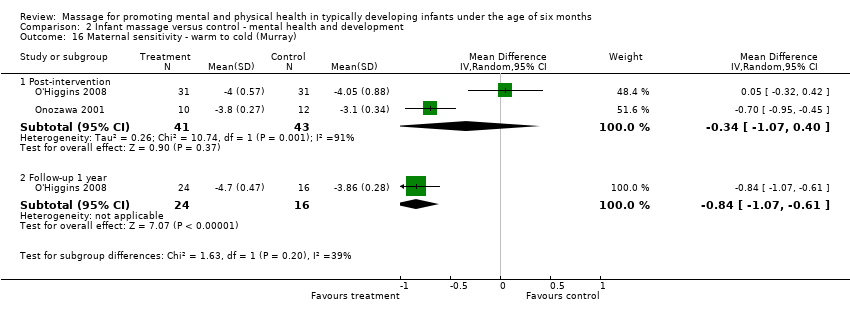 Comparison 2 Infant massage versus control ‐ mental health and development, Outcome 16 Maternal sensitivity ‐ warm to cold (Murray). | ||||
| 16.1 Post‐intervention | 2 | 84 | Mean Difference (IV, Random, 95% CI) | ‐0.34 [‐1.07, 0.40] |
| 16.2 Follow‐up 1 year | 1 | 40 | Mean Difference (IV, Random, 95% CI) | ‐0.84 [‐1.07, ‐0.61] |
| 17 Maternal sensitivity ‐ non‐intrusive to intrusive (Murray) Show forest plot | 2 | Mean Difference (IV, Random, 95% CI) | Subtotals only | |
| Analysis 2.17 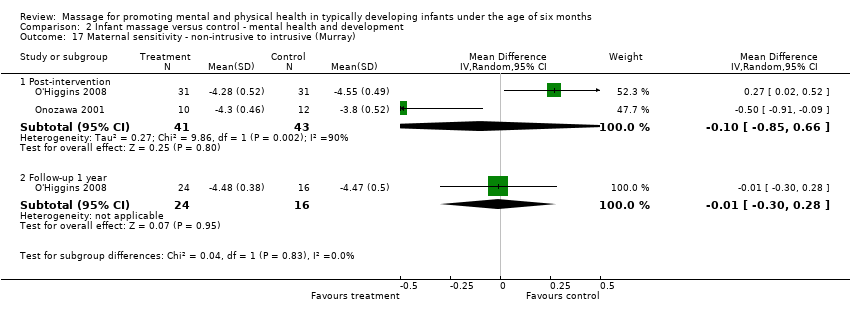 Comparison 2 Infant massage versus control ‐ mental health and development, Outcome 17 Maternal sensitivity ‐ non‐intrusive to intrusive (Murray). | ||||
| 17.1 Post‐intervention | 2 | 84 | Mean Difference (IV, Random, 95% CI) | ‐0.10 [‐0.85, 0.66] |
| 17.2 Follow‐up 1 year | 1 | 40 | Mean Difference (IV, Random, 95% CI) | ‐0.01 [‐0.30, 0.28] |
| 18 Maternal sensitivity ‐ remoteness (Murray) Show forest plot | 1 | Mean Difference (IV, Random, 95% CI) | Subtotals only | |
| Analysis 2.18  Comparison 2 Infant massage versus control ‐ mental health and development, Outcome 18 Maternal sensitivity ‐ remoteness (Murray). | ||||
| 18.1 Post‐intervention | 1 | 40 | Mean Difference (IV, Random, 95% CI) | 0.08 [‐0.32, 0.48] |
| 18.2 Follow‐up | 1 | 62 | Mean Difference (IV, Random, 95% CI) | ‐0.14 [‐0.40, 0.12] |
| 19 Infant interactions ‐ infant performance ‐ attentive to non attentive (Murray) Show forest plot | 2 | Mean Difference (IV, Random, 95% CI) | Subtotals only | |
| Analysis 2.19  Comparison 2 Infant massage versus control ‐ mental health and development, Outcome 19 Infant interactions ‐ infant performance ‐ attentive to non attentive (Murray). | ||||
| 19.1 Post‐intervention | 2 | 84 | Mean Difference (IV, Random, 95% CI) | ‐0.47 [‐1.47, 0.52] |
| 19.2 Follow‐up 1 year | 1 | 40 | Mean Difference (IV, Random, 95% CI) | 0.18 [‐0.18, 0.54] |
| 20 Infant interactions ‐ lively to inert (Murray) Show forest plot | 2 | Mean Difference (IV, Random, 95% CI) | Subtotals only | |
| Analysis 2.20  Comparison 2 Infant massage versus control ‐ mental health and development, Outcome 20 Infant interactions ‐ lively to inert (Murray). | ||||
| 20.1 Post‐intervention | 2 | 84 | Mean Difference (IV, Random, 95% CI) | ‐0.46 [‐1.45, 0.53] |
| 20.2 Follow‐up 1 year | 1 | 40 | Mean Difference (IV, Random, 95% CI) | ‐0.11 [‐0.31, 0.09] |
| 21 Infant interactions ‐ happy to distressed (Murray) Show forest plot | 2 | Mean Difference (IV, Random, 95% CI) | Subtotals only | |
| Analysis 2.21  Comparison 2 Infant massage versus control ‐ mental health and development, Outcome 21 Infant interactions ‐ happy to distressed (Murray). | ||||
| 21.1 Post intervention | 2 | 84 | Mean Difference (IV, Random, 95% CI) | ‐0.35 [‐1.29, 0.59] |
| 21.2 Follow‐up 1 year | 1 | 40 | Mean Difference (IV, Random, 95% CI) | ‐0.02 [‐0.26, 0.22] |
| 22 Parenting stress (PSI Abidin) child characteristics subscale Show forest plot | 2 | Mean Difference (IV, Random, 95% CI) | Subtotals only | |
| Analysis 2.22  Comparison 2 Infant massage versus control ‐ mental health and development, Outcome 22 Parenting stress (PSI Abidin) child characteristics subscale. | ||||
| 22.1 Post‐intervention | 2 | 55 | Mean Difference (IV, Random, 95% CI) | ‐10.85 [‐53.86, 32.16] |
| 23 Psychomotor Development Indices (PDI) meta‐analysis post‐intervention Show forest plot | 4 | Std. Mean Difference (IV, Random, 95% CI) | Subtotals only | |
| Analysis 2.23 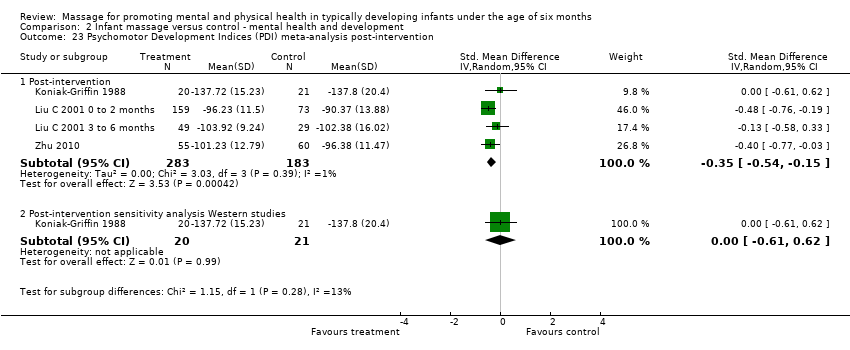 Comparison 2 Infant massage versus control ‐ mental health and development, Outcome 23 Psychomotor Development Indices (PDI) meta‐analysis post‐intervention. | ||||
| 23.1 Post‐intervention | 4 | 466 | Std. Mean Difference (IV, Random, 95% CI) | ‐0.35 [‐0.54, ‐0.15] |
| 23.2 Post‐intervention sensitivity analysis Western studies | 1 | 41 | Std. Mean Difference (IV, Random, 95% CI) | 0.00 [‐0.61, 0.62] |
| 24 Bayley Psychomotor Development Index (PDI) follow‐up Show forest plot | 1 | Mean Difference (IV, Random, 95% CI) | Subtotals only | |
| Analysis 2.24 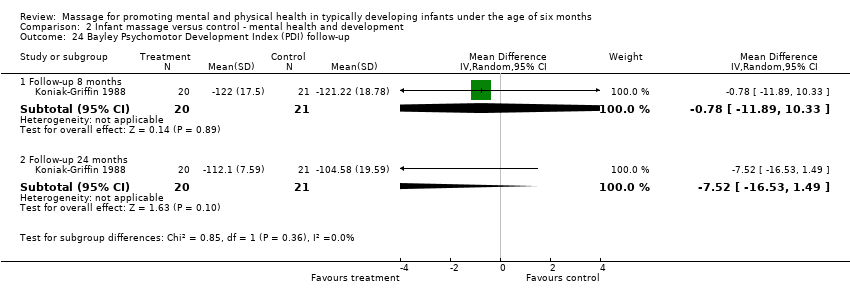 Comparison 2 Infant massage versus control ‐ mental health and development, Outcome 24 Bayley Psychomotor Development Index (PDI) follow‐up. | ||||
| 24.1 Follow‐up 8 months | 1 | 41 | Mean Difference (IV, Random, 95% CI) | ‐0.78 [‐11.89, 10.33] |
| 24.2 Follow‐up 24 months | 1 | 41 | Mean Difference (IV, Random, 95% CI) | ‐7.52 [‐16.53, 1.49] |
| 25 Mental Development Indices (MDI) meta‐analysis post‐intervention Show forest plot | 4 | Std. Mean Difference (IV, Random, 95% CI) | Subtotals only | |
| Analysis 2.25  Comparison 2 Infant massage versus control ‐ mental health and development, Outcome 25 Mental Development Indices (MDI) meta‐analysis post‐intervention. | ||||
| 25.1 Post‐intervention | 4 | 466 | Std. Mean Difference (IV, Random, 95% CI) | ‐0.27 [‐0.64, 0.11] |
| 25.2 Post‐intervention sensitivity analysis Western studies | 1 | 41 | Std. Mean Difference (IV, Random, 95% CI) | 0.38 [‐0.23, 1.00] |
| 26 Bayley Mental Development Index (MDI) follow‐up Show forest plot | 1 | Mean Difference (IV, Random, 95% CI) | Subtotals only | |
| Analysis 2.26  Comparison 2 Infant massage versus control ‐ mental health and development, Outcome 26 Bayley Mental Development Index (MDI) follow‐up. | ||||
| 26.1 Follow‐up 8 months | 1 | 41 | Mean Difference (IV, Random, 95% CI) | 22.85 [4.26, 41.44] |
| 26.2 Follow‐up 24 months | 1 | 41 | Mean Difference (IV, Random, 95% CI) | ‐8.59 [‐18.80, 1.62] |
| 27 Gessel/Capital meta‐analysis (post intervention) Show forest plot | 2 | Std. Mean Difference (IV, Random, 95% CI) | Subtotals only | |
| Analysis 2.27  Comparison 2 Infant massage versus control ‐ mental health and development, Outcome 27 Gessel/Capital meta‐analysis (post intervention). | ||||
| 27.1 Gross motor | 2 | 237 | Std. Mean Difference (IV, Random, 95% CI) | ‐0.44 [‐0.70, ‐0.18] |
| 27.2 Fine motor | 2 | 237 | Std. Mean Difference (IV, Random, 95% CI) | ‐0.61 [‐0.87, ‐0.35] |
| 27.3 Language | 2 | 237 | Std. Mean Difference (IV, Random, 95% CI) | ‐0.82 [‐1.67, 0.03] |
| 27.4 Personal‐social behaviour | 2 | 237 | Std. Mean Difference (IV, Random, 95% CI) | ‐0.90 [‐1.61, ‐0.18] |
| 28 Gessel Developmental Quotient (post intervention) Show forest plot | 1 | Mean Difference (IV, Random, 95% CI) | Subtotals only | |
| Analysis 2.28  Comparison 2 Infant massage versus control ‐ mental health and development, Outcome 28 Gessel Developmental Quotient (post intervention). | ||||
| 28.1 Adaptive behaviour | 1 | 180 | Mean Difference (IV, Random, 95% CI) | ‐7.07 [‐9.75, ‐4.39] |
| 28.2 Gross motor | 1 | 180 | Mean Difference (IV, Random, 95% CI) | ‐3.97 [‐6.99, ‐0.95] |
| 28.3 Fine motor | 1 | 180 | Mean Difference (IV, Random, 95% CI) | ‐6.89 [‐10.18, ‐3.60] |
| 28.4 Language | 1 | 180 | Mean Difference (IV, Random, 95% CI) | ‐4.15 [‐7.03, ‐1.27] |
| 28.5 Personal‐social behaviour | 1 | 180 | Mean Difference (IV, Random, 95% CI) | ‐6.41 [‐9.65, ‐3.17] |
| 29 Capital institute Mental Checklist (post intervention) Show forest plot | 1 | Mean Difference (IV, Random, 95% CI) | Subtotals only | |
| Analysis 2.29 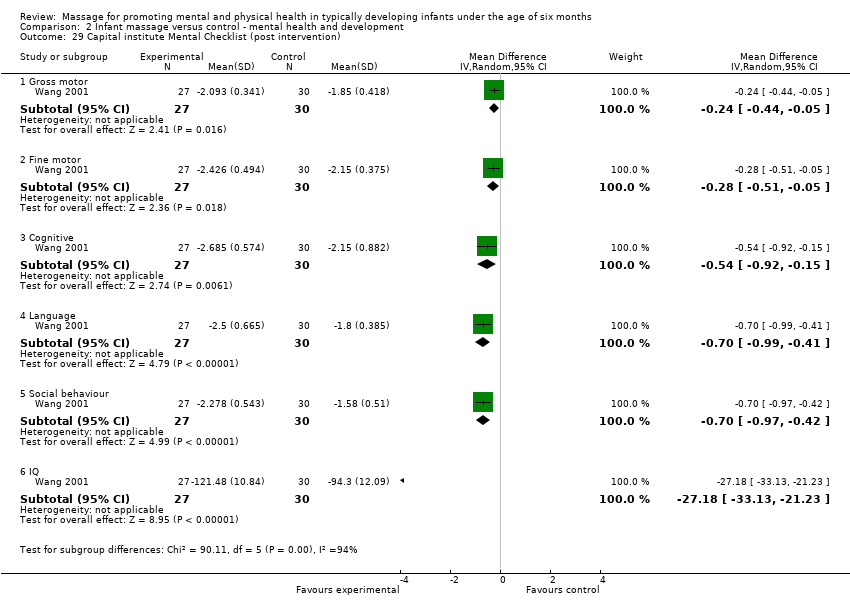 Comparison 2 Infant massage versus control ‐ mental health and development, Outcome 29 Capital institute Mental Checklist (post intervention). | ||||
| 29.1 Gross motor | 1 | 57 | Mean Difference (IV, Random, 95% CI) | ‐0.24 [‐0.44, ‐0.05] |
| 29.2 Fine motor | 1 | 57 | Mean Difference (IV, Random, 95% CI) | ‐0.28 [‐0.51, ‐0.05] |
| 29.3 Cognitive | 1 | 57 | Mean Difference (IV, Random, 95% CI) | ‐0.54 [‐0.92, ‐0.15] |
| 29.4 Language | 1 | 57 | Mean Difference (IV, Random, 95% CI) | ‐0.7 [‐0.99, ‐0.41] |
| 29.5 Social behaviour | 1 | 57 | Mean Difference (IV, Random, 95% CI) | ‐0.70 [‐0.97, ‐0.42] |
| 29.6 IQ | 1 | 57 | Mean Difference (IV, Random, 95% CI) | ‐27.18 [‐33.13, ‐21.23] |
| 30 Gessel Developmental Quotient (follow‐up 6 months) Show forest plot | 1 | Mean Difference (IV, Random, 95% CI) | Subtotals only | |
| Analysis 2.30  Comparison 2 Infant massage versus control ‐ mental health and development, Outcome 30 Gessel Developmental Quotient (follow‐up 6 months). | ||||
| 30.1 Adaptive behaviour | 1 | 116 | Mean Difference (IV, Random, 95% CI) | ‐5.79 [‐9.64, ‐1.94] |
| 30.2 Gross motor | 1 | 116 | Mean Difference (IV, Random, 95% CI) | ‐2.85 [‐8.18, 2.48] |
| 30.3 Fine motor | 1 | 116 | Mean Difference (IV, Random, 95% CI) | ‐8.12 [‐11.67, ‐4.57] |
| 30.4 Language | 1 | 116 | Mean Difference (IV, Random, 95% CI) | ‐7.90 [‐11.70, ‐4.10] |
| 30.5 Personal‐social behaviour | 1 | 116 | Mean Difference (IV, Random, 95% CI) | ‐6.19 [‐9.83, ‐2.55] |
| 31 Attachment patterns (strange situation procedure) Show forest plot | 1 | Risk Ratio (M‐H, Random, 95% CI) | Subtotals only | |
| Analysis 2.31  Comparison 2 Infant massage versus control ‐ mental health and development, Outcome 31 Attachment patterns (strange situation procedure). | ||||
| 31.1 Secure (1 year follow‐up) | 1 | 39 | Risk Ratio (M‐H, Random, 95% CI) | 0.82 [0.50, 1.34] |
| 31.2 Avoidant (1 year follow‐up) | 1 | 39 | Risk Ratio (M‐H, Random, 95% CI) | 1.39 [0.14, 14.07] |
| 31.3 Resistant (1 year follow‐up) | 1 | 39 | Risk Ratio (M‐H, Random, 95% CI) | 3.48 [0.45, 27.02] |
| 31.4 Disorganised (1 year follow‐up) | 1 | 39 | Risk Ratio (M‐H, Random, 95% CI) | 0.70 [0.16, 3.02] |
| 32 Distractibility (toy) follow‐up 1 year Show forest plot | 1 | Risk Ratio (M‐H, Random, 95% CI) | Subtotals only | |
| Analysis 2.32  Comparison 2 Infant massage versus control ‐ mental health and development, Outcome 32 Distractibility (toy) follow‐up 1 year. | ||||
| 32.1 Mean looks greater than 14 secs | 1 | 32 | Risk Ratio (M‐H, Random, 95% CI) | 2.65 [0.31, 22.82] |
| 32.2 Mean looks less than 14 secs | 1 | 32 | Risk Ratio (M‐H, Random, 95% CI) | 0.88 [0.68, 1.14] |
| 32.3 Max looks greater than 14 secs | 1 | 32 | Risk Ratio (M‐H, Random, 95% CI) | 0.96 [0.66, 1.38] |
| 32.4 Max looks less than 14 secs | 1 | 32 | Risk Ratio (M‐H, Random, 95% CI) | 1.76 [0.37, 8.31] |
| 33 Habituation Show forest plot | 1 | 32 | Mean Difference (IV, Random, 95% CI) | ‐1.10 [‐4.79, 2.59] |
| Analysis 2.33  Comparison 2 Infant massage versus control ‐ mental health and development, Outcome 33 Habituation. | ||||
| 34 Seconds to habituation Show forest plot | 1 | 32 | Mean Difference (IV, Random, 95% CI) | ‐10.90 [‐69.41, 47.61] |
| Analysis 2.34  Comparison 2 Infant massage versus control ‐ mental health and development, Outcome 34 Seconds to habituation. | ||||
| 35 Trials to habituation Show forest plot | 1 | Mean Difference (IV, Random, 95% CI) | Subtotals only | |
| Analysis 2.35  Comparison 2 Infant massage versus control ‐ mental health and development, Outcome 35 Trials to habituation. | ||||
| 36 Post habituation Show forest plot | 1 | 32 | Mean Difference (IV, Random, 95% CI) | 2.0 [‐2.43, 6.43] |
| Analysis 2.36  Comparison 2 Infant massage versus control ‐ mental health and development, Outcome 36 Post habituation. | ||||
| 37 Habituation test Show forest plot | 1 | 32 | Mean Difference (IV, Random, 95% CI) | ‐12.40 [‐19.37, ‐5.43] |
| Analysis 2.37 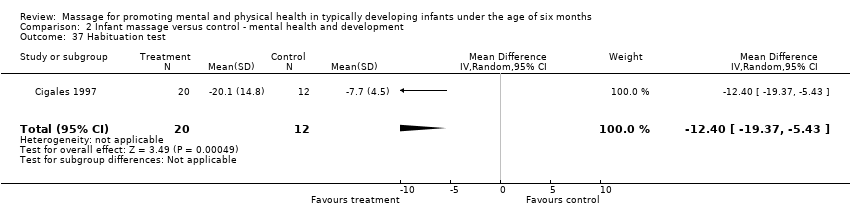 Comparison 2 Infant massage versus control ‐ mental health and development, Outcome 37 Habituation test. | ||||

'Risk of bias' summary: review authors' judgements about each risk of bias item for each included study
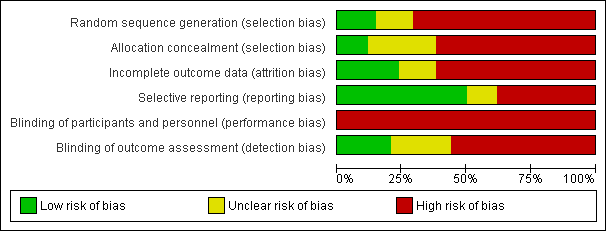
'Risk of bias' graph: review authors' judgements about each risk of bias item presented as percentages across all included studies
Comparison 1 Infant massage versus control ‐ physical development, Outcome 1 Weight.
Comparison 1 Infant massage versus control ‐ physical development, Outcome 2 Weight: subgroup analyses (duration of intervention).
Comparison 1 Infant massage versus control ‐ physical development, Outcome 3 Length.
Comparison 1 Infant massage versus control ‐ physical development, Outcome 4 Length: subgroup analyses (duration of intervention).
Comparison 1 Infant massage versus control ‐ physical development, Outcome 5 Head circumference.
Comparison 1 Infant massage versus control ‐ physical development, Outcome 6 Head circumference: subgroup analyses (duration of intervention).
Comparison 1 Infant massage versus control ‐ physical development, Outcome 7 Mid arm circumference.
Comparison 1 Infant massage versus control ‐ physical development, Outcome 8 Mid leg/thigh circumference.
Comparison 1 Infant massage versus control ‐ physical development, Outcome 9 Abdominal circumference.
Comparison 1 Infant massage versus control ‐ physical development, Outcome 10 Chest circumference.
Comparison 1 Infant massage versus control ‐ physical development, Outcome 11 Hormones: cortisol.
Comparison 1 Infant massage versus control ‐ physical development, Outcome 12 Hormones: norepinephrine.
Comparison 1 Infant massage versus control ‐ physical development, Outcome 13 Hormones: epinephrine.
Comparison 1 Infant massage versus control ‐ physical development, Outcome 14 Hormones: serotonin.
Comparison 1 Infant massage versus control ‐ physical development, Outcome 15 Hormones: 6‐sulphatoxymelatonin secretion.
Comparison 1 Infant massage versus control ‐ physical development, Outcome 16 Biochemical markers: Bilirubin (7 days PN).
Comparison 1 Infant massage versus control ‐ physical development, Outcome 17 Crying or fussing time.
Comparison 1 Infant massage versus control ‐ physical development, Outcome 18 Crying frequency (times).
Comparison 1 Infant massage versus control ‐ physical development, Outcome 19 Sleep/wake behaviours (Thoman).
Comparison 1 Infant massage versus control ‐ physical development, Outcome 20 Behavioural state immediately post‐intervention (Thoman).
Comparison 1 Infant massage versus control ‐ physical development, Outcome 21 Sleep duration over 24hr period.
Comparison 1 Infant massage versus control ‐ physical development, Outcome 22 Mean increase in 24h sleep.
Comparison 1 Infant massage versus control ‐ physical development, Outcome 23 Mean increase in duration of night sleep.
Comparison 1 Infant massage versus control ‐ physical development, Outcome 24 Mean increase in duration of day sleep.
Comparison 1 Infant massage versus control ‐ physical development, Outcome 25 Mean increase in duration of first morning sleep after massage.
Comparison 1 Infant massage versus control ‐ physical development, Outcome 26 Sleep (total hours per night).
Comparison 1 Infant massage versus control ‐ physical development, Outcome 27 Number of naps (total number of naps).
Comparison 1 Infant massage versus control ‐ physical development, Outcome 28 Number of naps in day.
Comparison 1 Infant massage versus control ‐ physical development, Outcome 29 Number of naps at night.
Comparison 1 Infant massage versus control ‐ physical development, Outcome 30 Night Wake Frequency (times).
Comparison 1 Infant massage versus control ‐ physical development, Outcome 31 Night wake duration.
Comparison 1 Infant massage versus control ‐ physical development, Outcome 32 Blood flow (post intervention).
Comparison 1 Infant massage versus control ‐ physical development, Outcome 33 Formula intake.
Comparison 1 Infant massage versus control ‐ physical development, Outcome 34 Illness.
Comparison 1 Infant massage versus control ‐ physical development, Outcome 35 Illness and clinic visits.
Comparison 2 Infant massage versus control ‐ mental health and development, Outcome 1 Infant temperament meta‐analyses.
Comparison 2 Infant massage versus control ‐ mental health and development, Outcome 2 Infant temperament (CCTI) post intervention.
Comparison 2 Infant massage versus control ‐ mental health and development, Outcome 3 Infant temperament (Infant behaviour questionnaire (IBQ) post intervention).
Comparison 2 Infant massage versus control ‐ mental health and development, Outcome 4 Infant temperament questionnaire (revised RITQ (Carey)) post‐intervention 4 months.
Comparison 2 Infant massage versus control ‐ mental health and development, Outcome 5 Infant temperament questionnaire (revised RITQ (Carey)) follow‐up 8 months.
Comparison 2 Infant massage versus control ‐ mental health and development, Outcome 6 Infant Care Questionnaire post‐intervention.
Comparison 2 Infant massage versus control ‐ mental health and development, Outcome 7 Infant Care Questionnaire follow‐up 1 year.
Comparison 2 Infant massage versus control ‐ mental health and development, Outcome 8 Infant attachment (Q set).
Comparison 2 Infant massage versus control ‐ mental health and development, Outcome 9 Child behaviour (HOME).
Comparison 2 Infant massage versus control ‐ mental health and development, Outcome 10 Eyberg Child Behaviour Inventory (ECBI) ‐ Intensity domain.
Comparison 2 Infant massage versus control ‐ mental health and development, Outcome 11 Eyberg Child Behaviour Inventory (ECBI) ‐ Problem domain.
Comparison 2 Infant massage versus control ‐ mental health and development, Outcome 12 Mother and child interaction meta‐analysis ‐ Total NCATS and Murray Global.
Comparison 2 Infant massage versus control ‐ mental health and development, Outcome 13 Nursing Child Feeding Assessment Scale (NCAFS) ‐ Total.
Comparison 2 Infant massage versus control ‐ mental health and development, Outcome 14 Nursing Child Assessment Teaching Scale (NCATS) ‐ Mother.
Comparison 2 Infant massage versus control ‐ mental health and development, Outcome 15 Nursing Child Assessment Teaching Scale (NCATS) ‐ Child.
Comparison 2 Infant massage versus control ‐ mental health and development, Outcome 16 Maternal sensitivity ‐ warm to cold (Murray).
Comparison 2 Infant massage versus control ‐ mental health and development, Outcome 17 Maternal sensitivity ‐ non‐intrusive to intrusive (Murray).
Comparison 2 Infant massage versus control ‐ mental health and development, Outcome 18 Maternal sensitivity ‐ remoteness (Murray).
Comparison 2 Infant massage versus control ‐ mental health and development, Outcome 19 Infant interactions ‐ infant performance ‐ attentive to non attentive (Murray).
Comparison 2 Infant massage versus control ‐ mental health and development, Outcome 20 Infant interactions ‐ lively to inert (Murray).
Comparison 2 Infant massage versus control ‐ mental health and development, Outcome 21 Infant interactions ‐ happy to distressed (Murray).
Comparison 2 Infant massage versus control ‐ mental health and development, Outcome 22 Parenting stress (PSI Abidin) child characteristics subscale.
Comparison 2 Infant massage versus control ‐ mental health and development, Outcome 23 Psychomotor Development Indices (PDI) meta‐analysis post‐intervention.
Comparison 2 Infant massage versus control ‐ mental health and development, Outcome 24 Bayley Psychomotor Development Index (PDI) follow‐up.
Comparison 2 Infant massage versus control ‐ mental health and development, Outcome 25 Mental Development Indices (MDI) meta‐analysis post‐intervention.
Comparison 2 Infant massage versus control ‐ mental health and development, Outcome 26 Bayley Mental Development Index (MDI) follow‐up.
Comparison 2 Infant massage versus control ‐ mental health and development, Outcome 27 Gessel/Capital meta‐analysis (post intervention).
Comparison 2 Infant massage versus control ‐ mental health and development, Outcome 28 Gessel Developmental Quotient (post intervention).
Comparison 2 Infant massage versus control ‐ mental health and development, Outcome 29 Capital institute Mental Checklist (post intervention).
Comparison 2 Infant massage versus control ‐ mental health and development, Outcome 30 Gessel Developmental Quotient (follow‐up 6 months).
Comparison 2 Infant massage versus control ‐ mental health and development, Outcome 31 Attachment patterns (strange situation procedure).
Comparison 2 Infant massage versus control ‐ mental health and development, Outcome 32 Distractibility (toy) follow‐up 1 year.
Comparison 2 Infant massage versus control ‐ mental health and development, Outcome 33 Habituation.
Comparison 2 Infant massage versus control ‐ mental health and development, Outcome 34 Seconds to habituation.
Comparison 2 Infant massage versus control ‐ mental health and development, Outcome 35 Trials to habituation.
Comparison 2 Infant massage versus control ‐ mental health and development, Outcome 36 Post habituation.
Comparison 2 Infant massage versus control ‐ mental health and development, Outcome 37 Habituation test.
| Survey time | Height | Weight | Head | Chest | Comment | |
| 4 months of age (1 month Post‐intervention) | t = 0.854; P = 0.396 | t = 1.120; P = 0.226 | t =‐0.343; P = 0.732 | t = 0.995; P = 0.322 | Through a six‐month vertical survey of the growth of all n = 310 (that is, all participants from both Liu C 2001 0 to 2 months; Liu C 2001 3 to 6 months) the infant participants over 0‐6 months, it was shown that the weight and the chest circumference of the infants who received the massage developed better than the control group. There was a significant difference between infants of the two groups by the six months. Height and head circumference were not significantly different. * Significantly different | |
| 6 months of age (3 months Post‐intervention) | t = 1.763; P = 0.081 | t = 2.295; *P = 0.025 | t = 0.411; P = 0.682 | t = 2.659; *P = 0.010 | ||
| n/a | n/a | n/a | n/a | n/a | Outcome assessments at Post‐intervention on weight, length and head circumference were presented using a χ2 sided test and were significantly different between massage and control group ( P > 0.05). |
| Study ID | Intervention | Good | Medium | Not good | Control | Good | Medium | Not good | Statistical significance X2 P |
| n = 159 | 136 | 23 | 0 | n = 73 | 49 | 20 | 4 | X2 = 15.353 P = 0.0000 (statistically significant between massage and control) | |
| n = 41 | 41 | 7 | 1 | n = 29 | 21 | 7 | 1 | X2 = 1.417 P = > 0.10 (not statistically significant between massage and control) |
| Study ID | Outcome measure (Post‐intervention) | Intervention | Control | Statistical tests X2 P |
| Rise from prone 0 degrees | 6 | 71 | X2= 4.212; P = < 0.05 Statistically significant between intervention and control. | |
| Rise from prone 45 degrees | 61 | 23 | ||
| Rise from prone 90 degrees | 33 | 6 | ||
| Sight tracking 30cm | 19 | 41 | X2 = 30.11; P = < 0.05 Statistically significant between intervention and control. | |
| Sight tracking 50cm | 42 | 39 | ||
| Sight tracking 100cm | 39 | 20 | ||
| Auditory tracking Can do | 91 | 86 | X2 = 4.735; P = < 0.05 Statistically significant between intervention and control. | |
| Auditory tracking Cannot do | 9 | 14 | ||
| Smiling for testers Can do | 34 | 19 | X2 = 4.568; P = 0.05 Statistically significant between intervention and control. | |
| Smiling for testers Cannot do | 66 | 81 |
| Outcome or subgroup title | No. of studies | No. of participants | Statistical method | Effect size |
| 1 Weight Show forest plot | 18 | Mean Difference (IV, Random, 95% CI) | Subtotals only | |
| 1.1 Post‐intervention | 18 | 2271 | Mean Difference (IV, Random, 95% CI) | ‐965.25 [‐1360.52, ‐569.98] |
| 1.2 Post‐intervention Western studies | 2 | 81 | Mean Difference (IV, Random, 95% CI) | ‐127.10 [‐575.14, 320.93] |
| 1.3 Post‐intervention sensitivity analysis for Kim 2003 | 17 | 2213 | Mean Difference (IV, Random, 95% CI) | ‐975.96 [‐1390.63, ‐561.30] |
| 1.4 Post‐intervention sensitivity analysis risk of bias | 3 | 405 | Mean Difference (IV, Random, 95% CI) | ‐203.55 [‐443.37, 36.26] |
| 1.5 Follow‐up 6 to 8 months | 3 | 202 | Mean Difference (IV, Random, 95% CI) | ‐758.29 [‐1364.67, ‐151.90] |
| 1.6 Follow‐up 6 months sensitivity analysis for Kim 2003 | 2 | 157 | Mean Difference (IV, Random, 95% CI) | ‐455.07 [‐823.80, ‐86.33] |
| 2 Weight: subgroup analyses (duration of intervention) Show forest plot | 18 | Mean Difference (IV, Random, 95% CI) | Subtotals only | |
| 2.1 Post‐intervention subgroup short term | 5 | 443 | Mean Difference (IV, Random, 95% CI) | ‐374.07 [‐654.84, ‐93.31] |
| 2.2 Post‐intervention subgroup medium term | 12 | 1648 | Mean Difference (IV, Random, 95% CI) | ‐1259.19 [‐1807.80, ‐710.58] |
| 2.3 Post‐intervention subgroup long term | 1 | 180 | Mean Difference (IV, Random, 95% CI) | ‐500.00 [‐811.25, ‐188.75] |
| 3 Length Show forest plot | 11 | Mean Difference (IV, Random, 95% CI) | Subtotals only | |
| 3.1 Post‐intervention | 11 | 1683 | Mean Difference (IV, Random, 95% CI) | ‐1.30 [‐1.60, 1.00] |
| 3.2 Post‐intervention sensitivity analysis risk of bias | 3 | 405 | Mean Difference (IV, Random, 95% CI) | ‐0.65 [‐1.20, ‐0.11] |
| 3.3 Follow‐up 6 months | 2 | 161 | Mean Difference (IV, Random, 95% CI) | ‐1.98 [‐4.69, 0.72] |
| 4 Length: subgroup analyses (duration of intervention) Show forest plot | 11 | Mean Difference (IV, Random, 95% CI) | Subtotals only | |
| 4.1 Post‐intervention subgroup short duration | 5 | 443 | Mean Difference (IV, Random, 95% CI) | ‐1.00 [‐1.54, ‐0.47] |
| 4.2 Post‐intervention subgroup medium‐term duration | 5 | 1060 | Mean Difference (IV, Random, 95% CI) | ‐1.51 [‐1.76, ‐1.27] |
| 4.3 Post‐intervention subgroup long duration | 1 | 180 | Mean Difference (IV, Random, 95% CI) | ‐1.13 [‐1.88, ‐0.38] |
| 5 Head circumference Show forest plot | 10 | Mean Difference (IV, Random, 95% CI) | Subtotals only | |
| 5.1 Post‐intervention | 9 | 1423 | Mean Difference (IV, Random, 95% CI) | ‐0.81 [‐1.18, ‐0.45] |
| 5.2 Post‐intervention sensitivity analysis risk of bias | 2 | 225 | Mean Difference (IV, Random, 95% CI) | ‐0.07 [‐0.27, 0.12] |
| 5.3 Follow‐up 6 months | 2 | 160 | Mean Difference (IV, Random, 95% CI) | ‐2.19 [‐3.88, ‐0.49] |
| 6 Head circumference: subgroup analyses (duration of intervention) Show forest plot | 9 | Mean Difference (IV, Random, 95% CI) | Subtotals only | |
| 6.1 Post‐intervention subgroup short | 4 | 363 | Mean Difference (IV, Random, 95% CI) | ‐0.70 [‐1.45, 0.05] |
| 6.2 Post‐intervention subgroup medium‐term | 5 | 1060 | Mean Difference (IV, Random, 95% CI) | ‐0.90 [‐1.16, ‐0.64] |
| 7 Mid arm circumference Show forest plot | 2 | Mean Difference (IV, Random, 95% CI) | Subtotals only | |
| 7.1 Post‐intervention | 2 | 225 | Mean Difference (IV, Random, 95% CI) | ‐0.47 [‐0.80, ‐0.13] |
| 8 Mid leg/thigh circumference Show forest plot | 2 | Mean Difference (IV, Random, 95% CI) | Subtotals only | |
| 8.1 Post‐intervention | 2 | 225 | Mean Difference (IV, Random, 95% CI) | ‐0.31 [‐0.49, ‐0.13] |
| 9 Abdominal circumference Show forest plot | 1 | 100 | Mean Difference (IV, Random, 95% CI) | ‐0.75 [‐1.09, ‐0.41] |
| 9.1 Post‐intervention | 1 | 100 | Mean Difference (IV, Random, 95% CI) | ‐0.75 [‐1.09, ‐0.41] |
| 10 Chest circumference Show forest plot | 1 | 100 | Mean Difference (IV, Random, 95% CI) | ‐0.88 [‐1.22, ‐0.54] |
| 10.1 Post‐intervention | 1 | 100 | Mean Difference (IV, Random, 95% CI) | ‐0.88 [‐1.22, ‐0.54] |
| 11 Hormones: cortisol Show forest plot | 2 | Std. Mean Difference (IV, Random, 95% CI) | Subtotals only | |
| 11.1 Salivary cortisol immediately post‐intervention | 1 | 19 | Std. Mean Difference (IV, Random, 95% CI) | 0.46 [‐0.45, 1.38] |
| 11.2 Salivary cortisol ‐ 10 to 20 min post‐intervention | 2 | 54 | Std. Mean Difference (IV, Random, 95% CI) | ‐0.24 [‐0.77, 0.30] |
| 11.3 Urinary cortisol ‐ day 12 of intervention | 1 | 40 | Std. Mean Difference (IV, Random, 95% CI) | ‐0.80 [‐1.45, ‐0.15] |
| 12 Hormones: norepinephrine Show forest plot | 1 | Mean Difference (IV, Random, 95% CI) | Subtotals only | |
| 12.1 Post‐intervention | 1 | 40 | Mean Difference (IV, Random, 95% CI) | ‐60.3 [‐111.88, ‐8.72] |
| 13 Hormones: epinephrine Show forest plot | 1 | Mean Difference (IV, Random, 95% CI) | Subtotals only | |
| 13.1 Post‐intervention | 1 | 40 | Mean Difference (IV, Random, 95% CI) | ‐13.00 [‐20.08, ‐5.92] |
| 14 Hormones: serotonin Show forest plot | 1 | Mean Difference (IV, Random, 95% CI) | Subtotals only | |
| 14.1 Post‐intervention | 1 | 40 | Mean Difference (IV, Random, 95% CI) | ‐295.5 [‐705.25, 114.25] |
| 15 Hormones: 6‐sulphatoxymelatonin secretion Show forest plot | 1 | Mean Difference (IV, Random, 95% CI) | Subtotals only | |
| 16 Biochemical markers: Bilirubin (7 days PN) Show forest plot | 2 | 410 | Mean Difference (IV, Random, 95% CI) | ‐38.11 [‐50.61, ‐25.61] |
| 17 Crying or fussing time Show forest plot | 4 | Mean Difference (IV, Random, 95% CI) | Subtotals only | |
| 17.1 Post‐intervention | 4 | 341 | Mean Difference (IV, Random, 95% CI) | ‐0.36 [‐0.52, ‐0.19] |
| 17.2 Follow‐up 3 months | 1 | 124 | Mean Difference (IV, Random, 95% CI) | ‐0.21 [‐0.40, ‐0.02] |
| 17.3 Follow‐up 6 months | 1 | 124 | Mean Difference (IV, Random, 95% CI) | ‐0.15 [‐0.29, ‐0.01] |
| 18 Crying frequency (times) Show forest plot | 1 | Mean Difference (IV, Random, 95% CI) | Subtotals only | |
| 18.1 Post‐intervention | 1 | 124 | Mean Difference (IV, Random, 95% CI) | ‐0.34 [‐0.56, ‐0.12] |
| 18.2 Follow‐up 3 months | 1 | 126 | Mean Difference (IV, Random, 95% CI) | ‐0.19 [‐0.36, ‐0.02] |
| 18.3 Follow‐up 6 months | 1 | 124 | Mean Difference (IV, Random, 95% CI) | ‐0.18 [‐0.35, ‐0.01] |
| 19 Sleep/wake behaviours (Thoman) Show forest plot | 1 | Mean Difference (IV, Random, 95% CI) | Subtotals only | |
| 19.1 Quiet sleep | 1 | 40 | Mean Difference (IV, Random, 95% CI) | ‐6.30 [‐20.16, 7.56] |
| 19.2 Active sleep | 1 | 40 | Mean Difference (IV, Random, 95% CI) | 0.0 [0.0, 0.0] |
| 19.3 Inactive alert | 1 | 40 | Mean Difference (IV, Random, 95% CI) | ‐12.70 [‐19.38, ‐6.02] |
| 19.4 Crying | 1 | 40 | Mean Difference (IV, Random, 95% CI) | ‐8.2 [‐12.24, ‐4.16] |
| 19.5 Drowsy | 1 | 40 | Mean Difference (IV, Random, 95% CI) | 2.0 [‐0.19, 4.19] |
| 19.6 Active awake | 1 | 40 | Mean Difference (IV, Random, 95% CI) | ‐15.00 [‐22.29, ‐7.71] |
| 19.7 REM sleep | 1 | 40 | Mean Difference (IV, Random, 95% CI) | 0.0 [0.0, 0.0] |
| 19.8 Movement | 1 | 40 | Mean Difference (IV, Random, 95% CI) | ‐12.60 [‐27.59, 2.39] |
| 20 Behavioural state immediately post‐intervention (Thoman) Show forest plot | 1 | Risk Ratio (M‐H, Random, 95% CI) | Subtotals only | |
| 20.1 Asleep | 1 | 26 | Risk Ratio (M‐H, Random, 95% CI) | 1.04 [0.55, 1.96] |
| 20.2 Awake | 1 | 26 | Risk Ratio (M‐H, Random, 95% CI) | 0.78 [0.27, 2.23] |
| 20.3 Crying | 1 | 26 | Risk Ratio (M‐H, Random, 95% CI) | 1.94 [0.09, 43.50] |
| 21 Sleep duration over 24hr period Show forest plot | 4 | Mean Difference (IV, Random, 95% CI) | Subtotals only | |
| 21.1 Post‐intervention | 4 | 634 | Mean Difference (IV, Random, 95% CI) | ‐0.91 [‐1.51, ‐0.30] |
| 21.2 Sleep follow‐up 3 months | 1 | 124 | Mean Difference (IV, Random, 95% CI) | ‐1.30 [‐1.81, ‐0.79] |
| 21.3 Sleep follow‐up 6 months | 1 | 124 | Mean Difference (IV, Random, 95% CI) | ‐0.08 [‐0.64, 0.48] |
| 22 Mean increase in 24h sleep Show forest plot | 2 | Std. Mean Difference (IV, Random, 95% CI) | Subtotals only | |
| 22.1 Post‐intervention | 2 | 225 | Std. Mean Difference (IV, Random, 95% CI) | ‐1.47 [‐4.43, 1.49] |
| 23 Mean increase in duration of night sleep Show forest plot | 2 | Std. Mean Difference (IV, Random, 95% CI) | Subtotals only | |
| 23.1 Post‐intervention | 2 | 225 | Std. Mean Difference (IV, Random, 95% CI) | ‐1.28 [‐3.66, 1.10] |
| 24 Mean increase in duration of day sleep Show forest plot | 1 | Mean Difference (IV, Random, 95% CI) | Subtotals only | |
| 24.1 Post‐intervention | 1 | 125 | Mean Difference (IV, Random, 95% CI) | 0.10 [‐0.21, 0.41] |
| 25 Mean increase in duration of first morning sleep after massage Show forest plot | 1 | Mean Difference (IV, Random, 95% CI) | Subtotals only | |
| 25.1 Post‐intervention | 1 | 125 | Mean Difference (IV, Random, 95% CI) | ‐1.52 [‐1.69, ‐1.35] |
| 26 Sleep (total hours per night) Show forest plot | 1 | 100 | Mean Difference (IV, Random, 95% CI) | ‐0.70 [1.00, ‐0.40] |
| 26.1 Post‐intervention | 1 | 100 | Mean Difference (IV, Random, 95% CI) | ‐0.70 [1.00, ‐0.40] |
| 27 Number of naps (total number of naps) Show forest plot | 1 | Mean Difference (IV, Random, 95% CI) | Subtotals only | |
| 28 Number of naps in day Show forest plot | 1 | Mean Difference (IV, Random, 95% CI) | Subtotals only | |
| 29 Number of naps at night Show forest plot | 1 | Mean Difference (IV, Random, 95% CI) | Subtotals only | |
| 30 Night Wake Frequency (times) Show forest plot | 1 | Mean Difference (IV, Random, 95% CI) | Subtotals only | |
| 30.1 Post‐intervention | 1 | 124 | Mean Difference (IV, Random, 95% CI) | ‐0.48 [‐0.81, ‐0.15] |
| 30.2 Follow‐up 3 months | 1 | 124 | Mean Difference (IV, Random, 95% CI) | ‐0.38 [‐0.63, ‐0.13] |
| 30.3 Follow‐up 6 months | 1 | 124 | Mean Difference (IV, Random, 95% CI) | ‐0.35 [‐0.56, ‐0.14] |
| 31 Night wake duration Show forest plot | 1 | Mean Difference (IV, Random, 95% CI) | Subtotals only | |
| 31.1 Post‐intervention | 1 | 124 | Mean Difference (IV, Random, 95% CI) | ‐0.27 [‐0.51, ‐0.03] |
| 31.2 Follow‐up 3 months | 1 | 124 | Mean Difference (IV, Random, 95% CI) | ‐0.18 [‐0.31, ‐0.05] |
| 31.3 Follow‐up 6 months | 1 | 124 | Mean Difference (IV, Random, 95% CI) | ‐0.26 [‐0.50, ‐0.02] |
| 32 Blood flow (post intervention) Show forest plot | 1 | Mean Difference (IV, Random, 95% CI) | Subtotals only | |
| 32.1 Blood flow (cm/s) post‐intervention | 1 | 125 | Mean Difference (IV, Random, 95% CI) | ‐0.54 [‐1.03, ‐0.05] |
| 32.2 Blood velocity (cm/s) post‐intervention | 1 | 125 | Mean Difference (IV, Random, 95% CI) | ‐0.98 [‐6.65, 4.69] |
| 32.3 Vessel diameter (cm) post‐intervention | 1 | 125 | Mean Difference (IV, Random, 95% CI) | 0.02 [0.01, 0.03] |
| 33 Formula intake Show forest plot | 1 | Mean Difference (IV, Random, 95% CI) | Subtotals only | |
| 33.1 Post‐intervention (US fl oz converted to ml) | 1 | 40 | Mean Difference (IV, Random, 95% CI) | 70.97 [6.16, 135.78] |
| 34 Illness Show forest plot | 2 | Risk Ratio (M‐H, Random, 95% CI) | Subtotals only | |
| 34.1 URTI (post intervention) | 2 | 310 | Risk Ratio (M‐H, Random, 95% CI) | 1.19 [0.86, 1.65] |
| 34.2 Anaemia (post intervention) | 2 | 310 | Risk Ratio (M‐H, Random, 95% CI) | 1.49 [0.79, 2.82] |
| 34.3 Diarrhoea (post intervention) | 2 | 310 | Risk Ratio (M‐H, Random, 95% CI) | 0.39 [0.20, 0.76] |
| 35 Illness and clinic visits Show forest plot | 1 | Mean Difference (IV, Random, 95% CI) | Subtotals only | |
| 35.1 Illness follow‐up 6 months | 1 | 45 | Mean Difference (IV, Random, 95% CI) | ‐8.82 [‐10.62, ‐7.02] |
| 35.2 Clinic visits follow‐up 6 months | 1 | 45 | Mean Difference (IV, Random, 95% CI) | ‐5.98 [‐7.07, ‐4.89] |
| Outcome or subgroup title | No. of studies | No. of participants | Statistical method | Effect size |
| 1 Infant temperament meta‐analyses Show forest plot | 3 | Std. Mean Difference (IV, Random, 95% CI) | Subtotals only | |
| 1.1 Activity (post‐intervention) | 3 | 121 | Std. Mean Difference (IV, Random, 95% CI) | 0.39 [‐0.34, 1.13] |
| 1.2 Persistence (post‐intervention) | 2 | 81 | Std. Mean Difference (IV, Random, 95% CI) | 0.24 [‐0.20, 0.67] |
| 1.3 Soothability (post‐intervention) | 2 | 80 | Std. Mean Difference (IV, Random, 95% CI) | ‐0.30 [‐0.94, 0.35] |
| 2 Infant temperament (CCTI) post intervention Show forest plot | 1 | Mean Difference (IV, Random, 95% CI) | Subtotals only | |
| 2.1 Activity | 1 | 40 | Mean Difference (IV, Random, 95% CI) | ‐1.60 [‐4.41, 1.21] |
| 2.2 Soothability | 1 | 40 | Mean Difference (IV, Random, 95% CI) | ‐2.90 [‐5.71, ‐0.09] |
| 2.3 Emotionality | 1 | 40 | Mean Difference (IV, Random, 95% CI) | ‐0.80 [‐3.61, 2.01] |
| 2.4 Sociability | 1 | 40 | Mean Difference (IV, Random, 95% CI) | ‐1.5 [‐3.98, 0.98] |
| 2.5 Persistence | 1 | 40 | Mean Difference (IV, Random, 95% CI) | 0.10 [‐2.38, 2.58] |
| 2.6 Food adaptation | 1 | 40 | Mean Difference (IV, Random, 95% CI) | 0.5 [‐1.98, 2.98] |
| 3 Infant temperament (Infant behaviour questionnaire (IBQ) post intervention) Show forest plot | 1 | Mean Difference (IV, Random, 95% CI) | Subtotals only | |
| 3.1 Activity | 1 | 40 | Mean Difference (IV, Random, 95% CI) | 0.56 [0.08, 1.04] |
| 3.2 Soothability | 1 | 40 | Mean Difference (IV, Random, 95% CI) | 0.03 [‐0.59, 0.65] |
| 3.3 Duration of orienting | 1 | 40 | Mean Difference (IV, Random, 95% CI) | 0.0 [‐0.82, 0.82] |
| 3.4 Distress to limitations | 1 | 40 | Mean Difference (IV, Random, 95% CI) | ‐0.08 [‐0.49, 0.33] |
| 3.5 Fear | 1 | 40 | Mean Difference (IV, Random, 95% CI) | ‐0.06 [‐0.63, 0.51] |
| 3.6 Amount of smiling | 1 | 40 | Mean Difference (IV, Random, 95% CI) | 0.30 [‐0.14, 0.74] |
| 4 Infant temperament questionnaire (revised RITQ (Carey)) post‐intervention 4 months Show forest plot | 1 | Mean Difference (IV, Random, 95% CI) | Subtotals only | |
| 4.1 Activity | 1 | 41 | Mean Difference (IV, Random, 95% CI) | 0.41 [0.11, 0.71] |
| 4.2 Rhythmicity | 1 | 41 | Mean Difference (IV, Random, 95% CI) | ‐0.19 [‐0.63, 0.25] |
| 4.3 Approach | 1 | 41 | Mean Difference (IV, Random, 95% CI) | 0.17 [‐0.18, 0.52] |
| 4.4 Adaptability | 1 | 41 | Mean Difference (IV, Random, 95% CI) | 0.10 [‐0.30, 0.50] |
| 4.5 Intensity | 1 | 41 | Mean Difference (IV, Random, 95% CI) | 0.19 [‐0.28, 0.66] |
| 4.6 Mood | 1 | 41 | Mean Difference (IV, Random, 95% CI) | 0.31 [‐0.14, 0.76] |
| 4.7 Persistence | 1 | 41 | Mean Difference (IV, Random, 95% CI) | 0.33 [‐0.11, 0.77] |
| 4.8 Distractibility | 1 | 41 | Mean Difference (IV, Random, 95% CI) | 0.28 [‐0.18, 0.74] |
| 4.9 Threshold | 1 | 41 | Mean Difference (IV, Random, 95% CI) | 0.11 [‐0.43, 0.65] |
| 5 Infant temperament questionnaire (revised RITQ (Carey)) follow‐up 8 months Show forest plot | 1 | 369 | Mean Difference (IV, Random, 95% CI) | 0.66 [0.48, 0.84] |
| 5.1 Activity | 1 | 41 | Mean Difference (IV, Random, 95% CI) | 0.25 [‐0.33, 0.83] |
| 5.2 Rhythmicity | 1 | 41 | Mean Difference (IV, Random, 95% CI) | 0.80 [0.12, 1.48] |
| 5.3 Approach | 1 | 41 | Mean Difference (IV, Random, 95% CI) | 0.88 [0.25, 1.51] |
| 5.4 Adaptability | 1 | 41 | Mean Difference (IV, Random, 95% CI) | 0.69 [0.01, 1.37] |
| 5.5 Intensity | 1 | 41 | Mean Difference (IV, Random, 95% CI) | 0.39 [0.02, 0.76] |
| 5.6 Mood | 1 | 41 | Mean Difference (IV, Random, 95% CI) | 1.08 [0.65, 1.51] |
| 5.7 Persistence | 1 | 41 | Mean Difference (IV, Random, 95% CI) | 0.65 [‐0.03, 1.33] |
| 5.8 Distractibility | 1 | 41 | Mean Difference (IV, Random, 95% CI) | 0.72 [0.32, 1.12] |
| 5.9 Threshold | 1 | 41 | Mean Difference (IV, Random, 95% CI) | 0.48 [‐0.27, 1.23] |
| 6 Infant Care Questionnaire post‐intervention Show forest plot | 1 | Mean Difference (IV, Random, 95% CI) | Subtotals only | |
| 6.1 ICQ fussy/difficult | 1 | 59 | Mean Difference (IV, Random, 95% CI) | 1.37 [‐2.53, 5.27] |
| 6.2 ICQ unadaptable | 1 | 59 | Mean Difference (IV, Random, 95% CI) | ‐0.19 [‐1.51, 1.13] |
| 6.3 ICQ dull | 1 | 59 | Mean Difference (IV, Random, 95% CI) | ‐1.08 [‐2.60, 0.44] |
| 6.4 ICQ unpredictable | 1 | 59 | Mean Difference (IV, Random, 95% CI) | 0.61 [‐1.78, 3.00] |
| 7 Infant Care Questionnaire follow‐up 1 year Show forest plot | 1 | Mean Difference (IV, Random, 95% CI) | Subtotals only | |
| 7.1 ICQ fussy/difficult | 1 | 50 | Mean Difference (IV, Random, 95% CI) | 1.05 [‐2.43, 4.53] |
| 7.2 ICQ unadaptable | 1 | 50 | Mean Difference (IV, Random, 95% CI) | ‐0.39 [‐1.63, 0.85] |
| 7.3 ICQ dull | 1 | 50 | Mean Difference (IV, Random, 95% CI) | 0.35 [‐1.54, 2.24] |
| 7.4 ICQ unpredictable | 1 | 50 | Mean Difference (IV, Random, 95% CI) | 1.89 [‐0.55, 4.33] |
| 8 Infant attachment (Q set) Show forest plot | 1 | Mean Difference (IV, Random, 95% CI) | Subtotals only | |
| 8.1 Follow‐up 1 year | 1 | 39 | Mean Difference (IV, Random, 95% CI) | ‐0.06 [‐0.17, 0.05] |
| 9 Child behaviour (HOME) Show forest plot | 1 | Mean Difference (IV, Random, 95% CI) | Subtotals only | |
| 9.1 Follow‐up (24 months) | 1 | 25 | Mean Difference (IV, Random, 95% CI) | 0.34 [‐1.92, 2.60] |
| 10 Eyberg Child Behaviour Inventory (ECBI) ‐ Intensity domain Show forest plot | 1 | Mean Difference (IV, Random, 95% CI) | Subtotals only | |
| 10.1 Follow‐up 24 months | 1 | 25 | Mean Difference (IV, Random, 95% CI) | 4.95 [‐9.94, 19.84] |
| 11 Eyberg Child Behaviour Inventory (ECBI) ‐ Problem domain Show forest plot | 1 | 25 | Mean Difference (IV, Random, 95% CI) | ‐0.19 [‐3.26, 2.88] |
| 11.1 Follow‐up 24 months | 1 | 25 | Mean Difference (IV, Random, 95% CI) | ‐0.19 [‐3.26, 2.88] |
| 12 Mother and child interaction meta‐analysis ‐ Total NCATS and Murray Global Show forest plot | 4 | Std. Mean Difference (IV, Random, 95% CI) | Subtotals only | |
| 12.1 Post‐intervention | 3 | 131 | Std. Mean Difference (IV, Random, 95% CI) | ‐0.26 [‐1.01, 0.48] |
| 12.2 Follow‐up 12 and 24 months | 2 | 65 | Std. Mean Difference (IV, Random, 95% CI) | ‐0.20 [‐0.69, 0.29] |
| 13 Nursing Child Feeding Assessment Scale (NCAFS) ‐ Total Show forest plot | 1 | Mean Difference (IV, Random, 95% CI) | Subtotals only | |
| 13.1 Post‐intervention (16 weeks) | 1 | 47 | Mean Difference (IV, Random, 95% CI) | ‐2.10 [‐6.16, 1.96] |
| 14 Nursing Child Assessment Teaching Scale (NCATS) ‐ Mother Show forest plot | 1 | Std. Mean Difference (IV, Random, 95% CI) | Subtotals only | |
| 14.1 Follow‐up 24 months | 1 | 25 | Std. Mean Difference (IV, Random, 95% CI) | ‐0.18 [‐0.96, 0.61] |
| 15 Nursing Child Assessment Teaching Scale (NCATS) ‐ Child Show forest plot | 1 | 25 | Std. Mean Difference (IV, Random, 95% CI) | 0.35 [‐0.44, 1.14] |
| 15.1 Follow‐up 24 months | 1 | 25 | Std. Mean Difference (IV, Random, 95% CI) | 0.35 [‐0.44, 1.14] |
| 16 Maternal sensitivity ‐ warm to cold (Murray) Show forest plot | 2 | Mean Difference (IV, Random, 95% CI) | Subtotals only | |
| 16.1 Post‐intervention | 2 | 84 | Mean Difference (IV, Random, 95% CI) | ‐0.34 [‐1.07, 0.40] |
| 16.2 Follow‐up 1 year | 1 | 40 | Mean Difference (IV, Random, 95% CI) | ‐0.84 [‐1.07, ‐0.61] |
| 17 Maternal sensitivity ‐ non‐intrusive to intrusive (Murray) Show forest plot | 2 | Mean Difference (IV, Random, 95% CI) | Subtotals only | |
| 17.1 Post‐intervention | 2 | 84 | Mean Difference (IV, Random, 95% CI) | ‐0.10 [‐0.85, 0.66] |
| 17.2 Follow‐up 1 year | 1 | 40 | Mean Difference (IV, Random, 95% CI) | ‐0.01 [‐0.30, 0.28] |
| 18 Maternal sensitivity ‐ remoteness (Murray) Show forest plot | 1 | Mean Difference (IV, Random, 95% CI) | Subtotals only | |
| 18.1 Post‐intervention | 1 | 40 | Mean Difference (IV, Random, 95% CI) | 0.08 [‐0.32, 0.48] |
| 18.2 Follow‐up | 1 | 62 | Mean Difference (IV, Random, 95% CI) | ‐0.14 [‐0.40, 0.12] |
| 19 Infant interactions ‐ infant performance ‐ attentive to non attentive (Murray) Show forest plot | 2 | Mean Difference (IV, Random, 95% CI) | Subtotals only | |
| 19.1 Post‐intervention | 2 | 84 | Mean Difference (IV, Random, 95% CI) | ‐0.47 [‐1.47, 0.52] |
| 19.2 Follow‐up 1 year | 1 | 40 | Mean Difference (IV, Random, 95% CI) | 0.18 [‐0.18, 0.54] |
| 20 Infant interactions ‐ lively to inert (Murray) Show forest plot | 2 | Mean Difference (IV, Random, 95% CI) | Subtotals only | |
| 20.1 Post‐intervention | 2 | 84 | Mean Difference (IV, Random, 95% CI) | ‐0.46 [‐1.45, 0.53] |
| 20.2 Follow‐up 1 year | 1 | 40 | Mean Difference (IV, Random, 95% CI) | ‐0.11 [‐0.31, 0.09] |
| 21 Infant interactions ‐ happy to distressed (Murray) Show forest plot | 2 | Mean Difference (IV, Random, 95% CI) | Subtotals only | |
| 21.1 Post intervention | 2 | 84 | Mean Difference (IV, Random, 95% CI) | ‐0.35 [‐1.29, 0.59] |
| 21.2 Follow‐up 1 year | 1 | 40 | Mean Difference (IV, Random, 95% CI) | ‐0.02 [‐0.26, 0.22] |
| 22 Parenting stress (PSI Abidin) child characteristics subscale Show forest plot | 2 | Mean Difference (IV, Random, 95% CI) | Subtotals only | |
| 22.1 Post‐intervention | 2 | 55 | Mean Difference (IV, Random, 95% CI) | ‐10.85 [‐53.86, 32.16] |
| 23 Psychomotor Development Indices (PDI) meta‐analysis post‐intervention Show forest plot | 4 | Std. Mean Difference (IV, Random, 95% CI) | Subtotals only | |
| 23.1 Post‐intervention | 4 | 466 | Std. Mean Difference (IV, Random, 95% CI) | ‐0.35 [‐0.54, ‐0.15] |
| 23.2 Post‐intervention sensitivity analysis Western studies | 1 | 41 | Std. Mean Difference (IV, Random, 95% CI) | 0.00 [‐0.61, 0.62] |
| 24 Bayley Psychomotor Development Index (PDI) follow‐up Show forest plot | 1 | Mean Difference (IV, Random, 95% CI) | Subtotals only | |
| 24.1 Follow‐up 8 months | 1 | 41 | Mean Difference (IV, Random, 95% CI) | ‐0.78 [‐11.89, 10.33] |
| 24.2 Follow‐up 24 months | 1 | 41 | Mean Difference (IV, Random, 95% CI) | ‐7.52 [‐16.53, 1.49] |
| 25 Mental Development Indices (MDI) meta‐analysis post‐intervention Show forest plot | 4 | Std. Mean Difference (IV, Random, 95% CI) | Subtotals only | |
| 25.1 Post‐intervention | 4 | 466 | Std. Mean Difference (IV, Random, 95% CI) | ‐0.27 [‐0.64, 0.11] |
| 25.2 Post‐intervention sensitivity analysis Western studies | 1 | 41 | Std. Mean Difference (IV, Random, 95% CI) | 0.38 [‐0.23, 1.00] |
| 26 Bayley Mental Development Index (MDI) follow‐up Show forest plot | 1 | Mean Difference (IV, Random, 95% CI) | Subtotals only | |
| 26.1 Follow‐up 8 months | 1 | 41 | Mean Difference (IV, Random, 95% CI) | 22.85 [4.26, 41.44] |
| 26.2 Follow‐up 24 months | 1 | 41 | Mean Difference (IV, Random, 95% CI) | ‐8.59 [‐18.80, 1.62] |
| 27 Gessel/Capital meta‐analysis (post intervention) Show forest plot | 2 | Std. Mean Difference (IV, Random, 95% CI) | Subtotals only | |
| 27.1 Gross motor | 2 | 237 | Std. Mean Difference (IV, Random, 95% CI) | ‐0.44 [‐0.70, ‐0.18] |
| 27.2 Fine motor | 2 | 237 | Std. Mean Difference (IV, Random, 95% CI) | ‐0.61 [‐0.87, ‐0.35] |
| 27.3 Language | 2 | 237 | Std. Mean Difference (IV, Random, 95% CI) | ‐0.82 [‐1.67, 0.03] |
| 27.4 Personal‐social behaviour | 2 | 237 | Std. Mean Difference (IV, Random, 95% CI) | ‐0.90 [‐1.61, ‐0.18] |
| 28 Gessel Developmental Quotient (post intervention) Show forest plot | 1 | Mean Difference (IV, Random, 95% CI) | Subtotals only | |
| 28.1 Adaptive behaviour | 1 | 180 | Mean Difference (IV, Random, 95% CI) | ‐7.07 [‐9.75, ‐4.39] |
| 28.2 Gross motor | 1 | 180 | Mean Difference (IV, Random, 95% CI) | ‐3.97 [‐6.99, ‐0.95] |
| 28.3 Fine motor | 1 | 180 | Mean Difference (IV, Random, 95% CI) | ‐6.89 [‐10.18, ‐3.60] |
| 28.4 Language | 1 | 180 | Mean Difference (IV, Random, 95% CI) | ‐4.15 [‐7.03, ‐1.27] |
| 28.5 Personal‐social behaviour | 1 | 180 | Mean Difference (IV, Random, 95% CI) | ‐6.41 [‐9.65, ‐3.17] |
| 29 Capital institute Mental Checklist (post intervention) Show forest plot | 1 | Mean Difference (IV, Random, 95% CI) | Subtotals only | |
| 29.1 Gross motor | 1 | 57 | Mean Difference (IV, Random, 95% CI) | ‐0.24 [‐0.44, ‐0.05] |
| 29.2 Fine motor | 1 | 57 | Mean Difference (IV, Random, 95% CI) | ‐0.28 [‐0.51, ‐0.05] |
| 29.3 Cognitive | 1 | 57 | Mean Difference (IV, Random, 95% CI) | ‐0.54 [‐0.92, ‐0.15] |
| 29.4 Language | 1 | 57 | Mean Difference (IV, Random, 95% CI) | ‐0.7 [‐0.99, ‐0.41] |
| 29.5 Social behaviour | 1 | 57 | Mean Difference (IV, Random, 95% CI) | ‐0.70 [‐0.97, ‐0.42] |
| 29.6 IQ | 1 | 57 | Mean Difference (IV, Random, 95% CI) | ‐27.18 [‐33.13, ‐21.23] |
| 30 Gessel Developmental Quotient (follow‐up 6 months) Show forest plot | 1 | Mean Difference (IV, Random, 95% CI) | Subtotals only | |
| 30.1 Adaptive behaviour | 1 | 116 | Mean Difference (IV, Random, 95% CI) | ‐5.79 [‐9.64, ‐1.94] |
| 30.2 Gross motor | 1 | 116 | Mean Difference (IV, Random, 95% CI) | ‐2.85 [‐8.18, 2.48] |
| 30.3 Fine motor | 1 | 116 | Mean Difference (IV, Random, 95% CI) | ‐8.12 [‐11.67, ‐4.57] |
| 30.4 Language | 1 | 116 | Mean Difference (IV, Random, 95% CI) | ‐7.90 [‐11.70, ‐4.10] |
| 30.5 Personal‐social behaviour | 1 | 116 | Mean Difference (IV, Random, 95% CI) | ‐6.19 [‐9.83, ‐2.55] |
| 31 Attachment patterns (strange situation procedure) Show forest plot | 1 | Risk Ratio (M‐H, Random, 95% CI) | Subtotals only | |
| 31.1 Secure (1 year follow‐up) | 1 | 39 | Risk Ratio (M‐H, Random, 95% CI) | 0.82 [0.50, 1.34] |
| 31.2 Avoidant (1 year follow‐up) | 1 | 39 | Risk Ratio (M‐H, Random, 95% CI) | 1.39 [0.14, 14.07] |
| 31.3 Resistant (1 year follow‐up) | 1 | 39 | Risk Ratio (M‐H, Random, 95% CI) | 3.48 [0.45, 27.02] |
| 31.4 Disorganised (1 year follow‐up) | 1 | 39 | Risk Ratio (M‐H, Random, 95% CI) | 0.70 [0.16, 3.02] |
| 32 Distractibility (toy) follow‐up 1 year Show forest plot | 1 | Risk Ratio (M‐H, Random, 95% CI) | Subtotals only | |
| 32.1 Mean looks greater than 14 secs | 1 | 32 | Risk Ratio (M‐H, Random, 95% CI) | 2.65 [0.31, 22.82] |
| 32.2 Mean looks less than 14 secs | 1 | 32 | Risk Ratio (M‐H, Random, 95% CI) | 0.88 [0.68, 1.14] |
| 32.3 Max looks greater than 14 secs | 1 | 32 | Risk Ratio (M‐H, Random, 95% CI) | 0.96 [0.66, 1.38] |
| 32.4 Max looks less than 14 secs | 1 | 32 | Risk Ratio (M‐H, Random, 95% CI) | 1.76 [0.37, 8.31] |
| 33 Habituation Show forest plot | 1 | 32 | Mean Difference (IV, Random, 95% CI) | ‐1.10 [‐4.79, 2.59] |
| 34 Seconds to habituation Show forest plot | 1 | 32 | Mean Difference (IV, Random, 95% CI) | ‐10.90 [‐69.41, 47.61] |
| 35 Trials to habituation Show forest plot | 1 | Mean Difference (IV, Random, 95% CI) | Subtotals only | |
| 36 Post habituation Show forest plot | 1 | 32 | Mean Difference (IV, Random, 95% CI) | 2.0 [‐2.43, 6.43] |
| 37 Habituation test Show forest plot | 1 | 32 | Mean Difference (IV, Random, 95% CI) | ‐12.40 [‐19.37, ‐5.43] |