Parto temprano programado versus conducta expectante para mujeres con rotura prematura de membranas antes del trabajo de parto prematuro antes de las 37 semanas de gestación para mejorar el resultado del embarazo
References
References to studies included in this review
References to studies excluded from this review
References to ongoing studies
Additional references
References to other published versions of this review
Characteristics of studies
Characteristics of included studies [ordered by study ID]
Jump to:
| Methods | RCT Duration of study: May 1991‐30 April 1994 | |
| Participants | Setting: Parkland Hospital, Dallas, Texas, USA Participants: 129 women with confirmed premature rupture of the membranes between 30‐34 weeks' gestation; 1 twin pair in each of early delivery and expectant management group resulting in a total of 131 babies:
Inclusion criteria
Exclusion criteria
| |
| Interventions | Intervention: oxytocin labour stimulation if the fetus was cephalic; caesarean section was performed for all other presentations Control: expectant management
Corticosteroids, tocolysis and antibiotics were not used Vaginal examinations were not performed in the absence of labour | |
| Outcomes | Maternal
Fetal
| |
| Notes |
| |
| Risk of bias | ||
| Bias | Authors' judgement | Support for judgement |
| Random sequence generation (selection bias) | Low risk | Random number table with group allocation pre‐determined |
| Allocation concealment (selection bias) | Unclear risk | Sequentially numbered sealed envelopes. Not stated if envelopes were opaque or not |
| Blinding of participants and personnel (performance bias) | Low risk | Blinding not possible due to intervention. However this was likely low risk of bias due to objective and specific assessment criteria for outcomes, where lack of blinding did not affect treatment decisions or other aspects of care. |
| Blinding of outcome assessment (detection bias) | Unclear risk | Not specified |
| Incomplete outcome data (attrition bias) | Low risk | No losses to follow‐up reported |
| Selective reporting (reporting bias) | Unclear risk | Outcomes only reported in results. Not pre‐specified |
| Other bias | Low risk | None noted |
| Methods | RCT Duration of study: November 1992‐October 1993 | |
| Participants | Setting: Perinatology Department, Centro Medico Nacional, IMSS, Torreon, Coah, Mexico Participants: 58 women with PROM between 28‐34 weeks of gestation
Inclusion criteria
Exclusion criteria
| |
| Interventions | Control: managed with short‐term delivery with the application of a fetal lung maturity protocol of 6 doses of 250 mg of intravenous aminophylline every 8 h. Delivered according to obstetric characteristics of each woman Treatment: managed with the same lung maturity protocol as the controls, but repeating weekly if possible
| |
| Outcomes | Maternal
Fetal
| |
| Notes | Gestational age calculated by date of last menstrual period or ultrasound PROM diagnosis performed by Tamiere* procedure (maneuver), cristallography, or the flame test *The authors are unsure of what this procedure is, although this may be an error in translation. | |
| Risk of bias | ||
| Bias | Authors' judgement | Support for judgement |
| Random sequence generation (selection bias) | Low risk | Random number table |
| Allocation concealment (selection bias) | Unclear risk | Not specified |
| Blinding of participants and personnel (performance bias) | Low risk | Blinding not possible due to intervention. However this was likely low risk of bias due to objective and specific assessment criteria for outcomes, where lack of blinding did not affect treatment decisions or other aspects of care. |
| Blinding of outcome assessment (detection bias) | Unclear risk | Not specified |
| Incomplete outcome data (attrition bias) | High risk | Results inconsistent with number randomised. Incomplete data not recorded |
| Selective reporting (reporting bias) | High risk | Outcomes only reported in results. Not pre‐specified. Although inclusion criteria was singleton pregnancy only, results for caesarean section indicate 2 sets of twins in each group. This was not reported. |
| Other bias | Low risk | None noted |
| Methods | RCT | |
| Participants | Setting: Obstetric services at the University of California Irvine Medical Center and Women's Hospital Memorial Medical Center of Long Beach, Orange County, California, USA Participants: 160 women; 80 women in early delivery group and 80 women in expectant management group Inclusion criteria
Exclusion criteria
Prior to randomisation all women
| |
| Interventions | Intervention: 80 women were randomised to corticosteroids and delivery 48 h after treatment with steroids
Control: 80 women were randomised to expectant management
Criteria for delivery for women in the expectant management group included:
Corticosteroids and tocolysis used in early delivery group. Prophylactic antibiotics not used. Vaginal examinations were not performed in the absence of labour. | |
| Outcomes | Maternal
Fetal
| |
| Notes |
| |
| Risk of bias | ||
| Bias | Authors' judgement | Support for judgement |
| Random sequence generation (selection bias) | Unclear risk | Randomisation schema not defined |
| Allocation concealment (selection bias) | Unclear risk | Not defined |
| Blinding of participants and personnel (performance bias) | Low risk | Blinding not possible due to intervention. However this was likely low risk of bias due to objective and specific assessment criteria for outcomes, where lack of blinding did not affect treatment decisions or other aspects of care. |
| Blinding of outcome assessment (detection bias) | Unclear risk | Radiologists (for reviewing X‐rays prior to diagnosis of hyaline membrane disease) were blinded as to treatment allocation. However it was not mentioned if all other analysts were blinded to treatment. |
| Incomplete outcome data (attrition bias) | High risk | No losses to follow‐up reported. However, 1 fetal death in expectant management group removed from denominator of neonatal outcomes |
| Selective reporting (reporting bias) | Unclear risk | Outcomes only reported in results. Not pre‐specified |
| Other bias | Low risk | None noted |
| Methods | RCT Duration of study: September 1979‐November 1982 | |
| Participants | Setting: Ohio State University Hospitals, Ohio, USA Participants: 73 women; 38 early delivery, 35 expectant management Inclusion criteria
Exclusion criteria
| |
| Interventions | Intervention: corticosteroids, tocolysis and delivery 48‐72 hours after initiation of steroid treatment
Control: expectant management.
Criteria for delivery of women in the expectant management group included
Corticosteroids and tocolysis given to early delivery group. Prophylactic antibiotics not given. Vaginal examinations were not performed in the absence of labour. | |
| Outcomes | Maternal
Fetal
| |
| Notes |
| |
| Risk of bias | ||
| Bias | Authors' judgement | Support for judgement |
| Random sequence generation (selection bias) | Low risk | Random number table |
| Allocation concealment (selection bias) | Unclear risk | Not defined |
| Blinding of participants and personnel (performance bias) | Low risk | Blinding not possible due to intervention. However this was likely low risk of bias due to objective and specific assessment criteria for outcomes, where lack of blinding did not affect treatment decisions or other aspects of care. |
| Blinding of outcome assessment (detection bias) | Unclear risk | Not defined |
| Incomplete outcome data (attrition bias) | High risk | Losses to follow‐up: 3 women in expectant management group delivered at another hospital and were excluded from analysis. Post‐randomisation exclusions: 1 neonate with congenital anomalies was excluded post delivery, 1 mother and her baby were excluded for failure to complete steroid therapy. |
| Selective reporting (reporting bias) | Unclear risk | Outcomes only reported in results. Not pre‐specified |
| Other bias | Low risk | None noted |
| Methods | Prospective RCT Duration of study: March 2008‐October 2011 | |
| Participants | Setting: Albania Participants: 307 pregnant women, 157 in planned early birth group and 150 to expectant management group Inclusion criteria
Exclusion criteria
| |
| Interventions | Planned early birth versus expectant management ‐ not defined | |
| Outcomes | Maternal
Fetal
| |
| Notes | Abstract only. Limited data available | |
| Risk of bias | ||
| Bias | Authors' judgement | Support for judgement |
| Random sequence generation (selection bias) | Unclear risk | Method not specified |
| Allocation concealment (selection bias) | Unclear risk | Not specified |
| Blinding of participants and personnel (performance bias) | Unclear risk | Blinding not possible due to intervention. However the risk was unclear as assessment criteria for outcomes was not mentioned |
| Blinding of outcome assessment (detection bias) | Unclear risk | Not specified |
| Incomplete outcome data (attrition bias) | Unclear risk | Not specified |
| Selective reporting (reporting bias) | High risk | Only 3 outcomes as well as secondary unspecified outcomes reported in abstract. Full paper not published |
| Other bias | Unclear risk | As this is an abstract publication only, cannot determine the overall risk of bias |
| Methods | RCT Duration of study: 1 March 1991‐31 July 1992 | |
| Participants | Setting: University of Tennessee, Memphis, USA Participants: 93 women
Inclusion criteria
Exclusion criteria
| |
| Interventions | Intervention: intravenous oxytocin infusion Control: expectant management
Corticosteroids, tocolysis and prophylactic antibiotics not used Vaginal examinations not performed in the absence of labour | |
| Outcomes | Maternal
Fetal
| |
| Notes |
| |
| Risk of bias | ||
| Bias | Authors' judgement | Support for judgement |
| Random sequence generation (selection bias) | Low risk | Computer‐generated random number tables |
| Allocation concealment (selection bias) | Unclear risk | Not clearly defined. Stated that "blinded" random number tables were used, but no further explanation was given as to what this entailed. |
| Blinding of participants and personnel (performance bias) | Low risk | Blinding not possible due to intervention. However this was likely low risk of bias due to objective and specific assessment criteria for outcomes, where lack of blinding did not affect treatment decisions or other aspects of care. |
| Blinding of outcome assessment (detection bias) | Unclear risk | Neonatologists were not blinded to the perinatal clinical course. It was not specified whether the assessors of maternal outcomes were blinded to their clinical course. |
| Incomplete outcome data (attrition bias) | Low risk | No losses to follow‐up or post‐randomisation exclusions |
| Selective reporting (reporting bias) | Unclear risk | Outcomes only reported in results. Not pre‐specified |
| Other bias | Low risk | None noted |
| Methods | Multi‐centre, international RCT Duration of study: May 2004‐June 2013 | |
| Participants | Setting: 65 tertiary hospitals in 11 countries (Australia, Argentina, Brazil, Egypt, New Zealand, Norway, Poland, Romania, South Africa, UK, Uruguay) Participants: 1835 women
Inclusion criteria
Exclusion criteria
| |
| Interventions | Intervention
Control: expectant management
Criteria for delivery included
Antibiotics were prescribed according to local protocols. Laboratory testing and other management was per usual hospital practice. Placental histology was encouraged but not uniformly requested. | |
| Outcomes | Maternal
Fetal
| |
| Notes |
| |
| Risk of bias | ||
| Bias | Authors' judgement | Support for judgement |
| Random sequence generation (selection bias) | Low risk | A computer‐generated randomisation schedule was used in a 1:1 ratio in balanced blocks of variable size, stratified by centre. |
| Allocation concealment (selection bias) | Low risk | A central telephone service was used for randomisation allocation. |
| Blinding of participants and personnel (performance bias) | Low risk | Blinding not possible due to intervention. However this was likely low risk of bias due to objective and specific assessment criteria for outcomes, where lack of blinding did not affect treatment decisions or other aspects of care. |
| Blinding of outcome assessment (detection bias) | Low risk | The primary outcome was determined by comprehensive review of the neonatal data by a central adjudication committee masked to the treatment allocation. |
| Incomplete outcome data (attrition bias) | Low risk | All analyses were by intention‐to‐treat. No participants were excluded from the primary intention‐to‐treat analysis due to protocol violations. |
| Selective reporting (reporting bias) | Low risk | All a‐priori outcomes were reported on. |
| Other bias | Low risk | None noted |
| Methods | RCT Duration of study: 1992‐1994 | |
| Participants | Setting: University of Mississippi Medical Center, Jackson, Mississippi, USA Participants: 120 singleton pregnancies
Inclusion criteria
Exclusion criteria
| |
| Interventions | Intervention: induction of labour with intravenous oxytocin Control: expectant management
Corticosteroids and tocolysis not used. Routine antibiotic prophylaxis for all women Vaginal examinations not performed in the absence of labour | |
| Outcomes | Maternal
Fetal
| |
| Notes |
| |
| Risk of bias | ||
| Bias | Authors' judgement | Support for judgement |
| Random sequence generation (selection bias) | Low risk | Computer‐generated random number cards |
| Allocation concealment (selection bias) | Unclear risk | Opaque sealed envelopes but did not state if envelopes were sequentially numbered |
| Blinding of participants and personnel (performance bias) | Low risk | Blinding not possible due to intervention. However this was likely low risk of bias due to objective and specific assessment criteria for outcomes, where lack of blinding did not affect treatment decisions or other aspects of care. |
| Blinding of outcome assessment (detection bias) | Unclear risk | Neonatologists were not blinded to the perinatal clinical course. It was not specified whether the assessors of maternal outcomes were blinded to their clinical course. |
| Incomplete outcome data (attrition bias) | Low risk | No losses to follow‐up |
| Selective reporting (reporting bias) | Low risk | All a‐priori outcomes were reported on |
| Other bias | Low risk | None noted |
| Methods | RCT | |
| Participants | Setting: Wake Forest University Medical Center, North Carolina, USA Participants: 68 women
Inclusion criteria
Exclusion criteria
| |
| Interventions | Intervention: included 2 groups Group 1. Steroid group who received intramuscular betamethasone 6 mg or 12 mg on admission and another dose 12 h later
Group 2. No‐steroid group who received similar treatment to group 1 except no steroids were given Control: expectant management
Criteria for delivery in the expectant group not specified Corticosteroids and tocolysis used for early delivery group. Prophylactic antibiotics not used. Not specified as to whether digital vaginal examinations were performed | |
| Outcomes | Maternal
Fetal
| |
| Notes |
| |
| Risk of bias | ||
| Bias | Authors' judgement | Support for judgement |
| Random sequence generation (selection bias) | Low risk | Randomised cards were used. Participants were randomly assigned by drawing a sealed envelope from a group of randomised cards, it did not state how the randomisation sequence was generated. |
| Allocation concealment (selection bias) | Unclear risk | Sealed envelopes but did not state if opaque or sequentially numbered |
| Blinding of participants and personnel (performance bias) | Low risk | Blinding not possible due to intervention. However this was likely low risk of bias due to objective and specific assessment criteria for outcomes, where lack of blinding did not affect treatment decisions or other aspects of care. |
| Blinding of outcome assessment (detection bias) | Unclear risk | Not specified |
| Incomplete outcome data (attrition bias) | Low risk | No losses to follow‐up |
| Selective reporting (reporting bias) | Low risk | All a‐priori outcomes were reported on |
| Other bias | Low risk | None noted |
| Methods | RCT | |
| Participants | Setting: E.H. Crump Women's Hospital and Perinatal Center, Memphis, Tennessee, USA Participants: 47 women
Inclusion criteria
Exclusion criteria
| |
| Interventions | Intervention: early delivery either by induction of labour with oxytocin or caesarean section for all non‐vertex presentations Control: expectant management
Criteria for delivery in the expectant group of women
Corticosteroids, tocolysis and prophylactic antibiotics not used Vaginal examinations not performed in the absence of labour | |
| Outcomes | Maternal
Fetal
| |
| Notes |
| |
| Risk of bias | ||
| Bias | Authors' judgement | Support for judgement |
| Random sequence generation (selection bias) | Low risk | Sequential sealed envelope odd‐even random numbers |
| Allocation concealment (selection bias) | Unclear risk | Sealed envelopes, did not specify if opaque or sequentially numbered |
| Blinding of participants and personnel (performance bias) | Low risk | Blinding not possible due to intervention. However this was likely low risk of bias due to objective and specific assessment criteria for outcomes, where lack of blinding did not affect treatment decisions or other aspects of care. |
| Blinding of outcome assessment (detection bias) | Unclear risk |
However, did not mention if outcome assessors were blinded |
| Incomplete outcome data (attrition bias) | High risk | Losses to follow‐up: no losses to follow‐up Post‐randomisation exclusions: 7 women for preterm labour, 4 women for "protocol violations", and 4 other women with unspecified reason |
| Selective reporting (reporting bias) | Unclear risk | Outcomes only reported in results. Not pre‐specified |
| Other bias | Low risk | None noted |
| Methods | Multi‐centre, parallel, open‐label RCT | |
| Participants | Setting: 8 academic and 52 non‐academic hospitals in the Netherlands Participants: 532 women
Inclusion criteria
Exclusion criteria
| |
| Interventions | Intervention: induction of labour within 24 h after randomisation. Induction performed according to national guidelines. After vaginal examination, labour induced with either prostaglandin or oxytocin, or caesarean section performed as soon as feasible in case of planned caesarean Control: expectant management
Criteria for delivery in the expectant group of women
Tocolysis and prophylactic antibiotics used according to local protocols Corticosteroids given in PPROM < 34 weeks' gestation Vaginal examinations not performed in the absence of labour | |
| Outcomes | Maternal
Fetal
| |
| Notes |
| |
| Risk of bias | ||
| Bias | Authors' judgement | Support for judgement |
| Random sequence generation (selection bias) | Low risk | A computer‐generated randomisation schedule was used in a 1:1 ratio using a block size of 4, stratified for centre and parity. |
| Allocation concealment (selection bias) | Low risk | Randomisation allocation was performed on a central password‐protected web‐based application. |
| Blinding of participants and personnel (performance bias) | Low risk | Blinding not possible due to intervention. However this was likely low risk of bias due to objective and specific assessment criteria for outcomes, where lack of blinding did not affect treatment decisions or other aspects of care. |
| Blinding of outcome assessment (detection bias) | Low risk | Criteria for sepsis were entered in the database and the case was judged by an independent panel of paediatricians who were unaware of the allocation of randomisation. |
| Incomplete outcome data (attrition bias) | Low risk | Data analysed on intention‐to‐treat basis. 2 participants were excluded post randomisation from the primary intention‐to‐treat analysis due to ineligibility. |
| Selective reporting (reporting bias) | Low risk | All a‐priori outcomes were reported on. |
| Other bias | Low risk | None noted |
| Methods | Multi‐centre, parallel, open‐label RCT | |
| Participants | Setting: 8 academic and 52 non‐academic hospitals in the Netherlands Participants: 195 women
Inclusion criteria
Exclusion criteria
| |
| Interventions | Intervention: induction of labour with 24 h after randomisation. Induction performed according to national guidelines. After vaginal examination, labour induced with either prostaglandin or oxytocin, or caesarean section performed as soon as feasible in case of planned caesarean. Control: expectant management
Criteria for birth in the expectant group of women
Tocolysis and prophylactic antibiotics used according to local protocols Corticosteroids given in PPROM < 34 weeks' gestation Vaginal examinations not performed in the absence of labour | |
| Outcomes | Maternal
Fetal
| |
| Notes |
| |
| Risk of bias | ||
| Bias | Authors' judgement | Support for judgement |
| Random sequence generation (selection bias) | Low risk | A computer‐generated randomisation schedule was used in a 1:1 ratio using a block size of 4, stratified for centre and parity. |
| Allocation concealment (selection bias) | Low risk | Randomisation allocation was performed on a central password‐protected web‐based application. |
| Blinding of participants and personnel (performance bias) | Low risk | Blinding not possible due to intervention. However this was likely low risk of bias due to objective and specific assessment criteria for outcomes, where lack of blinding did not affect treatment decisions or other aspects of care. |
| Blinding of outcome assessment (detection bias) | Low risk | Criteria for sepsis were entered in the database and the case was judged by an independent panel of paediatricians who were unaware of the allocation of randomisation. |
| Incomplete outcome data (attrition bias) | Low risk | Data analysed on intention‐to‐treat basis. No participants were excluded. |
| Selective reporting (reporting bias) | Low risk | All a‐priori outcomes were reported on. |
| Other bias | Low risk | None noted |
2 perinatal deaths resulting from lethal congenital abnormalities were excluded from analyses post‐randomisation.
BPD: biparietal diameter of the fetal head
CSF: cerebrospinal fluid
EDD: estimated due date
GBS: Group B Streptococcus/Streptococcal
HELLP: haemolysis, elevated liver enzymes, and low platelets
L/S: Lecithin‐sphingomyelin
NICU: neonatal intensive care unit
PPROM: preterm prelabour rupture of the membranes
RCT: randomised controlled trial
RDS: respiratory distress syndrome
WBC: white blood cells
WCC: white cell count
Characteristics of excluded studies [ordered by study ID]
Jump to:
| Study | Reason for exclusion |
| Not a RCT | |
| Unable to establish that all women were prior to 37 weeks' gestation. | |
| Assessed effect of tocolysis in women with PPROM. Tocolysis was used for 24 h in 1 group and until birth in the other group of women. Primary outcome was efficacy of tocolysis ‐ delivered if tocolysis failed or if complications occurred relating to tocolysis therapy. No expectant management arm of study included. Also women were excluded if tocolysis failed and they delivered within 24 h of randomisation. | |
| Assessed treatment with either prostaglandins or oxytocin for women with PPROM. In all women induction was commenced 3 h after PPROM. The study did not assess the intervention of early birth, rather the mode of induction of labour. | |
| Quasi‐randomised trial | |
| Included women from 34‐41 completed weeks' gestation | |
| Unable to establish that all women were prior to term | |
| Assessed intravaginal misoprostol for induction of labour in women with PPROM for pregnancy termination | |
| This study was terminated prematurely due to slow recruitment. | |
| Unable to establish that all women were prior to 37 weeks. | |
| Abstract available only | |
| Included women at term and prior to term. Included women greater than 34 weeks' gestation but subgroup analysis of women prior to term not able to be performed | |
| Did not assess intervention of early birth | |
| Abstract only | |
| Did not include a group of women with expectant management. Women with PPROM were randomised to either induction with prostaglandin or induction with oxytocin within 12 h of presenting to hospital with PPROM | |
| Included women prior to term and at term |
PPROM: preterm prelabour rupture of the membranes
RCT: randomised controlled trial
Characteristics of ongoing studies [ordered by study ID]
Jump to:
| Trial name or title | The MICADO study |
| Methods | A RCT in 23 hospitals to compare intentional birth with expectant management in women with preterm premature rupture of the membranes. |
| Participants | Women with preterm prelabour rupture of the membranes between 28 and 31 weeks' gestation. Randomised to intervention or control 24 h after the second dose of corticosteroids |
| Interventions | Early birth |
| Outcomes | |
| Starting date | 2006 |
| Contact information | Jean Charles Pasquier, Department of Obstetrics and Gynecology, Hospital Herriot, Lyon, France. |
| Notes |
Data and analyses
| Outcome or subgroup title | No. of studies | No. of participants | Statistical method | Effect size |
| 1 Neonatal infection/sepsis Show forest plot | 12 | 3628 | Risk Ratio (M‐H, Fixed, 95% CI) | 0.93 [0.66, 1.30] |
| Analysis 1.1  Comparison 1 Any planned birth versus expectant management: by type, Outcome 1 Neonatal infection/sepsis. | ||||
| 2 Neonatal infection confirmed with positive blood culture Show forest plot | 7 | 2925 | Risk Ratio (M‐H, Fixed, 95% CI) | 1.24 [0.70, 2.21] |
| Analysis 1.2 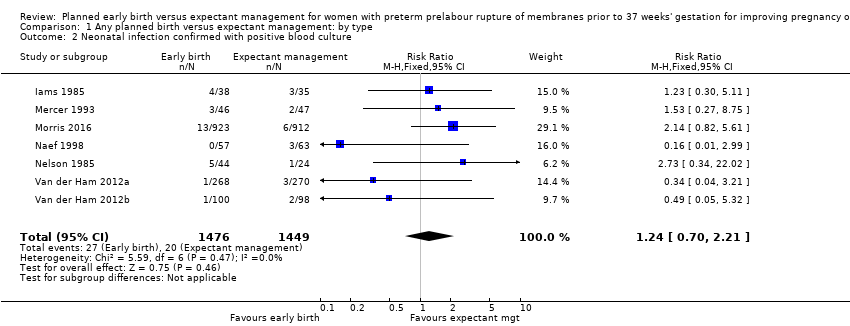 Comparison 1 Any planned birth versus expectant management: by type, Outcome 2 Neonatal infection confirmed with positive blood culture. | ||||
| 3 Respiratory distress syndrome Show forest plot | 12 | 3622 | Risk Ratio (M‐H, Fixed, 95% CI) | 1.26 [1.05, 1.53] |
| Analysis 1.3 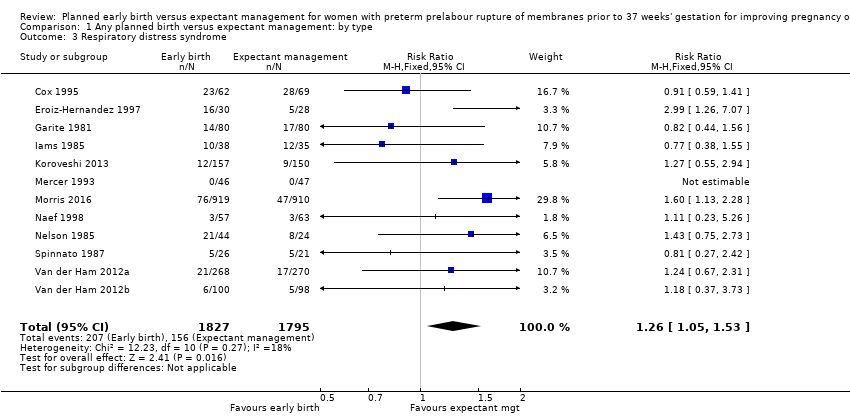 Comparison 1 Any planned birth versus expectant management: by type, Outcome 3 Respiratory distress syndrome. | ||||
| 4 Caesarean section Show forest plot | 12 | 3620 | Risk Ratio (M‐H, Fixed, 95% CI) | 1.26 [1.11, 1.44] |
| Analysis 1.4  Comparison 1 Any planned birth versus expectant management: by type, Outcome 4 Caesarean section. | ||||
| 5 Perinatal mortality Show forest plot | 11 | 3319 | Risk Ratio (M‐H, Fixed, 95% CI) | 1.76 [0.89, 3.50] |
| Analysis 1.5  Comparison 1 Any planned birth versus expectant management: by type, Outcome 5 Perinatal mortality. | ||||
| 6 Intrauterine death Show forest plot | 11 | 3321 | Risk Ratio (M‐H, Fixed, 95% CI) | 0.45 [0.13, 1.55] |
| Analysis 1.6  Comparison 1 Any planned birth versus expectant management: by type, Outcome 6 Intrauterine death. | ||||
| 7 Cord prolapse Show forest plot | 4 | 2722 | Risk Ratio (M‐H, Fixed, 95% CI) | 1.24 [0.33, 4.61] |
| Analysis 1.7  Comparison 1 Any planned birth versus expectant management: by type, Outcome 7 Cord prolapse. | ||||
| 8 Gestational age at birth (weeks) Show forest plot | 8 | 3139 | Mean Difference (IV, Fixed, 95% CI) | ‐0.48 [‐0.57, ‐0.39] |
| Analysis 1.8  Comparison 1 Any planned birth versus expectant management: by type, Outcome 8 Gestational age at birth (weeks). | ||||
| 9 Neonatal death Show forest plot | 11 | 3316 | Risk Ratio (M‐H, Fixed, 95% CI) | 2.55 [1.17, 5.56] |
| Analysis 1.9 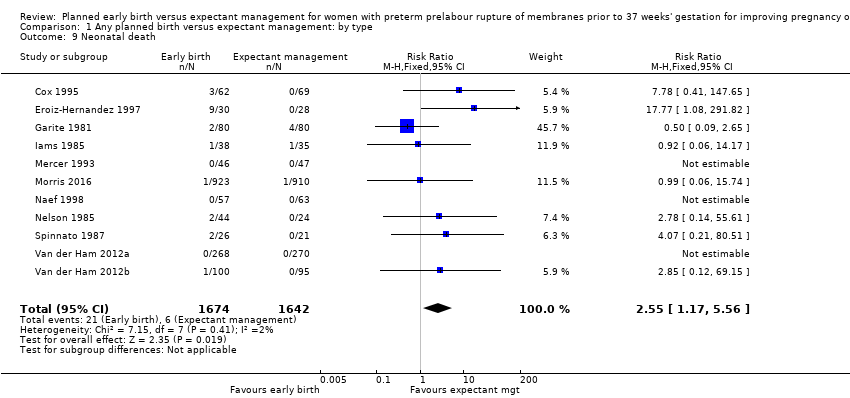 Comparison 1 Any planned birth versus expectant management: by type, Outcome 9 Neonatal death. | ||||
| 10 Suspected neonatal infection Show forest plot | 3 | 829 | Risk Ratio (M‐H, Fixed, 95% CI) | 0.56 [0.36, 0.88] |
| Analysis 1.10  Comparison 1 Any planned birth versus expectant management: by type, Outcome 10 Suspected neonatal infection. | ||||
| 11 Neonatal treatment with antibiotics Show forest plot | 4 | 2638 | Risk Ratio (M‐H, Random, 95% CI) | 0.86 [0.63, 1.19] |
| Analysis 1.11  Comparison 1 Any planned birth versus expectant management: by type, Outcome 11 Neonatal treatment with antibiotics. | ||||
| 12 Need for ventilation Show forest plot | 7 | 2895 | Risk Ratio (M‐H, Fixed, 95% CI) | 1.27 [1.02, 1.58] |
| Analysis 1.12  Comparison 1 Any planned birth versus expectant management: by type, Outcome 12 Need for ventilation. | ||||
| 13 Duration of oxygen therapy (days) Show forest plot | 1 | 73 | Mean Difference (IV, Fixed, 95% CI) | ‐3.05 [‐6.92, 0.82] |
| Analysis 1.13 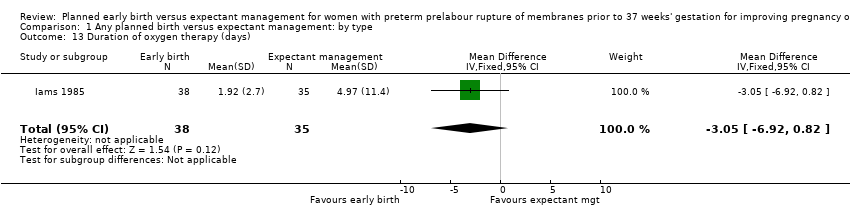 Comparison 1 Any planned birth versus expectant management: by type, Outcome 13 Duration of oxygen therapy (days). | ||||
| 14 Umbilical cord arterial pH Show forest plot | 1 | 120 | Mean Difference (IV, Fixed, 95% CI) | 0.09 [0.07, 0.11] |
| Analysis 1.14  Comparison 1 Any planned birth versus expectant management: by type, Outcome 14 Umbilical cord arterial pH. | ||||
| 15 Birthweight (g) Show forest plot | 10 | 3263 | Mean Difference (IV, Random, 95% CI) | ‐47.10 [‐96.00, 1.80] |
| Analysis 1.15 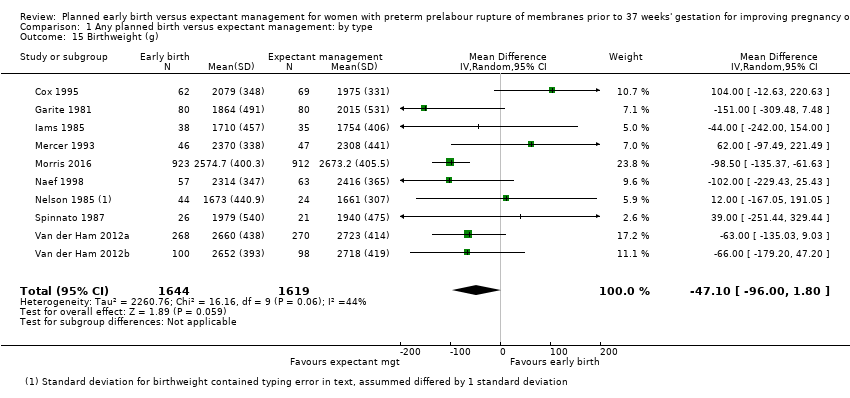 Comparison 1 Any planned birth versus expectant management: by type, Outcome 15 Birthweight (g). | ||||
| 16 Apgar score less than 7 at 5 minutes Show forest plot | 5 | 2700 | Risk Ratio (M‐H, Fixed, 95% CI) | 0.96 [0.54, 1.69] |
| Analysis 1.16 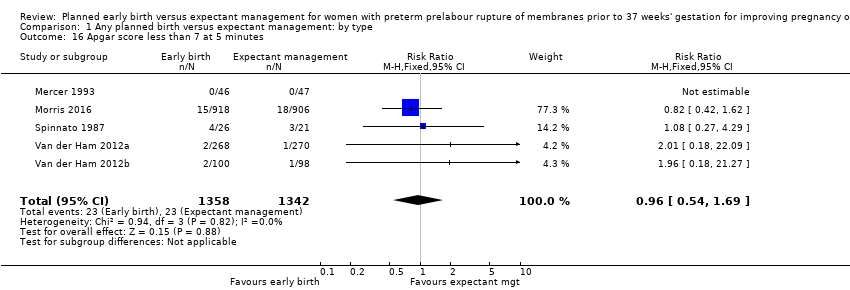 Comparison 1 Any planned birth versus expectant management: by type, Outcome 16 Apgar score less than 7 at 5 minutes. | ||||
| 17 Abnormality on cerebral ultrasound Show forest plot | 3 | 271 | Risk Ratio (M‐H, Fixed, 95% CI) | 1.90 [0.52, 6.92] |
| Analysis 1.17 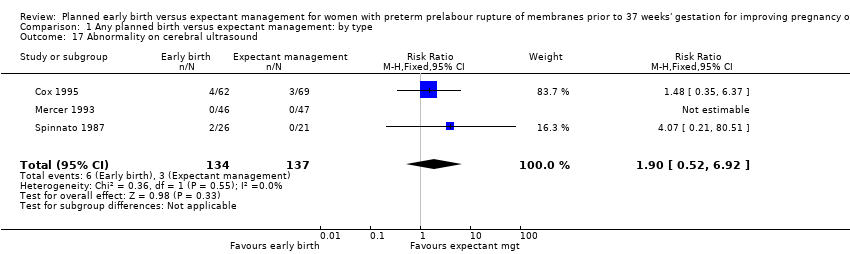 Comparison 1 Any planned birth versus expectant management: by type, Outcome 17 Abnormality on cerebral ultrasound. | ||||
| 18 Periventricular leukomalacia Show forest plot | 2 | 707 | Risk Ratio (M‐H, Fixed, 95% CI) | 1.00 [0.14, 6.99] |
| Analysis 1.18 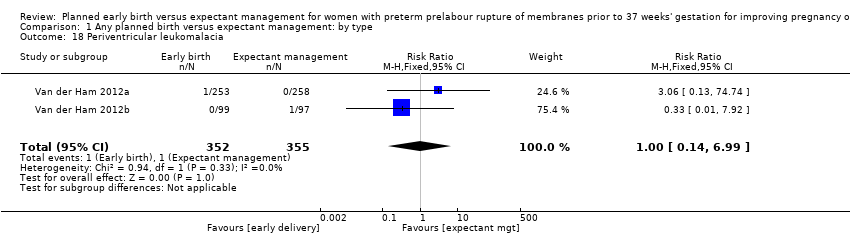 Comparison 1 Any planned birth versus expectant management: by type, Outcome 18 Periventricular leukomalacia. | ||||
| 19 Cerebroventricular haemorrhage Show forest plot | 6 | 1095 | Risk Ratio (M‐H, Fixed, 95% CI) | 1.19 [0.40, 3.52] |
| Analysis 1.19  Comparison 1 Any planned birth versus expectant management: by type, Outcome 19 Cerebroventricular haemorrhage. | ||||
| 20 Necrotising enterocolitis Show forest plot | 6 | 2842 | Risk Ratio (M‐H, Fixed, 95% CI) | 0.81 [0.25, 2.62] |
| Analysis 1.20  Comparison 1 Any planned birth versus expectant management: by type, Outcome 20 Necrotising enterocolitis. | ||||
| 21 Severe respiratory distress Show forest plot | 3 | 321 | Risk Ratio (M‐H, Fixed, 95% CI) | 1.54 [0.80, 2.97] |
| Analysis 1.21 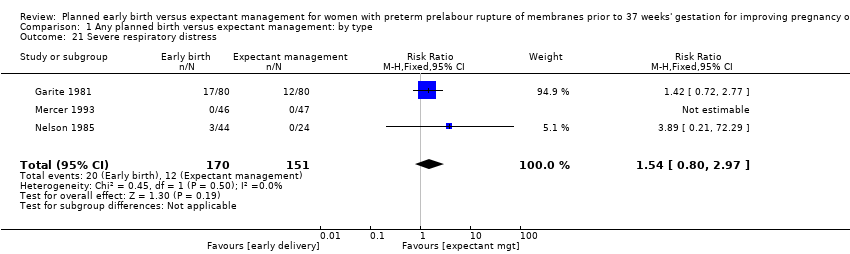 Comparison 1 Any planned birth versus expectant management: by type, Outcome 21 Severe respiratory distress. | ||||
| 22 Admission to neonatal intensive care unit Show forest plot | 4 | 2691 | Risk Ratio (M‐H, Fixed, 95% CI) | 1.16 [1.08, 1.24] |
| Analysis 1.22 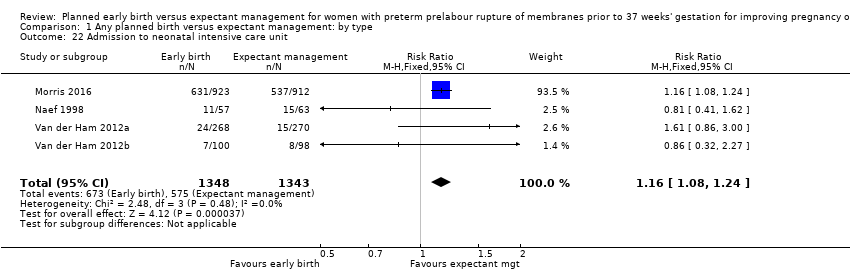 Comparison 1 Any planned birth versus expectant management: by type, Outcome 22 Admission to neonatal intensive care unit. | ||||
| 23 Length of stay in neonatal intensive care unit (days) Show forest plot | 4 | 2121 | Mean Difference (IV, Random, 95% CI) | ‐0.17 [‐1.62, 1.27] |
| Analysis 1.23  Comparison 1 Any planned birth versus expectant management: by type, Outcome 23 Length of stay in neonatal intensive care unit (days). | ||||
| 24 Duration (days) from birth to neonatal hospital discharge Show forest plot | 6 | 2832 | Mean Difference (IV, Random, 95% CI) | 0.67 [‐0.28, 1.61] |
| Analysis 1.24 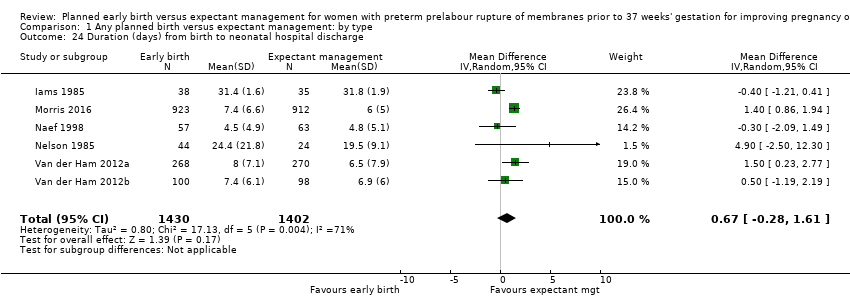 Comparison 1 Any planned birth versus expectant management: by type, Outcome 24 Duration (days) from birth to neonatal hospital discharge. | ||||
| 25 Chorioamnionitis Show forest plot | 8 | 1358 | Risk Ratio (M‐H, Random, 95% CI) | 0.50 [0.26, 0.95] |
| Analysis 1.25  Comparison 1 Any planned birth versus expectant management: by type, Outcome 25 Chorioamnionitis. | ||||
| 26 Endometritis Show forest plot | 7 | 2980 | Risk Ratio (M‐H, Fixed, 95% CI) | 1.61 [1.00, 2.59] |
| Analysis 1.26  Comparison 1 Any planned birth versus expectant management: by type, Outcome 26 Endometritis. | ||||
| 27 Postpartum fever Show forest plot | 1 | 1835 | Risk Ratio (M‐H, Fixed, 95% CI) | 0.52 [0.26, 1.03] |
| Analysis 1.27  Comparison 1 Any planned birth versus expectant management: by type, Outcome 27 Postpartum fever. | ||||
| 28 Placental abruption Show forest plot | 1 | 1835 | Risk Ratio (M‐H, Fixed, 95% CI) | 1.19 [0.36, 3.87] |
| Analysis 1.28  Comparison 1 Any planned birth versus expectant management: by type, Outcome 28 Placental abruption. | ||||
| 29 Induction of labour Show forest plot | 4 | 2691 | Risk Ratio (M‐H, Fixed, 95% CI) | 2.18 [2.01, 2.36] |
| Analysis 1.29  Comparison 1 Any planned birth versus expectant management: by type, Outcome 29 Induction of labour. | ||||
| 30 Use of epidural/spinal anaesthesia Show forest plot | 3 | 2562 | Risk Ratio (M‐H, Random, 95% CI) | 1.28 [0.99, 1.65] |
| Analysis 1.30  Comparison 1 Any planned birth versus expectant management: by type, Outcome 30 Use of epidural/spinal anaesthesia. | ||||
| 31 Vaginal birth Show forest plot | 12 | 3618 | Risk Ratio (M‐H, Fixed, 95% CI) | 0.94 [0.91, 0.97] |
| Analysis 1.31 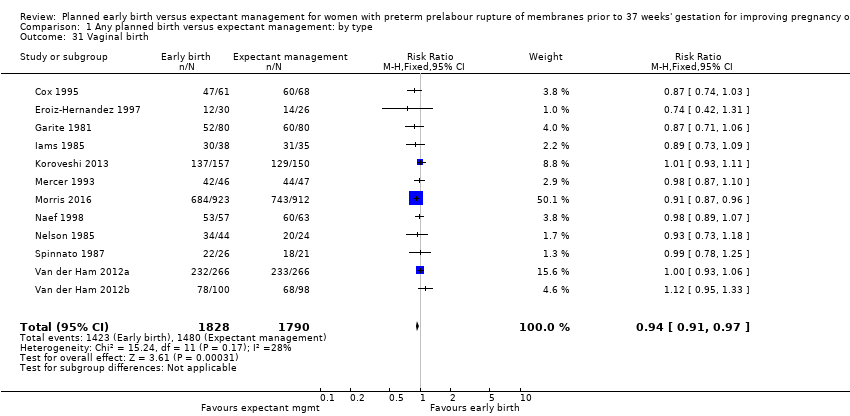 Comparison 1 Any planned birth versus expectant management: by type, Outcome 31 Vaginal birth. | ||||
| 32 Operative vaginal birth Show forest plot | 4 | 2685 | Risk Ratio (M‐H, Fixed, 95% CI) | 0.85 [0.67, 1.10] |
| Analysis 1.32 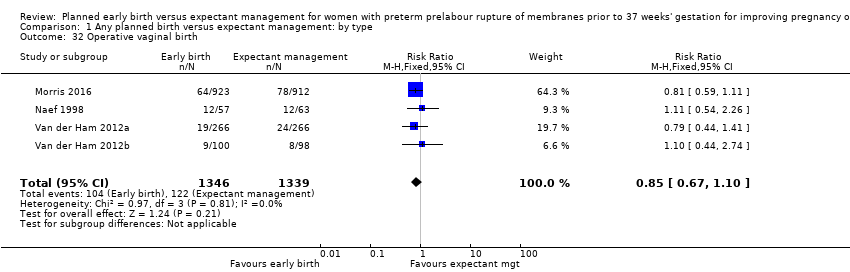 Comparison 1 Any planned birth versus expectant management: by type, Outcome 32 Operative vaginal birth. | ||||
| 33 Caesarean section for fetal distress Show forest plot | 7 | 2918 | Risk Ratio (M‐H, Fixed, 95% CI) | 0.89 [0.66, 1.20] |
| Analysis 1.33  Comparison 1 Any planned birth versus expectant management: by type, Outcome 33 Caesarean section for fetal distress. | ||||
| 34 Duration (days) of maternal hospitalisation Show forest plot | 6 | 2848 | Mean Difference (IV, Random, 95% CI) | ‐1.75 [‐2.45, ‐1.05] |
| Analysis 1.34 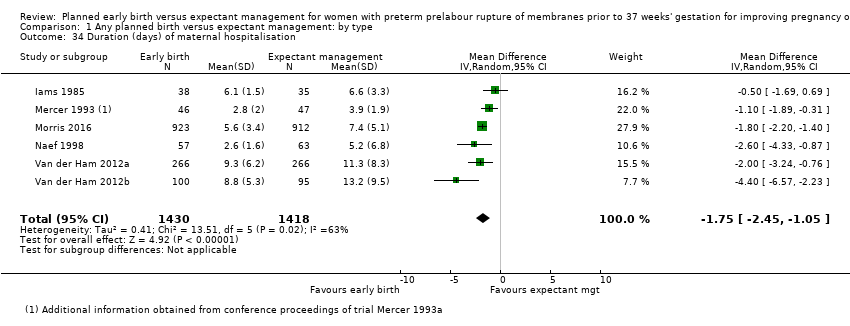 Comparison 1 Any planned birth versus expectant management: by type, Outcome 34 Duration (days) of maternal hospitalisation. | ||||
| 35 Duration (days) of antenatal hospitalisation Show forest plot | 1 | 73 | Mean Difference (IV, Fixed, 95% CI) | ‐6.30 [‐9.67, ‐2.93] |
| Analysis 1.35 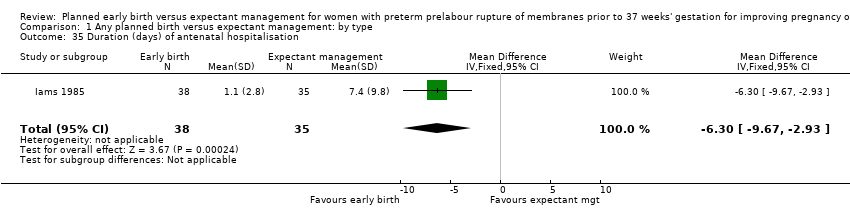 Comparison 1 Any planned birth versus expectant management: by type, Outcome 35 Duration (days) of antenatal hospitalisation. | ||||
| 36 Duration (days) of maternal hospitalisation (excluding trials with antenatal discharge) Show forest plot | 2 | 213 | Mean Difference (IV, Random, 95% CI) | ‐1.64 [‐3.06, ‐0.23] |
| Analysis 1.36  Comparison 1 Any planned birth versus expectant management: by type, Outcome 36 Duration (days) of maternal hospitalisation (excluding trials with antenatal discharge). | ||||
| 37 Time (hours) from randomisation to birth Show forest plot | 3 | 2571 | Mean Difference (IV, Fixed, 95% CI) | ‐79.48 [‐88.27, ‐70.69] |
| Analysis 1.37  Comparison 1 Any planned birth versus expectant management: by type, Outcome 37 Time (hours) from randomisation to birth. | ||||
| 38 Disability at 2 years, abnormal CBCL Show forest plot | 1 | 199 | Risk Ratio (M‐H, Fixed, 95% CI) | 0.64 [0.26, 1.59] |
| Analysis 1.38 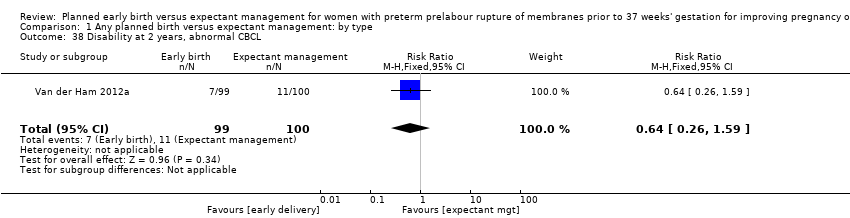 Comparison 1 Any planned birth versus expectant management: by type, Outcome 38 Disability at 2 years, abnormal CBCL. | ||||
| 39 Disability at 2 years, abnormal ASQ Show forest plot | 1 | 228 | Risk Ratio (M‐H, Fixed, 95% CI) | 0.61 [0.35, 1.05] |
| Analysis 1.39  Comparison 1 Any planned birth versus expectant management: by type, Outcome 39 Disability at 2 years, abnormal ASQ. | ||||
| 40 Maternal satisfaction Show forest plot | 1 | 493 | Risk Ratio (M‐H, Fixed, 95% CI) | 0.99 [0.86, 1.13] |
| Analysis 1.40  Comparison 1 Any planned birth versus expectant management: by type, Outcome 40 Maternal satisfaction. | ||||
| 41 Breastfeeding > 12 weeks Show forest plot | 1 | 415 | Risk Ratio (M‐H, Fixed, 95% CI) | 0.95 [0.80, 1.12] |
| Analysis 1.41 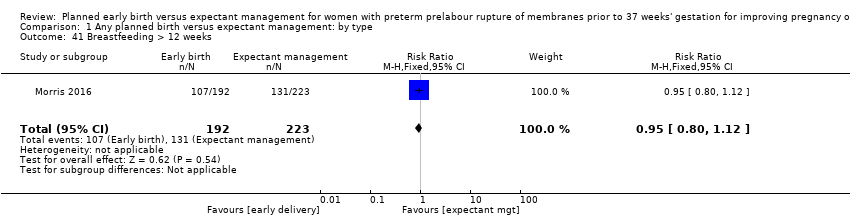 Comparison 1 Any planned birth versus expectant management: by type, Outcome 41 Breastfeeding > 12 weeks. | ||||
| Outcome or subgroup title | No. of studies | No. of participants | Statistical method | Effect size |
| 1 Neonatal infection Show forest plot | 12 | 3652 | Risk Ratio (M‐H, Fixed, 95% CI) | 0.94 [0.68, 1.32] |
| Analysis 2.1  Comparison 2 Any planned birth versus expectant management (subgroup analysis by corticosteroid usage), Outcome 1 Neonatal infection. | ||||
| 1.1 Antenatal corticosteroids | 0 | 0 | Risk Ratio (M‐H, Fixed, 95% CI) | 0.0 [0.0, 0.0] |
| 1.2 No antenatal corticosteroids | 6 | 495 | Risk Ratio (M‐H, Fixed, 95% CI) | 0.98 [0.48, 2.03] |
| 1.3 Some antenatal corticosteroids | 6 | 2850 | Risk Ratio (M‐H, Fixed, 95% CI) | 0.95 [0.64, 1.41] |
| 1.4 Not known | 1 | 307 | Risk Ratio (M‐H, Fixed, 95% CI) | 0.80 [0.25, 2.55] |
| 2 Neonatal infection confirmed with positive culture Show forest plot | 7 | 2939 | Risk Ratio (M‐H, Fixed, 95% CI) | 1.29 [0.74, 2.23] |
| Analysis 2.2  Comparison 2 Any planned birth versus expectant management (subgroup analysis by corticosteroid usage), Outcome 2 Neonatal infection confirmed with positive culture. | ||||
| 2.1 Antenatal corticosteroids | 0 | 0 | Risk Ratio (M‐H, Fixed, 95% CI) | 0.0 [0.0, 0.0] |
| 2.2 No antenatal corticosteroids | 3 | 259 | Risk Ratio (M‐H, Fixed, 95% CI) | 0.60 [0.18, 2.04] |
| 2.3 Some antenatal corticosteroids | 5 | 2680 | Risk Ratio (M‐H, Fixed, 95% CI) | 1.59 [0.85, 3.00] |
| 3 Respiratory distress syndrome Show forest plot | 12 | 3646 | Risk Ratio (M‐H, Fixed, 95% CI) | 1.29 [1.07, 1.56] |
| Analysis 2.3  Comparison 2 Any planned birth versus expectant management (subgroup analysis by corticosteroid usage), Outcome 3 Respiratory distress syndrome. | ||||
| 3.1 Antenatal corticosteroids | 0 | 0 | Risk Ratio (M‐H, Fixed, 95% CI) | 0.0 [0.0, 0.0] |
| 3.2 No antenatal corticosteroids | 6 | 495 | Risk Ratio (M‐H, Fixed, 95% CI) | 1.32 [0.96, 1.83] |
| 3.3 Some antenatal corticosteroids | 6 | 2844 | Risk Ratio (M‐H, Fixed, 95% CI) | 1.28 [1.01, 1.63] |
| 3.4 Not known | 1 | 307 | Risk Ratio (M‐H, Fixed, 95% CI) | 1.27 [0.55, 2.94] |
| 4 Caesarean section Show forest plot | 12 | 3644 | Risk Ratio (M‐H, Fixed, 95% CI) | 1.26 [1.11, 1.44] |
| Analysis 2.4 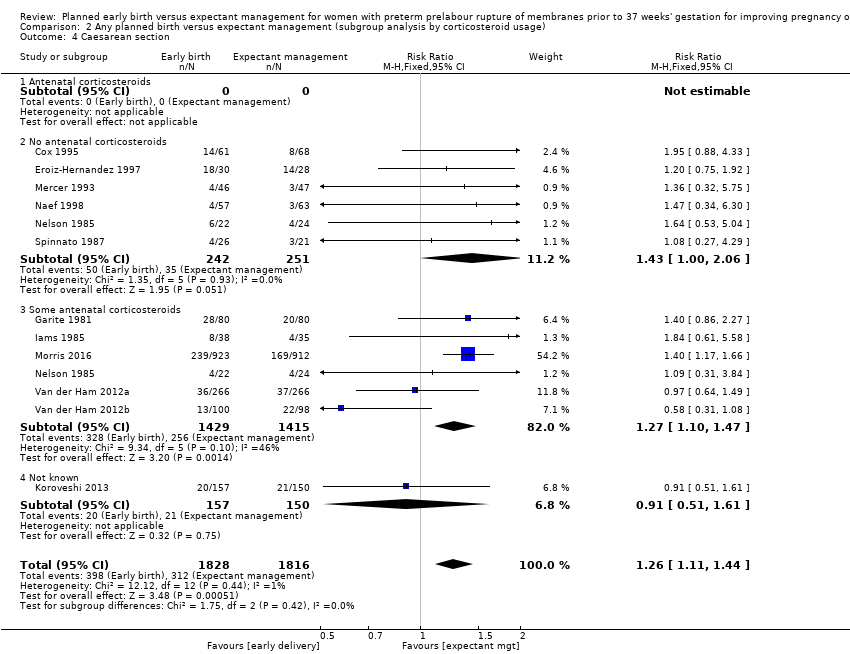 Comparison 2 Any planned birth versus expectant management (subgroup analysis by corticosteroid usage), Outcome 4 Caesarean section. | ||||
| 4.1 Antenatal corticosteroids | 0 | 0 | Risk Ratio (M‐H, Fixed, 95% CI) | 0.0 [0.0, 0.0] |
| 4.2 No antenatal corticosteroids | 6 | 493 | Risk Ratio (M‐H, Fixed, 95% CI) | 1.43 [1.00, 2.06] |
| 4.3 Some antenatal corticosteroids | 6 | 2844 | Risk Ratio (M‐H, Fixed, 95% CI) | 1.27 [1.10, 1.47] |
| 4.4 Not known | 1 | 307 | Risk Ratio (M‐H, Fixed, 95% CI) | 0.91 [0.51, 1.61] |
| 5 Chorioamnionitis Show forest plot | 8 | 1358 | Risk Ratio (M‐H, Fixed, 95% CI) | 0.49 [0.33, 0.72] |
| Analysis 2.5  Comparison 2 Any planned birth versus expectant management (subgroup analysis by corticosteroid usage), Outcome 5 Chorioamnionitis. | ||||
| 5.1 Antenatal corticosteroids | 0 | 0 | Risk Ratio (M‐H, Fixed, 95% CI) | 0.0 [0.0, 0.0] |
| 5.2 No antenatal corticosteroids | 4 | 398 | Risk Ratio (M‐H, Fixed, 95% CI) | 0.38 [0.22, 0.67] |
| 5.3 Some antenatal corticosteroids | 4 | 960 | Risk Ratio (M‐H, Fixed, 95% CI) | 0.61 [0.36, 1.06] |
| 6 Endometritis Show forest plot | 7 | 2980 | Risk Ratio (M‐H, Fixed, 95% CI) | 1.61 [1.00, 2.59] |
| Analysis 2.6  Comparison 2 Any planned birth versus expectant management (subgroup analysis by corticosteroid usage), Outcome 6 Endometritis. | ||||
| 6.1 Antenatal corticosteroids | 0 | 0 | Risk Ratio (M‐H, Fixed, 95% CI) | 0.0 [0.0, 0.0] |
| 6.2 No antenatal corticosteroids | 2 | 185 | Risk Ratio (M‐H, Fixed, 95% CI) | 1.38 [0.32, 5.94] |
| 6.3 Some antenatal corticosteroids | 5 | 2795 | Risk Ratio (M‐H, Fixed, 95% CI) | 1.64 [0.99, 2.72] |
| Outcome or subgroup title | No. of studies | No. of participants | Statistical method | Effect size |
| 1 Neonatal infection Show forest plot | 12 | 3628 | Risk Ratio (M‐H, Fixed, 95% CI) | 0.93 [0.66, 1.30] |
| Analysis 3.1  Comparison 3 Any planned birth versus expectant management (subgroup analysis by gestational age for inclusion in trial), Outcome 1 Neonatal infection. | ||||
| 1.1 Greater than 34 weeks' gestation | 5 | 2998 | Risk Ratio (M‐H, Fixed, 95% CI) | 0.71 [0.47, 1.07] |
| 1.2 Less than 34 weeks' gestation | 5 | 490 | Risk Ratio (M‐H, Fixed, 95% CI) | 1.61 [0.74, 3.50] |
| 1.3 Not specified (wider span) | 2 | 140 | Risk Ratio (M‐H, Fixed, 95% CI) | 2.00 [0.65, 6.18] |
| 2 Neonatal infection confirmed with positive culture Show forest plot | 7 | 2925 | Risk Ratio (M‐H, Fixed, 95% CI) | 1.24 [0.70, 2.21] |
| Analysis 3.2  Comparison 3 Any planned birth versus expectant management (subgroup analysis by gestational age for inclusion in trial), Outcome 2 Neonatal infection confirmed with positive culture. | ||||
| 2.1 Greater than 34 weeks' gestation | 4 | 2691 | Risk Ratio (M‐H, Fixed, 95% CI) | 1.07 [0.52, 2.20] |
| 2.2 Less than 34 weeks' gestation | 2 | 141 | Risk Ratio (M‐H, Fixed, 95% CI) | 1.67 [0.52, 5.35] |
| 2.3 Not specified (wider span) | 1 | 93 | Risk Ratio (M‐H, Fixed, 95% CI) | 1.53 [0.27, 8.75] |
| 3 Respiratory distress syndrome Show forest plot | 12 | 3622 | Risk Ratio (M‐H, Fixed, 95% CI) | 1.26 [1.05, 1.53] |
| Analysis 3.3  Comparison 3 Any planned birth versus expectant management (subgroup analysis by gestational age for inclusion in trial), Outcome 3 Respiratory distress syndrome. | ||||
| 3.1 Greater than 34 weeks' gestation | 5 | 2992 | Risk Ratio (M‐H, Fixed, 95% CI) | 1.45 [1.10, 1.90] |
| 3.2 Less than 34 weeks' gestation | 5 | 490 | Risk Ratio (M‐H, Fixed, 95% CI) | 1.09 [0.84, 1.43] |
| 3.3 Not specified (wider span) | 2 | 140 | Risk Ratio (M‐H, Fixed, 95% CI) | 0.81 [0.27, 2.42] |
| 4 Caesarean section Show forest plot | 12 | 3620 | Risk Ratio (M‐H, Fixed, 95% CI) | 1.26 [1.11, 1.44] |
| Analysis 3.4 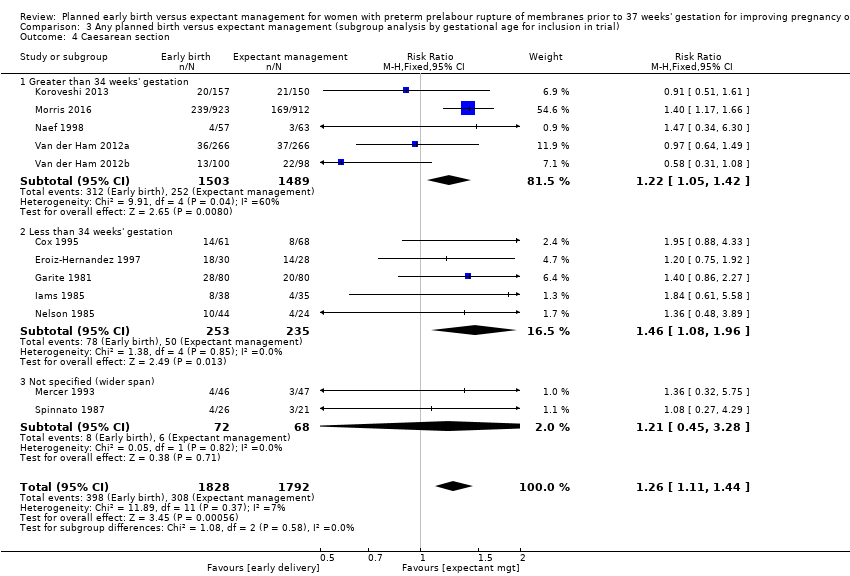 Comparison 3 Any planned birth versus expectant management (subgroup analysis by gestational age for inclusion in trial), Outcome 4 Caesarean section. | ||||
| 4.1 Greater than 34 weeks' gestation | 5 | 2992 | Risk Ratio (M‐H, Fixed, 95% CI) | 1.22 [1.05, 1.42] |
| 4.2 Less than 34 weeks' gestation | 5 | 488 | Risk Ratio (M‐H, Fixed, 95% CI) | 1.46 [1.08, 1.96] |
| 4.3 Not specified (wider span) | 2 | 140 | Risk Ratio (M‐H, Fixed, 95% CI) | 1.21 [0.45, 3.28] |
| 5 Chorioamnionitis Show forest plot | 8 | 1358 | Risk Ratio (M‐H, Fixed, 95% CI) | 0.49 [0.33, 0.72] |
| Analysis 3.5  Comparison 3 Any planned birth versus expectant management (subgroup analysis by gestational age for inclusion in trial), Outcome 5 Chorioamnionitis. | ||||
| 5.1 Greater than 34 weeks' gestation | 3 | 847 | Risk Ratio (M‐H, Fixed, 95% CI) | 0.26 [0.12, 0.57] |
| 5.2 Less than 34 weeks' gestation | 4 | 418 | Risk Ratio (M‐H, Fixed, 95% CI) | 0.77 [0.45, 1.30] |
| 5.3 Not specified (wider span) | 1 | 93 | Risk Ratio (M‐H, Fixed, 95% CI) | 0.39 [0.15, 1.01] |
| 6 Endometritis Show forest plot | 7 | 2980 | Risk Ratio (M‐H, Fixed, 95% CI) | 1.61 [1.00, 2.59] |
| Analysis 3.6  Comparison 3 Any planned birth versus expectant management (subgroup analysis by gestational age for inclusion in trial), Outcome 6 Endometritis. | ||||
| 6.1 Greater than 34 weeks' gestation | 3 | 2562 | Risk Ratio (M‐H, Fixed, 95% CI) | 0.37 [0.10, 1.40] |
| 6.2 Less than 34 weeks' gestation | 4 | 418 | Risk Ratio (M‐H, Fixed, 95% CI) | 2.23 [1.29, 3.84] |
| Outcome or subgroup title | No. of studies | No. of participants | Statistical method | Effect size |
| 1 Neonatal infection Show forest plot | 12 | 3625 | Risk Ratio (M‐H, Fixed, 95% CI) | 0.93 [0.66, 1.30] |
| Analysis 4.1  Comparison 4 Any planned birth versus expectant management (subgroup analysis by antibiotic use), Outcome 1 Neonatal infection. | ||||
| 1.1 Prophylactic antibiotics used | 2 | 1702 | Risk Ratio (M‐H, Fixed, 95% CI) | 0.74 [0.42, 1.31] |
| 1.2 Prophylactic antibiotics not used | 8 | 880 | Risk Ratio (M‐H, Fixed, 95% CI) | 1.42 [0.81, 2.51] |
| 1.3 Some prophylactic antibiotics used | 2 | 736 | Risk Ratio (M‐H, Fixed, 95% CI) | 0.67 [0.30, 1.46] |
| 1.4 Not specified | 1 | 307 | Risk Ratio (M‐H, Fixed, 95% CI) | 0.80 [0.25, 2.55] |
| 2 Neonatal infection confirmed with positive culture Show forest plot | 7 | 2925 | Risk Ratio (M‐H, Fixed, 95% CI) | 1.24 [0.70, 2.21] |
| Analysis 4.2  Comparison 4 Any planned birth versus expectant management (subgroup analysis by antibiotic use), Outcome 2 Neonatal infection confirmed with positive culture. | ||||
| 2.1 Prophylactic antibiotics used | 1 | 120 | Risk Ratio (M‐H, Fixed, 95% CI) | 0.16 [0.01, 2.99] |
| 2.2 Prophylactic antibiotics not used | 3 | 234 | Risk Ratio (M‐H, Fixed, 95% CI) | 1.63 [0.62, 4.28] |
| 2.3 Some prophylactic antibiotics used | 3 | 2571 | Risk Ratio (M‐H, Fixed, 95% CI) | 1.35 [0.62, 2.93] |
| 3 Respiratory distress syndrome Show forest plot | 12 | 3622 | Risk Ratio (M‐H, Fixed, 95% CI) | 1.29 [1.06, 1.56] |
| Analysis 4.3  Comparison 4 Any planned birth versus expectant management (subgroup analysis by antibiotic use), Outcome 3 Respiratory distress syndrome. | ||||
| 3.1 Prophylactic antibiotics used | 1 | 120 | Risk Ratio (M‐H, Fixed, 95% CI) | 1.11 [0.23, 5.26] |
| 3.2 Prophylactic antibiotics not used | 7 | 630 | Risk Ratio (M‐H, Fixed, 95% CI) | 1.11 [0.85, 1.45] |
| 3.3 Some prophylactic antibiotics used | 3 | 2565 | Risk Ratio (M‐H, Fixed, 95% CI) | 1.48 [1.10, 1.99] |
| 3.4 Not specified | 1 | 307 | Risk Ratio (M‐H, Fixed, 95% CI) | 1.27 [0.55, 2.94] |
| 4 Caesarean section Show forest plot | 12 | 3620 | Risk Ratio (M‐H, Fixed, 95% CI) | 1.30 [1.14, 1.49] |
| Analysis 4.4  Comparison 4 Any planned birth versus expectant management (subgroup analysis by antibiotic use), Outcome 4 Caesarean section. | ||||
| 4.1 Prophylactic antibiotics used | 1 | 120 | Risk Ratio (M‐H, Fixed, 95% CI) | 1.47 [0.34, 6.30] |
| 4.2 Prophylactic antibiotics not used | 7 | 628 | Risk Ratio (M‐H, Fixed, 95% CI) | 1.43 [1.08, 1.90] |
| 4.3 Some prophylactic antibiotics used | 3 | 2565 | Risk Ratio (M‐H, Fixed, 95% CI) | 1.31 [1.12, 1.53] |
| 4.4 Not specified | 1 | 307 | Risk Ratio (M‐H, Fixed, 95% CI) | 0.91 [0.51, 1.61] |
| 5 Chorioamnionitis Show forest plot | 8 | 1358 | Risk Ratio (M‐H, Random, 95% CI) | 0.50 [0.26, 0.95] |
| Analysis 4.5  Comparison 4 Any planned birth versus expectant management (subgroup analysis by antibiotic use), Outcome 5 Chorioamnionitis. | ||||
| 5.1 Prophylactic antibiotics used | 1 | 120 | Risk Ratio (M‐H, Random, 95% CI) | 0.11 [0.01, 0.84] |
| 5.2 Prophylactic antibiotics not used | 5 | 511 | Risk Ratio (M‐H, Random, 95% CI) | 0.69 [0.34, 1.41] |
| 5.3 Some prophylactic antibiotics used | 2 | 727 | Risk Ratio (M‐H, Random, 95% CI) | 0.35 [0.15, 0.86] |
| 6 Endometritis Show forest plot | 7 | 2980 | Risk Ratio (M‐H, Fixed, 95% CI) | 1.61 [1.00, 2.59] |
| Analysis 4.6 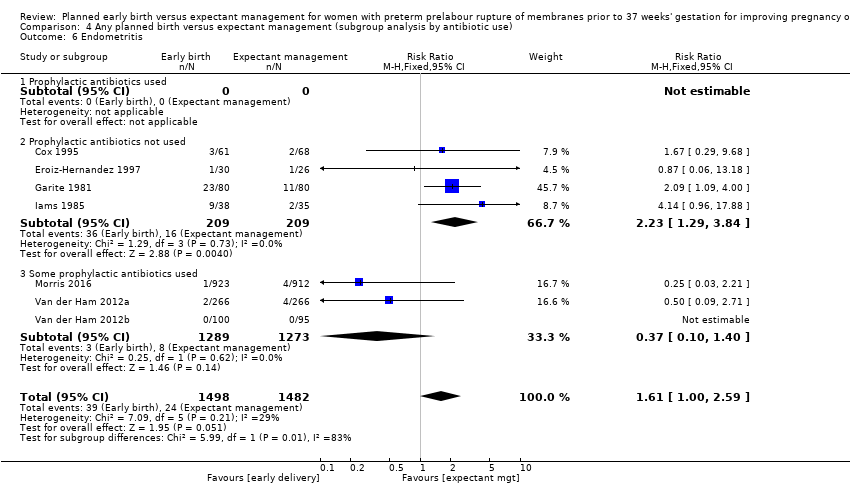 Comparison 4 Any planned birth versus expectant management (subgroup analysis by antibiotic use), Outcome 6 Endometritis. | ||||
| 6.1 Prophylactic antibiotics used | 0 | 0 | Risk Ratio (M‐H, Fixed, 95% CI) | 0.0 [0.0, 0.0] |
| 6.2 Prophylactic antibiotics not used | 4 | 418 | Risk Ratio (M‐H, Fixed, 95% CI) | 2.23 [1.29, 3.84] |
| 6.3 Some prophylactic antibiotics used | 3 | 2562 | Risk Ratio (M‐H, Fixed, 95% CI) | 0.37 [0.10, 1.40] |
| Outcome or subgroup title | No. of studies | No. of participants | Statistical method | Effect size |
| 1 Neonatal infection Show forest plot | 12 | 3628 | Risk Ratio (M‐H, Fixed, 95% CI) | 0.93 [0.66, 1.30] |
| Analysis 5.1  Comparison 5 Any planned birth versus expectant management (subgroup analysis by timing of early delivery), Outcome 1 Neonatal infection. | ||||
| 1.1 Less than 24 hours from randomisation | 4 | 391 | Risk Ratio (M‐H, Fixed, 95% CI) | 0.90 [0.41, 1.99] |
| 1.2 Greater than 24 hours from randomisation | 7 | 2930 | Risk Ratio (M‐H, Fixed, 95% CI) | 0.95 [0.64, 1.41] |
| 1.3 Not known | 1 | 307 | Risk Ratio (M‐H, Fixed, 95% CI) | 0.80 [0.25, 2.55] |
| 2 Neonatal infection confirmed with positive culture Show forest plot | 7 | 2925 | Risk Ratio (M‐H, Fixed, 95% CI) | 1.24 [0.70, 2.21] |
| Analysis 5.2 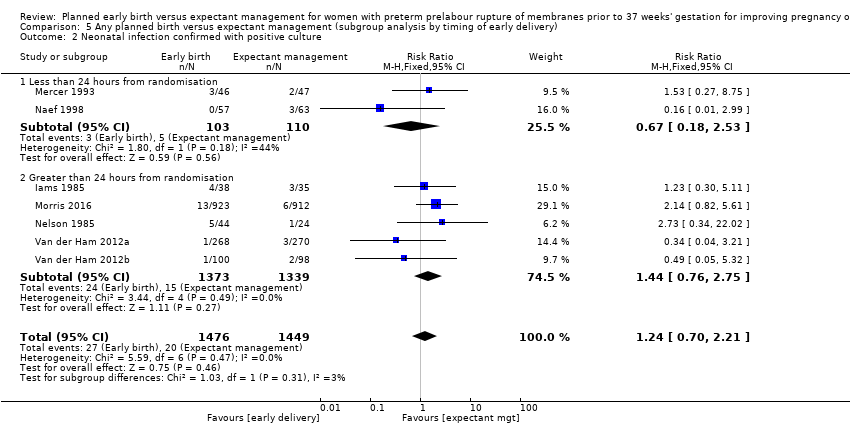 Comparison 5 Any planned birth versus expectant management (subgroup analysis by timing of early delivery), Outcome 2 Neonatal infection confirmed with positive culture. | ||||
| 2.1 Less than 24 hours from randomisation | 2 | 213 | Risk Ratio (M‐H, Fixed, 95% CI) | 0.67 [0.18, 2.53] |
| 2.2 Greater than 24 hours from randomisation | 5 | 2712 | Risk Ratio (M‐H, Fixed, 95% CI) | 1.44 [0.76, 2.75] |
| 3 Respiratory distress syndrome Show forest plot | 12 | 3622 | Risk Ratio (M‐H, Fixed, 95% CI) | 1.29 [1.06, 1.56] |
| Analysis 5.3  Comparison 5 Any planned birth versus expectant management (subgroup analysis by timing of early delivery), Outcome 3 Respiratory distress syndrome. | ||||
| 3.1 Less than 24 hours from randomisation | 4 | 391 | Risk Ratio (M‐H, Fixed, 95% CI) | 0.99 [0.65, 1.50] |
| 3.2 Greater than 24 hours from randomisation | 7 | 2924 | Risk Ratio (M‐H, Fixed, 95% CI) | 1.37 [1.10, 1.71] |
| 3.3 Not known | 1 | 307 | Risk Ratio (M‐H, Fixed, 95% CI) | 1.27 [0.55, 2.94] |
| 4 Caesarean section Show forest plot | 12 | 3620 | Risk Ratio (M‐H, Fixed, 95% CI) | 1.26 [1.11, 1.44] |
| Analysis 5.4  Comparison 5 Any planned birth versus expectant management (subgroup analysis by timing of early delivery), Outcome 4 Caesarean section. | ||||
| 4.1 Less than 24 hours from randomisation | 4 | 389 | Risk Ratio (M‐H, Fixed, 95% CI) | 1.59 [0.90, 2.81] |
| 4.2 Greater than 24 hours from randomisation | 7 | 2924 | Risk Ratio (M‐H, Fixed, 95% CI) | 1.27 [1.10, 1.46] |
| 4.3 Not known | 1 | 307 | Risk Ratio (M‐H, Fixed, 95% CI) | 0.91 [0.51, 1.61] |
| 5 Chorioamnionitis Show forest plot | 8 | 1358 | Risk Ratio (M‐H, Random, 95% CI) | 0.50 [0.26, 0.95] |
| Analysis 5.5 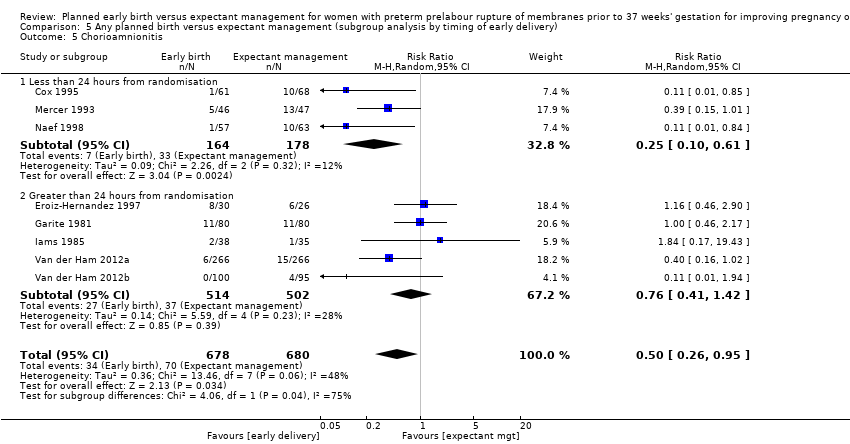 Comparison 5 Any planned birth versus expectant management (subgroup analysis by timing of early delivery), Outcome 5 Chorioamnionitis. | ||||
| 5.1 Less than 24 hours from randomisation | 3 | 342 | Risk Ratio (M‐H, Random, 95% CI) | 0.25 [0.10, 0.61] |
| 5.2 Greater than 24 hours from randomisation | 5 | 1016 | Risk Ratio (M‐H, Random, 95% CI) | 0.76 [0.41, 1.42] |
| 6 Endometritis Show forest plot | 7 | 2980 | Risk Ratio (M‐H, Fixed, 95% CI) | 1.61 [1.00, 2.59] |
| Analysis 5.6  Comparison 5 Any planned birth versus expectant management (subgroup analysis by timing of early delivery), Outcome 6 Endometritis. | ||||
| 6.1 Less than 24 hours from randomisation | 1 | 129 | Risk Ratio (M‐H, Fixed, 95% CI) | 1.67 [0.29, 9.68] |
| 6.2 Greater than 24 hours from randomisation | 6 | 2851 | Risk Ratio (M‐H, Fixed, 95% CI) | 1.60 [0.98, 2.63] |


Risk of bias graph: review authors' judgements about each risk of bias item presented as percentages across all included studies
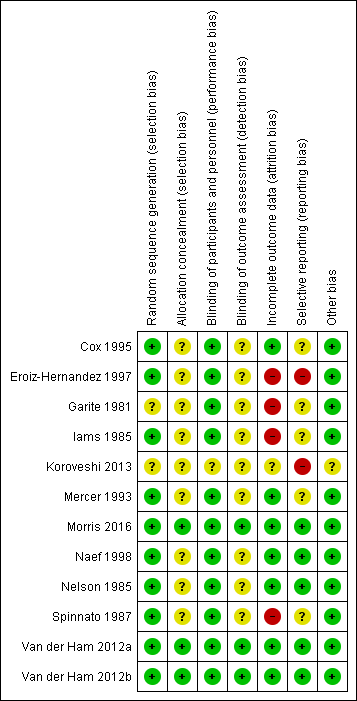
Risk of bias summary: review authors' judgements about each risk of bias item for each included study
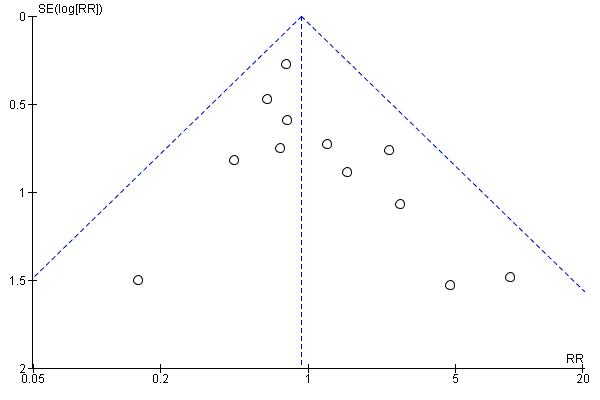
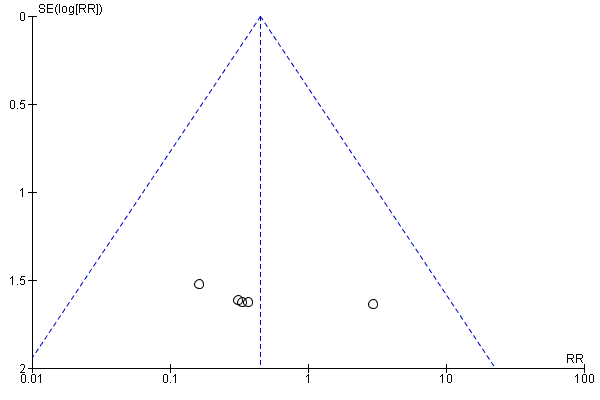
Funnel plot of comparison: 1 Any planned birth versus expectant management: by type, outcome: 1.1 Neonatal infection/sepsis

Funnel plot of comparison: 1 Any planned birth versus expectant management: by type, outcome: 1.3 Respiratory distress syndrome

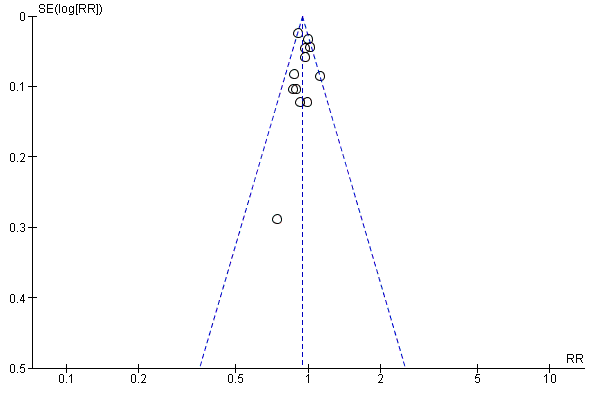
Funnel plot of comparison: 1 Any planned birth versus expectant management: by type, outcome: 1.4 Caesarean section

Funnel plot of comparison: 1 Any planned birth versus expectant management: by type, outcome: 1.5 Perinatal mortality
Funnel plot of comparison: 1 Any planned birth versus expectant management: by type, outcome: 1.6 Intrauterine death

Funnel plot of comparison: 1 Any planned birth versus expectant management: by type, outcome: 1.9 Neonatal death
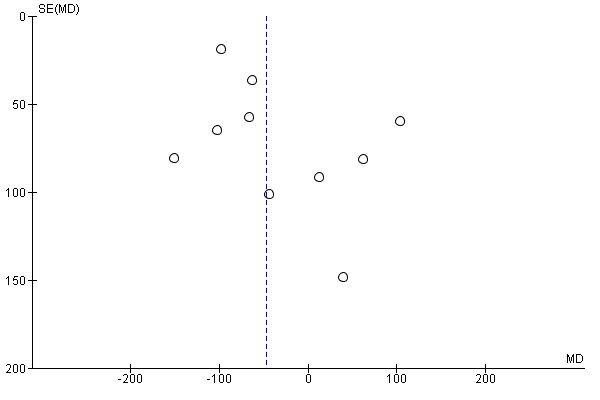
Funnel plot of comparison: 1 Any planned birth versus expectant management: by type, outcome: 1.15 Birthweight (g)
Funnel plot of comparison: 1 Any planned birth versus expectant management: by type, outcome: 1.31 Vaginal birth
Comparison 1 Any planned birth versus expectant management: by type, Outcome 1 Neonatal infection/sepsis.
Comparison 1 Any planned birth versus expectant management: by type, Outcome 2 Neonatal infection confirmed with positive blood culture.
Comparison 1 Any planned birth versus expectant management: by type, Outcome 3 Respiratory distress syndrome.
Comparison 1 Any planned birth versus expectant management: by type, Outcome 4 Caesarean section.
Comparison 1 Any planned birth versus expectant management: by type, Outcome 5 Perinatal mortality.
Comparison 1 Any planned birth versus expectant management: by type, Outcome 6 Intrauterine death.
Comparison 1 Any planned birth versus expectant management: by type, Outcome 7 Cord prolapse.
Comparison 1 Any planned birth versus expectant management: by type, Outcome 8 Gestational age at birth (weeks).
Comparison 1 Any planned birth versus expectant management: by type, Outcome 9 Neonatal death.
Comparison 1 Any planned birth versus expectant management: by type, Outcome 10 Suspected neonatal infection.
Comparison 1 Any planned birth versus expectant management: by type, Outcome 11 Neonatal treatment with antibiotics.
Comparison 1 Any planned birth versus expectant management: by type, Outcome 12 Need for ventilation.
Comparison 1 Any planned birth versus expectant management: by type, Outcome 13 Duration of oxygen therapy (days).
Comparison 1 Any planned birth versus expectant management: by type, Outcome 14 Umbilical cord arterial pH.
Comparison 1 Any planned birth versus expectant management: by type, Outcome 15 Birthweight (g).
Comparison 1 Any planned birth versus expectant management: by type, Outcome 16 Apgar score less than 7 at 5 minutes.
Comparison 1 Any planned birth versus expectant management: by type, Outcome 17 Abnormality on cerebral ultrasound.
Comparison 1 Any planned birth versus expectant management: by type, Outcome 18 Periventricular leukomalacia.
Comparison 1 Any planned birth versus expectant management: by type, Outcome 19 Cerebroventricular haemorrhage.
Comparison 1 Any planned birth versus expectant management: by type, Outcome 20 Necrotising enterocolitis.
Comparison 1 Any planned birth versus expectant management: by type, Outcome 21 Severe respiratory distress.
Comparison 1 Any planned birth versus expectant management: by type, Outcome 22 Admission to neonatal intensive care unit.
Comparison 1 Any planned birth versus expectant management: by type, Outcome 23 Length of stay in neonatal intensive care unit (days).
Comparison 1 Any planned birth versus expectant management: by type, Outcome 24 Duration (days) from birth to neonatal hospital discharge.
Comparison 1 Any planned birth versus expectant management: by type, Outcome 25 Chorioamnionitis.
Comparison 1 Any planned birth versus expectant management: by type, Outcome 26 Endometritis.
Comparison 1 Any planned birth versus expectant management: by type, Outcome 27 Postpartum fever.
Comparison 1 Any planned birth versus expectant management: by type, Outcome 28 Placental abruption.
Comparison 1 Any planned birth versus expectant management: by type, Outcome 29 Induction of labour.
Comparison 1 Any planned birth versus expectant management: by type, Outcome 30 Use of epidural/spinal anaesthesia.
Comparison 1 Any planned birth versus expectant management: by type, Outcome 31 Vaginal birth.
Comparison 1 Any planned birth versus expectant management: by type, Outcome 32 Operative vaginal birth.
Comparison 1 Any planned birth versus expectant management: by type, Outcome 33 Caesarean section for fetal distress.
Comparison 1 Any planned birth versus expectant management: by type, Outcome 34 Duration (days) of maternal hospitalisation.
Comparison 1 Any planned birth versus expectant management: by type, Outcome 35 Duration (days) of antenatal hospitalisation.
Comparison 1 Any planned birth versus expectant management: by type, Outcome 36 Duration (days) of maternal hospitalisation (excluding trials with antenatal discharge).
Comparison 1 Any planned birth versus expectant management: by type, Outcome 37 Time (hours) from randomisation to birth.
Comparison 1 Any planned birth versus expectant management: by type, Outcome 38 Disability at 2 years, abnormal CBCL.
Comparison 1 Any planned birth versus expectant management: by type, Outcome 39 Disability at 2 years, abnormal ASQ.
Comparison 1 Any planned birth versus expectant management: by type, Outcome 40 Maternal satisfaction.
Comparison 1 Any planned birth versus expectant management: by type, Outcome 41 Breastfeeding > 12 weeks.
Comparison 2 Any planned birth versus expectant management (subgroup analysis by corticosteroid usage), Outcome 1 Neonatal infection.
Comparison 2 Any planned birth versus expectant management (subgroup analysis by corticosteroid usage), Outcome 2 Neonatal infection confirmed with positive culture.
Comparison 2 Any planned birth versus expectant management (subgroup analysis by corticosteroid usage), Outcome 3 Respiratory distress syndrome.
Comparison 2 Any planned birth versus expectant management (subgroup analysis by corticosteroid usage), Outcome 4 Caesarean section.
Comparison 2 Any planned birth versus expectant management (subgroup analysis by corticosteroid usage), Outcome 5 Chorioamnionitis.
Comparison 2 Any planned birth versus expectant management (subgroup analysis by corticosteroid usage), Outcome 6 Endometritis.
Comparison 3 Any planned birth versus expectant management (subgroup analysis by gestational age for inclusion in trial), Outcome 1 Neonatal infection.
Comparison 3 Any planned birth versus expectant management (subgroup analysis by gestational age for inclusion in trial), Outcome 2 Neonatal infection confirmed with positive culture.
Comparison 3 Any planned birth versus expectant management (subgroup analysis by gestational age for inclusion in trial), Outcome 3 Respiratory distress syndrome.
Comparison 3 Any planned birth versus expectant management (subgroup analysis by gestational age for inclusion in trial), Outcome 4 Caesarean section.
Comparison 3 Any planned birth versus expectant management (subgroup analysis by gestational age for inclusion in trial), Outcome 5 Chorioamnionitis.
Comparison 3 Any planned birth versus expectant management (subgroup analysis by gestational age for inclusion in trial), Outcome 6 Endometritis.
Comparison 4 Any planned birth versus expectant management (subgroup analysis by antibiotic use), Outcome 1 Neonatal infection.
Comparison 4 Any planned birth versus expectant management (subgroup analysis by antibiotic use), Outcome 2 Neonatal infection confirmed with positive culture.
Comparison 4 Any planned birth versus expectant management (subgroup analysis by antibiotic use), Outcome 3 Respiratory distress syndrome.
Comparison 4 Any planned birth versus expectant management (subgroup analysis by antibiotic use), Outcome 4 Caesarean section.
Comparison 4 Any planned birth versus expectant management (subgroup analysis by antibiotic use), Outcome 5 Chorioamnionitis.
Comparison 4 Any planned birth versus expectant management (subgroup analysis by antibiotic use), Outcome 6 Endometritis.
Comparison 5 Any planned birth versus expectant management (subgroup analysis by timing of early delivery), Outcome 1 Neonatal infection.
Comparison 5 Any planned birth versus expectant management (subgroup analysis by timing of early delivery), Outcome 2 Neonatal infection confirmed with positive culture.
Comparison 5 Any planned birth versus expectant management (subgroup analysis by timing of early delivery), Outcome 3 Respiratory distress syndrome.
Comparison 5 Any planned birth versus expectant management (subgroup analysis by timing of early delivery), Outcome 4 Caesarean section.
Comparison 5 Any planned birth versus expectant management (subgroup analysis by timing of early delivery), Outcome 5 Chorioamnionitis.
Comparison 5 Any planned birth versus expectant management (subgroup analysis by timing of early delivery), Outcome 6 Endometritis.
| Planned early birth compared to expectant management for preterm prelabour rupture of membranes prior to 37 weeks' gestation | ||||||
| Patient or population: women with preterm prelabour rupture of membranes prior to 37 weeks' gestation | ||||||
| Outcomes | Illustrative comparative risks* (95% CI) | Relative effect | No of participants | Quality of the evidence | Comments | |
| Assumed risk | Corresponding risk | |||||
| Expectant management | Planned early birth | |||||
| Neonatal infection/sepsis | Study population | RR 0.93 | 3628 | ⊕⊕⊕⊝ | ||
| 37 per 1000 | 34 per 1000 | |||||
| Neonatal respiratory distress syndrome | Study population | RR 1.26 | 3622 | ⊕⊕⊕⊕ | ||
| 84 per 1000 | 109 per 1000 | |||||
| Need for ventilation | Study population | RR 1.27 | 2895 | ⊕⊕⊕⊕ | ||
| 86 per 1000 | 110 per 1000 | |||||
| Admission to neonatal intensive care | Study population | RR 1.16 | 2691 | ⊕⊕⊕⊝ | ||
| 428 per 1000 | 497 per 1000 | |||||
| Caesarean section | Study population | RR 1.26 | 3620 | ⊕⊕⊕⊕ | ||
| 172 per 1000 | 217 per 1000 | |||||
| Chorioamnionitis | Study population | RR 0.50 | 1358 | ⊕⊕⊕⊝ | ||
| 103 per 1000 | 51 per 1000 | |||||
| Length of hospital stay (maternal) | The mean length of hospital stay (maternal) in the expectant group was | The mean length of hospital stay (maternal) in the early birth group was 1.75 days lower | MD ‐1.75 (‐2.45 to ‐1.05) | 2848 | ⊕⊕⊕⊝ | |
| *The basis for the assumed risk (e.g. the median control group risk across studies) is provided in footnotes. The corresponding risk (and its 95% confidence interval) is based on the assumed risk in the comparison group and the relative effect of the intervention (and its 95% CI). | ||||||
| GRADE Working Group grades of evidence | ||||||
| 1Wide confidence interval crossing the line of no effect, and the lines of appreciable benefit and harm. | ||||||
| Trial | Sample size | Gestational age for inclusion (weeks) | Co‐interventions | Fetal lung maturity tested |
| 129 (131 babies) 61 ED (62 babies) 68 EM (69 babies) | 30 to 34 |
| No | |
| 58 30 ED 28 EM | 28 to 34 |
| Yes, if positive excluded from randomisation | |
| 160 80 ED 80 EM | 28 to 34 |
| Yes: if L/S mature excluded from randomisation and delivered | |
| 73 38 ED 35 EM | 28 to 34 |
| Yes: if mature L/S excluded from randomisation and delivered | |
| 307 157 ED 150 EM | 34 to 37 |
| No | |
| 93 46 ED 47 EM | 32 to 36+ 6 |
| Yes: included if mature L/S | |
| 1835 923 ED 912 EM | 34 to 36+ 6 |
| No | |
| 120 57 ED 63 EM | 34 to 36+ 6 |
| No | |
| 68 22 ED and steroids 22 ED and no steroids 24 EM | 28 to 34 |
| No | |
| 47 26 to ED 21 to EM | 25 to 36 |
| Yes: included if mature L/S | |
| 532 (538 babies) 266 ED (268 babies) 266 EM (270 babies) | 34 to 36+6 |
| No | |
| 195 (198 babies) 100 ED (100 babies) 95 EM (98 babies) | 34 to 36+6 |
| No | |
| ED: early delivery | ||||
| Outcome or subgroup title | No. of studies | No. of participants | Statistical method | Effect size |
| 1 Neonatal infection/sepsis Show forest plot | 12 | 3628 | Risk Ratio (M‐H, Fixed, 95% CI) | 0.93 [0.66, 1.30] |
| 2 Neonatal infection confirmed with positive blood culture Show forest plot | 7 | 2925 | Risk Ratio (M‐H, Fixed, 95% CI) | 1.24 [0.70, 2.21] |
| 3 Respiratory distress syndrome Show forest plot | 12 | 3622 | Risk Ratio (M‐H, Fixed, 95% CI) | 1.26 [1.05, 1.53] |
| 4 Caesarean section Show forest plot | 12 | 3620 | Risk Ratio (M‐H, Fixed, 95% CI) | 1.26 [1.11, 1.44] |
| 5 Perinatal mortality Show forest plot | 11 | 3319 | Risk Ratio (M‐H, Fixed, 95% CI) | 1.76 [0.89, 3.50] |
| 6 Intrauterine death Show forest plot | 11 | 3321 | Risk Ratio (M‐H, Fixed, 95% CI) | 0.45 [0.13, 1.55] |
| 7 Cord prolapse Show forest plot | 4 | 2722 | Risk Ratio (M‐H, Fixed, 95% CI) | 1.24 [0.33, 4.61] |
| 8 Gestational age at birth (weeks) Show forest plot | 8 | 3139 | Mean Difference (IV, Fixed, 95% CI) | ‐0.48 [‐0.57, ‐0.39] |
| 9 Neonatal death Show forest plot | 11 | 3316 | Risk Ratio (M‐H, Fixed, 95% CI) | 2.55 [1.17, 5.56] |
| 10 Suspected neonatal infection Show forest plot | 3 | 829 | Risk Ratio (M‐H, Fixed, 95% CI) | 0.56 [0.36, 0.88] |
| 11 Neonatal treatment with antibiotics Show forest plot | 4 | 2638 | Risk Ratio (M‐H, Random, 95% CI) | 0.86 [0.63, 1.19] |
| 12 Need for ventilation Show forest plot | 7 | 2895 | Risk Ratio (M‐H, Fixed, 95% CI) | 1.27 [1.02, 1.58] |
| 13 Duration of oxygen therapy (days) Show forest plot | 1 | 73 | Mean Difference (IV, Fixed, 95% CI) | ‐3.05 [‐6.92, 0.82] |
| 14 Umbilical cord arterial pH Show forest plot | 1 | 120 | Mean Difference (IV, Fixed, 95% CI) | 0.09 [0.07, 0.11] |
| 15 Birthweight (g) Show forest plot | 10 | 3263 | Mean Difference (IV, Random, 95% CI) | ‐47.10 [‐96.00, 1.80] |
| 16 Apgar score less than 7 at 5 minutes Show forest plot | 5 | 2700 | Risk Ratio (M‐H, Fixed, 95% CI) | 0.96 [0.54, 1.69] |
| 17 Abnormality on cerebral ultrasound Show forest plot | 3 | 271 | Risk Ratio (M‐H, Fixed, 95% CI) | 1.90 [0.52, 6.92] |
| 18 Periventricular leukomalacia Show forest plot | 2 | 707 | Risk Ratio (M‐H, Fixed, 95% CI) | 1.00 [0.14, 6.99] |
| 19 Cerebroventricular haemorrhage Show forest plot | 6 | 1095 | Risk Ratio (M‐H, Fixed, 95% CI) | 1.19 [0.40, 3.52] |
| 20 Necrotising enterocolitis Show forest plot | 6 | 2842 | Risk Ratio (M‐H, Fixed, 95% CI) | 0.81 [0.25, 2.62] |
| 21 Severe respiratory distress Show forest plot | 3 | 321 | Risk Ratio (M‐H, Fixed, 95% CI) | 1.54 [0.80, 2.97] |
| 22 Admission to neonatal intensive care unit Show forest plot | 4 | 2691 | Risk Ratio (M‐H, Fixed, 95% CI) | 1.16 [1.08, 1.24] |
| 23 Length of stay in neonatal intensive care unit (days) Show forest plot | 4 | 2121 | Mean Difference (IV, Random, 95% CI) | ‐0.17 [‐1.62, 1.27] |
| 24 Duration (days) from birth to neonatal hospital discharge Show forest plot | 6 | 2832 | Mean Difference (IV, Random, 95% CI) | 0.67 [‐0.28, 1.61] |
| 25 Chorioamnionitis Show forest plot | 8 | 1358 | Risk Ratio (M‐H, Random, 95% CI) | 0.50 [0.26, 0.95] |
| 26 Endometritis Show forest plot | 7 | 2980 | Risk Ratio (M‐H, Fixed, 95% CI) | 1.61 [1.00, 2.59] |
| 27 Postpartum fever Show forest plot | 1 | 1835 | Risk Ratio (M‐H, Fixed, 95% CI) | 0.52 [0.26, 1.03] |
| 28 Placental abruption Show forest plot | 1 | 1835 | Risk Ratio (M‐H, Fixed, 95% CI) | 1.19 [0.36, 3.87] |
| 29 Induction of labour Show forest plot | 4 | 2691 | Risk Ratio (M‐H, Fixed, 95% CI) | 2.18 [2.01, 2.36] |
| 30 Use of epidural/spinal anaesthesia Show forest plot | 3 | 2562 | Risk Ratio (M‐H, Random, 95% CI) | 1.28 [0.99, 1.65] |
| 31 Vaginal birth Show forest plot | 12 | 3618 | Risk Ratio (M‐H, Fixed, 95% CI) | 0.94 [0.91, 0.97] |
| 32 Operative vaginal birth Show forest plot | 4 | 2685 | Risk Ratio (M‐H, Fixed, 95% CI) | 0.85 [0.67, 1.10] |
| 33 Caesarean section for fetal distress Show forest plot | 7 | 2918 | Risk Ratio (M‐H, Fixed, 95% CI) | 0.89 [0.66, 1.20] |
| 34 Duration (days) of maternal hospitalisation Show forest plot | 6 | 2848 | Mean Difference (IV, Random, 95% CI) | ‐1.75 [‐2.45, ‐1.05] |
| 35 Duration (days) of antenatal hospitalisation Show forest plot | 1 | 73 | Mean Difference (IV, Fixed, 95% CI) | ‐6.30 [‐9.67, ‐2.93] |
| 36 Duration (days) of maternal hospitalisation (excluding trials with antenatal discharge) Show forest plot | 2 | 213 | Mean Difference (IV, Random, 95% CI) | ‐1.64 [‐3.06, ‐0.23] |
| 37 Time (hours) from randomisation to birth Show forest plot | 3 | 2571 | Mean Difference (IV, Fixed, 95% CI) | ‐79.48 [‐88.27, ‐70.69] |
| 38 Disability at 2 years, abnormal CBCL Show forest plot | 1 | 199 | Risk Ratio (M‐H, Fixed, 95% CI) | 0.64 [0.26, 1.59] |
| 39 Disability at 2 years, abnormal ASQ Show forest plot | 1 | 228 | Risk Ratio (M‐H, Fixed, 95% CI) | 0.61 [0.35, 1.05] |
| 40 Maternal satisfaction Show forest plot | 1 | 493 | Risk Ratio (M‐H, Fixed, 95% CI) | 0.99 [0.86, 1.13] |
| 41 Breastfeeding > 12 weeks Show forest plot | 1 | 415 | Risk Ratio (M‐H, Fixed, 95% CI) | 0.95 [0.80, 1.12] |
| Outcome or subgroup title | No. of studies | No. of participants | Statistical method | Effect size |
| 1 Neonatal infection Show forest plot | 12 | 3652 | Risk Ratio (M‐H, Fixed, 95% CI) | 0.94 [0.68, 1.32] |
| 1.1 Antenatal corticosteroids | 0 | 0 | Risk Ratio (M‐H, Fixed, 95% CI) | 0.0 [0.0, 0.0] |
| 1.2 No antenatal corticosteroids | 6 | 495 | Risk Ratio (M‐H, Fixed, 95% CI) | 0.98 [0.48, 2.03] |
| 1.3 Some antenatal corticosteroids | 6 | 2850 | Risk Ratio (M‐H, Fixed, 95% CI) | 0.95 [0.64, 1.41] |
| 1.4 Not known | 1 | 307 | Risk Ratio (M‐H, Fixed, 95% CI) | 0.80 [0.25, 2.55] |
| 2 Neonatal infection confirmed with positive culture Show forest plot | 7 | 2939 | Risk Ratio (M‐H, Fixed, 95% CI) | 1.29 [0.74, 2.23] |
| 2.1 Antenatal corticosteroids | 0 | 0 | Risk Ratio (M‐H, Fixed, 95% CI) | 0.0 [0.0, 0.0] |
| 2.2 No antenatal corticosteroids | 3 | 259 | Risk Ratio (M‐H, Fixed, 95% CI) | 0.60 [0.18, 2.04] |
| 2.3 Some antenatal corticosteroids | 5 | 2680 | Risk Ratio (M‐H, Fixed, 95% CI) | 1.59 [0.85, 3.00] |
| 3 Respiratory distress syndrome Show forest plot | 12 | 3646 | Risk Ratio (M‐H, Fixed, 95% CI) | 1.29 [1.07, 1.56] |
| 3.1 Antenatal corticosteroids | 0 | 0 | Risk Ratio (M‐H, Fixed, 95% CI) | 0.0 [0.0, 0.0] |
| 3.2 No antenatal corticosteroids | 6 | 495 | Risk Ratio (M‐H, Fixed, 95% CI) | 1.32 [0.96, 1.83] |
| 3.3 Some antenatal corticosteroids | 6 | 2844 | Risk Ratio (M‐H, Fixed, 95% CI) | 1.28 [1.01, 1.63] |
| 3.4 Not known | 1 | 307 | Risk Ratio (M‐H, Fixed, 95% CI) | 1.27 [0.55, 2.94] |
| 4 Caesarean section Show forest plot | 12 | 3644 | Risk Ratio (M‐H, Fixed, 95% CI) | 1.26 [1.11, 1.44] |
| 4.1 Antenatal corticosteroids | 0 | 0 | Risk Ratio (M‐H, Fixed, 95% CI) | 0.0 [0.0, 0.0] |
| 4.2 No antenatal corticosteroids | 6 | 493 | Risk Ratio (M‐H, Fixed, 95% CI) | 1.43 [1.00, 2.06] |
| 4.3 Some antenatal corticosteroids | 6 | 2844 | Risk Ratio (M‐H, Fixed, 95% CI) | 1.27 [1.10, 1.47] |
| 4.4 Not known | 1 | 307 | Risk Ratio (M‐H, Fixed, 95% CI) | 0.91 [0.51, 1.61] |
| 5 Chorioamnionitis Show forest plot | 8 | 1358 | Risk Ratio (M‐H, Fixed, 95% CI) | 0.49 [0.33, 0.72] |
| 5.1 Antenatal corticosteroids | 0 | 0 | Risk Ratio (M‐H, Fixed, 95% CI) | 0.0 [0.0, 0.0] |
| 5.2 No antenatal corticosteroids | 4 | 398 | Risk Ratio (M‐H, Fixed, 95% CI) | 0.38 [0.22, 0.67] |
| 5.3 Some antenatal corticosteroids | 4 | 960 | Risk Ratio (M‐H, Fixed, 95% CI) | 0.61 [0.36, 1.06] |
| 6 Endometritis Show forest plot | 7 | 2980 | Risk Ratio (M‐H, Fixed, 95% CI) | 1.61 [1.00, 2.59] |
| 6.1 Antenatal corticosteroids | 0 | 0 | Risk Ratio (M‐H, Fixed, 95% CI) | 0.0 [0.0, 0.0] |
| 6.2 No antenatal corticosteroids | 2 | 185 | Risk Ratio (M‐H, Fixed, 95% CI) | 1.38 [0.32, 5.94] |
| 6.3 Some antenatal corticosteroids | 5 | 2795 | Risk Ratio (M‐H, Fixed, 95% CI) | 1.64 [0.99, 2.72] |
| Outcome or subgroup title | No. of studies | No. of participants | Statistical method | Effect size |
| 1 Neonatal infection Show forest plot | 12 | 3628 | Risk Ratio (M‐H, Fixed, 95% CI) | 0.93 [0.66, 1.30] |
| 1.1 Greater than 34 weeks' gestation | 5 | 2998 | Risk Ratio (M‐H, Fixed, 95% CI) | 0.71 [0.47, 1.07] |
| 1.2 Less than 34 weeks' gestation | 5 | 490 | Risk Ratio (M‐H, Fixed, 95% CI) | 1.61 [0.74, 3.50] |
| 1.3 Not specified (wider span) | 2 | 140 | Risk Ratio (M‐H, Fixed, 95% CI) | 2.00 [0.65, 6.18] |
| 2 Neonatal infection confirmed with positive culture Show forest plot | 7 | 2925 | Risk Ratio (M‐H, Fixed, 95% CI) | 1.24 [0.70, 2.21] |
| 2.1 Greater than 34 weeks' gestation | 4 | 2691 | Risk Ratio (M‐H, Fixed, 95% CI) | 1.07 [0.52, 2.20] |
| 2.2 Less than 34 weeks' gestation | 2 | 141 | Risk Ratio (M‐H, Fixed, 95% CI) | 1.67 [0.52, 5.35] |
| 2.3 Not specified (wider span) | 1 | 93 | Risk Ratio (M‐H, Fixed, 95% CI) | 1.53 [0.27, 8.75] |
| 3 Respiratory distress syndrome Show forest plot | 12 | 3622 | Risk Ratio (M‐H, Fixed, 95% CI) | 1.26 [1.05, 1.53] |
| 3.1 Greater than 34 weeks' gestation | 5 | 2992 | Risk Ratio (M‐H, Fixed, 95% CI) | 1.45 [1.10, 1.90] |
| 3.2 Less than 34 weeks' gestation | 5 | 490 | Risk Ratio (M‐H, Fixed, 95% CI) | 1.09 [0.84, 1.43] |
| 3.3 Not specified (wider span) | 2 | 140 | Risk Ratio (M‐H, Fixed, 95% CI) | 0.81 [0.27, 2.42] |
| 4 Caesarean section Show forest plot | 12 | 3620 | Risk Ratio (M‐H, Fixed, 95% CI) | 1.26 [1.11, 1.44] |
| 4.1 Greater than 34 weeks' gestation | 5 | 2992 | Risk Ratio (M‐H, Fixed, 95% CI) | 1.22 [1.05, 1.42] |
| 4.2 Less than 34 weeks' gestation | 5 | 488 | Risk Ratio (M‐H, Fixed, 95% CI) | 1.46 [1.08, 1.96] |
| 4.3 Not specified (wider span) | 2 | 140 | Risk Ratio (M‐H, Fixed, 95% CI) | 1.21 [0.45, 3.28] |
| 5 Chorioamnionitis Show forest plot | 8 | 1358 | Risk Ratio (M‐H, Fixed, 95% CI) | 0.49 [0.33, 0.72] |
| 5.1 Greater than 34 weeks' gestation | 3 | 847 | Risk Ratio (M‐H, Fixed, 95% CI) | 0.26 [0.12, 0.57] |
| 5.2 Less than 34 weeks' gestation | 4 | 418 | Risk Ratio (M‐H, Fixed, 95% CI) | 0.77 [0.45, 1.30] |
| 5.3 Not specified (wider span) | 1 | 93 | Risk Ratio (M‐H, Fixed, 95% CI) | 0.39 [0.15, 1.01] |
| 6 Endometritis Show forest plot | 7 | 2980 | Risk Ratio (M‐H, Fixed, 95% CI) | 1.61 [1.00, 2.59] |
| 6.1 Greater than 34 weeks' gestation | 3 | 2562 | Risk Ratio (M‐H, Fixed, 95% CI) | 0.37 [0.10, 1.40] |
| 6.2 Less than 34 weeks' gestation | 4 | 418 | Risk Ratio (M‐H, Fixed, 95% CI) | 2.23 [1.29, 3.84] |
| Outcome or subgroup title | No. of studies | No. of participants | Statistical method | Effect size |
| 1 Neonatal infection Show forest plot | 12 | 3625 | Risk Ratio (M‐H, Fixed, 95% CI) | 0.93 [0.66, 1.30] |
| 1.1 Prophylactic antibiotics used | 2 | 1702 | Risk Ratio (M‐H, Fixed, 95% CI) | 0.74 [0.42, 1.31] |
| 1.2 Prophylactic antibiotics not used | 8 | 880 | Risk Ratio (M‐H, Fixed, 95% CI) | 1.42 [0.81, 2.51] |
| 1.3 Some prophylactic antibiotics used | 2 | 736 | Risk Ratio (M‐H, Fixed, 95% CI) | 0.67 [0.30, 1.46] |
| 1.4 Not specified | 1 | 307 | Risk Ratio (M‐H, Fixed, 95% CI) | 0.80 [0.25, 2.55] |
| 2 Neonatal infection confirmed with positive culture Show forest plot | 7 | 2925 | Risk Ratio (M‐H, Fixed, 95% CI) | 1.24 [0.70, 2.21] |
| 2.1 Prophylactic antibiotics used | 1 | 120 | Risk Ratio (M‐H, Fixed, 95% CI) | 0.16 [0.01, 2.99] |
| 2.2 Prophylactic antibiotics not used | 3 | 234 | Risk Ratio (M‐H, Fixed, 95% CI) | 1.63 [0.62, 4.28] |
| 2.3 Some prophylactic antibiotics used | 3 | 2571 | Risk Ratio (M‐H, Fixed, 95% CI) | 1.35 [0.62, 2.93] |
| 3 Respiratory distress syndrome Show forest plot | 12 | 3622 | Risk Ratio (M‐H, Fixed, 95% CI) | 1.29 [1.06, 1.56] |
| 3.1 Prophylactic antibiotics used | 1 | 120 | Risk Ratio (M‐H, Fixed, 95% CI) | 1.11 [0.23, 5.26] |
| 3.2 Prophylactic antibiotics not used | 7 | 630 | Risk Ratio (M‐H, Fixed, 95% CI) | 1.11 [0.85, 1.45] |
| 3.3 Some prophylactic antibiotics used | 3 | 2565 | Risk Ratio (M‐H, Fixed, 95% CI) | 1.48 [1.10, 1.99] |
| 3.4 Not specified | 1 | 307 | Risk Ratio (M‐H, Fixed, 95% CI) | 1.27 [0.55, 2.94] |
| 4 Caesarean section Show forest plot | 12 | 3620 | Risk Ratio (M‐H, Fixed, 95% CI) | 1.30 [1.14, 1.49] |
| 4.1 Prophylactic antibiotics used | 1 | 120 | Risk Ratio (M‐H, Fixed, 95% CI) | 1.47 [0.34, 6.30] |
| 4.2 Prophylactic antibiotics not used | 7 | 628 | Risk Ratio (M‐H, Fixed, 95% CI) | 1.43 [1.08, 1.90] |
| 4.3 Some prophylactic antibiotics used | 3 | 2565 | Risk Ratio (M‐H, Fixed, 95% CI) | 1.31 [1.12, 1.53] |
| 4.4 Not specified | 1 | 307 | Risk Ratio (M‐H, Fixed, 95% CI) | 0.91 [0.51, 1.61] |
| 5 Chorioamnionitis Show forest plot | 8 | 1358 | Risk Ratio (M‐H, Random, 95% CI) | 0.50 [0.26, 0.95] |
| 5.1 Prophylactic antibiotics used | 1 | 120 | Risk Ratio (M‐H, Random, 95% CI) | 0.11 [0.01, 0.84] |
| 5.2 Prophylactic antibiotics not used | 5 | 511 | Risk Ratio (M‐H, Random, 95% CI) | 0.69 [0.34, 1.41] |
| 5.3 Some prophylactic antibiotics used | 2 | 727 | Risk Ratio (M‐H, Random, 95% CI) | 0.35 [0.15, 0.86] |
| 6 Endometritis Show forest plot | 7 | 2980 | Risk Ratio (M‐H, Fixed, 95% CI) | 1.61 [1.00, 2.59] |
| 6.1 Prophylactic antibiotics used | 0 | 0 | Risk Ratio (M‐H, Fixed, 95% CI) | 0.0 [0.0, 0.0] |
| 6.2 Prophylactic antibiotics not used | 4 | 418 | Risk Ratio (M‐H, Fixed, 95% CI) | 2.23 [1.29, 3.84] |
| 6.3 Some prophylactic antibiotics used | 3 | 2562 | Risk Ratio (M‐H, Fixed, 95% CI) | 0.37 [0.10, 1.40] |
| Outcome or subgroup title | No. of studies | No. of participants | Statistical method | Effect size |
| 1 Neonatal infection Show forest plot | 12 | 3628 | Risk Ratio (M‐H, Fixed, 95% CI) | 0.93 [0.66, 1.30] |
| 1.1 Less than 24 hours from randomisation | 4 | 391 | Risk Ratio (M‐H, Fixed, 95% CI) | 0.90 [0.41, 1.99] |
| 1.2 Greater than 24 hours from randomisation | 7 | 2930 | Risk Ratio (M‐H, Fixed, 95% CI) | 0.95 [0.64, 1.41] |
| 1.3 Not known | 1 | 307 | Risk Ratio (M‐H, Fixed, 95% CI) | 0.80 [0.25, 2.55] |
| 2 Neonatal infection confirmed with positive culture Show forest plot | 7 | 2925 | Risk Ratio (M‐H, Fixed, 95% CI) | 1.24 [0.70, 2.21] |
| 2.1 Less than 24 hours from randomisation | 2 | 213 | Risk Ratio (M‐H, Fixed, 95% CI) | 0.67 [0.18, 2.53] |
| 2.2 Greater than 24 hours from randomisation | 5 | 2712 | Risk Ratio (M‐H, Fixed, 95% CI) | 1.44 [0.76, 2.75] |
| 3 Respiratory distress syndrome Show forest plot | 12 | 3622 | Risk Ratio (M‐H, Fixed, 95% CI) | 1.29 [1.06, 1.56] |
| 3.1 Less than 24 hours from randomisation | 4 | 391 | Risk Ratio (M‐H, Fixed, 95% CI) | 0.99 [0.65, 1.50] |
| 3.2 Greater than 24 hours from randomisation | 7 | 2924 | Risk Ratio (M‐H, Fixed, 95% CI) | 1.37 [1.10, 1.71] |
| 3.3 Not known | 1 | 307 | Risk Ratio (M‐H, Fixed, 95% CI) | 1.27 [0.55, 2.94] |
| 4 Caesarean section Show forest plot | 12 | 3620 | Risk Ratio (M‐H, Fixed, 95% CI) | 1.26 [1.11, 1.44] |
| 4.1 Less than 24 hours from randomisation | 4 | 389 | Risk Ratio (M‐H, Fixed, 95% CI) | 1.59 [0.90, 2.81] |
| 4.2 Greater than 24 hours from randomisation | 7 | 2924 | Risk Ratio (M‐H, Fixed, 95% CI) | 1.27 [1.10, 1.46] |
| 4.3 Not known | 1 | 307 | Risk Ratio (M‐H, Fixed, 95% CI) | 0.91 [0.51, 1.61] |
| 5 Chorioamnionitis Show forest plot | 8 | 1358 | Risk Ratio (M‐H, Random, 95% CI) | 0.50 [0.26, 0.95] |
| 5.1 Less than 24 hours from randomisation | 3 | 342 | Risk Ratio (M‐H, Random, 95% CI) | 0.25 [0.10, 0.61] |
| 5.2 Greater than 24 hours from randomisation | 5 | 1016 | Risk Ratio (M‐H, Random, 95% CI) | 0.76 [0.41, 1.42] |
| 6 Endometritis Show forest plot | 7 | 2980 | Risk Ratio (M‐H, Fixed, 95% CI) | 1.61 [1.00, 2.59] |
| 6.1 Less than 24 hours from randomisation | 1 | 129 | Risk Ratio (M‐H, Fixed, 95% CI) | 1.67 [0.29, 9.68] |
| 6.2 Greater than 24 hours from randomisation | 6 | 2851 | Risk Ratio (M‐H, Fixed, 95% CI) | 1.60 [0.98, 2.63] |