Agentes antimicrobianos para la prevención de la peritonitis en pacientes con diálisis peritoneal
References
Referencias de los estudios incluidos en esta revisión
Referencias de los estudios excluidos de esta revisión
Referencias de los estudios en curso
Referencias adicionales
Referencias de otras versiones publicadas de esta revisión
Characteristics of studies
Characteristics of included studies [ordered by study ID]
Jump to:
| Methods |
| |
| Participants |
| |
| Interventions | Treatment group
Control group
| |
| Outcomes |
| |
| Notes |
| |
| Risk of bias | ||
| Bias | Authors' judgement | Support for judgement |
| Random sequence generation (selection bias) | Low risk | Random number table "Patients were selected to receive placebo or antibiotic according to a random number list kept by the pharmacy..." |
| Allocation concealment (selection bias) | Low risk | Central allocation (pharmacy) |
| Blinding of participants and personnel (performance bias) | Low risk | Blinding, and unlikely that the blinding could have been broken |
| Blinding of outcome assessment (detection bias) | Low risk | Blinding, and unlikely that the blinding could have been broken. "We conducted a random double‐blind trial of cephalothin sodium as the prophylactic agent." |
| Incomplete outcome data (attrition bias) | High risk | 10/105 (9.5%) dialyses excluded from analysis because pre‐dialysis serum showed antibiotic activity (9) and antibiotic had not been added to dialysate fluid (1). Data reported as no. episodes peritonitis/no. dialyses not no. episodes peritonitis/total patient‐months on PD |
| Selective reporting (reporting bias) | High risk | Outcomes not reported as expected. Also, only 1 of 3 expected primary outcomes reported (peritonitis) |
| Other bias | High risk | Partly funded by Eli Lilly & Company, Indianapolis |
| Methods |
| |
| Participants |
| |
| Interventions | Treatment group
Control group
| |
| Outcomes |
| |
| Notes |
| |
| Risk of bias | ||
| Bias | Authors' judgement | Support for judgement |
| Random sequence generation (selection bias) | Low risk | Consecutively numbered sealed envelopes |
| Allocation concealment (selection bias) | Low risk | "Patients were randomised by being assigned consecutively numbered sealed envelopes, which contained either a prescription for gentamicin to be administered with the anaesthetic, or an instruction to the anaesthetist to give no antibiotic." |
| Blinding of participants and personnel (performance bias) | Low risk | "Neither the surgeon nor physician knew whether or not the patient had received the antibiotic." |
| Blinding of outcome assessment (detection bias) | Low risk | "Neither the surgeon nor physician knew whether or not the patient had received the antibiotic." Physician assessing outcomes did not know whether patient had received antibiotic or not. |
| Incomplete outcome data (attrition bias) | Low risk | 1/27 (3.7%) patients not included in the analysis |
| Selective reporting (reporting bias) | High risk | 2 of 3 primary outcomes of interest reported (exit‐site infection, peritonitis). No report of adverse effects of intervention |
| Other bias | Unclear risk | No information provided about funding source |
| Methods |
| |
| Participants |
| |
| Interventions | Treatment group 1
Treatment group 2
| |
| Outcomes |
| |
| Notes |
| |
| Risk of bias | ||
| Bias | Authors' judgement | Support for judgement |
| Random sequence generation (selection bias) | Unclear risk | Study said to be randomised but no further information provided |
| Allocation concealment (selection bias) | Unclear risk | Study said to be randomised but no further information provided |
| Blinding of participants and personnel (performance bias) | High risk | Blinding not possible ‐ topical antibiotic ointment vs oral antibiotic therapy. The outcome could be influenced by lack of blinding and knowledge of the interventions |
| Blinding of outcome assessment (detection bias) | High risk | "Catheter infections were defined as ... and were diagnosed by the peritoneal dialysis nurse and physician, who were not blinded to the patient's treatment arm." |
| Incomplete outcome data (attrition bias) | Low risk | All patients included in analysis including patients who ceased therapy |
| Selective reporting (reporting bias) | Unclear risk | All pre‐specified outcomes for this review were reported, however unable to meta‐analyse exit‐site infections (reported as infection rate/dialysis‐year) |
| Other bias | Unclear risk | No information on funding provided |
| Methods |
| |
| Participants |
| |
| Interventions | Treatment group 1
Treatment group 2
| |
| Outcomes |
| |
| Notes |
| |
| Risk of bias | ||
| Bias | Authors' judgement | Support for judgement |
| Random sequence generation (selection bias) | Low risk | Computer generated using a random number generator "Randomization lists were computer generated using a random number generator." |
| Allocation concealment (selection bias) | Low risk | "The sequence of allocation was known only by the investigators at the coordinating center." |
| Blinding of participants and personnel (performance bias) | Low risk | "Investigators and patients were blinded to the cream used." |
| Blinding of outcome assessment (detection bias) | Low risk | Outcome assessors were blinded to the cream used |
| Incomplete outcome data (attrition bias) | Low risk | All patients who received intervention included in analysis |
| Selective reporting (reporting bias) | Low risk | All pre‐specified outcomes for this review were reported |
| Other bias | Low risk | Supported by National Kidney Foundations of Western Pennsylvania and Upstate New York and by Paul Teschan Fund of Dialysis Clinic Inc |
| Methods |
| |
| Participants |
| |
| Interventions | Treatment group
Control group
| |
| Outcomes |
| |
| Notes |
| |
| Risk of bias | ||
| Bias | Authors' judgement | Support for judgement |
| Random sequence generation (selection bias) | Unclear risk | Patients said to be randomised but no further information provided |
| Allocation concealment (selection bias) | Unclear risk | Patients said to be randomised but no further information provided |
| Blinding of participants and personnel (performance bias) | High risk | Blinding not done ‐ oral antibiotic + topical antibiotic ointment vs no therapy. The outcome could be influenced by lack of blinding and knowledge of the interventions |
| Blinding of outcome assessment (detection bias) | High risk | Clinical assessment of outcome could be influenced by knowledge of treatment group |
| Incomplete outcome data (attrition bias) | Low risk | All patients completed the study |
| Selective reporting (reporting bias) | Unclear risk | Only 2 of 3 primary outcomes of interest for this review were reported (exit‐site/tunnel infection, peritonitis) |
| Other bias | Unclear risk | No information on funding provided |
| Methods |
| |
| Participants |
| |
| Interventions | Treatment group 1
Treatment group 2
| |
| Outcomes |
| |
| Notes |
| |
| Risk of bias | ||
| Bias | Authors' judgement | Support for judgement |
| Random sequence generation (selection bias) | Unclear risk | Study said to be randomised but no information on method provided |
| Allocation concealment (selection bias) | Unclear risk | Study said to be randomised but no information on method provided |
| Blinding of participants and personnel (performance bias) | High risk | Lack of blinding could influence patient management |
| Blinding of outcome assessment (detection bias) | High risk | Knowledge of interventions could influence outcome assessment |
| Incomplete outcome data (attrition bias) | Unclear risk | Insufficient information to permit judgement; abstract only available |
| Selective reporting (reporting bias) | Unclear risk | Only 2 of 3 expected primary outcomes were reported (exit‐site infection, catheter removal) |
| Other bias | Unclear risk | No information on funding provided |
| Methods |
| |
| Participants |
| |
| Interventions | Treatment group 1
Treatment group 2
| |
| Outcomes |
| |
| Notes |
| |
| Risk of bias | ||
| Bias | Authors' judgement | Support for judgement |
| Random sequence generation (selection bias) | High risk | Alternate allocation "The patients were assigned to either drug on a one‐to‐one alternate basis." |
| Allocation concealment (selection bias) | High risk | Alternate allocation "The patients were assigned to either drug on a one‐to‐one alternate basis." |
| Blinding of participants and personnel (performance bias) | High risk | "Patients were not informed of which cream/ointment they were using. However the cream/ointment were not covered or blinded." (email from author) |
| Blinding of outcome assessment (detection bias) | High risk | No blinding and knowledge of interventions could influence outcome assessment |
| Incomplete outcome data (attrition bias) | High risk | 14/95 (15%) withdrew from the study and were excluded from analysis |
| Selective reporting (reporting bias) | Unclear risk | Only 2 of 3 expected primary outcomes were reported (peritonitis, exit‐site/tunnel infection) |
| Other bias | Unclear risk | No information on funding provided |
| Methods |
| |
| Participants |
| |
| Interventions | Treatment group
Control group
| |
| Outcomes |
| |
| Notes |
| |
| Risk of bias | ||
| Bias | Authors' judgement | Support for judgement |
| Random sequence generation (selection bias) | Low risk | Stratified or block randomisation |
| Allocation concealment (selection bias) | Low risk | Central allocation by pharmacy |
| Blinding of participants and personnel (performance bias) | Low risk | Blinding, and unlikely that the blinding could have been broken |
| Blinding of outcome assessment (detection bias) | Low risk | Blinding, and unlikely that the blinding could have been broken |
| Incomplete outcome data (attrition bias) | Low risk | Intention to treat analysis for primary outcome; loss to follow‐up: 20 in cotrimoxazole group (35.7%); 9 in placebo group (18.4%) |
| Selective reporting (reporting bias) | High risk | 2 of 3 primary outcomes not reported (exit‐site/tunnel infection, catheter removal/replacement) |
| Other bias | High risk | Hoffman La Roche supplied the antibiotic (cotrimoxazole) and placebo tablets |
| Methods |
| |
| Participants |
| |
| Interventions | Treatment group 1
Treatment group 2
| |
| Outcomes |
| |
| Notes |
| |
| Risk of bias | ||
| Bias | Authors' judgement | Support for judgement |
| Random sequence generation (selection bias) | Unclear risk | Sealed envelopes "New patients to the program were asked to select a sealed envelope from a pack. Each envelope contained a card allocating the patient to either Method One or Method Two." |
| Allocation concealment (selection bias) | Unclear risk | Do not know if the envelopes were opaque |
| Blinding of participants and personnel (performance bias) | High risk | No blinding and the outcome is likely to be influenced by lack of blinding |
| Blinding of outcome assessment (detection bias) | High risk | No blinding and knowledge of interventions could influence outcome assessment |
| Incomplete outcome data (attrition bias) | Unclear risk | No details given re loss to follow‐up or any patient withdrawals |
| Selective reporting (reporting bias) | High risk | Only 1 of 3 expected primary outcomes are reported (exit‐site infection). No report of adverse effects of either intervention |
| Other bias | Unclear risk | No report of funding source |
| Methods |
| |
| Participants |
| |
| Interventions | Treatment group 1
Treatment group 2
| |
| Outcomes |
| |
| Notes |
| |
| Risk of bias | ||
| Bias | Authors' judgement | Support for judgement |
| Random sequence generation (selection bias) | Unclear risk | Randomisation method not stated. "One hundred patients were enrolled in the study... 50 patients were randomly assigned to each treatment group." |
| Allocation concealment (selection bias) | Unclear risk | No details given re concealment of patient allocation |
| Blinding of participants and personnel (performance bias) | High risk | No blinding and the outcome is likely to be influenced by lack of blinding and knowledge of the interventions |
| Blinding of outcome assessment (detection bias) | High risk | No blinding and knowledge of interventions could influence outcome assessment. "Exit sites were monitored weekly during regular follow up." |
| Incomplete outcome data (attrition bias) | High risk | Total of 22/100 dropouts from the study (22%). Proportion missing enough to have a clinically relevant effect |
| Selective reporting (reporting bias) | Unclear risk | Only 2 of 3 expected primary outcomes are reported (exit‐site infection, peritonitis) |
| Other bias | Unclear risk | No report of funding source |
| Methods |
| |
| Participants |
| |
| Interventions | Treatment group 1
Treatment group 2
Treatment group 3
| |
| Outcomes |
| |
| Notes |
| |
| Risk of bias | ||
| Bias | Authors' judgement | Support for judgement |
| Random sequence generation (selection bias) | Unclear risk | Randomisation method not stated "Fifty‐one patients were randomly assigned to one of three catheter exit site care regimens." |
| Allocation concealment (selection bias) | Unclear risk | No details given re concealment of patient allocation |
| Blinding of participants and personnel (performance bias) | High risk | No blinding and the outcome is likely to be influenced by lack of blinding and knowledge of the interventions |
| Blinding of outcome assessment (detection bias) | High risk | No blinding and knowledge of interventions could influence outcome assessment |
| Incomplete outcome data (attrition bias) | Low risk | Proportion missing not enough to have a clinically relevant effect. 2/13 (15.4%) in sodium hypochlorite group withdrew from the study |
| Selective reporting (reporting bias) | High risk | Only 1 of 3 expected primary outcomes reported (exit‐site infection) |
| Other bias | Unclear risk | No report of funding source |
| Methods |
| |
| Participants |
| |
| Interventions | Treatment group 1
Treatment group 2
Control group
| |
| Outcomes |
| |
| Notes |
| |
| Risk of bias | ||
| Bias | Authors' judgement | Support for judgement |
| Random sequence generation (selection bias) | High risk | Consecutive allocation of intervention "first patient received vancomycin; second, cefazolin; third, neither; fourth, vancomycin; and so on." |
| Allocation concealment (selection bias) | High risk | Non‐random, predictable sequence |
| Blinding of participants and personnel (performance bias) | High risk | No blinding and the outcome is likely to be influenced by lack of blinding and knowledge of the interventions |
| Blinding of outcome assessment (detection bias) | High risk | No blinding and knowledge of interventions could influence outcome assessment |
| Incomplete outcome data (attrition bias) | Low risk | No missing data re peritonitis outcome; data for exit‐site/tunnel infection excluded from analysis (vancomycin (3); cefazolin (6); no antibiotic (8)) |
| Selective reporting (reporting bias) | Unclear risk | 2 of 3 expected outcomes of interest are reported |
| Other bias | Unclear risk | No report of funding source |
| Methods |
| |
| Participants |
| |
| Interventions | Treatment group 1
Treatment group 2
| |
| Outcomes |
| |
| Notes |
| |
| Risk of bias | ||
| Bias | Authors' judgement | Support for judgement |
| Random sequence generation (selection bias) | Low risk | Minimization method "Participants were randomly assigned in a 1:1 ratio by use of an adaptive allocation algorithm designed to minimise imbalance in treatment groups for the three variables." |
| Allocation concealment (selection bias) | Low risk | Central allocation (web). "To ensure adequate concealment of allocation, the randomisation was done with a password‐protected internet‐based system." |
| Blinding of participants and personnel (performance bias) | High risk | No blinding and the outcome is likely to be influenced by lack of blinding and knowledge of the interventions. "Blinding of investigators and patients is not possible because of the completely different characteristics of Medihoney and mupirocin ointment." |
| Blinding of outcome assessment (detection bias) | High risk | No blinding and knowledge of the interventions could influence outcome assessment. "The trial was open label, but microbiology staff at the local laboratories were not informed of the treatment allocation." |
| Incomplete outcome data (attrition bias) | High risk | Missing data not balanced between groups. 17/185 (9.2%) withdrew from control group; 54/186 (29%) withdrew from honey group Loss to follow‐up: 1 in honey group (0.5%); 3 in mupirocin group (1.6%) |
| Selective reporting (reporting bias) | Low risk | 3 of 3 expected primary outcomes are reported |
| Other bias | Unclear risk | The study appears to be free of other sources of risk. Although 3 of 4 funders are pharmaceutical companies, there is an explicit statement about their role on page 26 of the paper |
| Methods |
| |
| Participants |
| |
| Interventions | Treatment group
Control group
| |
| Outcomes |
| |
| Notes |
| |
| Risk of bias | ||
| Bias | Authors' judgement | Support for judgement |
| Random sequence generation (selection bias) | High risk | Patients were randomised according to odd or even identity numbers |
| Allocation concealment (selection bias) | High risk | A non‐random, predictable sequence was used |
| Blinding of participants and personnel (performance bias) | High risk | No blinding and the outcome is likely to be influenced by lack of blinding and knowledge of the interventions |
| Blinding of outcome assessment (detection bias) | High risk | No blinding and knowledge of the interventions could influence outcome assessment |
| Incomplete outcome data (attrition bias) | Low risk | ITT analysis for primary outcome |
| Selective reporting (reporting bias) | High risk | The expected primary outcome is reported (peritonitis), however catheter removal and exit‐site infection not reported |
| Other bias | Unclear risk | No report of funding source |
| Methods |
| |
| Participants |
| |
| Interventions | Treatment group
Control group
| |
| Outcomes |
| |
| Notes |
| |
| Risk of bias | ||
| Bias | Authors' judgement | Support for judgement |
| Random sequence generation (selection bias) | Low risk | Minimisation method used |
| Allocation concealment (selection bias) | Low risk | Allocation done by a third party |
| Blinding of participants and personnel (performance bias) | Low risk | Blinding, and unlikely that the blinding could have been broken |
| Blinding of outcome assessment (detection bias) | Low risk | Blinding, and unlikely that the blinding could have been broken |
| Incomplete outcome data (attrition bias) | Low risk | No missing data |
| Selective reporting (reporting bias) | Unclear risk | 1 of 3 primary outcomes not reported (exit‐site/tunnel infection) |
| Other bias | Low risk | Study appears to be free of other sources of risk. Funding was from a National Institutes of Health contract |
| Methods |
| |
| Participants |
| |
| Interventions | Treatment group
Control group
| |
| Outcomes |
| |
| Notes |
| |
| Risk of bias | ||
| Bias | Authors' judgement | Support for judgement |
| Random sequence generation (selection bias) | Low risk | Random number table |
| Allocation concealment (selection bias) | Low risk | Central allocation |
| Blinding of participants and personnel (performance bias) | High risk | No blinding and the outcome is likely to be influenced by lack of blinding and knowledge of the interventions |
| Blinding of outcome assessment (detection bias) | High risk | No blinding and knowledge of interventions could influence outcome assessment |
| Incomplete outcome data (attrition bias) | Low risk | Proportion missing not enough to have a clinically relevant effect; loss to follow‐up: 8 of 127 (6.3%) |
| Selective reporting (reporting bias) | Unclear risk | 3 of 3 primary outcomes of interest are reported, however unable to meta‐analyse catheter removal |
| Other bias | High risk | Funding source not specified but seems to be Baxter Healthcare Corporation |
| Methods |
| |
| Participants |
| |
| Interventions | Treatment group
Control group
| |
| Outcomes |
| |
| Notes |
| |
| Risk of bias | ||
| Bias | Authors' judgement | Support for judgement |
| Random sequence generation (selection bias) | High risk | Alternate allocation |
| Allocation concealment (selection bias) | High risk | Non‐random, predictable sequence |
| Blinding of participants and personnel (performance bias) | High risk | No blinding and the outcome is likely to be influenced by lack of blinding and knowledge of the interventions |
| Blinding of outcome assessment (detection bias) | High risk | No blinding and knowledge of interventions could influence outcome assessment |
| Incomplete outcome data (attrition bias) | Low risk | Missing data balanced across groups, and reasons similar; 4 (16%) excluded from analysis in treatment group due to lack of effect of study antibiotics on MRSA bacteria; 3 (12%) excluded from analysis in control group for the same reason |
| Selective reporting (reporting bias) | Low risk | 3 of 3 primary outcomes of interest are reported |
| Other bias | Unclear risk | No report of funding source |
| Methods |
| |
| Participants |
| |
| Interventions | Treatment group
Control group
| |
| Outcomes |
| |
| Notes |
| |
| Risk of bias | ||
| Bias | Authors' judgement | Support for judgement |
| Random sequence generation (selection bias) | Low risk | Random number tables "Patients were assigned 1:1 in two groups, with only one treatment; the Rand Corporation tables were used for randomization." |
| Allocation concealment (selection bias) | Unclear risk | Insufficient information to permit judgement |
| Blinding of participants and personnel (performance bias) | Unclear risk | Patient cleans own exit site ‐ impossible to conceal intervention allocation. "The study was blind for the investigators and laboratory personnel." |
| Blinding of outcome assessment (detection bias) | Low risk | Blinding, and unlikely that the blinding could have been broken. "The study was blind for the investigators and laboratory personnel." |
| Incomplete outcome data (attrition bias) | Unclear risk | Insufficient information to permit judgement |
| Selective reporting (reporting bias) | High risk | Only 1 of 3 expected primary outcomes reported (exit‐site infection) |
| Other bias | Unclear risk | No report of funding source |
| Methods |
| |
| Participants |
| |
| Interventions | Treatment group
Control group
| |
| Outcomes |
| |
| Notes |
| |
| Risk of bias | ||
| Bias | Authors' judgement | Support for judgement |
| Random sequence generation (selection bias) | High risk | Alternate allocation "The numbering was consecutive so all participants were given an equal chance of being admitted to either group." "Odd numbers were admitted to the Blisterfilm group and even numbers admitted to the gauze group." |
| Allocation concealment (selection bias) | High risk | Non‐random, predictable sequence. However, allocation concealment not possible ‐ the two dressings are of different sizes and types |
| Blinding of participants and personnel (performance bias) | High risk | No blinding and the outcome is likely to be influenced by lack of blinding and knowledge of interventions |
| Blinding of outcome assessment (detection bias) | High risk | No blinding and knowledge of the interventions could influence outcome assessment |
| Incomplete outcome data (attrition bias) | Unclear risk | The published report states percentage of patients in each group that experienced exit‐site infection but does not state actual patient numbers. No report of loss to follow‐up or withdrawals |
| Selective reporting (reporting bias) | High risk | Only 1 of 3 expected primary outcomes of interest reported (exit‐site infection) |
| Other bias | Unclear risk | No report of funding source |
| Methods |
| |
| Participants |
| |
| Interventions | Treatment group 1
Treatment group 2
| |
| Outcomes |
| |
| Notes |
| |
| Risk of bias | ||
| Bias | Authors' judgement | Support for judgement |
| Random sequence generation (selection bias) | Low risk | Computer random number generator "All randomization is determined by a computer‐generated random number list..." "...201 patients from two centers were randomly assigned to either mupirocin or P3 using stratified block randomization as per protocol." |
| Allocation concealment (selection bias) | Low risk | Central allocation (pharmacy) "Randomization occurs centrally in coordination with the central clinical trials pharmacy... The ointments are placed in containers that are labeled only with the site investigator, study number, and expiry date." |
| Blinding of participants and personnel (performance bias) | Low risk | Blinding, and unlikely that the blinding could have been broken "The treatments resemble each other in odor, color, and consistency to allow for a double blinded controlled trial." "Neither the healthcare workers not the participants know which intervention the participant will receive." |
| Blinding of outcome assessment (detection bias) | Low risk | Blinding, and unlikely that the blinding could have been broken |
| Incomplete outcome data (attrition bias) | Low risk | Missing data balanced across groups, and reasons similar (2 from each group lost to follow‐up); data for 3 patients from 1 site were excluded |
| Selective reporting (reporting bias) | Low risk | Protocol is available and all pre‐specified outcomes of interest to the review are reported in the pre‐specified way |
| Other bias | Low risk | Funded by the Kidney Foundation of Canada. Study appears to be free of other sources of risk |
| Methods |
| |
| Participants |
| |
| Interventions | Treatment group
Control group
| |
| Outcomes |
| |
| Notes |
| |
| Risk of bias | ||
| Bias | Authors' judgement | Support for judgement |
| Random sequence generation (selection bias) | Unclear risk | Insufficient information to permit judgement |
| Allocation concealment (selection bias) | Unclear risk | Insufficient information to permit judgement |
| Blinding of participants and personnel (performance bias) | Unclear risk | Blinding, and unlikely patients were aware of treatment group. Unclear if personnel were aware of patient treatment groups |
| Blinding of outcome assessment (detection bias) | Unclear risk | No details given re who did the outcome assessment and if they were blind to patient treatment group |
| Incomplete outcome data (attrition bias) | Low risk | Missing data balanced across groups, and reasons similar; ITT analysis used |
| Selective reporting (reporting bias) | Low risk | 3 of 3 expected primary outcomes of interest are reported |
| Other bias | High risk | Funding source: SmithKline Beecham, UK, and Baxter Healthcare, USA |
| Methods |
| |
| Participants |
| |
| Interventions | Treatment group
Control group
| |
| Outcomes |
| |
| Notes |
| |
| Risk of bias | ||
| Bias | Authors' judgement | Support for judgement |
| Random sequence generation (selection bias) | Low risk | Random number table |
| Allocation concealment (selection bias) | Low risk | Central allocation (Travenol Laboratories) |
| Blinding of participants and personnel (performance bias) | High risk | No blinding and the outcome is likely to be influenced by lack of blinding and knowledge of the interventions |
| Blinding of outcome assessment (detection bias) | High risk | No blinding and knowledge of the interventions could influence outcome assessment |
| Incomplete outcome data (attrition bias) | High risk | 12.9% withdrew from control group; 24.3% withdrew from intervention group. Proportion missing enough to have a clinically relevant effect |
| Selective reporting (reporting bias) | High risk | Only 1 of 3 primary expected outcomes of interest is reported (peritonitis) |
| Other bias | High risk | Funding source: Travenol Laboratories Inc., USA |
| Methods |
| |
| Participants |
| |
| Interventions | Treatment group
Control group
| |
| Outcomes |
| |
| Notes |
| |
| Risk of bias | ||
| Bias | Authors' judgement | Support for judgement |
| Random sequence generation (selection bias) | Low risk | Random number table "Randomization was performed by means of a randomization code via random number table..." |
| Allocation concealment (selection bias) | Unclear risk | Randomisation stated but no information on method used is available |
| Blinding of participants and personnel (performance bias) | Unclear risk | Insufficient information to permit judgement |
| Blinding of outcome assessment (detection bias) | Unclear risk | Insufficient information to permit judgement |
| Incomplete outcome data (attrition bias) | Low risk | No missing outcome data |
| Selective reporting (reporting bias) | Unclear risk | Only 2 of 3 expected primary outcomes of interest reported fully |
| Other bias | Unclear risk | Disclosure states that "Part of these data belong to Baxter S. L. funds as we received the Nephrological Nursing Investigation Baxter award 2010" |
| Methods |
| |
| Participants |
| |
| Interventions | Treatment group 1
Treatment group 2
| |
| Outcomes |
| |
| Notes |
| |
| Risk of bias | ||
| Bias | Authors' judgement | Support for judgement |
| Random sequence generation (selection bias) | Low risk | Stratified randomisation method used "Staph. aureus nasal carriers were assigned to one of two groups, randomized for age, time on CAPD and prevalence of diabetes." |
| Allocation concealment (selection bias) | Unclear risk | Insufficient information to permit judgement |
| Blinding of participants and personnel (performance bias) | Unclear risk | Insufficient information to permit judgement |
| Blinding of outcome assessment (detection bias) | Unclear risk | Insufficient information to permit judgement |
| Incomplete outcome data (attrition bias) | Low risk | Reasons for missing data not related to outcome "Patients of Group 2 in whom eradication was not obtained after two neomycin cycles were treated with mupirocin." |
| Selective reporting (reporting bias) | Unclear risk | 2 of 3 expected primary outcomes of interest are reported |
| Other bias | Unclear risk | No report of funding source |
| Methods |
| |
| Participants |
| |
| Interventions | Treatment group
Control group
| |
| Outcomes |
| |
| Notes |
| |
| Risk of bias | ||
| Bias | Authors' judgement | Support for judgement |
| Random sequence generation (selection bias) | Unclear risk | Randomisation method not stated "Patients were randomly assigned by an independent third party to either the vaccinated group or the saline solution (SS) placebo administered group." |
| Allocation concealment (selection bias) | Low risk | Central allocation (independent third party) "The assigned injection group was not known to either patient or staff immediately connected with the patient's care at any time during the study." |
| Blinding of participants and personnel (performance bias) | Low risk | Blinding, and unlikely that the blinding could have been broken |
| Blinding of outcome assessment (detection bias) | Low risk | Blinding, and unlikely that the blinding could have been broken |
| Incomplete outcome data (attrition bias) | Low risk | Missing data balanced across groups, and reasons similar |
| Selective reporting (reporting bias) | Low risk | 3 of 3 expected primary outcomes of interest are reported |
| Other bias | High risk | Funding source: Baxter Healthcare Corporation, USA |
| Methods |
| |
| Participants |
| |
| Interventions | Treatment group
Control group
| |
| Outcomes |
| |
| Notes |
| |
| Risk of bias | ||
| Bias | Authors' judgement | Support for judgement |
| Random sequence generation (selection bias) | Low risk | Drawing of lots "The randomization procedure was performed by drawing from a bag cards indicating whether the patient would or would not receive this treatment." |
| Allocation concealment (selection bias) | Unclear risk | Insufficient information to permit judgement |
| Blinding of participants and personnel (performance bias) | Unclear risk | Insufficient information to permit judgement |
| Blinding of outcome assessment (detection bias) | Unclear risk | Insufficient information to permit judgement |
| Incomplete outcome data (attrition bias) | Unclear risk | No details of missing data given |
| Selective reporting (reporting bias) | Unclear risk | The expected primary outcome is reported. However, adverse effects of antifungal use are not reported |
| Other bias | Unclear risk | No report of funding source |
| Methods |
| |
| Participants |
| |
| Interventions | Treatment group
Control group
| |
| Outcomes |
| |
| Notes |
| |
| Risk of bias | ||
| Bias | Authors' judgement | Support for judgement |
| Random sequence generation (selection bias) | Unclear risk | Randomisation method not stated "24 patients using a single use Y‐set and 26 using a reusable Y‐set (O‐set) were separately randomized into two groups." |
| Allocation concealment (selection bias) | Unclear risk | Insufficient information to permit judgement |
| Blinding of participants and personnel (performance bias) | Unclear risk | Insufficient information to permit judgement |
| Blinding of outcome assessment (detection bias) | Unclear risk | Insufficient information to permit judgement |
| Incomplete outcome data (attrition bias) | Unclear risk | No details of missing data given |
| Selective reporting (reporting bias) | High risk | Only 1 of 3 expected primary outcomes is reported |
| Other bias | Unclear risk | No report of funding source; abstract‐only publication |
| Methods |
| |
| Participants |
| |
| Interventions | Treatment group 1
Treatment group 2
Control group
| |
| Outcomes |
| |
| Notes |
| |
| Risk of bias | ||
| Bias | Authors' judgement | Support for judgement |
| Random sequence generation (selection bias) | Unclear risk | Randomisation method not stated "Each carrier was then randomly assigned to one of the three groups". |
| Allocation concealment (selection bias) | Unclear risk | Insufficient information to permit judgement |
| Blinding of participants and personnel (performance bias) | Unclear risk | Insufficient information to permit judgement |
| Blinding of outcome assessment (detection bias) | Unclear risk | Insufficient information to permit judgement |
| Incomplete outcome data (attrition bias) | High risk | 44.4% withdrew from sodium fusidate group; 77.7% withdrew from ofloxacin group; 53.8% withdrew from control group. Proportion missing enough to have a clinically relevant effect |
| Selective reporting (reporting bias) | Low risk | 3 of 3 expected primary outcomes of interest are reported |
| Other bias | Low risk | Supported by a grant from Instituto Paulista de Estudos e Pesquisas em Nefrologia e Hipertensao. Study appears to be free of other sources of risk |
| Methods |
| |
| Participants |
| |
| Interventions | Treatment group
Control group
| |
| Outcomes |
| |
| Notes |
| |
| Risk of bias | ||
| Bias | Authors' judgement | Support for judgement |
| Random sequence generation (selection bias) | Unclear risk | Insufficient information to permit judgement |
| Allocation concealment (selection bias) | Low risk | Central allocation (pharmacy) |
| Blinding of participants and personnel (performance bias) | Low risk | Blinding, and unlikely that the blinding could have been broken |
| Blinding of outcome assessment (detection bias) | Low risk | Blinding, and unlikely that the blinding could have been broken |
| Incomplete outcome data (attrition bias) | Unclear risk | No details of missing data given on a patient basis; 6 dialyses excluded from analysis |
| Selective reporting (reporting bias) | High risk | Outcomes not reported as expected ‐ number of episodes peritonitis/number of dialyses not number of episodes peritonitis/total patient‐months on dialysis. Also, only 1 of 3 expected primary outcomes reported (peritonitis) |
| Other bias | Unclear risk | No report of funding source |
| Methods |
| |
| Participants |
| |
| Interventions | Treatment group
Control group
| |
| Outcomes |
| |
| Notes |
| |
| Risk of bias | ||
| Bias | Authors' judgement | Support for judgement |
| Random sequence generation (selection bias) | Low risk | Stratified randomisation "After informed consent had been obtained, the patients were stratified by diabetes mellitus status (types I and II) and randomly assigned by the coordinating study center (Berlin) to either the silver ring or the control group." |
| Allocation concealment (selection bias) | Low risk | Central allocation (coordinating study centre) |
| Blinding of participants and personnel (performance bias) | High risk | No blinding and the outcome is likely to be influenced by lack of blinding and knowledge of the interventions |
| Blinding of outcome assessment (detection bias) | High risk | No blinding and knowledge of the interventions could influence outcome assessment |
| Incomplete outcome data (attrition bias) | High risk | Proportion missing enough to have a clinically relevant effect. Dropouts: 29/97 (29.9%) in silver ring group; 30/98 (30.6%) in control group. Withdrawals: 6/97 (6.2%) in silver ring group; 0/98 (0%) in control group |
| Selective reporting (reporting bias) | Low risk | 3 of 3 expected primary outcomes are reported |
| Other bias | Unclear risk | "Supported in part by Baxter Deutschland GmbH, Ettlingen, Germany." |
| Methods |
| |
| Participants |
| |
| Interventions | Treatment group
Control group
| |
| Outcomes |
| |
| Notes |
| |
| Risk of bias | ||
| Bias | Authors' judgement | Support for judgement |
| Random sequence generation (selection bias) | Low risk | Coin toss "Randomization was guided by the flip of a coin..." |
| Allocation concealment (selection bias) | Unclear risk | Insufficient information to permit judgement |
| Blinding of participants and personnel (performance bias) | Unclear risk | Insufficient information to permit judgement |
| Blinding of outcome assessment (detection bias) | Unclear risk | Insufficient information to permit judgement |
| Incomplete outcome data (attrition bias) | Low risk | Proportion missing not enough to have a clinically relevant effect; 2 (8%) excluded from analysis in mupirocin group due to kidney transplantation (1) and death (1) |
| Selective reporting (reporting bias) | Unclear risk | 2 of 3 expected primary outcomes are reported (exit‐site/tunnel infection, peritonitis) |
| Other bias | Unclear risk | No report of funding source |
| Methods |
| |
| Participants |
| |
| Interventions | Treatment group
Control group
| |
| Outcomes |
| |
| Notes |
| |
| Risk of bias | ||
| Bias | Authors' judgement | Support for judgement |
| Random sequence generation (selection bias) | Low risk | Random number table |
| Allocation concealment (selection bias) | Unclear risk | Insufficient information to permit judgement |
| Blinding of participants and personnel (performance bias) | Unclear risk | Insufficient information to permit judgement |
| Blinding of outcome assessment (detection bias) | Unclear risk | Insufficient information to permit judgement |
| Incomplete outcome data (attrition bias) | Low risk | Missing data balanced across groups, and reasons similar; loss to follow‐up: 2 of 29 in antibiotic prophylaxis group (6.9%) |
| Selective reporting (reporting bias) | High risk | 3 of 3 expected primary outcomes of interest are reported, however peritonitis, exit‐site infection and catheter removal could not be meta‐analysed |
| Other bias | Unclear risk | No report of funding source |
| Methods |
| |
| Participants |
| |
| Interventions | Treatment group 1
Treatment group 2
| |
| Outcomes |
| |
| Notes |
| |
| Risk of bias | ||
| Bias | Authors' judgement | Support for judgement |
| Random sequence generation (selection bias) | Unclear risk | Randomisation method not stated "Fifty PD patients were prospectively randomized to perform daily exit‐site care with soap and water followed by Amuchina 10% or Povidone Iodine 10% solution." |
| Allocation concealment (selection bias) | Unclear risk | Insufficient information to permit judgement |
| Blinding of participants and personnel (performance bias) | Unclear risk | Insufficient information to permit judgement |
| Blinding of outcome assessment (detection bias) | Unclear risk | Insufficient information to permit judgement |
| Incomplete outcome data (attrition bias) | Unclear risk | Insufficient information to permit judgement; no details re missing data provided |
| Selective reporting (reporting bias) | Low risk | 3 of 3 expected primary outcomes are reported (exit‐site infection, peritonitis, catheter loss) |
| Other bias | Unclear risk | No report of funding source |
| Methods |
| |
| Participants |
| |
| Interventions | Treatment group 1
Treatment group 2
| |
| Outcomes |
| |
| Notes |
| |
| Risk of bias | ||
| Bias | Authors' judgement | Support for judgement |
| Random sequence generation (selection bias) | Unclear risk | Randomisation method not stated "Thirty nine PD patients were prospectively randomized to perform daily exit‐site care with soap and water followed by Amuchina 5% or povidone iodine 10% solution." |
| Allocation concealment (selection bias) | Unclear risk | Insufficient information to permit judgement |
| Blinding of participants and personnel (performance bias) | Unclear risk | Insufficient information to permit judgement |
| Blinding of outcome assessment (detection bias) | Unclear risk | Insufficient information to permit judgement |
| Incomplete outcome data (attrition bias) | Unclear risk | Insufficient information to permit judgement. No details re missing data provided |
| Selective reporting (reporting bias) | Low risk | 3 of 3 expected primary outcomes are reported (exit‐site infection, peritonitis, catheter loss) |
| Other bias | Unclear risk | No report of funding source |
| Methods |
| |
| Participants |
| |
| Interventions | Treatment group
Control group
| |
| Outcomes |
| |
| Notes |
| |
| Risk of bias | ||
| Bias | Authors' judgement | Support for judgement |
| Random sequence generation (selection bias) | Low risk | Random number table |
| Allocation concealment (selection bias) | Unclear risk | Insufficient information to permit judgement |
| Blinding of participants and personnel (performance bias) | Unclear risk | Insufficient information to permit judgement |
| Blinding of outcome assessment (detection bias) | Low risk | "Investigators assessing response (presence or absence of infection) were blinded to the treatment received by the individual patients" |
| Incomplete outcome data (attrition bias) | Low risk | Proportion missing not enough to have a clinically relevant effect; 3 (2.5%) excluded from analysis due to withdrawal (2) and failure to have PD catheter inserted (1) ‐ group allocation not reported |
| Selective reporting (reporting bias) | Unclear risk | 2 of 3 expected primary outcomes of interest are reported |
| Other bias | High risk | Funding source: Purdue‐Frederick |
| Methods |
| |
| Participants |
| |
| Interventions | Treatment group
Control group
| |
| Outcomes |
| |
| Notes |
| |
| Risk of bias | ||
| Bias | Authors' judgement | Support for judgement |
| Random sequence generation (selection bias) | Unclear risk | Insufficient information to permit judgement |
| Allocation concealment (selection bias) | High risk | Sealed envelopes without all safeguards |
| Blinding of participants and personnel (performance bias) | Unclear risk | Insufficient information to permit judgement |
| Blinding of outcome assessment (detection bias) | Unclear risk | Insufficient information to permit judgement |
| Incomplete outcome data (attrition bias) | Low risk | No missing data |
| Selective reporting (reporting bias) | Unclear risk | 3 of 3 expected primary outcomes of interest are reported, however unable to meta‐analyse catheter removal |
| Other bias | Unclear risk | No report of funding source |
| Methods |
| |
| Participants |
| |
| Interventions | Treatment group
Control group
| |
| Outcomes |
| |
| Notes |
| |
| Risk of bias | ||
| Bias | Authors' judgement | Support for judgement |
| Random sequence generation (selection bias) | Low risk | Random number table |
| Allocation concealment (selection bias) | Unclear risk | Insufficient information to permit judgement |
| Blinding of participants and personnel (performance bias) | Unclear risk | Insufficient information to permit judgement |
| Blinding of outcome assessment (detection bias) | Unclear risk | Insufficient information to permit judgement |
| Incomplete outcome data (attrition bias) | Low risk | Proportion missing not enough to have a clinically relevant effect; loss to follow‐up: 1 in spray group (1.3%), 3 in control group (4.2%) Withdrawals: 5 in spray group (6.5%) (adverse events) 1 (1.3%) excluded from analysis in povidone iodine spray group due to missing results |
| Selective reporting (reporting bias) | Low risk | 3 of 3 expected primary outcomes of interest are reported |
| Other bias | Unclear risk | No report of funding source |
| Methods |
| |
| Participants |
| |
| Interventions | Treatment group
Control group
| |
| Outcomes |
| |
| Notes |
| |
| Risk of bias | ||
| Bias | Authors' judgement | Support for judgement |
| Random sequence generation (selection bias) | Unclear risk | Randomisation method not stated "Patients not excluded were randomized into two groups." No description of sequence generation |
| Allocation concealment (selection bias) | Unclear risk | Insufficient information to permit judgement |
| Blinding of participants and personnel (performance bias) | Unclear risk | Insufficient information to permit judgement |
| Blinding of outcome assessment (detection bias) | Unclear risk | Insufficient information to permit judgement |
| Incomplete outcome data (attrition bias) | Low risk | Missing data balanced across groups, and reasons similar. Outcome data for tunnel infection not reported ‐ this is ok as this infection is the least frequent one in PD patients; 1 withdrawal (not stated which intervention group) Excluded from analysis: 5 (6.4%) from mupirocin group; 7 (8.0%) from control group |
| Selective reporting (reporting bias) | Low risk | 3 of 3 expected primary outcomes are reported (exit‐site infection, peritonitis, catheter loss) |
| Other bias | Unclear risk | No report of funding source |
| Methods |
| |
| Participants |
| |
| Interventions | Treatment group
Control group
| |
| Outcomes |
| |
| Notes |
| |
| Risk of bias | ||
| Bias | Authors' judgement | Support for judgement |
| Random sequence generation (selection bias) | Low risk | Random number table |
| Allocation concealment (selection bias) | Unclear risk | Insufficient information to permit judgement |
| Blinding of participants and personnel (performance bias) | High risk | No blinding and the outcomes are likely to be influenced by lack of blinding and knowledge of the interventions |
| Blinding of outcome assessment (detection bias) | High risk | No blinding and knowledge of the interventions could influence outcome assessment |
| Incomplete outcome data (attrition bias) | High risk | 12.5% in rifampin group withdrew; 0% in control group withdrew. Proportion missing enough to have a clinically relevant effect |
| Selective reporting (reporting bias) | Unclear risk | Protocol not available but all expected outcomes of interest are reported, however unable to meta‐analyse exit‐site infection |
| Other bias | High risk | Funding source: Baxter Healthcare |
AKI ‐ acute kidney injury; APD ‐ automated peritoneal dialysis; CAPD ‐ continuous ambulatory peritoneal dialysis; CCPD ‐ continuous cycling peritoneal dialysis; CKD ‐ chronic kidney disease; ESKD ‐ end‐stage kidney disease; HD ‐ haemodialysis; HIV ‐ human immunodeficiency virus; IP ‐ intraperitoneal; ITT ‐ intention‐to‐treat; IV ‐ intravenous; M/F ‐ male/female; PD ‐ peritoneal dialysis; RCT ‐ randomised controlled trial; SD ‐ standard deviation; SE ‐ standard error; SEM ‐ standard error of the mean
Characteristics of excluded studies [ordered by study ID]
Jump to:
| Study | Reason for exclusion |
| Not an intervention of interest | |
| Not an intervention of interest | |
| Not an intervention of interest | |
| Pharmacokinetics study not prevention | |
| Urokinase is not an antimicrobial agent; treatment study not prevention | |
| Not an intervention of interest | |
| Small pilot study | |
| It is an RCT but peritonitis data is not readily available; no reply from authors to query email | |
| Treatment study not prevention | |
| Not an intervention of interest | |
| Study only went for 84 hours; of the 7 patients, 3 had previously had peritonitis | |
| Not an intervention of interest |
RCT ‐ randomised controlled trial
Characteristics of ongoing studies [ordered by study ID]
Jump to:
| Trial name or title | Efficacy and safety of local application of chlorhexidine gluconate versus mupirocin ointment in the prevention of peritoneal dialysis‐related infection: a pilot study, double‐ blind, stratified randomized controlled trial |
| Methods | Allocation: randomised, parallel RCT Double blind (subject, caregiver, investigator, outcomes assessor) |
| Participants | Inclusion criteria
Exclusion criteria
|
| Interventions |
|
| Outcomes |
|
| Starting date | May 2016 |
| Contact information | Surapon Nochaiwong Chidchanok Ruengorn Maharaj Nakorn Chiang Mai Hospital Chiang Mai, Thailand, 50200 |
| Notes | Sponsors and Collaborators Chiang Mai University, Health Systems Research Institute, Thailand |
APD ‐ automated peritoneal dialysis; CAPD ‐ continuous ambulatory peritoneal dialysis; ESKD ‐ end‐stage kidney disease; PD ‐ peritoneal dialysis
Data and analyses
| Outcome or subgroup title | No. of studies | No. of participants | Statistical method | Effect size |
| 1 Peritonitis (number of patients with one or more episodes) Show forest plot | 5 | 395 | Risk Ratio (M‐H, Random, 95% CI) | 0.82 [0.57, 1.19] |
| Analysis 1.1  Comparison 1 Oral or topical antibiotics versus placebo/no treatment, Outcome 1 Peritonitis (number of patients with one or more episodes). | ||||
| 1.1 Oral antibiotic versus placebo | 4 | 241 | Risk Ratio (M‐H, Random, 95% CI) | 0.87 [0.58, 1.32] |
| 1.2 Mupirocin ointment versus standard care | 1 | 154 | Risk Ratio (M‐H, Random, 95% CI) | 0.55 [0.22, 1.40] |
| 2 Peritonitis rate (episodes/total patient‐months on PD) Show forest plot | 3 | Risk Ratio (M‐H, Random, 95% CI) | Subtotals only | |
| Analysis 1.2 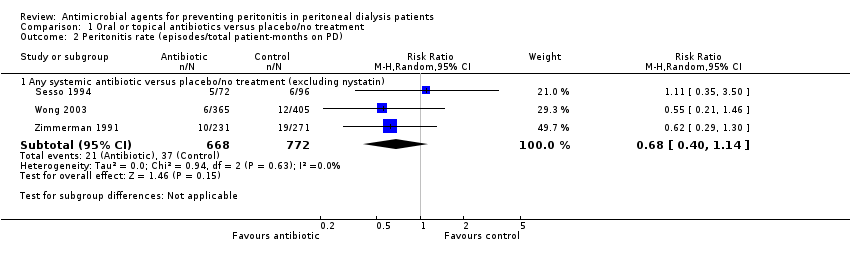 Comparison 1 Oral or topical antibiotics versus placebo/no treatment, Outcome 2 Peritonitis rate (episodes/total patient‐months on PD). | ||||
| 2.1 Any systemic antibiotic versus placebo/no treatment (excluding nystatin) | 3 | 1440 | Risk Ratio (M‐H, Random, 95% CI) | 0.68 [0.40, 1.14] |
| 3 Exit‐site/tunnel infection (number of patients with one or more episodes) Show forest plot | 3 | Risk Ratio (M‐H, Random, 95% CI) | Subtotals only | |
| Analysis 1.3  Comparison 1 Oral or topical antibiotics versus placebo/no treatment, Outcome 3 Exit‐site/tunnel infection (number of patients with one or more episodes). | ||||
| 3.1 Any systemic antibiotic versus placebo/no treatment | 3 | 191 | Risk Ratio (M‐H, Random, 95% CI) | 0.45 [0.19, 1.04] |
| 4 Exit‐site/tunnel infection rate (episodes/total patient‐months on PD) Show forest plot | 2 | Risk Ratio (M‐H, Random, 95% CI) | Subtotals only | |
| Analysis 1.4  Comparison 1 Oral or topical antibiotics versus placebo/no treatment, Outcome 4 Exit‐site/tunnel infection rate (episodes/total patient‐months on PD). | ||||
| 4.1 Any systemic antibiotic versus placebo/no treatment | 2 | 939 | Risk Ratio (M‐H, Random, 95% CI) | 0.42 [0.17, 1.05] |
| 5 Catheter removal or replacement (number of patients) Show forest plot | 5 | Risk Ratio (M‐H, Random, 95% CI) | Subtotals only | |
| Analysis 1.5  Comparison 1 Oral or topical antibiotics versus placebo/no treatment, Outcome 5 Catheter removal or replacement (number of patients). | ||||
| 5.1 Any systemic antibiotic versus placebo/no treatment | 5 | 395 | Risk Ratio (M‐H, Random, 95% CI) | 0.82 [0.46, 1.46] |
| 6 Mortality (all‐cause) Show forest plot | 4 | Risk Ratio (M‐H, Random, 95% CI) | Subtotals only | |
| Analysis 1.6 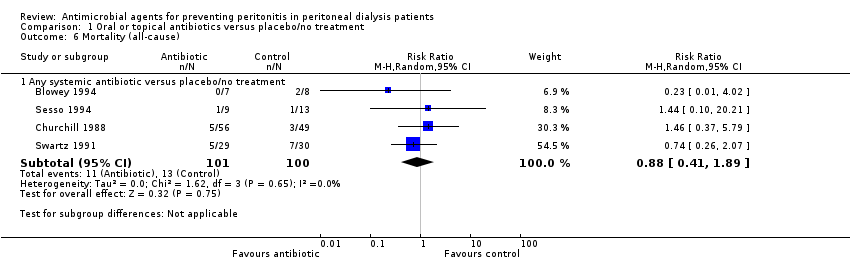 Comparison 1 Oral or topical antibiotics versus placebo/no treatment, Outcome 6 Mortality (all‐cause). | ||||
| 6.1 Any systemic antibiotic versus placebo/no treatment | 4 | 201 | Risk Ratio (M‐H, Random, 95% CI) | 0.88 [0.41, 1.89] |
| 7 Mortality due to peritonitis Show forest plot | 1 | Risk Ratio (M‐H, Random, 95% CI) | Totals not selected | |
| Analysis 1.7 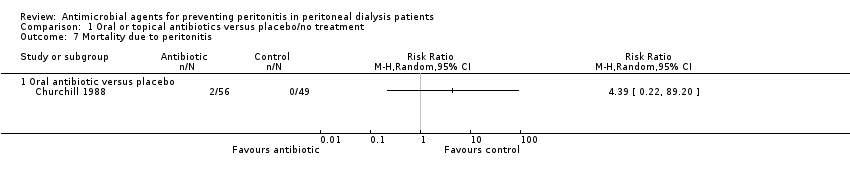 Comparison 1 Oral or topical antibiotics versus placebo/no treatment, Outcome 7 Mortality due to peritonitis. | ||||
| 7.1 Oral antibiotic versus placebo | 1 | Risk Ratio (M‐H, Random, 95% CI) | 0.0 [0.0, 0.0] | |
| 8 Adverse effects Show forest plot | 2 | Risk Ratio (M‐H, Random, 95% CI) | Totals not selected | |
| Analysis 1.8 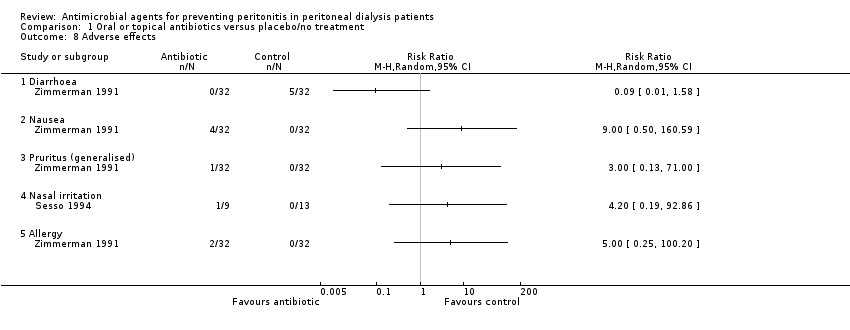 Comparison 1 Oral or topical antibiotics versus placebo/no treatment, Outcome 8 Adverse effects. | ||||
| 8.1 Diarrhoea | 1 | Risk Ratio (M‐H, Random, 95% CI) | 0.0 [0.0, 0.0] | |
| 8.2 Nausea | 1 | Risk Ratio (M‐H, Random, 95% CI) | 0.0 [0.0, 0.0] | |
| 8.3 Pruritus (generalised) | 1 | Risk Ratio (M‐H, Random, 95% CI) | 0.0 [0.0, 0.0] | |
| 8.4 Nasal irritation | 1 | Risk Ratio (M‐H, Random, 95% CI) | 0.0 [0.0, 0.0] | |
| 8.5 Allergy | 1 | Risk Ratio (M‐H, Random, 95% CI) | 0.0 [0.0, 0.0] | |
| Outcome or subgroup title | No. of studies | No. of participants | Statistical method | Effect size |
| 1 Peritonitis (number of patients with one or more episodes) Show forest plot | 4 | 314 | Risk Ratio (M‐H, Random, 95% CI) | 1.28 [0.89, 1.84] |
| Analysis 2.1  Comparison 2 Oral or topical antibiotics versus other antibiotic, Outcome 1 Peritonitis (number of patients with one or more episodes). | ||||
| 1.1 Sodium fusidate ointment versus ofloxacin (oral) | 1 | 18 | Risk Ratio (M‐H, Random, 95% CI) | 0.25 [0.03, 1.82] |
| 1.2 Mupirocin ointment versus rifampin (oral) | 1 | 82 | Risk Ratio (M‐H, Random, 95% CI) | 1.25 [0.67, 2.33] |
| 1.3 Mupirocin ointment/cream versus gentamicin cream (topical) | 2 | 214 | Risk Ratio (M‐H, Random, 95% CI) | 1.39 [0.93, 2.07] |
| 2 Peritonitis rate (episodes/total patient‐months on PD) Show forest plot | 5 | Risk Ratio (M‐H, Random, 95% CI) | Totals not selected | |
| Analysis 2.2  Comparison 2 Oral or topical antibiotics versus other antibiotic, Outcome 2 Peritonitis rate (episodes/total patient‐months on PD). | ||||
| 2.1 Mupirocin ointment versus polysporin triple ointment (exit site) | 1 | Risk Ratio (M‐H, Random, 95% CI) | 0.0 [0.0, 0.0] | |
| 2.2 Sodium fusidate ointment versus ofloxacin (oral) | 1 | Risk Ratio (M‐H, Random, 95% CI) | 0.0 [0.0, 0.0] | |
| 2.3 Mupirocin ointment versus neomycin sulphate ointment (nasal) | 1 | Risk Ratio (M‐H, Random, 95% CI) | 0.0 [0.0, 0.0] | |
| 2.4 Mupirocin ointment versus rifampin (oral) | 1 | Risk Ratio (M‐H, Random, 95% CI) | 0.0 [0.0, 0.0] | |
| 2.5 Mupirocin ointment versus gentamicin cream (exit site) | 1 | Risk Ratio (M‐H, Random, 95% CI) | 0.0 [0.0, 0.0] | |
| 3 Exit‐site/tunnel infection (number of patients with one or more episodes) Show forest plot | 4 | 336 | Risk Ratio (M‐H, Random, 95% CI) | 1.28 [0.71, 2.31] |
| Analysis 2.3  Comparison 2 Oral or topical antibiotics versus other antibiotic, Outcome 3 Exit‐site/tunnel infection (number of patients with one or more episodes). | ||||
| 3.1 Mupirocin ointment versus sodium fusidate ointment (topical) | 1 | 100 | Risk Ratio (M‐H, Random, 95% CI) | 0.91 [0.42, 1.95] |
| 3.2 Sodium fusidate ointment versus ofloxacin (oral) | 1 | 22 | Risk Ratio (M‐H, Random, 95% CI) | 2.41 [0.76, 7.62] |
| 3.3 Mupirocin ointment/cream versus gentamicin cream (topical) | 2 | 214 | Risk Ratio (M‐H, Random, 95% CI) | 1.19 [0.41, 3.46] |
| 4 Exit‐site/tunnel infection rate (episodes/total patient‐months on PD) Show forest plot | 3 | Risk Ratio (M‐H, Random, 95% CI) | Totals not selected | |
| Analysis 2.4 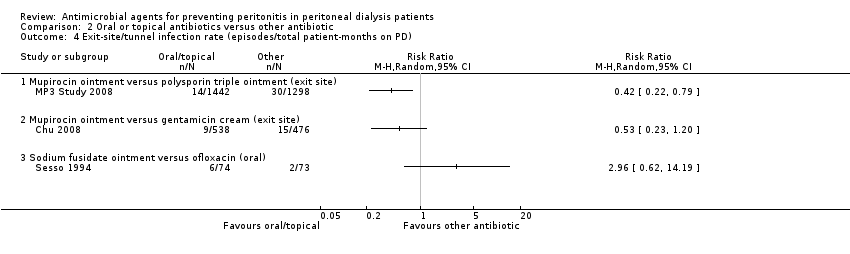 Comparison 2 Oral or topical antibiotics versus other antibiotic, Outcome 4 Exit‐site/tunnel infection rate (episodes/total patient‐months on PD). | ||||
| 4.1 Mupirocin ointment versus polysporin triple ointment (exit site) | 1 | Risk Ratio (M‐H, Random, 95% CI) | 0.0 [0.0, 0.0] | |
| 4.2 Mupirocin ointment versus gentamicin cream (exit site) | 1 | Risk Ratio (M‐H, Random, 95% CI) | 0.0 [0.0, 0.0] | |
| 4.3 Sodium fusidate ointment versus ofloxacin (oral) | 1 | Risk Ratio (M‐H, Random, 95% CI) | 0.0 [0.0, 0.0] | |
| 5 Catheter removal or replacement (number of patients) Show forest plot | 4 | Risk Ratio (M‐H, Random, 95% CI) | Totals not selected | |
| Analysis 2.5  Comparison 2 Oral or topical antibiotics versus other antibiotic, Outcome 5 Catheter removal or replacement (number of patients). | ||||
| 5.1 Mupirocin ointment versus polysporin triple ointment (exit site) | 1 | Risk Ratio (M‐H, Random, 95% CI) | 0.0 [0.0, 0.0] | |
| 5.2 Sodium fusidate ointment versus ofloxacin (oral) | 1 | Risk Ratio (M‐H, Random, 95% CI) | 0.0 [0.0, 0.0] | |
| 5.3 Mupirocin ointment (exit site) versus rifampin (oral) | 1 | Risk Ratio (M‐H, Random, 95% CI) | 0.0 [0.0, 0.0] | |
| 5.4 Mupirocin cream versus gentamicin cream (exit site) | 1 | Risk Ratio (M‐H, Random, 95% CI) | 0.0 [0.0, 0.0] | |
| 6 Mortality (all‐cause) Show forest plot | 4 | Risk Ratio (M‐H, Random, 95% CI) | Totals not selected | |
| Analysis 2.6  Comparison 2 Oral or topical antibiotics versus other antibiotic, Outcome 6 Mortality (all‐cause). | ||||
| 6.1 Mupirocin ointment versus polysporin triple ointment (exit site) | 1 | Risk Ratio (M‐H, Random, 95% CI) | 0.0 [0.0, 0.0] | |
| 6.2 Sodium fusidate ointment versus ofloxacin (oral) | 1 | Risk Ratio (M‐H, Random, 95% CI) | 0.0 [0.0, 0.0] | |
| 6.3 Mupirocin ointment versus rifampin (oral) | 1 | Risk Ratio (M‐H, Random, 95% CI) | 0.0 [0.0, 0.0] | |
| 6.4 Mupirocin ointment versus gentamicin cream (exit site) | 1 | Risk Ratio (M‐H, Random, 95% CI) | 0.0 [0.0, 0.0] | |
| 7 Technique failure Show forest plot | 1 | Risk Ratio (M‐H, Random, 95% CI) | Totals not selected | |
| Analysis 2.7 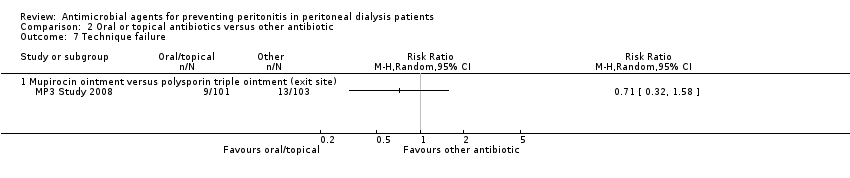 Comparison 2 Oral or topical antibiotics versus other antibiotic, Outcome 7 Technique failure. | ||||
| 7.1 Mupirocin ointment versus polysporin triple ointment (exit site) | 1 | Risk Ratio (M‐H, Random, 95% CI) | 0.0 [0.0, 0.0] | |
| 8 Adverse effects Show forest plot | 3 | Risk Ratio (M‐H, Random, 95% CI) | Subtotals only | |
| Analysis 2.8  Comparison 2 Oral or topical antibiotics versus other antibiotic, Outcome 8 Adverse effects. | ||||
| 8.1 Nausea | 1 | 82 | Risk Ratio (M‐H, Random, 95% CI) | 0.09 [0.01, 1.59] |
| 8.2 Pruritus (local) | 2 | 337 | Risk Ratio (M‐H, Random, 95% CI) | 0.65 [0.29, 1.49] |
| Outcome or subgroup title | No. of studies | No. of participants | Statistical method | Effect size |
| 1 Peritonitis (number of patients with one or more episodes) Show forest plot | 3 | 338 | Risk Ratio (M‐H, Random, 95% CI) | 0.94 [0.67, 1.31] |
| Analysis 3.1  Comparison 3 Nasal antibiotics versus placebo/no treatment, Outcome 1 Peritonitis (number of patients with one or more episodes). | ||||
| 2 Peritonitis rate (episodes/total patient‐months on PD) Show forest plot | 2 | 2797 | Risk Ratio (M‐H, Random, 95% CI) | 0.67 [0.16, 2.77] |
| Analysis 3.2  Comparison 3 Nasal antibiotics versus placebo/no treatment, Outcome 2 Peritonitis rate (episodes/total patient‐months on PD). | ||||
| 3 Exit site and tunnel infection (number of patients with one or more episodes) Show forest plot | 3 | 338 | Risk Ratio (M‐H, Random, 95% CI) | 1.34 [0.62, 2.87] |
| Analysis 3.3 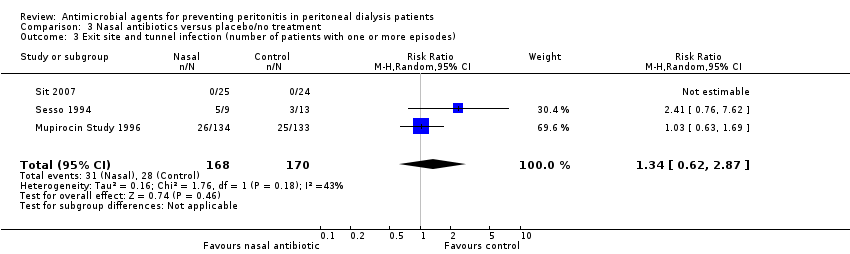 Comparison 3 Nasal antibiotics versus placebo/no treatment, Outcome 3 Exit site and tunnel infection (number of patients with one or more episodes). | ||||
| 4 Exit site and tunnel infection rate (episodes/total patient‐months on PD) Show forest plot | 2 | 2796 | Risk Ratio (M‐H, Random, 95% CI) | 0.91 [0.29, 2.92] |
| Analysis 3.4  Comparison 3 Nasal antibiotics versus placebo/no treatment, Outcome 4 Exit site and tunnel infection rate (episodes/total patient‐months on PD). | ||||
| 5 Catheter removal or replacement (number of patients) Show forest plot | 2 | 289 | Risk Ratio (M‐H, Random, 95% CI) | 0.92 [0.48, 1.78] |
| Analysis 3.5  Comparison 3 Nasal antibiotics versus placebo/no treatment, Outcome 5 Catheter removal or replacement (number of patients). | ||||
| 6 Mortality (all‐cause) Show forest plot | 3 | 338 | Risk Ratio (M‐H, Random, 95% CI) | 0.89 [0.53, 1.47] |
| Analysis 3.6 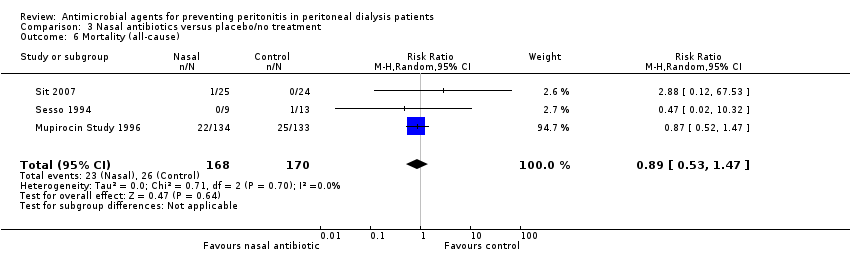 Comparison 3 Nasal antibiotics versus placebo/no treatment, Outcome 6 Mortality (all‐cause). | ||||
| 7 Adverse effects Show forest plot | 2 | Risk Ratio (M‐H, Random, 95% CI) | Subtotals only | |
| Analysis 3.7 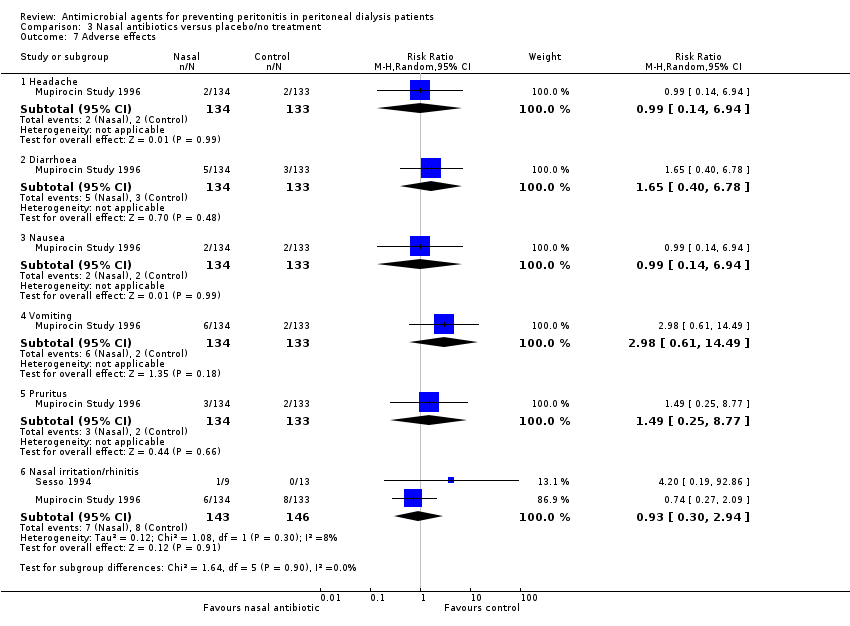 Comparison 3 Nasal antibiotics versus placebo/no treatment, Outcome 7 Adverse effects. | ||||
| 7.1 Headache | 1 | 267 | Risk Ratio (M‐H, Random, 95% CI) | 0.99 [0.14, 6.94] |
| 7.2 Diarrhoea | 1 | 267 | Risk Ratio (M‐H, Random, 95% CI) | 1.65 [0.40, 6.78] |
| 7.3 Nausea | 1 | 267 | Risk Ratio (M‐H, Random, 95% CI) | 0.99 [0.14, 6.94] |
| 7.4 Vomiting | 1 | 267 | Risk Ratio (M‐H, Random, 95% CI) | 2.98 [0.61, 14.49] |
| 7.5 Pruritus | 1 | 267 | Risk Ratio (M‐H, Random, 95% CI) | 1.49 [0.25, 8.77] |
| 7.6 Nasal irritation/rhinitis | 2 | 289 | Risk Ratio (M‐H, Random, 95% CI) | 0.93 [0.30, 2.94] |
| Outcome or subgroup title | No. of studies | No. of participants | Statistical method | Effect size |
| 1 Peritonitis (number of patients with one or more episodes) Show forest plot | 4 | Risk Ratio (M‐H, Random, 95% CI) | Totals not selected | |
| Analysis 4.1  Comparison 4 Pre/peri‐operative prophylaxis versus placebo/no treatment or other antibiotic, Outcome 1 Peritonitis (number of patients with one or more episodes). | ||||
| 1.1 Vancomycin versus placebo | 1 | Risk Ratio (M‐H, Random, 95% CI) | 0.0 [0.0, 0.0] | |
| 1.2 Cefazolin versus placebo | 1 | Risk Ratio (M‐H, Random, 95% CI) | 0.0 [0.0, 0.0] | |
| 1.3 IV gentamicin versus no antibiotics | 1 | Risk Ratio (M‐H, Random, 95% CI) | 0.0 [0.0, 0.0] | |
| 1.4 IV cefazolin + gentamicin versus no antibiotics | 1 | Risk Ratio (M‐H, Random, 95% CI) | 0.0 [0.0, 0.0] | |
| 1.5 IV cefuroxime + cefuroxime (intraperitoneal) versus no antibiotics | 1 | Risk Ratio (M‐H, Random, 95% CI) | 0.0 [0.0, 0.0] | |
| 1.6 Vancomycin versus cefazolin | 1 | Risk Ratio (M‐H, Random, 95% CI) | 0.0 [0.0, 0.0] | |
| 2 Exit site/tunnel infection (number of patients with one or more episodes) Show forest plot | 4 | Risk Ratio (M‐H, Random, 95% CI) | Totals not selected | |
| Analysis 4.2  Comparison 4 Pre/peri‐operative prophylaxis versus placebo/no treatment or other antibiotic, Outcome 2 Exit site/tunnel infection (number of patients with one or more episodes). | ||||
| 2.1 Vancomycin versus placebo | 1 | Risk Ratio (M‐H, Random, 95% CI) | 0.0 [0.0, 0.0] | |
| 2.2 Cefazolin versus placebo | 1 | Risk Ratio (M‐H, Random, 95% CI) | 0.0 [0.0, 0.0] | |
| 2.3 IV gentamicin versus no antibiotics | 1 | Risk Ratio (M‐H, Random, 95% CI) | 0.0 [0.0, 0.0] | |
| 2.4 IV cefazolin + gentamicin versus no antibiotics | 1 | Risk Ratio (M‐H, Random, 95% CI) | 0.0 [0.0, 0.0] | |
| 2.5 IV cefuroxime + cefuroxime (intraperitoneal) versus no antibiotics | 1 | Risk Ratio (M‐H, Random, 95% CI) | 0.0 [0.0, 0.0] | |
| 2.6 Vancomycin versus cefazolin | 1 | Risk Ratio (M‐H, Random, 95% CI) | 0.0 [0.0, 0.0] | |
| 3 Catheter removal or replacement (number of patients) Show forest plot | 1 | Risk Ratio (M‐H, Random, 95% CI) | Totals not selected | |
| Analysis 4.3  Comparison 4 Pre/peri‐operative prophylaxis versus placebo/no treatment or other antibiotic, Outcome 3 Catheter removal or replacement (number of patients). | ||||
| 4 Mortality (all‐cause) Show forest plot | 1 | Risk Ratio (M‐H, Random, 95% CI) | Totals not selected | |
| Analysis 4.4  Comparison 4 Pre/peri‐operative prophylaxis versus placebo/no treatment or other antibiotic, Outcome 4 Mortality (all‐cause). | ||||
| Outcome or subgroup title | No. of studies | No. of participants | Statistical method | Effect size |
| 1 Peritonitis (number of patients with one or more episodes) Show forest plot | 6 | 853 | Risk Ratio (M‐H, Random, 95% CI) | 0.83 [0.65, 1.06] |
| Analysis 5.1 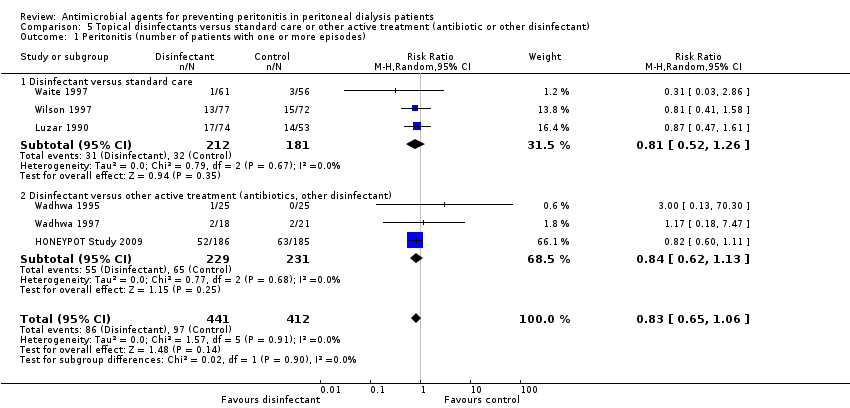 Comparison 5 Topical disinfectants versus standard care or other active treatment (antibiotic or other disinfectant), Outcome 1 Peritonitis (number of patients with one or more episodes). | ||||
| 1.1 Disinfectant versus standard care | 3 | 393 | Risk Ratio (M‐H, Random, 95% CI) | 0.81 [0.52, 1.26] |
| 1.2 Disinfectant versus other active treatment (antibiotics, other disinfectant) | 3 | 460 | Risk Ratio (M‐H, Random, 95% CI) | 0.84 [0.62, 1.13] |
| 2 Exit site/tunnel infection (number of patients with one or more episodes) Show forest plot | 8 | 973 | Risk Ratio (M‐H, Random, 95% CI) | 1.00 [0.75, 1.33] |
| Analysis 5.2  Comparison 5 Topical disinfectants versus standard care or other active treatment (antibiotic or other disinfectant), Outcome 2 Exit site/tunnel infection (number of patients with one or more episodes). | ||||
| 2.1 Disinfectant versus standard care | 4 | 453 | Risk Ratio (M‐H, Random, 95% CI) | 0.74 [0.45, 1.20] |
| 2.2 Disinfectant versus other active treatment (antibiotics, other disinfectant) | 4 | 520 | Risk Ratio (M‐H, Random, 95% CI) | 1.19 [0.89, 1.60] |
| 3 Exit site/tunnel infection rate (episodes/total patient‐months on PD) Show forest plot | 2 | Risk Ratio (M‐H, Random, 95% CI) | Subtotals only | |
| Analysis 5.3 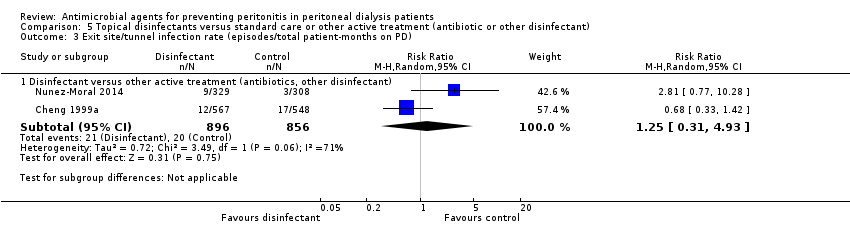 Comparison 5 Topical disinfectants versus standard care or other active treatment (antibiotic or other disinfectant), Outcome 3 Exit site/tunnel infection rate (episodes/total patient‐months on PD). | ||||
| 3.1 Disinfectant versus other active treatment (antibiotics, other disinfectant) | 2 | 1752 | Risk Ratio (M‐H, Random, 95% CI) | 1.25 [0.31, 4.93] |
| 4 Catheter removal or replacement (number of patients) Show forest plot | 7 | 852 | Risk Ratio (M‐H, Random, 95% CI) | 0.89 [0.57, 1.38] |
| Analysis 5.4  Comparison 5 Topical disinfectants versus standard care or other active treatment (antibiotic or other disinfectant), Outcome 4 Catheter removal or replacement (number of patients). | ||||
| 4.1 Disinfectant versus standard care | 2 | 266 | Risk Ratio (M‐H, Random, 95% CI) | 0.73 [0.34, 1.55] |
| 4.2 Disinfectant versus other active treatment (antibiotics, other disinfectant) | 5 | 586 | Risk Ratio (M‐H, Random, 95% CI) | 0.98 [0.57, 1.69] |
| 5 Mortality (all‐cause) Show forest plot | 4 | 697 | Risk Ratio (M‐H, Random, 95% CI) | 0.88 [0.53, 1.44] |
| Analysis 5.5 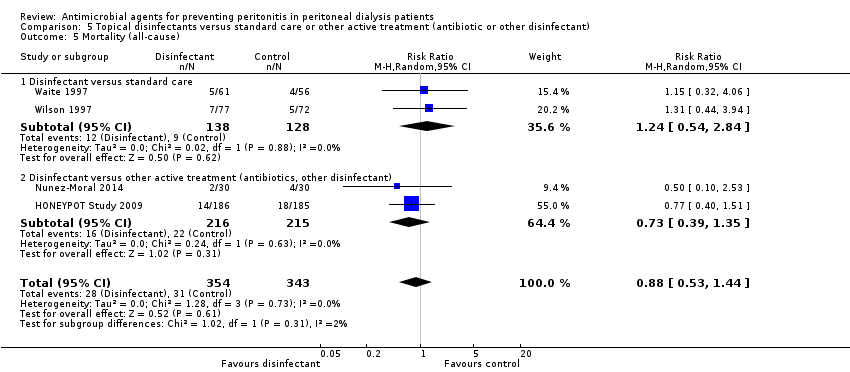 Comparison 5 Topical disinfectants versus standard care or other active treatment (antibiotic or other disinfectant), Outcome 5 Mortality (all‐cause). | ||||
| 5.1 Disinfectant versus standard care | 2 | 266 | Risk Ratio (M‐H, Random, 95% CI) | 1.24 [0.54, 2.84] |
| 5.2 Disinfectant versus other active treatment (antibiotics, other disinfectant) | 2 | 431 | Risk Ratio (M‐H, Random, 95% CI) | 0.73 [0.39, 1.35] |
| 6 Technique failure Show forest plot | 1 | Risk Ratio (M‐H, Random, 95% CI) | Totals not selected | |
| Analysis 5.6 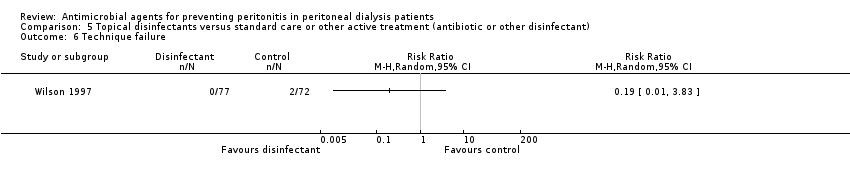 Comparison 5 Topical disinfectants versus standard care or other active treatment (antibiotic or other disinfectant), Outcome 6 Technique failure. | ||||
| 7 Pruritus (local) Show forest plot | 4 | 609 | Risk Ratio (M‐H, Random, 95% CI) | 2.80 [1.21, 6.48] |
| Analysis 5.7  Comparison 5 Topical disinfectants versus standard care or other active treatment (antibiotic or other disinfectant), Outcome 7 Pruritus (local). | ||||
| Outcome or subgroup title | No. of studies | No. of participants | Statistical method | Effect size |
| 1 Peritonitis rate (episodes/total patient‐months on PD) Show forest plot | 2 | 1855 | Risk Ratio (M‐H, Random, 95% CI) | 1.05 [0.74, 1.51] |
| Analysis 6.1  Comparison 6 Germicidal chamber versus none, Outcome 1 Peritonitis rate (episodes/total patient‐months on PD). | ||||
| 2 Mortality (all‐cause) Show forest plot | 1 | Risk Ratio (M‐H, Random, 95% CI) | Totals not selected | |
| Analysis 6.2 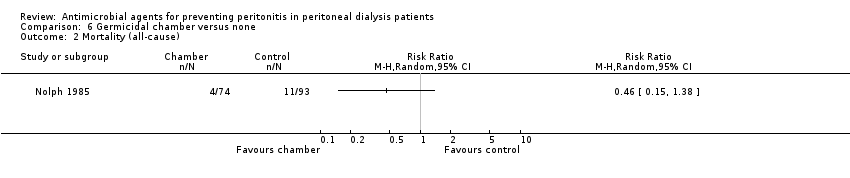 Comparison 6 Germicidal chamber versus none, Outcome 2 Mortality (all‐cause). | ||||
| Outcome or subgroup title | No. of studies | No. of participants | Statistical method | Effect size |
| 1 Exit site/tunnel infection (number of patients with one or more episodes) Show forest plot | 3 | Risk Ratio (M‐H, Random, 95% CI) | Totals not selected | |
| Analysis 7.1 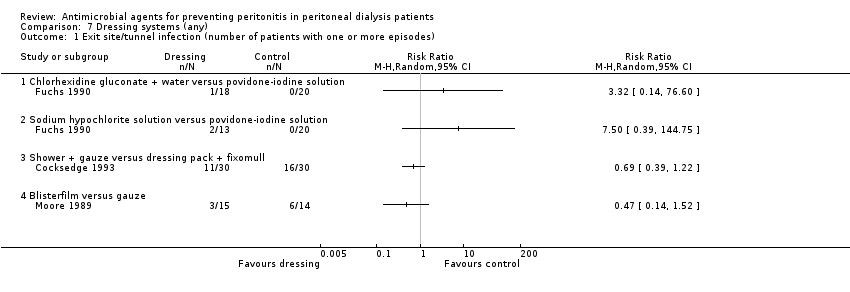 Comparison 7 Dressing systems (any), Outcome 1 Exit site/tunnel infection (number of patients with one or more episodes). | ||||
| 1.1 Chlorhexidine gluconate + water versus povidone‐iodine solution | 1 | Risk Ratio (M‐H, Random, 95% CI) | 0.0 [0.0, 0.0] | |
| 1.2 Sodium hypochlorite solution versus povidone‐iodine solution | 1 | Risk Ratio (M‐H, Random, 95% CI) | 0.0 [0.0, 0.0] | |
| 1.3 Shower + gauze versus dressing pack + fixomull | 1 | Risk Ratio (M‐H, Random, 95% CI) | 0.0 [0.0, 0.0] | |
| 1.4 Blisterfilm versus gauze | 1 | Risk Ratio (M‐H, Random, 95% CI) | 0.0 [0.0, 0.0] | |
| 2 Exit site/tunnel infection rate (episodes/total patient‐months on PD) Show forest plot | 1 | Risk Ratio (M‐H, Random, 95% CI) | Totals not selected | |
| Analysis 7.2  Comparison 7 Dressing systems (any), Outcome 2 Exit site/tunnel infection rate (episodes/total patient‐months on PD). | ||||
| 2.1 Shower + gauze versus dressing pack + fixomull | 1 | Risk Ratio (M‐H, Random, 95% CI) | 0.0 [0.0, 0.0] | |
| Outcome or subgroup title | No. of studies | No. of participants | Statistical method | Effect size |
| 1 Peritonitis (number of patients with one or more episodes) Show forest plot | 1 | Risk Ratio (M‐H, Random, 95% CI) | Totals not selected | |
| Analysis 8.1  Comparison 8 Silver ring system on catheter versus none, Outcome 1 Peritonitis (number of patients with one or more episodes). | ||||
| 2 Exit site/tunnel infection (number of patients with one or more episodes) Show forest plot | 1 | Risk Ratio (M‐H, Random, 95% CI) | Totals not selected | |
| Analysis 8.2  Comparison 8 Silver ring system on catheter versus none, Outcome 2 Exit site/tunnel infection (number of patients with one or more episodes). | ||||
| 3 Catheter removal or replacement (number of patients) Show forest plot | 1 | Risk Ratio (M‐H, Random, 95% CI) | Totals not selected | |
| Analysis 8.3  Comparison 8 Silver ring system on catheter versus none, Outcome 3 Catheter removal or replacement (number of patients). | ||||
| 4 Mortality (all‐cause) Show forest plot | 1 | Risk Ratio (M‐H, Random, 95% CI) | Totals not selected | |
| Analysis 8.4 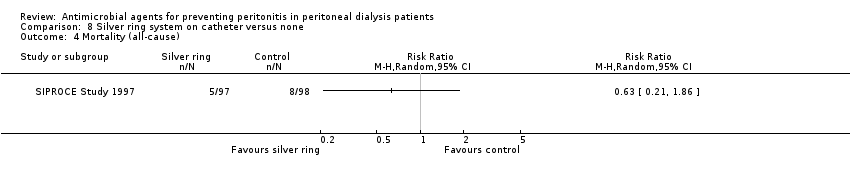 Comparison 8 Silver ring system on catheter versus none, Outcome 4 Mortality (all‐cause). | ||||
| Outcome or subgroup title | No. of studies | No. of participants | Statistical method | Effect size |
| 1 Peritonitis rate (episodes/total patient‐months on PD) Show forest plot | 1 | Risk Ratio (M‐H, Random, 95% CI) | Totals not selected | |
| Analysis 9.1  Comparison 9 Antistaphylococcal vaccine (Staphypan) versus placebo, Outcome 1 Peritonitis rate (episodes/total patient‐months on PD). | ||||
| 2 Exit site/tunnel infection rate (episodes/total patient‐months on PD) Show forest plot | 1 | Risk Ratio (M‐H, Random, 95% CI) | Totals not selected | |
| Analysis 9.2 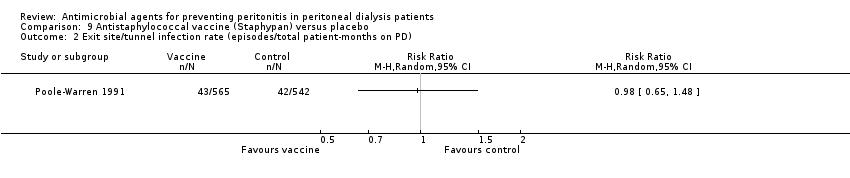 Comparison 9 Antistaphylococcal vaccine (Staphypan) versus placebo, Outcome 2 Exit site/tunnel infection rate (episodes/total patient‐months on PD). | ||||
| Outcome or subgroup title | No. of studies | No. of participants | Statistical method | Effect size |
| 1 Fungal peritonitis (number of patients with one or more episodes) Show forest plot | 2 | 817 | Risk Ratio (M‐H, Random, 95% CI) | 0.28 [0.12, 0.63] |
| Analysis 10.1  Comparison 10 Antifungal versus placebo/no treatment, Outcome 1 Fungal peritonitis (number of patients with one or more episodes). | ||||
| 2 Fungal peritonitis rate (episodes/total patient‐months on PD) Show forest plot | 1 | Risk Ratio (M‐H, Random, 95% CI) | Totals not selected | |
| Analysis 10.2  Comparison 10 Antifungal versus placebo/no treatment, Outcome 2 Fungal peritonitis rate (episodes/total patient‐months on PD). | ||||


Risk of bias graph: review authors' judgements about each risk of bias item presented as percentages across all included studies.

Risk of bias summary: review authors' judgements about each risk of bias item for each included study.
Comparison 1 Oral or topical antibiotics versus placebo/no treatment, Outcome 1 Peritonitis (number of patients with one or more episodes).
Comparison 1 Oral or topical antibiotics versus placebo/no treatment, Outcome 2 Peritonitis rate (episodes/total patient‐months on PD).
Comparison 1 Oral or topical antibiotics versus placebo/no treatment, Outcome 3 Exit‐site/tunnel infection (number of patients with one or more episodes).
Comparison 1 Oral or topical antibiotics versus placebo/no treatment, Outcome 4 Exit‐site/tunnel infection rate (episodes/total patient‐months on PD).
Comparison 1 Oral or topical antibiotics versus placebo/no treatment, Outcome 5 Catheter removal or replacement (number of patients).
Comparison 1 Oral or topical antibiotics versus placebo/no treatment, Outcome 6 Mortality (all‐cause).
Comparison 1 Oral or topical antibiotics versus placebo/no treatment, Outcome 7 Mortality due to peritonitis.
Comparison 1 Oral or topical antibiotics versus placebo/no treatment, Outcome 8 Adverse effects.
Comparison 2 Oral or topical antibiotics versus other antibiotic, Outcome 1 Peritonitis (number of patients with one or more episodes).
Comparison 2 Oral or topical antibiotics versus other antibiotic, Outcome 2 Peritonitis rate (episodes/total patient‐months on PD).
Comparison 2 Oral or topical antibiotics versus other antibiotic, Outcome 3 Exit‐site/tunnel infection (number of patients with one or more episodes).
Comparison 2 Oral or topical antibiotics versus other antibiotic, Outcome 4 Exit‐site/tunnel infection rate (episodes/total patient‐months on PD).
Comparison 2 Oral or topical antibiotics versus other antibiotic, Outcome 5 Catheter removal or replacement (number of patients).
Comparison 2 Oral or topical antibiotics versus other antibiotic, Outcome 6 Mortality (all‐cause).
Comparison 2 Oral or topical antibiotics versus other antibiotic, Outcome 7 Technique failure.
Comparison 2 Oral or topical antibiotics versus other antibiotic, Outcome 8 Adverse effects.
Comparison 3 Nasal antibiotics versus placebo/no treatment, Outcome 1 Peritonitis (number of patients with one or more episodes).
Comparison 3 Nasal antibiotics versus placebo/no treatment, Outcome 2 Peritonitis rate (episodes/total patient‐months on PD).
Comparison 3 Nasal antibiotics versus placebo/no treatment, Outcome 3 Exit site and tunnel infection (number of patients with one or more episodes).
Comparison 3 Nasal antibiotics versus placebo/no treatment, Outcome 4 Exit site and tunnel infection rate (episodes/total patient‐months on PD).
Comparison 3 Nasal antibiotics versus placebo/no treatment, Outcome 5 Catheter removal or replacement (number of patients).
Comparison 3 Nasal antibiotics versus placebo/no treatment, Outcome 6 Mortality (all‐cause).
Comparison 3 Nasal antibiotics versus placebo/no treatment, Outcome 7 Adverse effects.
Comparison 4 Pre/peri‐operative prophylaxis versus placebo/no treatment or other antibiotic, Outcome 1 Peritonitis (number of patients with one or more episodes).
Comparison 4 Pre/peri‐operative prophylaxis versus placebo/no treatment or other antibiotic, Outcome 2 Exit site/tunnel infection (number of patients with one or more episodes).
Comparison 4 Pre/peri‐operative prophylaxis versus placebo/no treatment or other antibiotic, Outcome 3 Catheter removal or replacement (number of patients).
Comparison 4 Pre/peri‐operative prophylaxis versus placebo/no treatment or other antibiotic, Outcome 4 Mortality (all‐cause).
Comparison 5 Topical disinfectants versus standard care or other active treatment (antibiotic or other disinfectant), Outcome 1 Peritonitis (number of patients with one or more episodes).
Comparison 5 Topical disinfectants versus standard care or other active treatment (antibiotic or other disinfectant), Outcome 2 Exit site/tunnel infection (number of patients with one or more episodes).
Comparison 5 Topical disinfectants versus standard care or other active treatment (antibiotic or other disinfectant), Outcome 3 Exit site/tunnel infection rate (episodes/total patient‐months on PD).
Comparison 5 Topical disinfectants versus standard care or other active treatment (antibiotic or other disinfectant), Outcome 4 Catheter removal or replacement (number of patients).
Comparison 5 Topical disinfectants versus standard care or other active treatment (antibiotic or other disinfectant), Outcome 5 Mortality (all‐cause).
Comparison 5 Topical disinfectants versus standard care or other active treatment (antibiotic or other disinfectant), Outcome 6 Technique failure.
Comparison 5 Topical disinfectants versus standard care or other active treatment (antibiotic or other disinfectant), Outcome 7 Pruritus (local).
Comparison 6 Germicidal chamber versus none, Outcome 1 Peritonitis rate (episodes/total patient‐months on PD).
Comparison 6 Germicidal chamber versus none, Outcome 2 Mortality (all‐cause).
Comparison 7 Dressing systems (any), Outcome 1 Exit site/tunnel infection (number of patients with one or more episodes).
Comparison 7 Dressing systems (any), Outcome 2 Exit site/tunnel infection rate (episodes/total patient‐months on PD).
Comparison 8 Silver ring system on catheter versus none, Outcome 1 Peritonitis (number of patients with one or more episodes).
Comparison 8 Silver ring system on catheter versus none, Outcome 2 Exit site/tunnel infection (number of patients with one or more episodes).
Comparison 8 Silver ring system on catheter versus none, Outcome 3 Catheter removal or replacement (number of patients).
Comparison 8 Silver ring system on catheter versus none, Outcome 4 Mortality (all‐cause).
Comparison 9 Antistaphylococcal vaccine (Staphypan) versus placebo, Outcome 1 Peritonitis rate (episodes/total patient‐months on PD).
Comparison 9 Antistaphylococcal vaccine (Staphypan) versus placebo, Outcome 2 Exit site/tunnel infection rate (episodes/total patient‐months on PD).
Comparison 10 Antifungal versus placebo/no treatment, Outcome 1 Fungal peritonitis (number of patients with one or more episodes).
Comparison 10 Antifungal versus placebo/no treatment, Outcome 2 Fungal peritonitis rate (episodes/total patient‐months on PD).
| Oral or topical or intraperitoneal antibiotics versus placebo/no treatment for preventing peritonitis in peritoneal dialysis patients | ||||||
| Patient or population: patients with CKD on peritoneal dialysis | ||||||
| Outcomes | Illustrative comparative risks* (95% CI) | Relative effect | No of participants | Quality of the evidence | Comments | |
| Assumed risk | Corresponding risk | |||||
| Control | Oral or topical or intraperitoneal antibiotics versus placebo/no treatment | |||||
| Peritonitis (number of patients with one or more episodes) | Study population | RR 0.82 | 395 (5) | ⊕⊕⊝⊝ | ||
| 360 per 1000 | 295 per 1000 | |||||
| Moderate | ||||||
| 385 per 1000 | 316 per 1000 | |||||
| Exit‐site/tunnel infection (number of patients with one or more episodes) | Study population | RR 0.45 | 191 (3) | ⊕⊕⊝⊝ | ||
| 176 per 1000 | 79 per 1000 | |||||
| Moderate | ||||||
| 231 per 1000 | 104 per 1000 | |||||
| Catheter removal or replacement (number of patients) | Study population | RR 0.82 | 395 (5) | ⊕⊕⊝⊝ | ||
| 115 per 1000 | 94 per 1000 | |||||
| Moderate | ||||||
| 156 per 1000 | 128 per 1000 | |||||
| *The basis for the assumed risk (e.g. the median control group risk across studies) is provided in footnotes. The corresponding risk (and its 95% confidence interval) is based on the assumed risk in the comparison group and the relative effect of the intervention (and its 95% CI). | ||||||
| GRADE Working Group grades of evidence | ||||||
| 1 Unclear or high risk of bias in 3 of 5 studies Abbreviations: CKD ‐ chronic kidney disease; GRADE ‐ Grading of Recommendations Assessment, Development and Evaluation | ||||||
| Nasal antibiotics versus no treatment for preventing peritonitis in peritoneal dialysis patients | ||||||
| Patient or population: patients with CKD on peritoneal dialysis | ||||||
| Outcomes | Illustrative comparative risks* (95% CI) | Relative effect | No. of participants | Quality of the evidence | Comments | |
| Assumed risk | Corresponding risk | |||||
| Control | Nasal antibiotics versus placebo/no treatment | |||||
| Peritonitis (number of patients with one or more episodes) | Study population | RR 0.94 | 338 (3) | ⊕⊕⊝⊝ | ||
| 294 per 1000 | 276 per 1000 | |||||
| Moderate | ||||||
| 331 per 1000 | 311 per 1000 | |||||
| Exit‐site/ tunnel infection (number of patients with one or more episodes) | Study population | RR 1.34 | 338 (3) | ⊕⊕⊝⊝ | ||
| 165 per 1000 | 221 per 1000 | |||||
| Moderate | ||||||
| 188 per 1000 | 252 per 1000 | |||||
| Catheter removal or replacement (number of patients) | Study population | RR 0.92 | 289 (2) | ⊕⊕⊝⊝ | ||
| 103 per 1000 | 95 per 1000 | |||||
| Moderate | ||||||
| 265 per 1000 | 244 per 1000 | |||||
| *The basis for the assumed risk (e.g. the median control group risk across studies) is provided in footnotes. The corresponding risk (and its 95% confidence interval) is based on the assumed risk in the comparison group and the relative effect of the intervention (and its 95% CI). CI: Confidence interval; RR: Risk ratio | ||||||
| GRADE Working Group grades of evidence | ||||||
| ¹ Unclear risk of bias for allocation concealment in largest study (Mupirocin Study 1996) Abbreviations: CKD ‐ chronic kidney disease; GRADE ‐ Grading of Recommendations Assessment, Development and Evaluation | ||||||
| Topical disinfectants versus standard care or other active treatment (antibiotic or other disinfectant) for preventing peritonitis in peritoneal dialysis patients | ||||||
| Patient or population: patients with CKD on peritoneal dialysis | ||||||
| Outcomes | Illustrative comparative risks* (95% CI) | Relative effect | No. of participants | Quality of the evidence | Comments | |
| Assumed risk | Corresponding risk | |||||
| Control | Topical disinfectants versus standard care or other active treatment (antibiotic or other disinfectant) | |||||
| Peritonitis (number of patients with one or more episodes) | Study population | RR 0.83 | 853 (6) | ⊕⊕⊝⊝ | ||
| 235 per 1000 | 195 per 1000 | |||||
| Moderate | ||||||
| 152 per 1000 | 126 per 1000 | |||||
| Exit‐site/tunnel infection (number of patients with one or more episodes) | Study population | RR 0.97 | 913 (7) | ⊕⊕⊝⊝ | ||
| 238 per 1000 | 230 per 1000 | |||||
| Moderate | ||||||
| 222 per 1000 | 215 per 1000 | |||||
| Catheter removal or replacement (number of patients) | Study population | RR 0.89 | 792 (6) | ⊕⊕⊝⊝ | ||
| 97 per 1000 | 86 per 1000 | |||||
| Moderate | ||||||
| 93 per 1000 | 83 per 1000 | |||||
| *The basis for the assumed risk (e.g. the median control group risk across studies) is provided in footnotes. The corresponding risk (and its 95% confidence interval) is based on the assumed risk in the comparison group and the relative effect of the intervention (and its 95% CI). | ||||||
| GRADE Working Group grades of evidence | ||||||
| 1 Unclear allocation in several studies Abbreviations: CKD ‐ chronic kidney disease; GRADE ‐ Grading of Recommendations Assessment, Development and Evaluation | ||||||
| Antifungal versus placebo/no treatment for preventing fungal peritonitis in peritoneal dialysis patients | ||||||
| Patient or population: patients with CKD on peritoneal dialysis | ||||||
| Outcomes | Illustrative comparative risks* (95% CI) | Relative effect | No. of participants | Quality of the evidence | Comments | |
| Assumed risk | Corresponding risk | |||||
| Control | Antifungal versus placebo/no treatment | |||||
| Fungal peritonitis (number of patients with one or more episodes) | Study population | RR 0.28 | 817 (2) | ⊕⊕⊝⊝ | ||
| 64 per 1000 | 18 per 1000 | |||||
| Moderate | ||||||
| 64 per 1000 | 18 per 1000 | |||||
| *The basis for the assumed risk (e.g. the median control group risk across studies) is provided in footnotes. The corresponding risk (and its 95% confidence interval) is based on the assumed risk in the comparison group and the relative effect of the intervention (and its 95% CI). | ||||||
| GRADE Working Group grades of evidence | ||||||
| 1 High risk of bias in one study (Lo 1996) Abbreviations: CKD ‐ chronic kidney disease; GRADE ‐ Grading of Recommendations Assessment, Development and Evaluation | ||||||
| Guideline | Country | Year | Recommendation |
| Kidney‐Disease Outcomes Quality Initiative | United States of America | NA | No guideline |
| The Renal Association | United Kingdom | April 2008 July 2010 | Guideline 3.1 ‐ PD Access: Implantation Protocol
Guideline 5.1.4 ‐ PD Infectious Complications: Prevention Strategies
Guideline 5.1.5 ‐ PD Infectious Complications: Prevention Strategies
Guideline 5.1.6 ‐ PD Infectious Complications: Prevention Strategies
|
| Canadian Society of Nephrology | Canada | NA | No guideline |
| European Renal Best Practice | Europe | NA | No guideline |
| International Society for Peritoneal Dialysis | NA | July 2010 November 2011 | Guideline 3.1: Implantation Protocol (1A)
Position Statement: Catheter Placement to Prevent Catheter Infections and the Related Peritonitis Episodes
Position Statement: Exit‐Site Care to Prevent Peritonitis
Position Statement: Prevention of Fungal Peritonitis
|
| Kidney Health Australia‐Caring for Australasians with Renal Impairment | Australia/ New Zealand | February 2014 | Guideline 6. Prophylactic Antibiotics for Insertion of PD Catheters
Guideline 8. Treatment of Peritoneal Dialysis‐Associated Fungal Peritonitis
Guideline 10. Prophylaxis for Exit‐site/Tunnel Infections Using Mupirocin
|
| MRSA ‐ methicillin‐resistant S. aureus; NA ‐ not applicable; PD ‐ peritoneal dialysis | |||
| Comparisons in 2004 review | Comparisons in 2017 review |
| Oral antibiotics versus none | Oral or topical antibiotics versus placebo/no treatment |
| Nasal antibiotics versus none | Oral or topical antibiotics versus other antibiotic |
| Peri‐operative IV prophylaxis versus none | Nasal antibiotics versus no treatment |
| Peri‐operative IV prophylaxis head‐to‐head | Pre/peri‐operative IV prophylaxis versus none or head‐to‐head |
| Topical disinfectants versus none | Topical disinfectants versus standard care or other active treatment (antibiotic or other disinfectant) |
| Germicidal chamber versus none | Germicidal chamber versus none |
| Antistaphylococcal vaccine (Staphypan) versus placebo | Dressing systems (any) |
| Antibiotic prophylaxis head‐to‐head agents | Silver ring system on catheter versus none |
| ‐‐ | Antistaphylococcal vaccine (Staphypan) versus placebo |
| ‐‐ | Antifungal versus placebo/no treatment |
| Outcome analysed | Number of studies | Number of patients | RR (95% CI) |
| Oral antibiotic prophylaxis | |||
| Pruritus | 1 | 64 | 3.00 (0.13 to 71.00) |
| Diarrhoea | 1 | 64 | 0.09 (0.01 to 1.58) |
| Nausea | 1 | 64 | 9.00 (0.50 to 160.59) |
| Allergy | 1 | 64 | 5.00 (0.25 to 100.20) |
| Nasal antibiotic prophylaxis | |||
| Nasal irritation | 1 | 15 | 2.10 (0.10 to 44.40) |
| Rhinitis | 1 | 267 | 0.74 (0.27 to 2.09) |
| Headache | 1 | 267 | 0.99 (0.14 to 6.94) |
| Diarrhoea | 1 | 267 | 1.65 (0.40 to 6.78) |
| Nausea | 1 | 267 | 0.99 (0.14 to 6.94) |
| Vomiting | 1 | 267 | 2.98 (0.61 to 14.94) |
| Pruritus | 1 | 267 | 1.49 (0.25 to 8.77) |
| Topical disinfectants | |||
| Technique failure | 1 | 149 | 0.19 (0.01 to 3.83) |
| Pruritus | 1 | 149 | 10.29 (0.58 to 182.92) |
| Outcome or subgroup title | No. of studies | No. of participants | Statistical method | Effect size |
| 1 Peritonitis (number of patients with one or more episodes) Show forest plot | 5 | 395 | Risk Ratio (M‐H, Random, 95% CI) | 0.82 [0.57, 1.19] |
| 1.1 Oral antibiotic versus placebo | 4 | 241 | Risk Ratio (M‐H, Random, 95% CI) | 0.87 [0.58, 1.32] |
| 1.2 Mupirocin ointment versus standard care | 1 | 154 | Risk Ratio (M‐H, Random, 95% CI) | 0.55 [0.22, 1.40] |
| 2 Peritonitis rate (episodes/total patient‐months on PD) Show forest plot | 3 | Risk Ratio (M‐H, Random, 95% CI) | Subtotals only | |
| 2.1 Any systemic antibiotic versus placebo/no treatment (excluding nystatin) | 3 | 1440 | Risk Ratio (M‐H, Random, 95% CI) | 0.68 [0.40, 1.14] |
| 3 Exit‐site/tunnel infection (number of patients with one or more episodes) Show forest plot | 3 | Risk Ratio (M‐H, Random, 95% CI) | Subtotals only | |
| 3.1 Any systemic antibiotic versus placebo/no treatment | 3 | 191 | Risk Ratio (M‐H, Random, 95% CI) | 0.45 [0.19, 1.04] |
| 4 Exit‐site/tunnel infection rate (episodes/total patient‐months on PD) Show forest plot | 2 | Risk Ratio (M‐H, Random, 95% CI) | Subtotals only | |
| 4.1 Any systemic antibiotic versus placebo/no treatment | 2 | 939 | Risk Ratio (M‐H, Random, 95% CI) | 0.42 [0.17, 1.05] |
| 5 Catheter removal or replacement (number of patients) Show forest plot | 5 | Risk Ratio (M‐H, Random, 95% CI) | Subtotals only | |
| 5.1 Any systemic antibiotic versus placebo/no treatment | 5 | 395 | Risk Ratio (M‐H, Random, 95% CI) | 0.82 [0.46, 1.46] |
| 6 Mortality (all‐cause) Show forest plot | 4 | Risk Ratio (M‐H, Random, 95% CI) | Subtotals only | |
| 6.1 Any systemic antibiotic versus placebo/no treatment | 4 | 201 | Risk Ratio (M‐H, Random, 95% CI) | 0.88 [0.41, 1.89] |
| 7 Mortality due to peritonitis Show forest plot | 1 | Risk Ratio (M‐H, Random, 95% CI) | Totals not selected | |
| 7.1 Oral antibiotic versus placebo | 1 | Risk Ratio (M‐H, Random, 95% CI) | 0.0 [0.0, 0.0] | |
| 8 Adverse effects Show forest plot | 2 | Risk Ratio (M‐H, Random, 95% CI) | Totals not selected | |
| 8.1 Diarrhoea | 1 | Risk Ratio (M‐H, Random, 95% CI) | 0.0 [0.0, 0.0] | |
| 8.2 Nausea | 1 | Risk Ratio (M‐H, Random, 95% CI) | 0.0 [0.0, 0.0] | |
| 8.3 Pruritus (generalised) | 1 | Risk Ratio (M‐H, Random, 95% CI) | 0.0 [0.0, 0.0] | |
| 8.4 Nasal irritation | 1 | Risk Ratio (M‐H, Random, 95% CI) | 0.0 [0.0, 0.0] | |
| 8.5 Allergy | 1 | Risk Ratio (M‐H, Random, 95% CI) | 0.0 [0.0, 0.0] | |
| Outcome or subgroup title | No. of studies | No. of participants | Statistical method | Effect size |
| 1 Peritonitis (number of patients with one or more episodes) Show forest plot | 4 | 314 | Risk Ratio (M‐H, Random, 95% CI) | 1.28 [0.89, 1.84] |
| 1.1 Sodium fusidate ointment versus ofloxacin (oral) | 1 | 18 | Risk Ratio (M‐H, Random, 95% CI) | 0.25 [0.03, 1.82] |
| 1.2 Mupirocin ointment versus rifampin (oral) | 1 | 82 | Risk Ratio (M‐H, Random, 95% CI) | 1.25 [0.67, 2.33] |
| 1.3 Mupirocin ointment/cream versus gentamicin cream (topical) | 2 | 214 | Risk Ratio (M‐H, Random, 95% CI) | 1.39 [0.93, 2.07] |
| 2 Peritonitis rate (episodes/total patient‐months on PD) Show forest plot | 5 | Risk Ratio (M‐H, Random, 95% CI) | Totals not selected | |
| 2.1 Mupirocin ointment versus polysporin triple ointment (exit site) | 1 | Risk Ratio (M‐H, Random, 95% CI) | 0.0 [0.0, 0.0] | |
| 2.2 Sodium fusidate ointment versus ofloxacin (oral) | 1 | Risk Ratio (M‐H, Random, 95% CI) | 0.0 [0.0, 0.0] | |
| 2.3 Mupirocin ointment versus neomycin sulphate ointment (nasal) | 1 | Risk Ratio (M‐H, Random, 95% CI) | 0.0 [0.0, 0.0] | |
| 2.4 Mupirocin ointment versus rifampin (oral) | 1 | Risk Ratio (M‐H, Random, 95% CI) | 0.0 [0.0, 0.0] | |
| 2.5 Mupirocin ointment versus gentamicin cream (exit site) | 1 | Risk Ratio (M‐H, Random, 95% CI) | 0.0 [0.0, 0.0] | |
| 3 Exit‐site/tunnel infection (number of patients with one or more episodes) Show forest plot | 4 | 336 | Risk Ratio (M‐H, Random, 95% CI) | 1.28 [0.71, 2.31] |
| 3.1 Mupirocin ointment versus sodium fusidate ointment (topical) | 1 | 100 | Risk Ratio (M‐H, Random, 95% CI) | 0.91 [0.42, 1.95] |
| 3.2 Sodium fusidate ointment versus ofloxacin (oral) | 1 | 22 | Risk Ratio (M‐H, Random, 95% CI) | 2.41 [0.76, 7.62] |
| 3.3 Mupirocin ointment/cream versus gentamicin cream (topical) | 2 | 214 | Risk Ratio (M‐H, Random, 95% CI) | 1.19 [0.41, 3.46] |
| 4 Exit‐site/tunnel infection rate (episodes/total patient‐months on PD) Show forest plot | 3 | Risk Ratio (M‐H, Random, 95% CI) | Totals not selected | |
| 4.1 Mupirocin ointment versus polysporin triple ointment (exit site) | 1 | Risk Ratio (M‐H, Random, 95% CI) | 0.0 [0.0, 0.0] | |
| 4.2 Mupirocin ointment versus gentamicin cream (exit site) | 1 | Risk Ratio (M‐H, Random, 95% CI) | 0.0 [0.0, 0.0] | |
| 4.3 Sodium fusidate ointment versus ofloxacin (oral) | 1 | Risk Ratio (M‐H, Random, 95% CI) | 0.0 [0.0, 0.0] | |
| 5 Catheter removal or replacement (number of patients) Show forest plot | 4 | Risk Ratio (M‐H, Random, 95% CI) | Totals not selected | |
| 5.1 Mupirocin ointment versus polysporin triple ointment (exit site) | 1 | Risk Ratio (M‐H, Random, 95% CI) | 0.0 [0.0, 0.0] | |
| 5.2 Sodium fusidate ointment versus ofloxacin (oral) | 1 | Risk Ratio (M‐H, Random, 95% CI) | 0.0 [0.0, 0.0] | |
| 5.3 Mupirocin ointment (exit site) versus rifampin (oral) | 1 | Risk Ratio (M‐H, Random, 95% CI) | 0.0 [0.0, 0.0] | |
| 5.4 Mupirocin cream versus gentamicin cream (exit site) | 1 | Risk Ratio (M‐H, Random, 95% CI) | 0.0 [0.0, 0.0] | |
| 6 Mortality (all‐cause) Show forest plot | 4 | Risk Ratio (M‐H, Random, 95% CI) | Totals not selected | |
| 6.1 Mupirocin ointment versus polysporin triple ointment (exit site) | 1 | Risk Ratio (M‐H, Random, 95% CI) | 0.0 [0.0, 0.0] | |
| 6.2 Sodium fusidate ointment versus ofloxacin (oral) | 1 | Risk Ratio (M‐H, Random, 95% CI) | 0.0 [0.0, 0.0] | |
| 6.3 Mupirocin ointment versus rifampin (oral) | 1 | Risk Ratio (M‐H, Random, 95% CI) | 0.0 [0.0, 0.0] | |
| 6.4 Mupirocin ointment versus gentamicin cream (exit site) | 1 | Risk Ratio (M‐H, Random, 95% CI) | 0.0 [0.0, 0.0] | |
| 7 Technique failure Show forest plot | 1 | Risk Ratio (M‐H, Random, 95% CI) | Totals not selected | |
| 7.1 Mupirocin ointment versus polysporin triple ointment (exit site) | 1 | Risk Ratio (M‐H, Random, 95% CI) | 0.0 [0.0, 0.0] | |
| 8 Adverse effects Show forest plot | 3 | Risk Ratio (M‐H, Random, 95% CI) | Subtotals only | |
| 8.1 Nausea | 1 | 82 | Risk Ratio (M‐H, Random, 95% CI) | 0.09 [0.01, 1.59] |
| 8.2 Pruritus (local) | 2 | 337 | Risk Ratio (M‐H, Random, 95% CI) | 0.65 [0.29, 1.49] |
| Outcome or subgroup title | No. of studies | No. of participants | Statistical method | Effect size |
| 1 Peritonitis (number of patients with one or more episodes) Show forest plot | 3 | 338 | Risk Ratio (M‐H, Random, 95% CI) | 0.94 [0.67, 1.31] |
| 2 Peritonitis rate (episodes/total patient‐months on PD) Show forest plot | 2 | 2797 | Risk Ratio (M‐H, Random, 95% CI) | 0.67 [0.16, 2.77] |
| 3 Exit site and tunnel infection (number of patients with one or more episodes) Show forest plot | 3 | 338 | Risk Ratio (M‐H, Random, 95% CI) | 1.34 [0.62, 2.87] |
| 4 Exit site and tunnel infection rate (episodes/total patient‐months on PD) Show forest plot | 2 | 2796 | Risk Ratio (M‐H, Random, 95% CI) | 0.91 [0.29, 2.92] |
| 5 Catheter removal or replacement (number of patients) Show forest plot | 2 | 289 | Risk Ratio (M‐H, Random, 95% CI) | 0.92 [0.48, 1.78] |
| 6 Mortality (all‐cause) Show forest plot | 3 | 338 | Risk Ratio (M‐H, Random, 95% CI) | 0.89 [0.53, 1.47] |
| 7 Adverse effects Show forest plot | 2 | Risk Ratio (M‐H, Random, 95% CI) | Subtotals only | |
| 7.1 Headache | 1 | 267 | Risk Ratio (M‐H, Random, 95% CI) | 0.99 [0.14, 6.94] |
| 7.2 Diarrhoea | 1 | 267 | Risk Ratio (M‐H, Random, 95% CI) | 1.65 [0.40, 6.78] |
| 7.3 Nausea | 1 | 267 | Risk Ratio (M‐H, Random, 95% CI) | 0.99 [0.14, 6.94] |
| 7.4 Vomiting | 1 | 267 | Risk Ratio (M‐H, Random, 95% CI) | 2.98 [0.61, 14.49] |
| 7.5 Pruritus | 1 | 267 | Risk Ratio (M‐H, Random, 95% CI) | 1.49 [0.25, 8.77] |
| 7.6 Nasal irritation/rhinitis | 2 | 289 | Risk Ratio (M‐H, Random, 95% CI) | 0.93 [0.30, 2.94] |
| Outcome or subgroup title | No. of studies | No. of participants | Statistical method | Effect size |
| 1 Peritonitis (number of patients with one or more episodes) Show forest plot | 4 | Risk Ratio (M‐H, Random, 95% CI) | Totals not selected | |
| 1.1 Vancomycin versus placebo | 1 | Risk Ratio (M‐H, Random, 95% CI) | 0.0 [0.0, 0.0] | |
| 1.2 Cefazolin versus placebo | 1 | Risk Ratio (M‐H, Random, 95% CI) | 0.0 [0.0, 0.0] | |
| 1.3 IV gentamicin versus no antibiotics | 1 | Risk Ratio (M‐H, Random, 95% CI) | 0.0 [0.0, 0.0] | |
| 1.4 IV cefazolin + gentamicin versus no antibiotics | 1 | Risk Ratio (M‐H, Random, 95% CI) | 0.0 [0.0, 0.0] | |
| 1.5 IV cefuroxime + cefuroxime (intraperitoneal) versus no antibiotics | 1 | Risk Ratio (M‐H, Random, 95% CI) | 0.0 [0.0, 0.0] | |
| 1.6 Vancomycin versus cefazolin | 1 | Risk Ratio (M‐H, Random, 95% CI) | 0.0 [0.0, 0.0] | |
| 2 Exit site/tunnel infection (number of patients with one or more episodes) Show forest plot | 4 | Risk Ratio (M‐H, Random, 95% CI) | Totals not selected | |
| 2.1 Vancomycin versus placebo | 1 | Risk Ratio (M‐H, Random, 95% CI) | 0.0 [0.0, 0.0] | |
| 2.2 Cefazolin versus placebo | 1 | Risk Ratio (M‐H, Random, 95% CI) | 0.0 [0.0, 0.0] | |
| 2.3 IV gentamicin versus no antibiotics | 1 | Risk Ratio (M‐H, Random, 95% CI) | 0.0 [0.0, 0.0] | |
| 2.4 IV cefazolin + gentamicin versus no antibiotics | 1 | Risk Ratio (M‐H, Random, 95% CI) | 0.0 [0.0, 0.0] | |
| 2.5 IV cefuroxime + cefuroxime (intraperitoneal) versus no antibiotics | 1 | Risk Ratio (M‐H, Random, 95% CI) | 0.0 [0.0, 0.0] | |
| 2.6 Vancomycin versus cefazolin | 1 | Risk Ratio (M‐H, Random, 95% CI) | 0.0 [0.0, 0.0] | |
| 3 Catheter removal or replacement (number of patients) Show forest plot | 1 | Risk Ratio (M‐H, Random, 95% CI) | Totals not selected | |
| 4 Mortality (all‐cause) Show forest plot | 1 | Risk Ratio (M‐H, Random, 95% CI) | Totals not selected | |
| Outcome or subgroup title | No. of studies | No. of participants | Statistical method | Effect size |
| 1 Peritonitis (number of patients with one or more episodes) Show forest plot | 6 | 853 | Risk Ratio (M‐H, Random, 95% CI) | 0.83 [0.65, 1.06] |
| 1.1 Disinfectant versus standard care | 3 | 393 | Risk Ratio (M‐H, Random, 95% CI) | 0.81 [0.52, 1.26] |
| 1.2 Disinfectant versus other active treatment (antibiotics, other disinfectant) | 3 | 460 | Risk Ratio (M‐H, Random, 95% CI) | 0.84 [0.62, 1.13] |
| 2 Exit site/tunnel infection (number of patients with one or more episodes) Show forest plot | 8 | 973 | Risk Ratio (M‐H, Random, 95% CI) | 1.00 [0.75, 1.33] |
| 2.1 Disinfectant versus standard care | 4 | 453 | Risk Ratio (M‐H, Random, 95% CI) | 0.74 [0.45, 1.20] |
| 2.2 Disinfectant versus other active treatment (antibiotics, other disinfectant) | 4 | 520 | Risk Ratio (M‐H, Random, 95% CI) | 1.19 [0.89, 1.60] |
| 3 Exit site/tunnel infection rate (episodes/total patient‐months on PD) Show forest plot | 2 | Risk Ratio (M‐H, Random, 95% CI) | Subtotals only | |
| 3.1 Disinfectant versus other active treatment (antibiotics, other disinfectant) | 2 | 1752 | Risk Ratio (M‐H, Random, 95% CI) | 1.25 [0.31, 4.93] |
| 4 Catheter removal or replacement (number of patients) Show forest plot | 7 | 852 | Risk Ratio (M‐H, Random, 95% CI) | 0.89 [0.57, 1.38] |
| 4.1 Disinfectant versus standard care | 2 | 266 | Risk Ratio (M‐H, Random, 95% CI) | 0.73 [0.34, 1.55] |
| 4.2 Disinfectant versus other active treatment (antibiotics, other disinfectant) | 5 | 586 | Risk Ratio (M‐H, Random, 95% CI) | 0.98 [0.57, 1.69] |
| 5 Mortality (all‐cause) Show forest plot | 4 | 697 | Risk Ratio (M‐H, Random, 95% CI) | 0.88 [0.53, 1.44] |
| 5.1 Disinfectant versus standard care | 2 | 266 | Risk Ratio (M‐H, Random, 95% CI) | 1.24 [0.54, 2.84] |
| 5.2 Disinfectant versus other active treatment (antibiotics, other disinfectant) | 2 | 431 | Risk Ratio (M‐H, Random, 95% CI) | 0.73 [0.39, 1.35] |
| 6 Technique failure Show forest plot | 1 | Risk Ratio (M‐H, Random, 95% CI) | Totals not selected | |
| 7 Pruritus (local) Show forest plot | 4 | 609 | Risk Ratio (M‐H, Random, 95% CI) | 2.80 [1.21, 6.48] |
| Outcome or subgroup title | No. of studies | No. of participants | Statistical method | Effect size |
| 1 Peritonitis rate (episodes/total patient‐months on PD) Show forest plot | 2 | 1855 | Risk Ratio (M‐H, Random, 95% CI) | 1.05 [0.74, 1.51] |
| 2 Mortality (all‐cause) Show forest plot | 1 | Risk Ratio (M‐H, Random, 95% CI) | Totals not selected | |
| Outcome or subgroup title | No. of studies | No. of participants | Statistical method | Effect size |
| 1 Exit site/tunnel infection (number of patients with one or more episodes) Show forest plot | 3 | Risk Ratio (M‐H, Random, 95% CI) | Totals not selected | |
| 1.1 Chlorhexidine gluconate + water versus povidone‐iodine solution | 1 | Risk Ratio (M‐H, Random, 95% CI) | 0.0 [0.0, 0.0] | |
| 1.2 Sodium hypochlorite solution versus povidone‐iodine solution | 1 | Risk Ratio (M‐H, Random, 95% CI) | 0.0 [0.0, 0.0] | |
| 1.3 Shower + gauze versus dressing pack + fixomull | 1 | Risk Ratio (M‐H, Random, 95% CI) | 0.0 [0.0, 0.0] | |
| 1.4 Blisterfilm versus gauze | 1 | Risk Ratio (M‐H, Random, 95% CI) | 0.0 [0.0, 0.0] | |
| 2 Exit site/tunnel infection rate (episodes/total patient‐months on PD) Show forest plot | 1 | Risk Ratio (M‐H, Random, 95% CI) | Totals not selected | |
| 2.1 Shower + gauze versus dressing pack + fixomull | 1 | Risk Ratio (M‐H, Random, 95% CI) | 0.0 [0.0, 0.0] | |
| Outcome or subgroup title | No. of studies | No. of participants | Statistical method | Effect size |
| 1 Peritonitis (number of patients with one or more episodes) Show forest plot | 1 | Risk Ratio (M‐H, Random, 95% CI) | Totals not selected | |
| 2 Exit site/tunnel infection (number of patients with one or more episodes) Show forest plot | 1 | Risk Ratio (M‐H, Random, 95% CI) | Totals not selected | |
| 3 Catheter removal or replacement (number of patients) Show forest plot | 1 | Risk Ratio (M‐H, Random, 95% CI) | Totals not selected | |
| 4 Mortality (all‐cause) Show forest plot | 1 | Risk Ratio (M‐H, Random, 95% CI) | Totals not selected | |
| Outcome or subgroup title | No. of studies | No. of participants | Statistical method | Effect size |
| 1 Peritonitis rate (episodes/total patient‐months on PD) Show forest plot | 1 | Risk Ratio (M‐H, Random, 95% CI) | Totals not selected | |
| 2 Exit site/tunnel infection rate (episodes/total patient‐months on PD) Show forest plot | 1 | Risk Ratio (M‐H, Random, 95% CI) | Totals not selected | |
| Outcome or subgroup title | No. of studies | No. of participants | Statistical method | Effect size |
| 1 Fungal peritonitis (number of patients with one or more episodes) Show forest plot | 2 | 817 | Risk Ratio (M‐H, Random, 95% CI) | 0.28 [0.12, 0.63] |
| 2 Fungal peritonitis rate (episodes/total patient‐months on PD) Show forest plot | 1 | Risk Ratio (M‐H, Random, 95% CI) | Totals not selected | |