Corticosteroids for acute bacterial meningitis
Information
- DOI:
- https://doi.org/10.1002/14651858.CD004405.pub5Copy DOI

- Database:
-
- Cochrane Database of Systematic Reviews
- Version published:
-
- 12 September 2015see what's new
- Type:
-
- Intervention
- Stage:
-
- Review
- Cochrane Editorial Group:
-
Cochrane Acute Respiratory Infections Group
- Copyright:
-
- Copyright © 2018 The Cochrane Collaboration. Published by John Wiley & Sons, Ltd.
Article metrics
Altmetric:
Cited by:
Authors
Contributions of authors
Matthijs Brouwer (MB) was responsible for co‐designing and writing the review, selecting studies, extracting and analysing data.
Peter McIntyre (PM) was responsible for co‐writing the protocol, co‐writing the review and extracting data.
Kameshwar Prasad (KP) was responsible for co‐designing and co‐writing the review.
Diederik van de Beek (DvdB) was responsible for co‐designing and writing the review, selecting studies, extracting and analysing data.
Sources of support
Internal sources
-
Academic Medical Center, Netherlands.
AMC Fellowship 2008 (D. van de Beek)
External sources
-
Netherlands Organization for Health Research and Development, Netherlands.
NWO Veni grant 2012 (916.13.078) to M.C. Brouwer; NWO Veni grant 2006 (916.76.023), NWO Vidi grant (016.116.358) to D. van de Beek
-
European Research Council, Other.
ERC Starting Grant to D. van de Beek
Declarations of interest
Matthijs C Brouwer: none known.
Peter McIntyre: none known.
Kameshwar Prasad: none known.
Diederik van de Beek is a primary author of one of the included trials (de Gans 2002). Matthijs C Brouwer independently extracted data and assessed quality.
Acknowledgements
Diederik van de Beek is supported by grants from the Netherlands Organization for Health Research and Development (ZonMw; NWO Veni grant 2006 (916.76.023); NWO Vidi grant 2010 (016.116.358)), the Academic Medical Center (AMC Fellowship 2008) and European Research Council (ERC Starting Grant (281156)). Matthijs Brouwer is supported by a grant from the Netherlands Organization for Health Research and Development (ZonMw; NWO Veni grant 2012 (916.13.078)).
We wish to thank the following people for commenting on the 2010 updated review: Amy Zelmer, Andrew Herxheimer, Mark Coulthard, Mark Jones and Inge Axelsson. We also thank the following people for commenting on this 2013 updated review: Marilyn Bamford, Ram Yogev, Elaind Beller and Inge Axelsson.
Version history
| Published | Title | Stage | Authors | Version |
| 2015 Sep 12 | Corticosteroids for acute bacterial meningitis | Review | Matthijs C Brouwer, Peter McIntyre, Kameshwar Prasad, Diederik van de Beek | |
| 2013 Jun 04 | Corticosteroids for acute bacterial meningitis | Review | Matthijs C Brouwer, Peter McIntyre, Kameshwar Prasad, Diederik van de Beek | |
| 2010 Sep 08 | Corticosteroids for acute bacterial meningitis | Review | Matthijs C Brouwer, Peter McIntyre, Jan de Gans, Kameshwar Prasad, Diederik van de Beek | |
| 2007 Jan 24 | Corticosteroids for acute bacterial meningitis | Review | Diederik van de Beek, Jan de Gans, Peter McIntyre, Kameshwar Prasad | |
| 2003 Jul 21 | Corticosteroids for acute bacterial meningitis | Review | Diederik van de Beek, Jan de Gans, Peter McIntyre, Kameshwar Prasad | |
Differences between protocol and review
None.
Keywords
MeSH
Medical Subject Headings (MeSH) Keywords
- Acute Disease;
- Anti‐Inflammatory Agents [adverse effects, therapeutic use];
- Developed Countries;
- Developing Countries;
- Dexamethasone [therapeutic use];
- Glucocorticoids [adverse effects, *therapeutic use];
- Hearing Loss [etiology, prevention & control];
- Hydrocortisone [therapeutic use];
- Meningitis, Bacterial [complications, *drug therapy, mortality];
- Prednisolone [therapeutic use];
- Randomized Controlled Trials as Topic;
Medical Subject Headings Check Words
Adolescent; Adult; Child; Humans;
PICOs
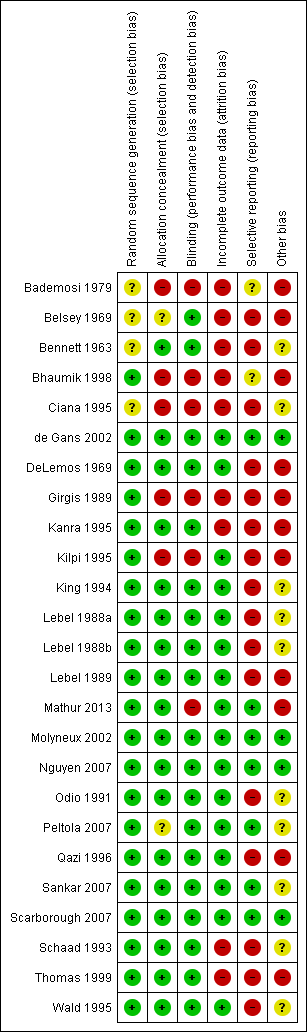
'Risk of bias' summary: review authors' judgements about each methodological quality item for each included study.

'Risk of bias' graph: review authors' judgements about each methodological quality item presented as percentages across all included studies.
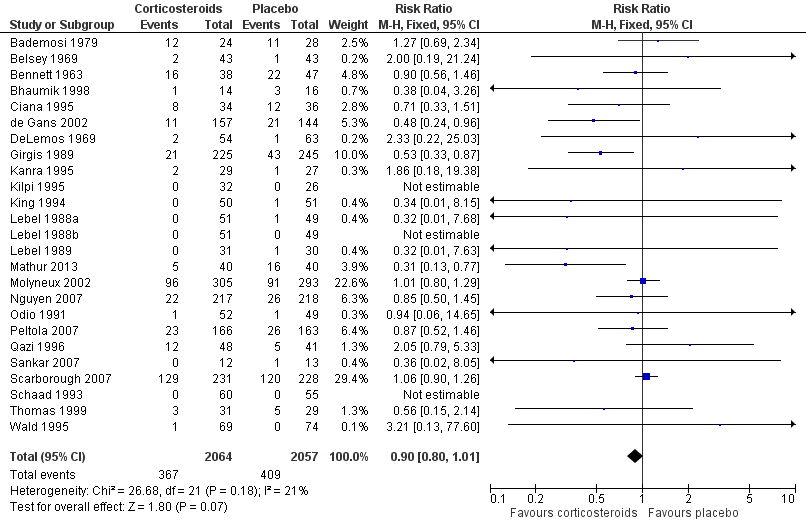
Forest plot of comparison: 1 All patients, outcome: 1.1 Mortality.
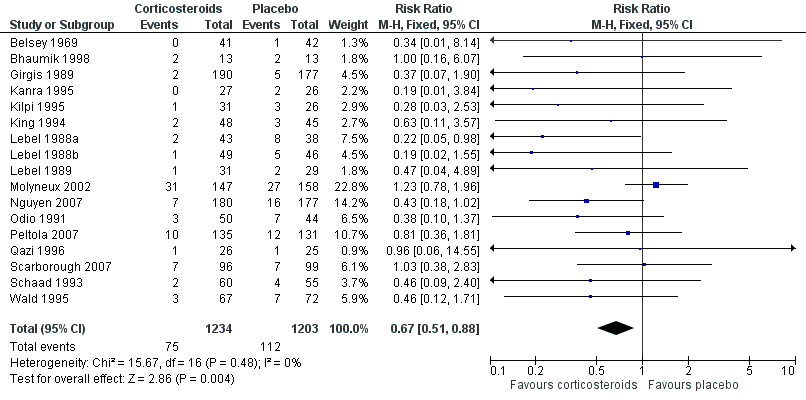
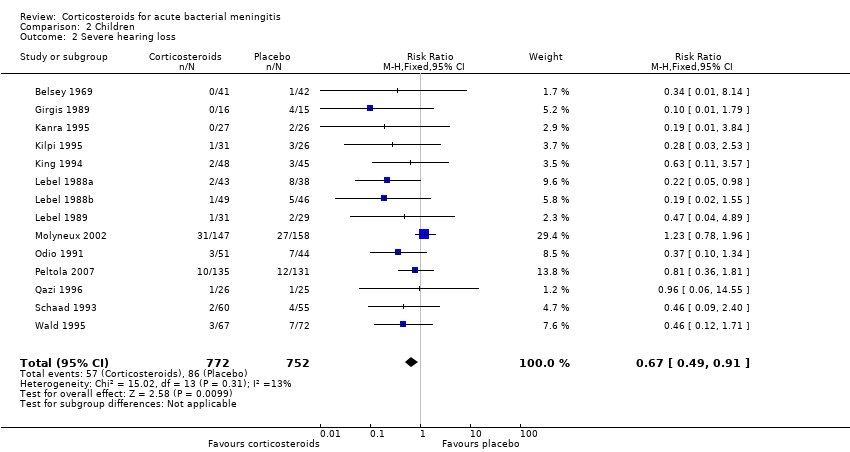
Forest plot of comparison: 1 All patients, outcome: 1.2 Severe hearing loss.
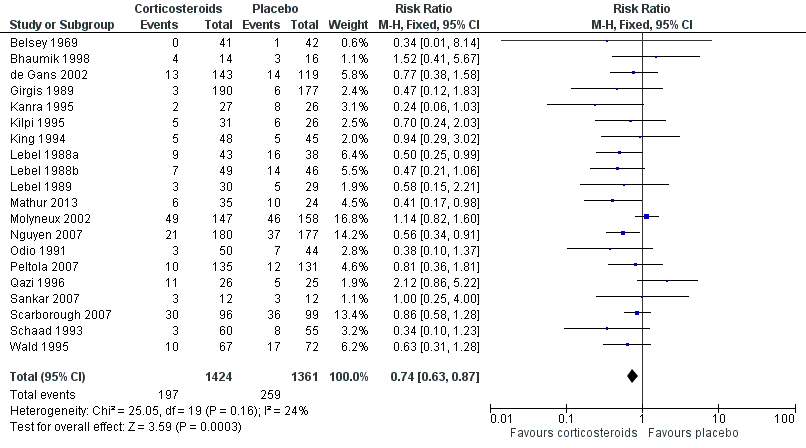
Forest plot of comparison: 1 All patients, outcome: 1.3 Any hearing loss.
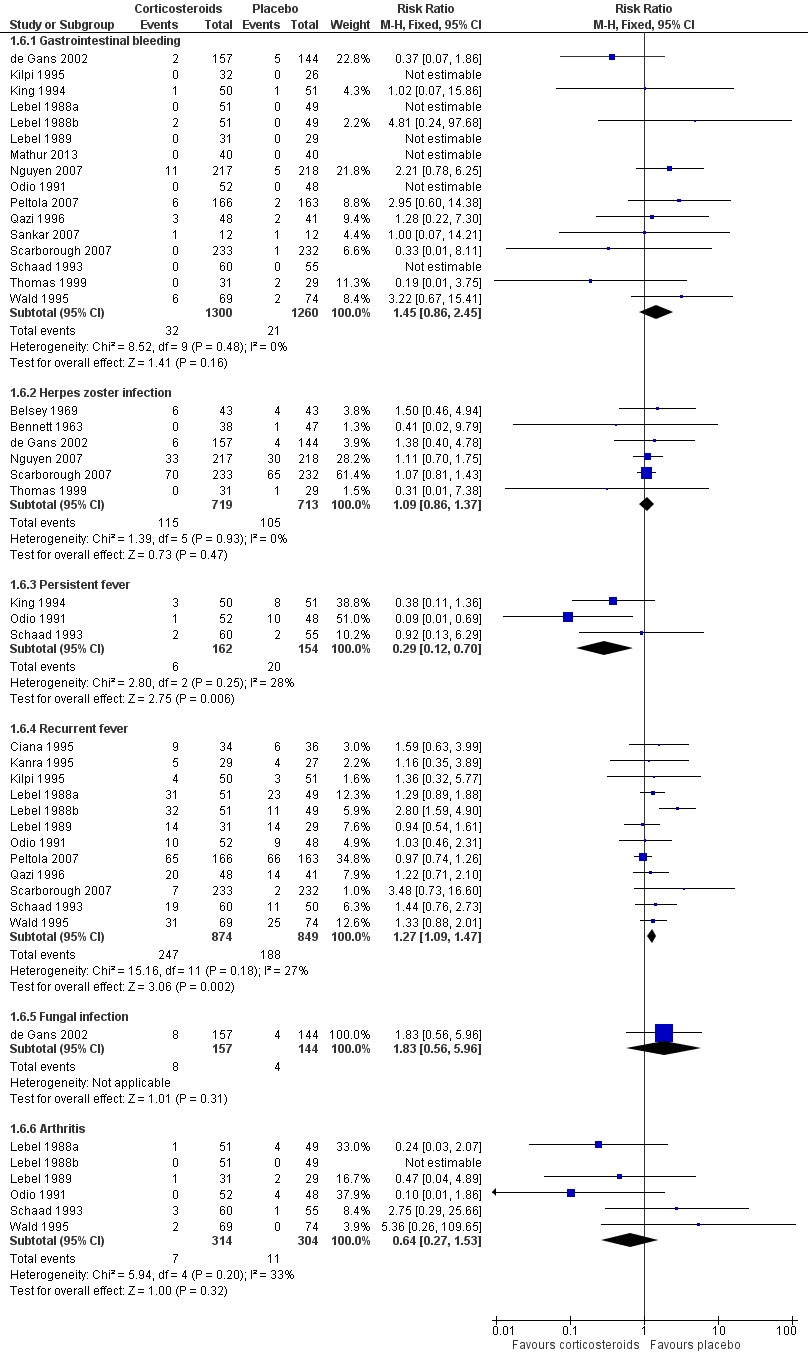
Forest plot of comparison: 1 All patients, outcome: 1.6 Adverse events.

Comparison 1 All patients, Outcome 1 Mortality.

Comparison 1 All patients, Outcome 2 Severe hearing loss.

Comparison 1 All patients, Outcome 3 Any hearing loss.

Comparison 1 All patients, Outcome 4 Short‐term neurological sequelae.
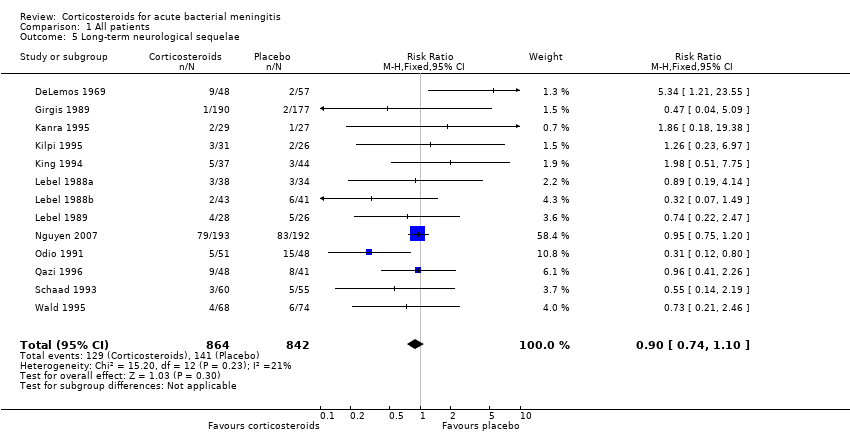
Comparison 1 All patients, Outcome 5 Long‐term neurological sequelae.
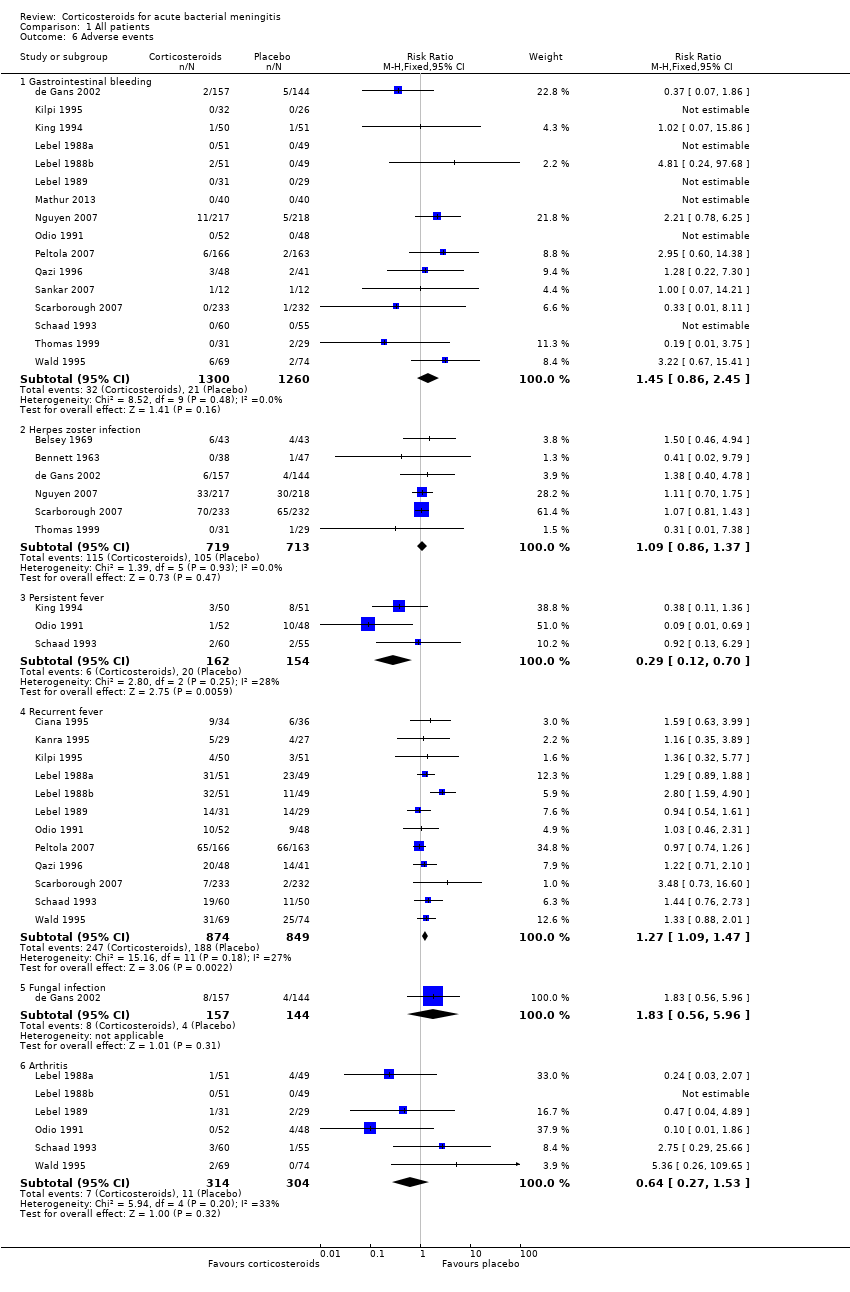
Comparison 1 All patients, Outcome 6 Adverse events.

Comparison 2 Children, Outcome 1 Mortality.
Comparison 2 Children, Outcome 2 Severe hearing loss.
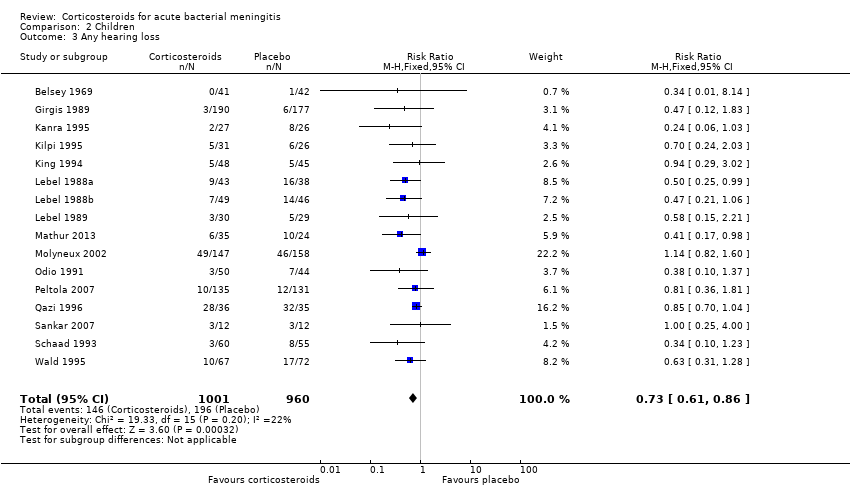
Comparison 2 Children, Outcome 3 Any hearing loss.

Comparison 3 Adults, Outcome 1 Mortality.
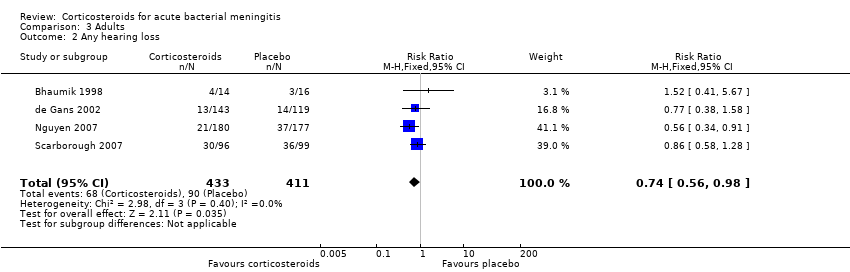
Comparison 3 Adults, Outcome 2 Any hearing loss.
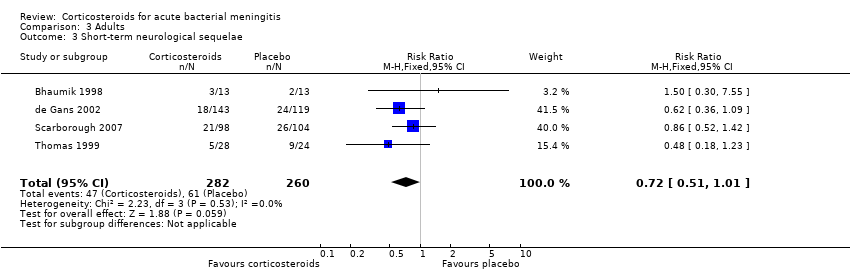
Comparison 3 Adults, Outcome 3 Short‐term neurological sequelae.
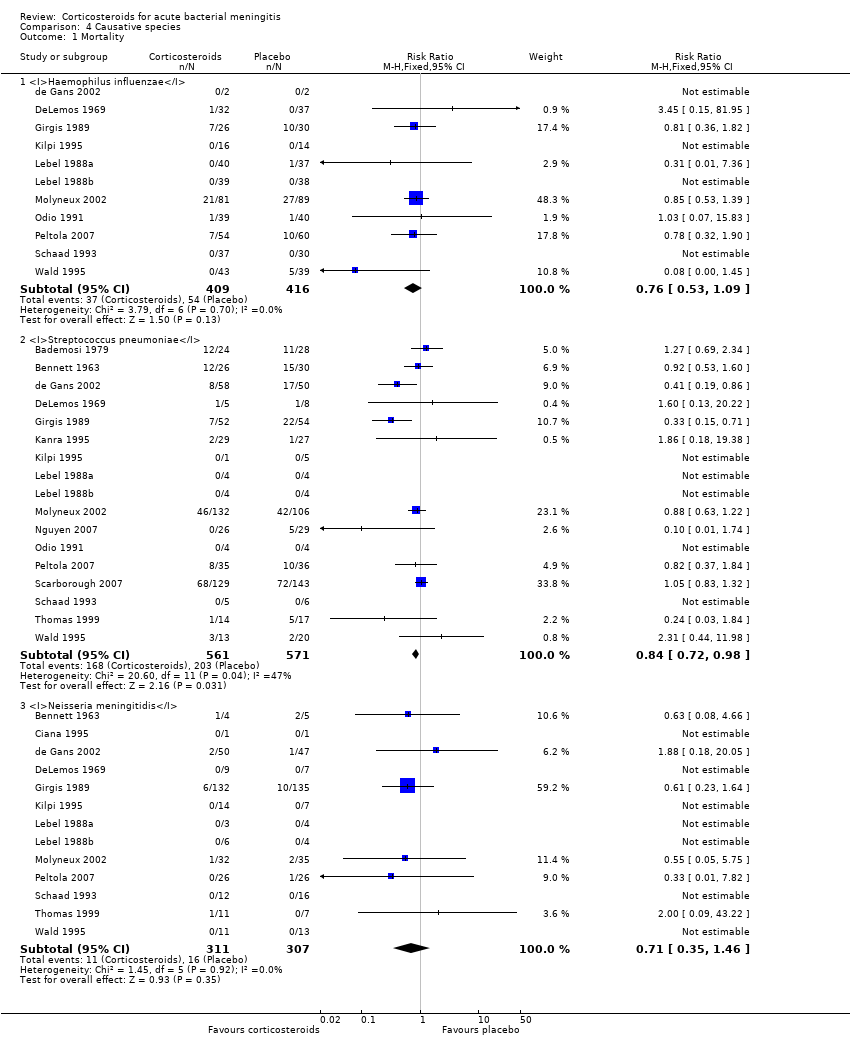
Comparison 4 Causative species, Outcome 1 Mortality.

Comparison 4 Causative species, Outcome 2 Severe hearing loss in children ‐ non‐Haemophilus influenzae species.

Comparison 4 Causative species, Outcome 3 Severe hearing loss in children ‐ Haemophilus influenzae.

Comparison 5 Income of countries, Outcome 1 Mortality ‐ all patients.

Comparison 5 Income of countries, Outcome 2 Severe hearing loss ‐ all patients.

Comparison 5 Income of countries, Outcome 3 Any hearing loss.
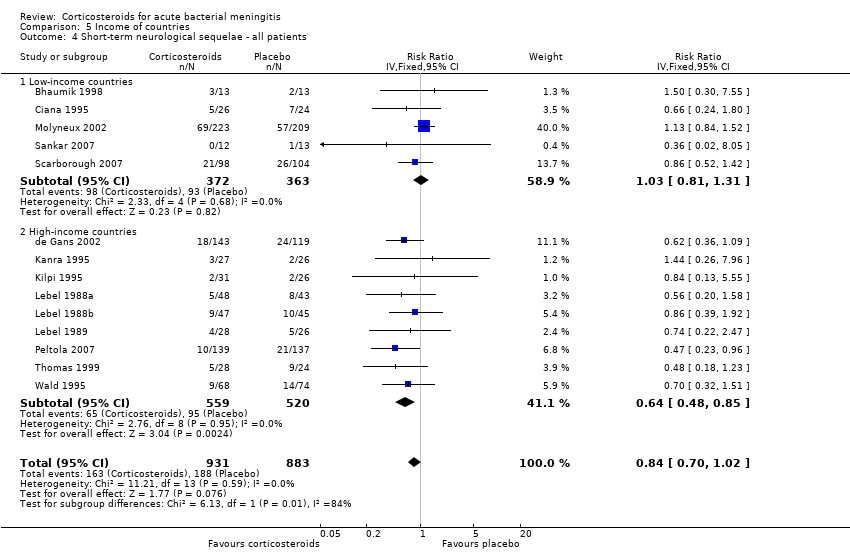
Comparison 5 Income of countries, Outcome 4 Short‐term neurological sequelae ‐ all patients.

Comparison 5 Income of countries, Outcome 5 Mortality ‐ children.
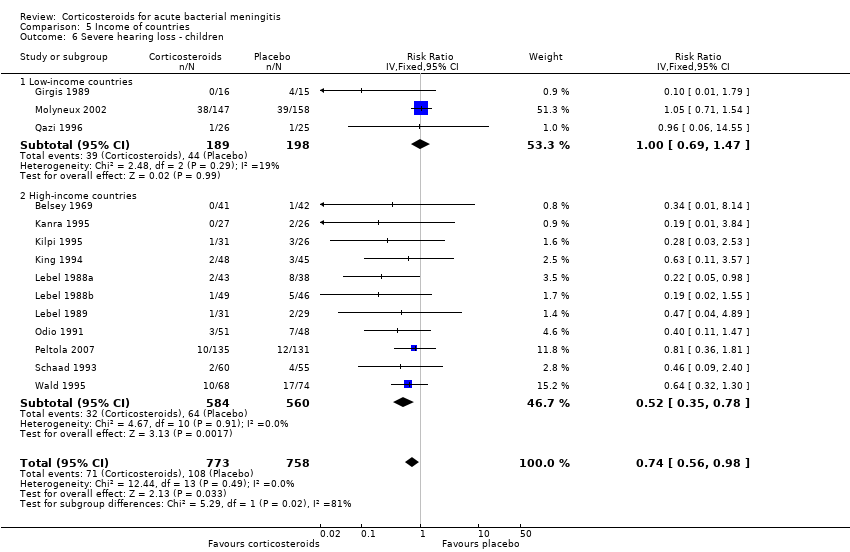
Comparison 5 Income of countries, Outcome 6 Severe hearing loss ‐ children.

Comparison 5 Income of countries, Outcome 7 Short‐term neurological sequelae ‐ children.

Comparison 5 Income of countries, Outcome 8 Severe hearing loss in children due to non‐Haemophilus influenzae species.

Comparison 5 Income of countries, Outcome 9 Mortality ‐ adults.

Comparison 5 Income of countries, Outcome 10 Any hearing loss adults.
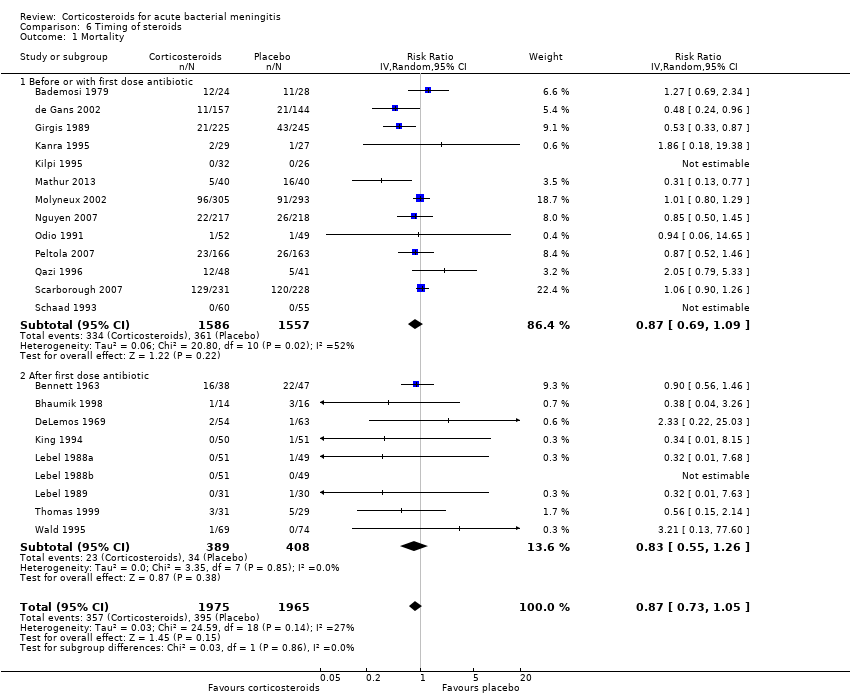
Comparison 6 Timing of steroids, Outcome 1 Mortality.

Comparison 6 Timing of steroids, Outcome 2 Severe hearing loss.
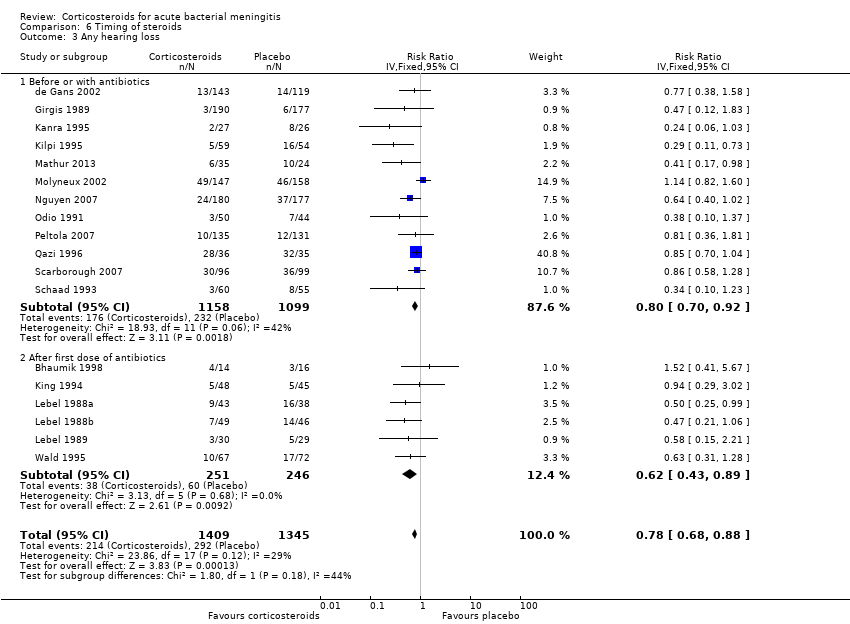
Comparison 6 Timing of steroids, Outcome 3 Any hearing loss.
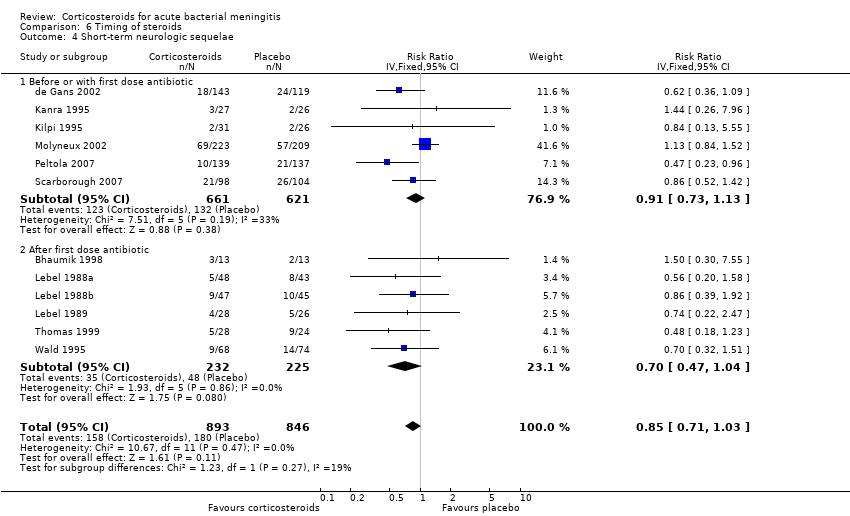
Comparison 6 Timing of steroids, Outcome 4 Short‐term neurologic sequelae.

Comparison 7 Study quality, Outcome 1 Mortality.

Comparison 7 Study quality, Outcome 2 Severe hearing loss.
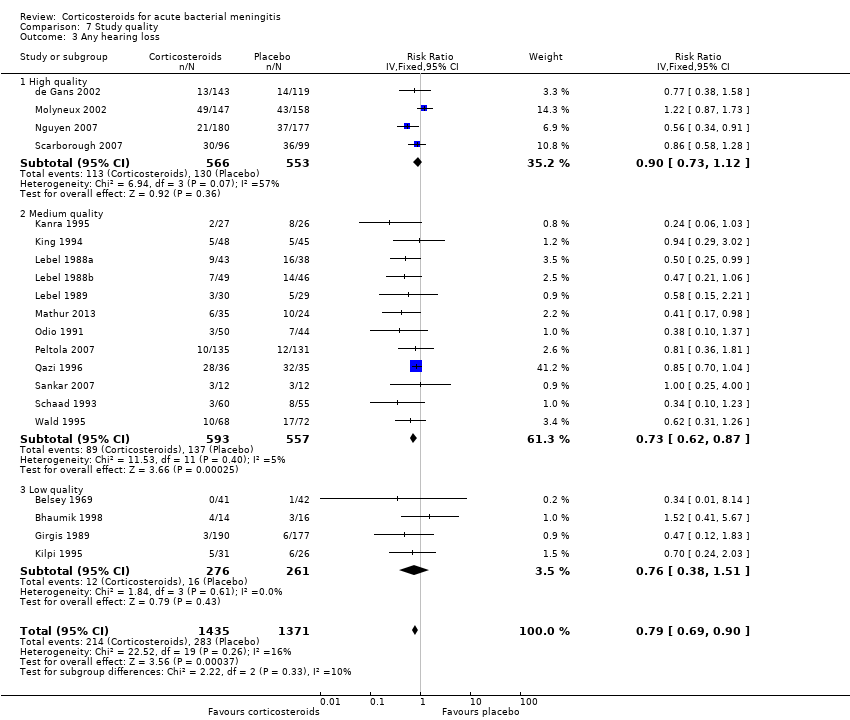
Comparison 7 Study quality, Outcome 3 Any hearing loss.

Comparison 7 Study quality, Outcome 4 Short‐term neurological sequelae.

Comparison 8 Sensitivity analysis ‐ worst‐case scenario, Outcome 1 Severe hearing loss.
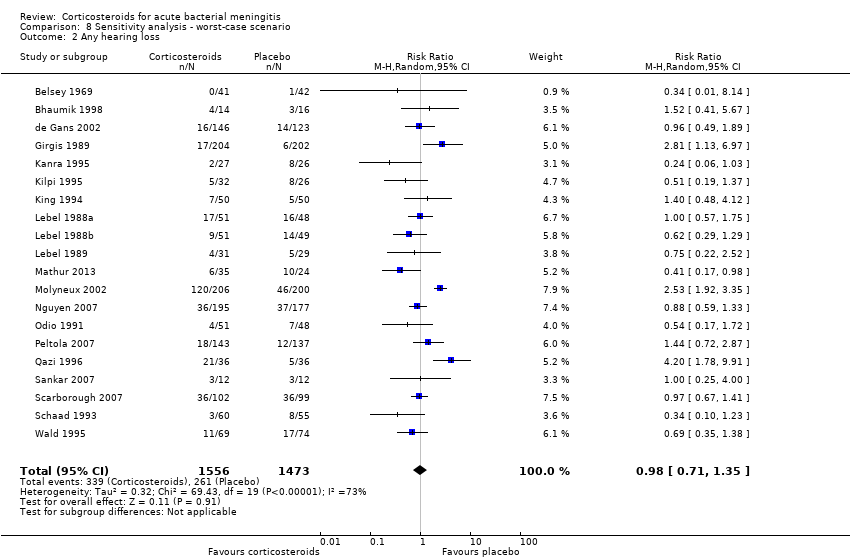
Comparison 8 Sensitivity analysis ‐ worst‐case scenario, Outcome 2 Any hearing loss.

Comparison 8 Sensitivity analysis ‐ worst‐case scenario, Outcome 3 Short‐term neurological sequelae.
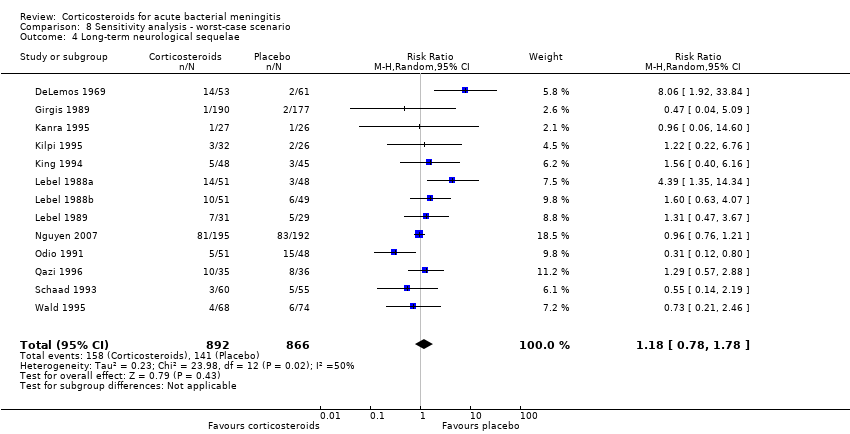
Comparison 8 Sensitivity analysis ‐ worst‐case scenario, Outcome 4 Long‐term neurological sequelae.
| Comparison of corticosteroids against placebo in patients with acute bacterial meningitis | ||||||
| Patient or population: acute bacterial meningitis | ||||||
| Outcomes | Anticipated absolute effects* (95% CI) | Relative effect | No of participants | Quality of the evidence | Comments | |
| Risk with placebo | Risk with corticosteroids | |||||
| Mortality | Study population | RR 0.90 | 4121 | ⊕⊕⊖⊖ MODERATE 1 | — | |
| 199 per 1000 | 179 per 1000 | |||||
| Moderate | ||||||
| 188 per 1000 | 169 per 1000 | |||||
| Severe hearing loss | Study population | RR 0.67 | 2437 | ⊕⊕⊕⊖ HIGH | — | |
| 93 per 1000 | 62 per 1000 | |||||
| Moderate | ||||||
| 40 per 1000 | 27 per 1000 | |||||
| Any hearing loss | Study population | RR 0.74 | 2785 | ⊕⊕⊕⊖ HIGH | — | |
| 190 per 1000 | 141 per 1000 | |||||
| Moderate | ||||||
| 233 per 1000 | 173 per 1000 | |||||
| Short‐term neurological sequelae | Study population | RR 0.83 | 1756 | ⊕⊕⊕⊖ HIGH | — | |
| 216 per 1000 | 179 per 1000 | |||||
| Moderate | ||||||
| 222 per 1000 | 184 per 1000 | |||||
| Adverse events ‐ recurrent fever | Study population | RR 1.27 | 1723 | ⊕⊕⊖⊖ | — | |
| 221 per 1000 | 281 per 1000 | |||||
| Moderate | ||||||
| 281 per 1000 | 357 per 1000 | |||||
| *The risk in the intervention group (and its 95% confidence interval) is based on the assumed risk in the comparison group and the relative effect of the intervention (and its 95% CI). | ||||||
| GRADE Working Group grades of evidence | ||||||
| 1Variable mortality between studies, consistent with differences across the world in meningitis prognosis. 2Different definitions used for recurrent fever makes this imprecise. | ||||||
| Outcome or subgroup title | No. of studies | No. of participants | Statistical method | Effect size |
| 1 Mortality Show forest plot | 25 | 4121 | Risk Ratio (M‐H, Fixed, 95% CI) | 0.90 [0.80, 1.01] |
| 2 Severe hearing loss Show forest plot | 17 | 2437 | Risk Ratio (M‐H, Fixed, 95% CI) | 0.67 [0.51, 0.88] |
| 3 Any hearing loss Show forest plot | 20 | 2785 | Risk Ratio (M‐H, Fixed, 95% CI) | 0.74 [0.63, 0.87] |
| 4 Short‐term neurological sequelae Show forest plot | 13 | 1756 | Risk Ratio (M‐H, Fixed, 95% CI) | 0.83 [0.69, 1.00] |
| 5 Long‐term neurological sequelae Show forest plot | 13 | 1706 | Risk Ratio (M‐H, Fixed, 95% CI) | 0.90 [0.74, 1.10] |
| 6 Adverse events Show forest plot | 20 | Risk Ratio (M‐H, Fixed, 95% CI) | Subtotals only | |
| 6.1 Gastrointestinal bleeding | 16 | 2560 | Risk Ratio (M‐H, Fixed, 95% CI) | 1.45 [0.86, 2.45] |
| 6.2 Herpes zoster infection | 6 | 1432 | Risk Ratio (M‐H, Fixed, 95% CI) | 1.09 [0.86, 1.37] |
| 6.3 Persistent fever | 3 | 316 | Risk Ratio (M‐H, Fixed, 95% CI) | 0.29 [0.12, 0.70] |
| 6.4 Recurrent fever | 12 | 1723 | Risk Ratio (M‐H, Fixed, 95% CI) | 1.27 [1.09, 1.47] |
| 6.5 Fungal infection | 1 | 301 | Risk Ratio (M‐H, Fixed, 95% CI) | 1.83 [0.56, 5.96] |
| 6.6 Arthritis | 6 | 618 | Risk Ratio (M‐H, Fixed, 95% CI) | 0.64 [0.27, 1.53] |
| Outcome or subgroup title | No. of studies | No. of participants | Statistical method | Effect size |
| 1 Mortality Show forest plot | 18 | 2511 | Risk Ratio (M‐H, Fixed, 95% CI) | 0.89 [0.74, 1.07] |
| 2 Severe hearing loss Show forest plot | 14 | 1524 | Risk Ratio (M‐H, Fixed, 95% CI) | 0.67 [0.49, 0.91] |
| 3 Any hearing loss Show forest plot | 16 | 1961 | Risk Ratio (M‐H, Fixed, 95% CI) | 0.73 [0.61, 0.86] |
| Outcome or subgroup title | No. of studies | No. of participants | Statistical method | Effect size |
| 1 Mortality Show forest plot | 7 | 1517 | Risk Ratio (M‐H, Random, 95% CI) | 0.74 [0.53, 1.05] |
| 2 Any hearing loss Show forest plot | 4 | 844 | Risk Ratio (M‐H, Fixed, 95% CI) | 0.74 [0.56, 0.98] |
| 3 Short‐term neurological sequelae Show forest plot | 4 | 542 | Risk Ratio (M‐H, Fixed, 95% CI) | 0.72 [0.51, 1.01] |
| Outcome or subgroup title | No. of studies | No. of participants | Statistical method | Effect size |
| 1 Mortality Show forest plot | 18 | Risk Ratio (M‐H, Fixed, 95% CI) | Subtotals only | |
| 1.1 Haemophilus influenzae | 11 | 825 | Risk Ratio (M‐H, Fixed, 95% CI) | 0.76 [0.53, 1.09] |
| 1.2 Streptococcus pneumoniae | 17 | 1132 | Risk Ratio (M‐H, Fixed, 95% CI) | 0.84 [0.72, 0.98] |
| 1.3 Neisseria meningitidis | 13 | 618 | Risk Ratio (M‐H, Fixed, 95% CI) | 0.71 [0.35, 1.46] |
| 2 Severe hearing loss in children ‐ non‐Haemophilus influenzae species Show forest plot | 13 | 860 | Risk Ratio (M‐H, Fixed, 95% CI) | 0.95 [0.65, 1.39] |
| 3 Severe hearing loss in children ‐ Haemophilus influenzae Show forest plot | 10 | 756 | Risk Ratio (M‐H, Fixed, 95% CI) | 0.34 [0.20, 0.59] |
| Outcome or subgroup title | No. of studies | No. of participants | Statistical method | Effect size |
| 1 Mortality ‐ all patients Show forest plot | 25 | 4121 | Risk Ratio (IV, Random, 95% CI) | 0.88 [0.75, 1.03] |
| 1.1 Low‐income countries | 9 | 1873 | Risk Ratio (IV, Random, 95% CI) | 0.87 [0.67, 1.15] |
| 1.2 High‐income countries | 16 | 2248 | Risk Ratio (IV, Random, 95% CI) | 0.81 [0.63, 1.05] |
| 2 Severe hearing loss ‐ all patients Show forest plot | 17 | 2445 | Risk Ratio (IV, Fixed, 95% CI) | 0.74 [0.58, 0.94] |
| 2.1 Low‐income countries | 5 | 944 | Risk Ratio (IV, Fixed, 95% CI) | 0.99 [0.72, 1.38] |
| 2.2 High‐income countries | 12 | 1501 | Risk Ratio (IV, Fixed, 95% CI) | 0.51 [0.35, 0.73] |
| 3 Any hearing loss Show forest plot | 20 | 2805 | Risk Ratio (IV, Fixed, 95% CI) | 0.79 [0.69, 0.89] |
| 3.1 Low‐income countries | 7 | 1051 | Risk Ratio (IV, Fixed, 95% CI) | 0.89 [0.76, 1.04] |
| 3.2 High‐income countries | 13 | 1754 | Risk Ratio (IV, Fixed, 95% CI) | 0.58 [0.45, 0.73] |
| 4 Short‐term neurological sequelae ‐ all patients Show forest plot | 14 | 1814 | Risk Ratio (IV, Fixed, 95% CI) | 0.84 [0.70, 1.02] |
| 4.1 Low‐income countries | 5 | 735 | Risk Ratio (IV, Fixed, 95% CI) | 1.03 [0.81, 1.31] |
| 4.2 High‐income countries | 9 | 1079 | Risk Ratio (IV, Fixed, 95% CI) | 0.64 [0.48, 0.85] |
| 5 Mortality ‐ children Show forest plot | 17 | 2486 | Risk Ratio (IV, Fixed, 95% CI) | 0.92 [0.77, 1.11] |
| 5.1 Low‐income countries | 5 | 1119 | Risk Ratio (IV, Fixed, 95% CI) | 0.91 [0.75, 1.12] |
| 5.2 High‐income countries | 12 | 1367 | Risk Ratio (IV, Fixed, 95% CI) | 0.96 [0.61, 1.50] |
| 6 Severe hearing loss ‐ children Show forest plot | 14 | 1531 | Risk Ratio (IV, Fixed, 95% CI) | 0.74 [0.56, 0.98] |
| 6.1 Low‐income countries | 3 | 387 | Risk Ratio (IV, Fixed, 95% CI) | 1.00 [0.69, 1.47] |
| 6.2 High‐income countries | 11 | 1144 | Risk Ratio (IV, Fixed, 95% CI) | 0.52 [0.35, 0.78] |
| 7 Short‐term neurological sequelae ‐ children Show forest plot | 10 | 1271 | Risk Ratio (IV, Fixed, 95% CI) | 0.90 [0.72, 1.13] |
| 7.1 Low‐income countries | 3 | 506 | Risk Ratio (IV, Fixed, 95% CI) | 1.08 [0.81, 1.43] |
| 7.2 High‐income countries | 7 | 765 | Risk Ratio (IV, Fixed, 95% CI) | 0.67 [0.46, 0.97] |
| 8 Severe hearing loss in children due to non‐Haemophilus influenzae species Show forest plot | 13 | 862 | Risk Ratio (IV, Fixed, 95% CI) | 0.97 [0.66, 1.42] |
| 8.1 Low‐income countries | 2 | 297 | Risk Ratio (IV, Fixed, 95% CI) | 1.20 [0.72, 2.00] |
| 8.2 High‐income countries | 11 | 565 | Risk Ratio (IV, Fixed, 95% CI) | 0.73 [0.41, 1.31] |
| 9 Mortality ‐ adults Show forest plot | 7 | 1517 | Risk Ratio (IV, Fixed, 95% CI) | 0.95 [0.82, 1.10] |
| 9.1 Low‐income countries | 3 | 636 | Risk Ratio (IV, Fixed, 95% CI) | 1.02 [0.86, 1.20] |
| 9.2 High‐income countries | 4 | 881 | Risk Ratio (IV, Fixed, 95% CI) | 0.76 [0.56, 1.04] |
| 10 Any hearing loss adults Show forest plot | 4 | 844 | Odds Ratio (IV, Fixed, 95% CI) | 0.68 [0.47, 0.98] |
| 10.1 Low‐income countries | 2 | 225 | Odds Ratio (IV, Fixed, 95% CI) | 0.87 [0.49, 1.52] |
| 10.2 High‐income countries | 2 | 619 | Odds Ratio (IV, Fixed, 95% CI) | 0.58 [0.36, 0.92] |
| Outcome or subgroup title | No. of studies | No. of participants | Statistical method | Effect size |
| 1 Mortality Show forest plot | 22 | 3940 | Risk Ratio (IV, Random, 95% CI) | 0.87 [0.73, 1.05] |
| 1.1 Before or with first dose antibiotic | 13 | 3143 | Risk Ratio (IV, Random, 95% CI) | 0.87 [0.69, 1.09] |
| 1.2 After first dose antibiotic | 9 | 797 | Risk Ratio (IV, Random, 95% CI) | 0.83 [0.55, 1.26] |
| 2 Severe hearing loss Show forest plot | 16 | 2300 | Risk Ratio (IV, Fixed, 95% CI) | 0.82 [0.64, 1.06] |
| 2.1 Before or with first dose antibiotic | 10 | 1866 | Risk Ratio (IV, Fixed, 95% CI) | 0.81 [0.62, 1.07] |
| 2.2 After first dose antibiotic | 6 | 434 | Risk Ratio (IV, Fixed, 95% CI) | 0.89 [0.47, 1.68] |
| 3 Any hearing loss Show forest plot | 18 | 2754 | Risk Ratio (IV, Fixed, 95% CI) | 0.78 [0.68, 0.88] |
| 3.1 Before or with antibiotics | 12 | 2257 | Risk Ratio (IV, Fixed, 95% CI) | 0.80 [0.70, 0.92] |
| 3.2 After first dose of antibiotics | 6 | 497 | Risk Ratio (IV, Fixed, 95% CI) | 0.62 [0.43, 0.89] |
| 4 Short‐term neurologic sequelae Show forest plot | 12 | 1739 | Risk Ratio (IV, Fixed, 95% CI) | 0.85 [0.71, 1.03] |
| 4.1 Before or with first dose antibiotic | 6 | 1282 | Risk Ratio (IV, Fixed, 95% CI) | 0.91 [0.73, 1.13] |
| 4.2 After first dose antibiotic | 6 | 457 | Risk Ratio (IV, Fixed, 95% CI) | 0.70 [0.47, 1.04] |
| Outcome or subgroup title | No. of studies | No. of participants | Statistical method | Effect size |
| 1 Mortality Show forest plot | 25 | 4121 | Risk Ratio (IV, Fixed, 95% CI) | 0.95 [0.85, 1.06] |
| 1.1 High quality | 4 | 1793 | Risk Ratio (IV, Fixed, 95% CI) | 1.00 [0.88, 1.14] |
| 1.2 Medium quality | 14 | 1477 | Risk Ratio (IV, Fixed, 95% CI) | 0.81 [0.57, 1.17] |
| 1.3 Low quality | 7 | 851 | Risk Ratio (IV, Fixed, 95% CI) | 0.79 [0.60, 1.04] |
| 2 Severe hearing loss Show forest plot | 17 | 2442 | Risk Ratio (IV, Fixed, 95% CI) | 0.72 [0.55, 0.95] |
| 2.1 High quality | 3 | 857 | Risk Ratio (IV, Fixed, 95% CI) | 0.99 [0.69, 1.41] |
| 2.2 Medium quality | 10 | 1051 | Risk Ratio (IV, Fixed, 95% CI) | 0.47 [0.29, 0.75] |
| 2.3 Low quality | 4 | 534 | Risk Ratio (IV, Fixed, 95% CI) | 0.50 [0.20, 1.29] |
| 3 Any hearing loss Show forest plot | 20 | 2806 | Risk Ratio (IV, Fixed, 95% CI) | 0.79 [0.69, 0.90] |
| 3.1 High quality | 4 | 1119 | Risk Ratio (IV, Fixed, 95% CI) | 0.90 [0.73, 1.12] |
| 3.2 Medium quality | 12 | 1150 | Risk Ratio (IV, Fixed, 95% CI) | 0.73 [0.62, 0.87] |
| 3.3 Low quality | 4 | 537 | Risk Ratio (IV, Fixed, 95% CI) | 0.76 [0.38, 1.51] |
| 4 Short‐term neurological sequelae Show forest plot | 13 | 1756 | Risk Ratio (IV, Fixed, 95% CI) | 0.85 [0.70, 1.03] |
| 4.1 High quality | 3 | 896 | Risk Ratio (IV, Fixed, 95% CI) | 0.97 [0.77, 1.23] |
| 4.2 Medium quality | 8 | 784 | Risk Ratio (IV, Fixed, 95% CI) | 0.63 [0.45, 0.89] |
| 4.3 Low quality | 2 | 76 | Risk Ratio (IV, Fixed, 95% CI) | 0.83 [0.35, 1.95] |
| Outcome or subgroup title | No. of studies | No. of participants | Statistical method | Effect size |
| 1 Severe hearing loss Show forest plot | 17 | 2694 | Risk Ratio (M‐H, Random, 95% CI) | 1.25 [0.81, 1.93] |
| 2 Any hearing loss Show forest plot | 20 | 3029 | Risk Ratio (M‐H, Random, 95% CI) | 0.98 [0.71, 1.35] |
| 3 Short‐term neurological sequelae Show forest plot | 13 | 1850 | Risk Ratio (M‐H, Fixed, 95% CI) | 0.98 [0.82, 1.18] |
| 4 Long‐term neurological sequelae Show forest plot | 13 | 1758 | Risk Ratio (M‐H, Random, 95% CI) | 1.18 [0.78, 1.78] |