Exercise for depression
Information
- DOI:
- https://doi.org/10.1002/14651858.CD004366.pub6Copy DOI

- Database:
-
- Cochrane Database of Systematic Reviews
- Version published:
-
- 12 September 2013see what's new
- Type:
-
- Intervention
- Stage:
-
- Review
- Cochrane Editorial Group:
-
Cochrane Common Mental Disorders Group
- Copyright:
-
- Copyright © 2013 The Cochrane Collaboration. Published by John Wiley & Sons, Ltd.
Article metrics
Altmetric:
Cited by:
Authors
Contributions of authors
This review is based on a previously published BMJ review by Debbie Lawlor and Stephen Hopker. For this update, Dr Cooney and Professor Mead scrutinised studies and selected studies for inclusion. Dr Waugh and Dr Cooney performed data extraction, Dr Dwan performed the analysis, Dr Greig categorised intensity of exercise, and assisted with study selection. Professor Mead, Dr Cooney and Dr Dwan wrote the text. The text was read by all authors.
Sources of support
Internal sources
-
NHS Lothian, University of Edinburgh, UK.
External sources
-
National Institute for Health Research, Cochrane Review Incentive Scheme 2012, UK.
Declarations of interest
Marion McMurdo is co‐director of D.D. Developments, a University of Dundee not‐for‐profit organisation which provides exercise classes for older people.
Gillian E Mead developed a course on exercise after stroke which is licensed to Later Life Training. She receives royalty payments from Later Life Training, which are paid into an account at University of Edinburgh to support further research. She personally receives royalties from a book about Exercise and Fitness Training after Stroke. She receives expenses for speaking at conferences on exercise and fatigue after stroke.
Kerry Dwan: none known.
Carolyn A Greig: none known.
Debbie A Lawlor: none known.
Gary Cooney: None known
Jane Rimer: none known.
Fiona Waugh: none known.
Acknowledgements
An initial review of the effects of exercise in the treatment of depression, in which Professor Debbie Lawlor was the principal investigator, began as part of a training course at the NHS Centre for Reviews and Dissemination, University of York. Dr Stephen Hopker, consultant psychiatrist at Bradford Community Trust, was an investigator in the earlier review and Mr Alan Lui, audit nurse Airedale General Hospital, helped with the protocol development and retrieval of articles. Dr Domenico Scala, Senior House Officer in psychiatry and Lynfield Mount Hospital, Bradford, translated one Italian paper that was excluded from the review. We are grateful to Mr Paul Campbell for contributing to the previous update by providing expertise on depression. Dr Maria Corretge, Specialty Registrar in Geriatric Medicine at St. John's Hospital, West Lothian, translated two papers in Spanish and Portuguese which were subsequently excluded from the 2010 updated review.
We are very grateful to Ms Maureen Harding, Geriatric Medicine, University of Edinburgh, who retrieved articles and provided administrative support. We are also grateful to the Cochrane Depression, Anxiety and Neurosis Group editorial base team for assistance with searches and for advice on the review.
We are also grateful to several authors for providing more information or data for their studies (Elizabeth Wise ‐ Hoffman 2010; Jorge Mota Pereira ‐ Mota‐Pereira 2011; Jane Sims ‐ Sims 2009; James Blumenthal ‐ Blumenthal 2012a; Rebecca Gary ‐ Gary 2010).
We are grateful for the support of an NIHR incentive award to help support the update of this review.
CRG Funding Acknowledgement:
The National Institute for Health Research (NIHR) is the largest single funder of the Cochrane Depression, Anxiety and Neurosis Group.
Disclaimer:
The views and opinions expressed therein are those of the authors and do not necessarily reflect those of the NIHR, NHS or the Department of Health.
Version history
| Published | Title | Stage | Authors | Version |
| 2013 Sep 12 | Exercise for depression | Review | Gary M Cooney, Kerry Dwan, Carolyn A Greig, Debbie A Lawlor, Jane Rimer, Fiona R Waugh, Marion McMurdo, Gillian E Mead | |
| 2012 Jul 11 | Exercise for depression | Review | Jane Rimer, Kerry Dwan, Debbie A Lawlor, Carolyn A Greig, Marion McMurdo, Wendy Morley, Gillian E Mead | |
| 2009 Jul 08 | Exercise for depression | Review | Gillian E Mead, Wendy Morley, Paul Campbell, Carolyn A Greig, Marion McMurdo, Debbie A Lawlor | |
| 2008 Oct 08 | Exercise for depression | Review | Gillian E Mead, Wendy Morley, Paul Campbell, Carolyn A Greig, Marion McMurdo, Debbie A Lawlor | |
| 2007 Apr 18 | Exercise for depression | Protocol | Debbie A Lawlor, P Campbell, Gillian E Mead, Marion McMurdo, Wendy Morley | |
| 2000 Apr 24 | Exercise for depression | Protocol | Debbie Lawlor, Paul Campbell | |
Differences between protocol and review
For this update, we defined exercise according to the American College of Sports Medicine (ACSM) definition of exercise, rather than the trialist's own definition of exercise. We performed an additional sensitivity analysis to explore the effect of excluding those trials for which we used the arm with the largest clinical effect, rather than the largest 'dose' of exercise.
Changes for this update: we added subgroups, performed a sensitivity analysis for low/high 'dose' of exercise, included more detail in 'included study' table; we decided to include cluster‐RCTs, we produced a PRISMA diagram for the results of the searches for update; and we produced a 'Summary of findings' tables.
Keywords
MeSH
Medical Subject Headings (MeSH) Keywords
Medical Subject Headings Check Words
Adult; Humans; Middle Aged; Young Adult;
PICOs

Study flow diagram, showing the results of the searches for this current update.

'Risk of bias' graph: review authors' judgements about each risk of bias item presented as percentages across all included studies.

'Risk of bias' summary: review authors' judgements about each risk of bias item for each included study.

Funnel plot of comparison: 1 Exercise versus control, outcome: 1.1 Reduction in depression symptoms post‐treatment.

Comparison 1 Exercise versus 'control', Outcome 1 Reduction in depression symptoms post‐treatment.

Comparison 1 Exercise versus 'control', Outcome 2 Reduction in depression symptoms follow‐up.

Comparison 1 Exercise versus 'control', Outcome 3 Completed intervention or control.

Comparison 1 Exercise versus 'control', Outcome 4 Quality of life.

Comparison 2 Exercise versus psychological therapies, Outcome 1 Reduction in depression symptoms post‐treatment.

Comparison 2 Exercise versus psychological therapies, Outcome 2 Completed exercise or pyschological therapies.

Comparison 2 Exercise versus psychological therapies, Outcome 3 Quality of life.

Comparison 3 Exercise versus bright light therapy, Outcome 1 Reduction in depression symptoms post‐treatment.

Comparison 4 Exercise versus pharmacological treatments, Outcome 1 Reduction in depression symptoms post‐treatment.

Comparison 4 Exercise versus pharmacological treatments, Outcome 2 Completed exercise or antidepressants.

Comparison 4 Exercise versus pharmacological treatments, Outcome 3 Quality of Life.

Comparison 5 Reduction in depression symptoms post‐treatment: Subgroup analyses, Outcome 1 Exercise vs control subgroup analysis: type of exercise.

Comparison 5 Reduction in depression symptoms post‐treatment: Subgroup analyses, Outcome 2 Exercise vs control subroup analysis: intensity.

Comparison 5 Reduction in depression symptoms post‐treatment: Subgroup analyses, Outcome 3 Exercise vs control subroup analysis: number of sessions.

Comparison 5 Reduction in depression symptoms post‐treatment: Subgroup analyses, Outcome 4 Exercise vs control subroup analysis: diagnosis of depression.
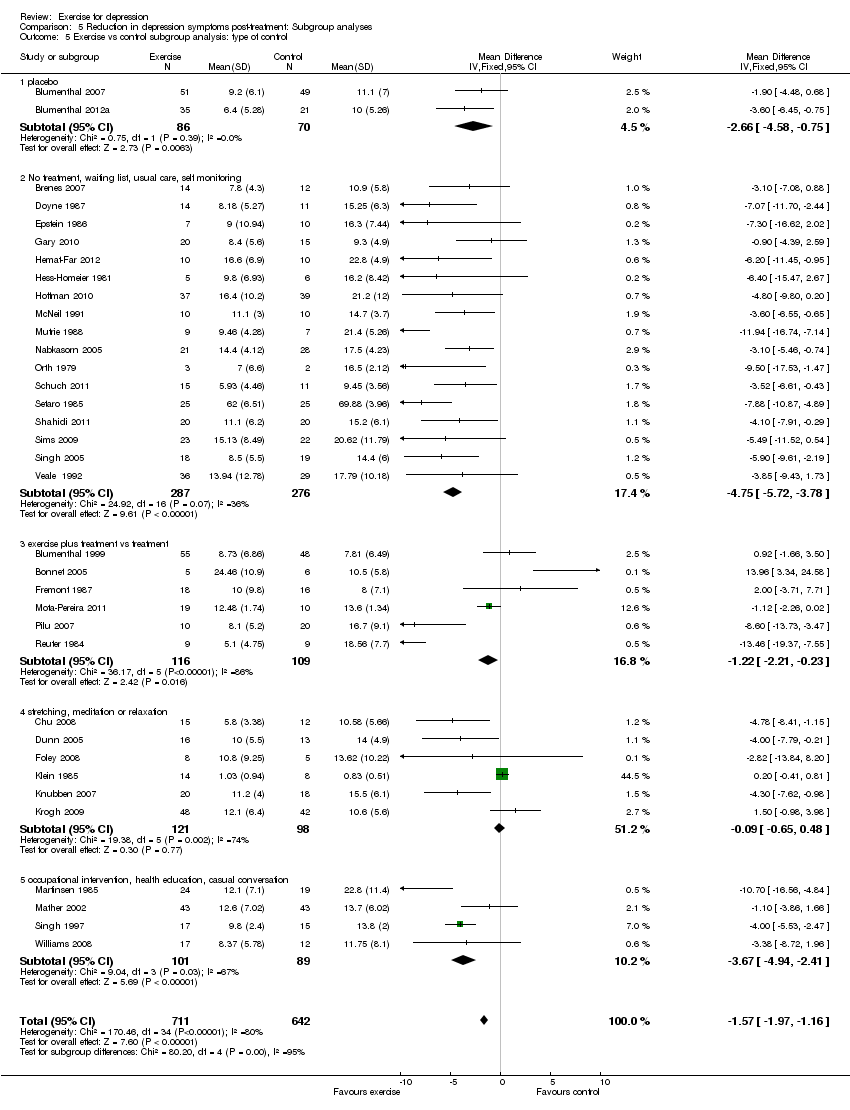
Comparison 5 Reduction in depression symptoms post‐treatment: Subgroup analyses, Outcome 5 Exercise vs control subgroup analysis: type of control.

Comparison 6 Exercise versus control: sensitivity analyses, Outcome 1 Reduction in depression symptoms post‐treatment: peer‐reviewed journal publications and doctoral theses only.

Comparison 6 Exercise versus control: sensitivity analyses, Outcome 2 Reduction in depression symptoms post‐treatment: studies published as abstracts or conference proceedings only.

Comparison 6 Exercise versus control: sensitivity analyses, Outcome 3 Reduction in depression symptoms post‐treatment: studies with adequate allocation concealment.

Comparison 6 Exercise versus control: sensitivity analyses, Outcome 4 Reduction in depression symptoms post‐treatment: studies using intention‐to‐treat analysis.

Comparison 6 Exercise versus control: sensitivity analyses, Outcome 5 Reduction in depression symptoms post‐treatment: studies with blinded outcome assessment.

Comparison 6 Exercise versus control: sensitivity analyses, Outcome 6 Reduction in depression symptoms post‐treatment: allocation concealment, intention‐to‐treat, blinded outcome.

Comparison 6 Exercise versus control: sensitivity analyses, Outcome 7 Reduction in depression symptoms post‐treatment: Lowest dose of exercise.
| Exercise compared to no intervention or placebo for adults with depression | |||||
| Patient or population: adults with depression | |||||
| Outcomes | Illustrative comparative risks* (95% CI) | No of Participants | Quality of the evidence | Comments | |
| Assumed risk | Corresponding risk | ||||
| No intervention or placebo | Exercise | ||||
| Symptoms of depression | The mean symptoms of depression in the control groups was | The mean symptoms of depression in the intervention groups was | 1353 | ⊕⊕⊕⊝ | SMD ‐0.62 (95% CI: ‐0.81 to ‐0.42). The effect size was interpreted as 'moderate' (using Cohen's rule of thumb) |
| Symptoms of depression (long‐term) | The mean symptoms of depression (long‐term) in the control groups was | The mean symptoms of depression (long‐term) in the intervention groups was | 377 | ⊕⊕⊝⊝ | SMD ‐0.33 (95% CI: ‐0.63 to ‐0.03). The effect size was interpreted as 'small' (using Cohen's rule of thumb) |
| Adverse events | See comment | See comment | 0 | ⊕⊕⊕⊝ | Seven trials reported no difference in adverse events between exercise and usual care groups. Dunn 2005 reported increased severity of depressive symptoms (n = 1), chest pain (n = 1) and joint pain/swelling (n = 1); all these participants discontinued exercise. Singh 1997 reported that 1 exerciser was referred to her psychologist at 6 weeks due to increasing suicidality; and musculoskeletal symptoms in 2 participants required adjustment of training regime. Singh 2005 reported adverse events in detail (visits to a health professional, minor illness, muscular pain, chest pain, injuries requiring training adjustment, falls, deaths and hospital days) and found no difference between the groups. Knubben 2007 reported "no negative effects of exercise (muscle pain, tightness or fatigue)"; after the training had finished, 1 person in the placebo group required gastric lavage and 1 person in the exercise group inflicted a superficial cut on her arm. Sims 2009 reported no adverse events or falls in either the exercise or control group. Blumenthal 2007 reported more side effects in the sertraline group (see comparison below) but there was no difference between the exercise and control group. Blumenthal 2012a reported more fatigue and sexual dysfunction in the sertraline group than the exercise group. |
| Acceptability of treatment | Study population | 1363 | ⊕⊕⊕⊝ | RR 1 | |
| 865 per 1000 | 865 per 1000 | ||||
| Quality of life | The mean quality of life in the intervention groups was | 0 | See comment | There was no statistically significant differences for the mental (SMD ‐0.24; 95% CI ‐0.76 to 0.29). psychological (SMD 0.28; 95% CI ‐0.29 to 0.86) and social domains (SMD 0.19; 95% CI ‐0.35 to 0.74). Two studies reported a statistically significant difference for the environment domain favouring exercise (SMD 0.62; 95% CI 0.06 to 1.18) and 4 studies reported a statistically significant difference for the physical domain favouring exercise (SMD 0.45; 95% CI 0.06 to 0.83). | |
| *The basis for the assumed risk (e.g. the median control group risk across studies) is provided in footnotes. The corresponding risk (and its 95% confidence interval) is based on the assumed risk in the comparison group and the relative effect of the intervention (and its 95% CI). | |||||
| GRADE Working Group grades of evidence | |||||
| 1 Effect estimate calculated by re‐expressing the SMD on the Hamilton Depression Rating Scale using the control group SD (7) from Blumenthal 2007 (study chosen for being most representative). The SD was multiplied by the pooled SMD to provide the effect estimate on the HDRS. | |||||
| Exercise compared to cognitive therapy for adults with depression | |||||
| Patient or population: adults with depression | |||||
| Outcomes | Illustrative comparative risks* (95% CI) | No of Participants | Quality of the evidence | Comments | |
| Assumed risk | Corresponding risk | ||||
| Cognitive therapy | Exercise | ||||
| Symptoms of depression | The mean symptoms of depression in the intervention groups was | 189 | ⊕⊕⊕⊝ | SMD ‐0.03 (95% CI: ‐0.32 to 0.26) | |
| Acceptability of treatment | Study population | 172 | ⊕⊕⊕⊝ | RR 1.08 | |
| 766 per 1000 | 827 per 1000 | ||||
| Quality of Life | The mean quality of life in the intervention groups was | 0 | ⊕⊕⊕⊝ | One trial reported changes in the Minnesota Living with Heart Failure Questionnaire, a quality of life measure (Gary 2010). There was no statistically significant difference for the physical domain (MD 0.15; 95% CI: ‐7.40 to 7.70) or the mental domain (MD ‐0.09; 95% CI: ‐9.51 to 9.33). | |
| *The basis for the assumed risk (e.g. the median control group risk across studies) is provided in footnotes. The corresponding risk (and its 95% confidence interval) is based on the assumed risk in the comparison group and the relative effect of the intervention (and its 95% CI). | |||||
| GRADE Working Group grades of evidence | |||||
| 1 Lack of blinding of outcome assessors probably increased effect sizes and drop‐out rates were high. Also sequence generation was considered unclear in 7 studies. | |||||
| Exercise compared to bright light therapy for adults with depression | |||||
| Patient or population: adults with depression | |||||
| Outcomes | Illustrative comparative risks* (95% CI) | No of Participants | Quality of the evidence | Comments | |
| Assumed risk | Corresponding risk | ||||
| Bright light therapy | Exercise | ||||
| Symptoms of depression | The mean symptoms of depression in the intervention groups was | 18 | ⊕⊝⊝⊝ | MD ‐6.40 (95% CI: ‐10.20 to ‐2.60). Although this trial suggests a benefit of exercise, it is too small to draw firm conclusions | |
| *The basis for the assumed risk (e.g. the median control group risk across studies) is provided in footnotes. The corresponding risk (and its 95% confidence interval) is based on the assumed risk in the comparison group and the relative effect of the intervention (and its 95% CI). | |||||
| GRADE Working Group grades of evidence | |||||
| 1 Lack of blinding of outcome assessors probably increased effect sizes and drop‐out rates were not reported. Also sequence generation and concealment was considered unclear. | |||||
| Exercise compared to antidepressants for adults with depression | |||||
| Patient or population: adults with depression | |||||
| Outcomes | Illustrative comparative risks* (95% CI) | No of Participants | Quality of the evidence | Comments | |
| Assumed risk | Corresponding risk | ||||
| Antidepressants | Exercise | ||||
| Symptoms of depression | The mean symptoms of depression in the intervention groups was | 300 | ⊕⊕⊕⊝ | SMD ‐0.11 (95% CI: ‐0.34 to 0.12) | |
| Acceptability of treatment | Study population | 278 | ⊕⊕⊕⊝ | RR 0.98 | |
| 891 per 1000 | 873 per 1000 | ||||
| Quality of life | The mean quality of life in the intervention groups was | 0 | ⊕⊕⊕⊝ | One trial, Brenes 2007, reported no difference in change in SF‐36 mental health and physical health components between medication and exercise groups. | |
| Adverse events | See comment | See comment | 0 | ⊕⊕⊕⊝ | Blumenthal 1999 reported that 3/53 in exercise group suffered musculoskeletal injuries; injuries in the medication group were not reported. Blumenthal 2007 collected data on side effects by asking participants to rate a 36‐item somatic symptom checklist and reported that "a few patients reported worsening of symptoms"; of the 36 side effects assessed, only 1 showed a statistically significant group difference (P = 0.03), i.e. that the sertraline group reported worse post‐treatment diarrhoea and loose stools. Blumenthal 2012a assessed 36 side effects; only 2 showed a significant group difference: 20% of participants receiving sertraline reported worse post‐treatment fatigue compared with 2.4% in the exercise group and 26% reported increased sexual problems compared with 2.4% in the exercise group. |
| *The basis for the assumed risk (e.g. the median control group risk across studies) is provided in footnotes. The corresponding risk (and its 95% confidence interval) is based on the assumed risk in the comparison group and the relative effect of the intervention (and its 95% CI). | |||||
| GRADE Working Group grades of evidence | |||||
| 1 Lack of blinding of outcome assessors probably increased effect sizes and drop‐out rates were high. Also sequence generation was considered unclear in 1 study. | |||||
| Trial ID | Screened | Randomised | Allocated exercise | Completed trial | Completed comparator group, e.g. control, other treatment (as a proportion of those allocated) | Completed exercise (as a proportion of those allocated) |
| 604 underwent telephone screening | 156 | 55 | 133 | 41/48 (medication) | 44/55 (exercise plus medication) 39/53 (exercise alone) | |
| 457 | 202 | 51 (supervised), 53 home‐based | 183 | 42/49 (placebo) 45/49 (sertraline) | 45/51 (supervised), 51/53 home‐based | |
| 1680 enquired about the study | 101 | 37 | 95 | 23/24 completed 'placebo' and 36/40 completed the medication | 36/37 completed the exercise | |
| Not reported | 37 | 14 | Not reported | Not reported | Not reported | |
| Not reported | 11 | 5 | 7 | 4/6 | 3/5 | |
| 104 responded to adverts | 54 | 36 | 38 | 12/18 | 26/36 (both exercise arms combined) 15/18 in the high‐intensity arm | |
| 1664 assessed for eligibility | 80 | 17 | 45 | 9/13 | 11/17 (public health dose 3 times per week) | |
| 285 responded to adverts | 57 | Not reported | 40 completed treatment or control | 27 (denominator not known) | 13 (denominator not known) | |
| 250 telephone inquiries received | 33 | 7 | Not reported | Not reported | 7 | |
| Not reported | 21 | 10 | 16 | 8/11 | 8/10 | |
| 215 responded to adverts | 23 | 10 | 13 | 5/13 | 8/10 | |
| 72 initially expressed an interest | 61 | 21 | 49 | 31/40 | 18/21 | |
| 982 referred, 242 had heart failure, 137 had a BDI > 10 and 74 eligible and consented | 74 | 20 | 68/74 completed post‐intervention assessments and 62 completed follow‐up assessments | usual care 15/17 | exercise only: 20/20 | |
| Not reported | 28 | 10 | 22 | 15/18 | 8/10 | |
| 350 screened | 20 | 10 | 20 | not stated | not stated | |
| Not reported | 17 | 5 | Not reported | Not reported | Not reported | |
| 253 screened, 58 ineligible | 84 | 42 | 76 | 39/42 (2 were excluded by the trialists and 1 did not attend follow‐up) | 37/42 of exercise group provided data for analysis | |
| 209 responded to an advertisement | 74 | 27 | 42 | 11/23 (meditation) 16/24 (group therapy) | 15/27 | |
| Not reported | 39 (note data on only 38 reported) | 20 | 35 | 16/18 | 19/20 | |
| 390 referred | 165 | 110 | 137 | 42/55 | 95/110 (both exercise arms combined) 47/55 (strength) 48/55 (aerobic) | |
| Not reported | 43 | 24 | 37 | 17/19 | 20/24 | |
| 1185 referred or screened | 86 | 43 | 86 | 42/43 | 43/43 | |
| 250 completed BDI, 60 contacted | 47 | 16 | 43 | 14/15 completed placebo 14/16 completed 'no treatment' | 15/16 | |
| 82 | 30 | 10 | 30 | 10/10 (waiting list) 10/10 (social contact) | 10/10 | |
| 150 | 33 | 22 | 29/33 | 10/11 | 19/22 | |
| 36 | 24 | 9 | 24 | 7/7 | 9/9 | |
| 266 volunteers screened | 59 | 28 | 49 | 28/31 | 21/28 | |
| 17 | 11 | 3 | 7 | 2/2 | 3/3 | |
| Not reported | 30 | 10 | 30 | 20/20 | 10/10 | |
| Not reported | 18 | 9 | Not reported | Not reported | Not reported | |
| Not reported | Not reported | 9 | Not reported | Not reported | 9 | |
| 14/40 invited patients were not interested in participating | 26 | 15 | "no patient withdrew from intervention" | "no patient withdrew from intervention" | "no patient withdrew from intervention" | |
| 211 responses to advertisement | 180 | 30 | 150 | Not reported | 25/30 | |
| 70 older depressed women chosen from 500 members of a district using the geriatric depression scale | 70 | 23 | 60/70 | 20/24 | 20/23 | |
| 1550 invitations, 233 responded | 45 | 23 | 43 | 22/22 | 21/23 | |
| Letters sent to 2953 people, 884 replied | 32 | 17 | 32 | 15/15 | 17/17 | |
| 451 | 60 | 20 | 54 | 19/20 (GP standard care) | 18/20 (high‐intensity training) | |
| Not reported | 83 | 48 | 57 | 29/35 | 36/48 | |
| 96 in parent study | 43 | 33 | 34 | 8/10 | 26/33 (both exercise groups combined) 15/16 exercise 11/17 walking | |
| BDI: Beck Depression Inventory | ||||||
| Outcome or subgroup title | No. of studies | No. of participants | Statistical method | Effect size |
| 1 Reduction in depression symptoms post‐treatment Show forest plot | 35 | 1353 | Std. Mean Difference (IV, Random, 95% CI) | ‐0.62 [‐0.81, ‐0.42] |
| 2 Reduction in depression symptoms follow‐up Show forest plot | 8 | 377 | Std. Mean Difference (IV, Random, 95% CI) | ‐0.33 [‐0.63, ‐0.03] |
| 3 Completed intervention or control Show forest plot | 29 | 1363 | Risk Ratio (M‐H, Random, 95% CI) | 1.00 [0.97, 1.04] |
| 4 Quality of life Show forest plot | 4 | Std. Mean Difference (IV, Fixed, 95% CI) | Subtotals only | |
| 4.1 Mental | 2 | 59 | Std. Mean Difference (IV, Fixed, 95% CI) | ‐0.24 [‐0.76, 0.29] |
| 4.2 Psychological | 2 | 56 | Std. Mean Difference (IV, Fixed, 95% CI) | 0.28 [‐0.29, 0.86] |
| 4.3 Social | 2 | 56 | Std. Mean Difference (IV, Fixed, 95% CI) | 0.19 [‐0.35, 0.74] |
| 4.4 Environment | 2 | 56 | Std. Mean Difference (IV, Fixed, 95% CI) | 0.62 [0.06, 1.18] |
| 4.5 Physical | 4 | 115 | Std. Mean Difference (IV, Fixed, 95% CI) | 0.45 [0.06, 0.83] |
| Outcome or subgroup title | No. of studies | No. of participants | Statistical method | Effect size |
| 1 Reduction in depression symptoms post‐treatment Show forest plot | 7 | 189 | Std. Mean Difference (IV, Random, 95% CI) | ‐0.03 [‐0.32, 0.26] |
| 2 Completed exercise or pyschological therapies Show forest plot | 4 | 172 | Risk Ratio (M‐H, Random, 95% CI) | 1.08 [0.95, 1.24] |
| 3 Quality of life Show forest plot | 1 | Mean Difference (IV, Fixed, 95% CI) | Totals not selected | |
| 3.1 Physical | 1 | Mean Difference (IV, Fixed, 95% CI) | 0.0 [0.0, 0.0] | |
| 3.2 Mental | 1 | Mean Difference (IV, Fixed, 95% CI) | 0.0 [0.0, 0.0] | |
| Outcome or subgroup title | No. of studies | No. of participants | Statistical method | Effect size |
| 1 Reduction in depression symptoms post‐treatment Show forest plot | 1 | 18 | Mean Difference (IV, Fixed, 95% CI) | ‐6.4 [‐10.20, ‐2.60] |
| Outcome or subgroup title | No. of studies | No. of participants | Statistical method | Effect size |
| 1 Reduction in depression symptoms post‐treatment Show forest plot | 4 | 300 | Std. Mean Difference (IV, Random, 95% CI) | ‐0.11 [‐0.34, 0.12] |
| 2 Completed exercise or antidepressants Show forest plot | 3 | 278 | Risk Ratio (M‐H, Random, 95% CI) | 0.98 [0.86, 1.12] |
| 3 Quality of Life Show forest plot | 1 | Mean Difference (IV, Fixed, 95% CI) | Subtotals only | |
| 3.1 Mental | 1 | 25 | Mean Difference (IV, Fixed, 95% CI) | ‐11.90 [‐24.04, 0.24] |
| 3.2 Physical | 1 | 25 | Mean Difference (IV, Fixed, 95% CI) | 1.30 [‐0.67, 3.27] |
| Outcome or subgroup title | No. of studies | No. of participants | Statistical method | Effect size |
| 1 Exercise vs control subgroup analysis: type of exercise Show forest plot | 35 | Std. Mean Difference (IV, Random, 95% CI) | Subtotals only | |
| 1.1 Aerobic exercise | 28 | 1080 | Std. Mean Difference (IV, Random, 95% CI) | ‐0.55 [‐0.77, ‐0.34] |
| 1.2 Mixed exercise | 3 | 128 | Std. Mean Difference (IV, Random, 95% CI) | ‐0.85 [‐1.85, 0.15] |
| 1.3 Resistance exercise | 4 | 144 | Std. Mean Difference (IV, Random, 95% CI) | ‐1.03 [‐1.52, ‐0.53] |
| 2 Exercise vs control subroup analysis: intensity Show forest plot | 35 | Std. Mean Difference (IV, Random, 95% CI) | Subtotals only | |
| 2.1 light/moderate | 3 | 76 | Std. Mean Difference (IV, Random, 95% CI) | ‐0.83 [‐1.32, ‐0.34] |
| 2.2 moderate | 12 | 343 | Std. Mean Difference (IV, Random, 95% CI) | ‐0.64 [‐1.01, ‐0.28] |
| 2.3 hard | 11 | 595 | Std. Mean Difference (IV, Random, 95% CI) | ‐0.56 [‐0.93, ‐0.20] |
| 2.4 vigorous | 5 | 230 | Std. Mean Difference (IV, Random, 95% CI) | ‐0.77 [‐1.30, ‐0.24] |
| 2.5 Moderate/hard | 2 | 66 | Std. Mean Difference (IV, Random, 95% CI) | ‐0.63 [‐1.13, ‐0.13] |
| 2.6 Moderate/vigorous | 2 | 42 | Std. Mean Difference (IV, Random, 95% CI) | ‐0.38 [‐1.61, 0.85] |
| 3 Exercise vs control subroup analysis: number of sessions Show forest plot | 35 | Std. Mean Difference (IV, Random, 95% CI) | Subtotals only | |
| 3.1 0 ‐ 12 sessions | 5 | 195 | Std. Mean Difference (IV, Random, 95% CI) | ‐0.42 [‐1.26, 0.43] |
| 3.2 13 ‐ 24 sessions | 9 | 296 | Std. Mean Difference (IV, Random, 95% CI) | ‐0.70 [‐1.09, ‐0.31] |
| 3.3 25 ‐ 36 sessions | 8 | 264 | Std. Mean Difference (IV, Random, 95% CI) | ‐0.80 [‐1.30, ‐0.29] |
| 3.4 37+ sessions | 10 | 524 | Std. Mean Difference (IV, Random, 95% CI) | ‐0.46 [‐0.69, ‐0.23] |
| 3.5 unclear | 3 | 73 | Std. Mean Difference (IV, Random, 95% CI) | ‐0.89 [‐1.39, ‐0.40] |
| 4 Exercise vs control subroup analysis: diagnosis of depression Show forest plot | 35 | Std. Mean Difference (IV, Random, 95% CI) | Subtotals only | |
| 4.1 clinical diagnosis of depression | 23 | 967 | Std. Mean Difference (IV, Random, 95% CI) | ‐0.57 [‐0.81, ‐0.32] |
| 4.2 depression categorised according to cut points on a scale | 11 | 367 | Std. Mean Difference (IV, Random, 95% CI) | ‐0.67 [‐0.95, ‐0.39] |
| 4.3 unclear | 1 | 18 | Std. Mean Difference (IV, Random, 95% CI) | ‐2.00 [‐3.19, ‐0.82] |
| 5 Exercise vs control subgroup analysis: type of control Show forest plot | 35 | 1353 | Mean Difference (IV, Fixed, 95% CI) | ‐1.57 [‐1.97, ‐1.16] |
| 5.1 placebo | 2 | 156 | Mean Difference (IV, Fixed, 95% CI) | ‐2.66 [‐4.58, ‐0.75] |
| 5.2 No treatment, waiting list, usual care, self monitoring | 17 | 563 | Mean Difference (IV, Fixed, 95% CI) | ‐4.75 [‐5.72, ‐3.78] |
| 5.3 exercise plus treatment vs treatment | 6 | 225 | Mean Difference (IV, Fixed, 95% CI) | ‐1.22 [‐2.21, ‐0.23] |
| 5.4 stretching, meditation or relaxation | 6 | 219 | Mean Difference (IV, Fixed, 95% CI) | ‐0.09 [‐0.65, 0.48] |
| 5.5 occupational intervention, health education, casual conversation | 4 | 190 | Mean Difference (IV, Fixed, 95% CI) | ‐3.67 [‐4.94, ‐2.41] |
| Outcome or subgroup title | No. of studies | No. of participants | Statistical method | Effect size |
| 1 Reduction in depression symptoms post‐treatment: peer‐reviewed journal publications and doctoral theses only Show forest plot | 34 | 1335 | Std. Mean Difference (IV, Random, 95% CI) | ‐0.59 [‐0.78, ‐0.40] |
| 2 Reduction in depression symptoms post‐treatment: studies published as abstracts or conference proceedings only Show forest plot | 1 | 18 | Std. Mean Difference (IV, Random, 95% CI) | ‐2.00 [‐3.19, ‐0.82] |
| 3 Reduction in depression symptoms post‐treatment: studies with adequate allocation concealment Show forest plot | 14 | 829 | Std. Mean Difference (IV, Random, 95% CI) | ‐0.49 [‐0.75, ‐0.24] |
| 4 Reduction in depression symptoms post‐treatment: studies using intention‐to‐treat analysis Show forest plot | 11 | 567 | Std. Mean Difference (IV, Random, 95% CI) | ‐0.61 [1.00, ‐0.22] |
| 5 Reduction in depression symptoms post‐treatment: studies with blinded outcome assessment Show forest plot | 12 | 658 | Std. Mean Difference (IV, Random, 95% CI) | ‐0.36 [‐0.60, ‐0.12] |
| 6 Reduction in depression symptoms post‐treatment: allocation concealment, intention‐to‐treat, blinded outcome Show forest plot | 6 | 464 | Std. Mean Difference (IV, Random, 95% CI) | ‐0.18 [‐0.47, 0.11] |
| 7 Reduction in depression symptoms post‐treatment: Lowest dose of exercise Show forest plot | 35 | 1347 | Std. Mean Difference (IV, Fixed, 95% CI) | ‐0.44 [‐0.55, ‐0.33] |