Scolaris Content Display Scolaris Content Display

Comparison 1 Radiotherapy versus radiotherapy + chemotherapy, Outcome 1 Effect of chemotherapy on overall survival, hazard ratio of death by timing of chemotherapy.
Figures and Tables -
Analysis 1.1

Comparison 1 Radiotherapy versus radiotherapy + chemotherapy, Outcome 1 Effect of chemotherapy on overall survival, hazard ratio of death by timing of chemotherapy.

Comparison 1 Radiotherapy versus radiotherapy + chemotherapy, Outcome 2 Effect of chemotherapy on event‐free survival, hazard ratio of tumour failure or death by timing of chemo..
Figures and Tables -
Analysis 1.2

Comparison 1 Radiotherapy versus radiotherapy + chemotherapy, Outcome 2 Effect of chemotherapy on event‐free survival, hazard ratio of tumour failure or death by timing of chemo..

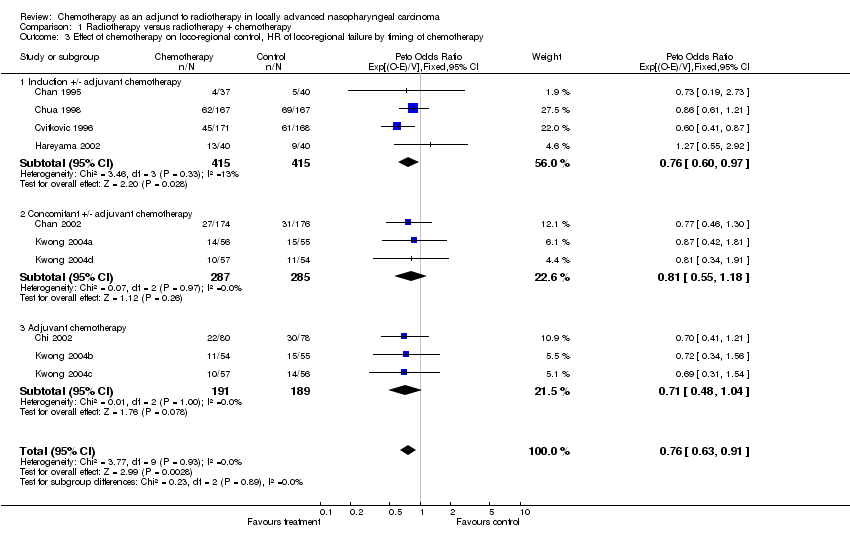
Comparison 1 Radiotherapy versus radiotherapy + chemotherapy, Outcome 3 Effect of chemotherapy on loco‐regional control, HR of loco‐regional failure by timing of chemotherapy.
Figures and Tables -
Analysis 1.3

Comparison 1 Radiotherapy versus radiotherapy + chemotherapy, Outcome 3 Effect of chemotherapy on loco‐regional control, HR of loco‐regional failure by timing of chemotherapy.

Comparison 1 Radiotherapy versus radiotherapy + chemotherapy, Outcome 4 Effect of chemotherapy on distant control, hazard ratio of distant failure by timing of chemotherapy.
Figures and Tables -
Analysis 1.4

Comparison 1 Radiotherapy versus radiotherapy + chemotherapy, Outcome 4 Effect of chemotherapy on distant control, hazard ratio of distant failure by timing of chemotherapy.

Table 1. Patient characteristics by treatment group

Characteristics

RT + CT

RT

n = 1975

n = 990

n = 985

Gender: male

75%

74%

Age: < 40 or equal

33%

29%

41 to 50

31%

33%

51+

36%

38%

Perform. status (n = 1468)*: 0

52%

50%

1

46%

47%

2

2%

3%

Tumour stage: T1

46%

47%

T2

27%

28%

T3,4

27%

25%

Nodal stage (n = 1 898)**: N0

10%

9%

N1,2

65%

68%

N3

25%

23%

Histology (n = 1636)***: WHO 1

4%

3%

WHO 2

18%

18%

WHO 3

78%

79%

* Data missing from three trials.
** Data missing from one trial, using Ho's classification.
*** Data missing from one trial, that did not distinguish between WHO histologic type 2 and 3 but did not include type 1.

Figures and Tables -
Table 1. Patient characteristics by treatment group
Table 2. Treatment effect on overall and event‐free survival according to patient charact

Characteristics

n. patients RT+CT/RT

HR of death (95%CI)

P‐value

HR tum. failur/death

P‐value

Gender: Male

742/727

0.81 (0.69 to 0.95)

0.76 (0.66 to 0.87)

Gender: Female

248/258

0.85 (0.62 to 1.16)

0.81

0.74 (0.58 to 0.96)

0.89

Age < 40 or equal

326/285

0.85 (0.63 to 1.14)

0.67 (0.52 to 0.85)

41 to 50

308/327

0.77 (0.59 to 1.01)

0.80 (0.64 to 1.00)

> 50

356/373

0.86 (0.70 to 1.05)

0.85 (t for trend)

0.79 (0.66 to 0.95)

0.31 (t for trend)

Performance status: 0

380/368

0.89 (0.71 to 1.11)

0.78 (0.64 to 0.94)

1

342/340

0.71 (0.55 to 0.92)

0.66 (0.53 to 0.83)

2

17/21

1.55 (0.65 to 3.69)

0.73 (t for trend)

1.40 (0.65 to 3.02)

0.92 (t for trend)

T stage (AJCC97): T1

267/272

0.68 (0.51 to 0.90)

0.69 (0.54 to 0.87)

T2

350/363

0.83 (0.64 to 1.07)

0.82 (0.66 to 1.02)

T3/T4

373/350

0.90 (0.73 to 1.12)

0.12 (t for trend)

0.73 (0.60 to 0.88)

0.80 (t for trend)

N stage (AJCC97): N0

91/83

1.02 (0.61 to 1.69)

0.65 (0.42 to 1.00)

N1/N2

620/643

0.82 (0.68 to 0.99)

0.79 (0.68 to 0.93)

N3

242/219

0.68 (0.52 to 0.88)

0.24 (t for trend)

0.64 (0.51 to 0.81)

0.47 (t for trend)

WHO type 1

29/26

0.30 (0.15 to 0.59)

0.18 (0.09 to 0.36)

WHO type 2 to 3

958/959

0.85 (0.73 to 0.98)

0.003

0.78 (0.69 to 0.89)

< 0.0001

Total

990/985

0.82 (0.71 to 0.94)

0.006

0.76 (0.67 to 0.86)

< 0.0001

Figures and Tables -
Table 2. Treatment effect on overall and event‐free survival according to patient charact
Table 3. Sensitivity analyses

Trials included

N patients RT+CT/RT

OS. HR. 95%CI

OS. HR. p‐value

OS. heterogeneity I²

OS. Hetero. p‐value

EFS. HR. 95%CI

EFS. HR. p‐value

EFS. hetero. I²

EFS. Hetero. p‐value

All trials

990/985

0.82 (0.71 to 0.94)

0.006

50%

0.03

0.76 (0.67 to 0.86)

< 0.0001

32%

0.14

Without Al‐Sarraf 1998 (INT‐0099)

893/889

0.90 (0.77 to 1.05)

0.17

0%

0.37

0.82 (0.72 to 0.93)

0.002

0%

0.99

Without patients with WHO 1 carcinoma

958/959

0.85 (0.73 to 0.98)

0.03

38%

0.09

0.78 (0.69 to 0.89)

0.0001

0%

0.58

Without one small trial (Chan 1995 (PWH‐88))

953/945

0.81 (0.70 to 0.93)

0.003

51%

0.03

0.75 (0.66 to 0.85)

< 0.0001

36%

0.12

Without QMH‐95 combined arms
(Kwong 2004d (QMH‐95conc+), Kwong 2004c (QMH‐95adj+))

876/875

0.84 (0.73 to 0.98)

0.02

53%

0.03

0.75 (0.66 to 0.85)

< 0.0001

43%

0.08

Without Chan 1995 (PWH‐88), QMH95: follow up < 5 years

729/725

0.80 (0.68 to 0.93)

0.004

58%

0.04

0.73 (0.64 to 0.84)

< 0.0001

32%

0.03

Figures and Tables -
Table 3. Sensitivity analyses
Comparison 1. Radiotherapy versus radiotherapy + chemotherapy

Outcome or subgroup title

No. of studies

No. of participants

Statistical method

Effect size

1 Effect of chemotherapy on overall survival, hazard ratio of death by timing of chemotherapy Show forest plot

11

1975

Peto Odds Ratio (95% CI)

0.82 [0.71, 0.95]

1.1 Induction +/‐ adjuvant chemotherapy

4

830

Peto Odds Ratio (95% CI)

0.99 [0.80, 1.21]

1.2 Concomitant +/‐ adjuvant chemotherapy

4

765

Peto Odds Ratio (95% CI)

0.60 [0.48, 0.76]

1.3 Adjuvant chemotherapy

3

380

Peto Odds Ratio (95% CI)

0.97 [0.68, 1.38]

2 Effect of chemotherapy on event‐free survival, hazard ratio of tumour failure or death by timing of chemo. Show forest plot

11

1975

Peto Odds Ratio (95% CI)

0.76 [0.67, 0.86]

2.1 Induction +/‐ adjuvant chemotherapy

4

830

Peto Odds Ratio (95% CI)

0.82 [0.68, 0.97]

2.2 Concomitant +/‐adjuvant chemotherapy

4

765

Peto Odds Ratio (95% CI)

0.63 [0.51, 0.78]

2.3 Adjuvant chemotherapy

3

380

Peto Odds Ratio (95% CI)

0.90 [0.67, 1.20]

3 Effect of chemotherapy on loco‐regional control, HR of loco‐regional failure by timing of chemotherapy Show forest plot

10

1782

Peto Odds Ratio (95% CI)

0.76 [0.63, 0.91]

3.1 Induction +/‐ adjuvant chemotherapy

4

830

Peto Odds Ratio (95% CI)

0.76 [0.60, 0.97]

3.2 Concomitant +/‐ adjuvant chemotherapy

3

572

Peto Odds Ratio (95% CI)

0.81 [0.55, 1.18]

3.3 Adjuvant chemotherapy

3

380

Peto Odds Ratio (95% CI)

0.71 [0.48, 1.04]

4 Effect of chemotherapy on distant control, hazard ratio of distant failure by timing of chemotherapy Show forest plot

10

1782

Peto Odds Ratio (95% CI)

0.72 [0.59, 0.87]

4.1 Induction +/‐ adjuvant chemotherapy

4

830

Peto Odds Ratio (95% CI)

0.65 [0.49, 0.86]

4.2 Concomitant +/‐ adjuvant chemotherapy

3

572

Peto Odds Ratio (95% CI)

0.69 [0.49, 0.97]

4.3 Adjuvant chemotherapy

3

380

Peto Odds Ratio (95% CI)

1.11 [0.66, 1.85]

Figures and Tables -
Comparison 1. Radiotherapy versus radiotherapy + chemotherapy