Rehabilitación física para personas de edad avanzada en la atención a largo plazo
References
References to studies included in this review
References to studies excluded from this review
References to studies awaiting assessment
References to ongoing studies
Additional references
Characteristics of studies
Characteristics of included studies [ordered by study ID]
| Methods | Design: RCT | |
| Participants | Country: USA Consent: assent accepted Inclusion criteria: urinary incontinence Exclusion criteria: cognitive = comatose, severe physical aggression; medical = life expectancy < 3 months, length of stay < 3 months % Eligible within home: 49.6 Intervention: N = 15; % women = 92.9; age (mean) = 88.6 years ± 10.4 | |
| Interventions | Study aim or objective: to test whether an intervention combining increased daytime physical activity with improvement in the night‐time environment improves sleep and decreases agitation in nursing‐home residents Intervention group: FIT programme, individualised intervention, session duration = n/a, number of sessions per week = maximum of 20 Control group: usual care for 14 weeks, then 1 week of night‐time programme | |
| Outcomes | Physical function in ADL: 10‐minute walk/wheel (time), 10‐minute walk/wheel (average distance) | |
| Notes | Funding: not reported | |
| Risk of bias | ||
| Bias | Authors' judgement | Support for judgement |
| Random sequence generation (selection bias) | Unclear risk | Quote: "Randomization occurred after baseline assessment" |
| Allocation concealment (selection bias) | Unclear risk | Quote: "Randomization occurred after baseline assessment" |
| Blinding of participants and personnel (performance bias) | High risk | Study was performed in a single home with an observable intervention |
| Blinding of outcome assessment (detection bias) | Unclear risk | Quote: "...performed by independent evaluators..." |
| Incomplete outcome data (attrition bias) | High risk | 25 participants lost prior to baseline assessment because of time taken for parent study. 4 further participants lost to follow up, but unclear if already randomised and if so from which group |
| Selective reporting (reporting bias) | Unclear risk | Protocol unavailable. Some baseline assessments could have been outcome measures (e.g. OSAI) |
| Other bias | Low risk | No other apparent risks of bias |
| Methods | Design: randomised, assessor‐blind trial, matched pairs | |
| Participants | Country: Hong Kong Inclusion criteria: able to understand and follow verbal instructions, ambulate independently (with or without aids), tolerate standing, and walking for at least 5 minutes Exclusion criteria: medical= acute musculoskeletal pain, neurological signs and symptoms not under medication control, unstable medical conditions, complaint of dizziness and blurred vision leading to difficulty walking, medical conditions contraindicative to physical activity % Eligible within home: not reported Intervention: N = baseline not reported; % women = not reported; age (mean) = 79.1 years ± 8.41 Control: N = baseline not reported; % women = not reported; age (mean) = 81.0 years ± 7.45 | |
| Interventions | Study aim or objective: to examine the effects of a short‐term mobility programme on the balance and mobility of elderly residents in private old‐age homes in Hong Kong Intervention: M programme (N = 10) = lower limb strengthening and balance training based on the overloading principle for strengthening and specificity for challenging balance in the upright position Control: C programme (N = 8) = general light exercises performed while sitting without progression Training session adherence: 98% | |
| Outcomes | Physical function in ADL: TUG test (seconds) (Podsiadlo 1991), 4 metre walk (time seconds) | |
| Notes | Funding: not reported | |
| Risk of bias | ||
| Bias | Authors' judgement | Support for judgement |
| Random sequence generation (selection bias) | Low risk | Quote: "Subjects of each matched pair were randomly allocated...by drawing of lots" |
| Allocation concealment (selection bias) | Unclear risk | Quote: "...by drawing of lots..." Unclear if concealed |
| Blinding of participants and personnel (performance bias) | Unclear risk | Not mentioned. Both participant groups received exercise interventions |
| Blinding of outcome assessment (detection bias) | Low risk | Quote: "They were blinded to the allocation of subjects to the exercise programmes" |
| Incomplete outcome data (attrition bias) | High risk | 31 participants consented; 13 dropped out (unclear numbers per group). Analysed as treated |
| Selective reporting (reporting bias) | Unclear risk | The three measures were appropriate. However, may not have been exclusive. Protocol not available |
| Other bias | Low risk | No other apparent risks of bias |
| Methods | Design: randomised controlled semi‐cross‐over trial | |
| Participants | Country: USA Consent: not specified Inclusion criteria: age > 65, residence at facility > 3 months, ability to ambulate alone (included with assistive devices or carer) Exclusion criteria: cognitive = inability to follow 2‐step command; medical = acute unstable illness (e.g. pneumonia),chronic illness (e.g. uncompensated congestive heart failure); functional = assaultive behaviour pattern, unwillingness to discontinue current physical therapy % Eligible within home: 42 Intervention: N = 11; % women = 82; age (mean) = 88 years, range = 75 to 96 years Control: N = 9; % women = 67; age (mean) = 88 years, range = 78 to 99 years | |
| Interventions | Study aim or objective: to determine whether a strength and flexibility programme in frail long‐term care facility residents would result in improved function Number of experimental groups: 2 Intervention: conducted by exercise physiologist in the lounge, exercises done in seated position (frailty), warm‐up; upper body strengthening; lower‐body strengthening; cool down, soft ankle and wrist weights (2 to 4 lbs), Thera‐Bands® (resistance 2.5 to 9 lbs), weighted hand‐sized balls, beach balls for kicking and throwing, weekly evaluations of progress Control: art therapist or social worker; sessions of drawing, painting, puzzles, or cards; encouraged to continue normal activities; discouraged from joining exercise regime during the intervention | |
| Outcomes | Physical function in ADL: Physical Performance Test, TUG test (seconds) (Podsiadlo 1991) | |
| Notes | Funding: not reported | |
| Risk of bias | ||
| Bias | Authors' judgement | Support for judgement |
| Random sequence generation (selection bias) | Low risk | Quote: "Randomisation was determined by a computer‐generated algorithm (permuted blocks) stratified by place of residence within the LTC facility" |
| Allocation concealment (selection bias) | Low risk | Quote: "Assignment to the study group was done by opening sealed envelopes with the random numbers supplied in sequence by the study coordinator" |
| Blinding of participants and personnel (performance bias) | High risk | Participants were not blinded |
| Blinding of outcome assessment (detection bias) | Low risk | Quote: "All the performance tests were administered by physical and occupational therapists who were blinded to the group assignments. The MMSE was administered by two trained medical students and research nurses also blinded to group membership" |
| Incomplete outcome data (attrition bias) | Unclear risk | 13% of total repeated measures after baseline missing because of death or acute illness, but not reported which groups. ITT analysis performed |
| Selective reporting (reporting bias) | Unclear risk | Protocol unavailable |
| Other bias | High risk | Quote: "Two patients were non‐compliant with their assignment; one switched to exercise immediately...results...included these patients as they were assigned...When they were eliminated from analysis, the results were slightly more positive in favour of the exercise intervention" Evidence of contamination reported |
| Methods | Design: RCT | |
| Participants | Country: Belgium Inclusion criteria: dependent in no more than 2 of 6 ADL categories (Katz Scale) Exclusion criteria: cognitive = cognitive dysfunction interfering with test and training procedures; medical = presence of infectious disease, insulin‐dependent diabetes mellitus, endogenous osteosynthetic material, knee or hip prosthesis, pacemaker, epilepsy, musculoskeletal disorders % Eligible within home: 33.7 Intervention: N = 13; men:women ratio = 5:8; age (mean) = 76.6 years ± 11.8 Control: N = 11; men:women ratio = 4:7; age (mean) = 78.6 years ± 10.4 | |
| Interventions | Study aim or objective: to investigate the feasibility of whole body vibration in the institutionalised elderly and its impact on functional capacity and muscle performance Targeted social interaction Intervention: used Power Plate vibration platform, sessions 3 times a week with at least 1 day of rest between; 6 static exercises targeting lower limb muscles, exercise volume, and intensity gradually increased Control: the same exercise regimen on the same vibration platform but machine switched off and sound produced by tape recorder | |
| Outcomes | Physical function in ADL: TUG test (seconds) (Podsiadlo 1991) | |
| Notes | Funding: not reported, were given the loan of the vibration platform by 'Power Plate Belgium' | |
| Risk of bias | ||
| Bias | Authors' judgement | Support for judgement |
| Random sequence generation (selection bias) | Low risk | Quote: "Randomisation was done for all 24 participants together at the same moment by lottery" |
| Allocation concealment (selection bias) | Unclear risk | Insufficient information provided |
| Blinding of participants and personnel (performance bias) | Unclear risk | Blinding of participants attempted ‐ reproduced sound of vibration platform to convince control group that it was working, but participants may have felt that it was not working |
| Blinding of outcome assessment (detection bias) | Low risk | Quote: "Functional performance assessment was done by a physical therapist who was unaware of group assignment of the participants" |
| Incomplete outcome data (attrition bias) | High risk | Three dropouts in whole body vibration group compared with no dropouts in control group ‐ two dropouts likely to be related to whole body vibration program |
| Selective reporting (reporting bias) | Unclear risk | Protocol unavailable |
| Other bias | Low risk | No other apparent risks of bias |
| Methods | Design: RCT | |
| Participants | Country: USA Inclusion criteria: residential status, > 65 years old, ambulatory (± assistive device) Exclusion criteria: history of heart attack/stroke within previous 6 months, unstable angina, any condition that the physician felt might be worsened by exercise % Eligible within home: not reported Training group 1: N = 8; mean age = 84 years ± 9.6; range = 71 to 96 years; 6 women, 2 men Training group 2: N = 8; mean age = 80 years ± 6.6; range = 69 to 90 years; all women | |
| Interventions | Study aim or objective: to evaluate the effect of a 8‐week progressive functional fitness strength programme using dumbbells and ankle weights on strength, functional capability, balance, and selected psychological variables in residents in an assisted‐living facility Intervention: both groups followed the same exercise routine, only the weights varied (see Notes), the exercise routine comprised 5 upper and 5 lower body strengthening exercises targeting the major muscle groups, using different weights of dumbbells as resistance, cadence exercises wearing ankle weights were also performed, a gerontologist specialising in exercise training for older adults led the exercise sessions, which included all of the participants in 1 large group (see Notes) Training group 1: the dumbbell and ankle weights and number of exercise repetitions were gradually increased over the course of the study (Control) Training group 2: Used 1 lb dumbbells throughout the study, and cadence exercises were performed wearing ankle straps without the addition of weights | |
| Outcomes | Falls: number of falls | |
| Notes | Funding: University of North Texas Research and Professional Development Grant | |
| Risk of bias | ||
| Bias | Authors' judgement | Support for judgement |
| Random sequence generation (selection bias) | Low risk | Quote: "Subjects were entered into training group 1 or training group 2 through random assignment by a random number table" |
| Allocation concealment (selection bias) | Unclear risk | Insufficient information provided |
| Blinding of participants and personnel (performance bias) | High risk | The two treatment groups trained together ‐ participants may have noticed that different groups were receiving different weighted dumbbells and wearing different ankle weights |
| Blinding of outcome assessment (detection bias) | Unclear risk | No report of blinding of assessors |
| Blinding of outcome assessment (detection bias) | Unclear risk | Interviewer not described |
| Incomplete outcome data (attrition bias) | Unclear risk | No report of missing data. No reports of attrition and exclusions |
| Selective reporting (reporting bias) | High risk | Prespecified measures 'balance' and 'number of falls' not reported at 8 weeks |
| Other bias | Low risk | No other apparent risks of bias |
| Methods | Design: cluster RCT | |
| Participants | Characterisation: residents with self‐care dependency needs Nursing and residential homes: +5 beds with residents > 65 years with self‐care dependency needs | |
| Interventions | Study aim or objective: to investigate the feasibility, acceptability, and potential efficacy of group exercise for residents in care homes 2 groups: Intervention: exercise group (N = 28) Control: control group (N = 28) | |
| Outcomes | Physical function in ADL: RMI (Collen 1991) | |
| Notes | ‐ | |
| Risk of bias | ||
| Bias | Authors' judgement | Support for judgement |
| Random sequence generation (selection bias) | Low risk | Quote: "Randomization was performed...using computer‐generated random numbers" |
| Allocation concealment (selection bias) | Low risk | Quote: "Randomization was performed by an independent principal statistician from Birmingham Clinical Trials Unit" |
| Blinding of participants and personnel (performance bias) | High risk | Personnel designed and delivered the intervention to exercise, but control received usual care, so personnel knew. No report of blinding of participants ‐ although, intervention and control groups were in separate homes, so may not have been aware of which group they were in |
| Blinding of outcome assessment (detection bias) | Low risk | Quote: "Assessments were conducted...by one of two research staff... masked to group allocation" |
| Incomplete outcome data (attrition bias) | Low risk | Same number of losses to follow up in each group |
| Selective reporting (reporting bias) | Unclear risk | Protocol unavailable |
| Other bias | Low risk | No other apparent risks of bias |
| Methods | Design: Cluster RCT | |
| Participants | Country: USA Inclusion criteria: their current health status did not preclude participation, aged = 60, could speak and understand English, cognitively comprehend and answer questions, communicate verbally or in writing, were willing to participate in indoor gardening activities for 6 weeks Exclusion criteria: see inclusion criteria % Eligible within home: not reported Experimental group 1: N = 33, men = 6 | |
| Interventions | Study aim or objective: the effects of indoor gardening on socialisation, activities of daily living, and perceptions of loneliness Phase 1: residents in home A comprised experimental group 1 and participated in an indoor gardening project once a week for 5 weeks; home B, the control group, received 20‐minute visits over the same 5‐week period Phase 2: residents of home B became experimental group 2 and participated in indoor gardening twice a week for 2 weeks Intervention: decorating flowerpots and planting bulbs of their choice, choosing and transplanting colourful flowering plants, discussing proper care of plants, viewing video on gardening, arranging plants in a hanging basket, arranging fresh cut flowers and greenery Control: 20‐minute visits during the 5‐week intervention period to control for social interaction and changes due to the presence of experimenters; control group then invited to participate in the gardening (phase 2) | |
| Outcomes | Physical function in ADL: MDS: transfer item (Brown 2004), MDS: eating item (Brown 2004), MDS: locomotion item (Brown 2004), MDS: grooming item (Brown 2004), MDS: dressing item (Brown 2004), MDS: bathing item (Brown 2004), MDS: Physical Functioning scale (6 items, Brown 2004) | |
| Notes | Funding: not reported | |
| Risk of bias | ||
| Bias | Authors' judgement | Support for judgement |
| Random sequence generation (selection bias) | Low risk | Quote: "A coin toss was used to determine the assignment of each nursing home" |
| Allocation concealment (selection bias) | High risk | Coin toss ‐ allocation could have been foreseen by researchers |
| Blinding of participants and personnel (performance bias) | High risk | Unblinded participants and personnel |
| Blinding of outcome assessment (detection bias) | Unclear risk | Outcome assessor unreported |
| Incomplete outcome data (attrition bias) | Unclear risk | No report of loss to follow up or otherwise |
| Selective reporting (reporting bias) | High risk | Only some sub‐scales reported for some comparisons |
| Other bias | Low risk | No other apparent risks of bias |
| Methods | Design: RCT | |
| Participants | Country: Denmark Inclusion criteria: see exclusion criteria Exclusion criteria: cognitive = moderate/severe cognitive impairment; medical = acute illness, hypertension, severe cardiovascular disease, severe impairment of motor function, neurological disorder % Eligible within home: not reported Intervention: N = 10; men:women ratio = 1:9; age = 88.6 years (86 to 95 years) Control: N = 11; men:women ratio = 1:10; age = 90.6 years (86 to 95 years) | |
| Interventions | Study aim or objective: to test the hypothesis that physical exercise induces an anti‐inflammatory response that is associated with reduced chronic activation of the tumour necrosis factor (TNF)‐alpha system in frail elders and that the increase in muscle strength after resistance training is limited by systemic low‐grade inflammation Number of experimental groups: 2 Exercise features: training protocol from Harridge 1999. 3 exercise sessions a week for 12 weeks, low repetitions with high weight resistance, seated upright in training chair. 3 sets of 8 knee extensions Non‐exercise features: subgroup of participants gave blood samples for examining inflammatory marker Control: occupational therapist supervised social activities twice a week for 12 weeks; no physical training | |
| Outcomes | Muscle power (anaerobic): knee flexor muscle strength, knee extensor muscle strength | |
| Notes | Funding: Danish Medical Research Council NOVO Foundation | |
| Risk of bias | ||
| Bias | Authors' judgement | Support for judgement |
| Random sequence generation (selection bias) | Unclear risk | Quote: "Participants were randomly assigned..." |
| Allocation concealment (selection bias) | Unclear risk | Insufficient information provided |
| Blinding of participants and personnel (performance bias) | High risk | No report of blinding of participants, but social control intervention with physical outcome measures, so intervention would have been obvious |
| Incomplete outcome data (attrition bias) | High risk | Excluded results of the two men from the analysis |
| Selective reporting (reporting bias) | Unclear risk | Protocol unavailable |
| Other bias | Low risk | No other apparent risks of bias |
| Methods | Design: RCT Treatment group significantly older than control group (P = 0.03) Losses to follow up: 6 (14%) | |
| Participants | Country: Belgium Randomised: 42 Consent: not specified Inclusion criteria: ambulatory, no major cognitive disorders that would effect their ability to complete questionnaires Exclusion criteria: medical = people with a high risk or thromboembolism, history of hip or knee replacement % Eligible within home: not reported Intervention (vibration therapy plus physiotherapy): N = 22; % women = 81; age: mean: 83.6 years ± 4.8 years Control (physiotherapy alone): N = 20; % women = 65; age(mean) = 78.9 years ± 6.9 years | |
| Interventions | Study aim or objective: to investigate the effects of whole body vibration in the elderly Groups: randomised to receive vibration intervention plus a standard physical training regimen or physical training alone Exercise features: Intervention – controlled whole body vibration: at each session stood on vertical vibrating platform for 4 series of 1 minute of vibration alternating with 90 seconds of rest, vibration set at 10 Hz for the first and third series with peak to peak amplitude of 3 mm; for second and fourth series, vibration set at 26 Hz with peak to peak 7 mm, blood pressure and pulse were taken before the first series, immediately after the second and fourth series, and 2 minutes after the fourth series in each session Physical therapy: standard exercise programme, gait and balance exercises, training in transfer skill, strengthening exercises with resistive mobilisation of lower limbs, 3 times weekly for 10 minutes during the 6‐week study, provided by only 1 physical therapist | |
| Outcomes | Physical function in ADL: TUG test (seconds) (Podsiadlo 1991) | |
| Notes | Funding: not reported; no commercial party had any financial interests | |
| Risk of bias | ||
| Bias | Authors' judgement | Support for judgement |
| Random sequence generation (selection bias) | Unclear risk | No information provided on randomisation procedure |
| Allocation concealment (selection bias) | Unclear risk | Insufficient information provided |
| Blinding of participants and personnel (performance bias) | High risk | No evidence of blinding. The potential influence of the additional treatment in the intervention group, and outcome expectations of the intervention provider could have influenced participant response |
| Blinding of outcome assessment (detection bias) | Unclear risk | No information provided |
| Incomplete outcome data (attrition bias) | High risk | Lost to follow up from intervention (27%); none lost from control. ITT analysis undertaken utilising last available data |
| Selective reporting (reporting bias) | High risk | Some results were reported as ITT analysis, others as per‐protocol (possible selective reporting) |
| Other bias | Low risk | No other apparent risks of bias |
| Methods | Design: RCT | |
| Participants | Country: USA Consent: assent accepted Inclusion criteria: diagnosis of dementia, family consent, stable on medications, resident in the home for 3 months Exclusion criteria: medical: use of tacrine, a drug used in the treatment of Alzheimer's disease (centrally acting anticholinesterase) % Eligible within home: not reported | |
| Interventions | Study aim or objective: to assess the impact of a highly structured interdisciplinary programme of sensorimotor activities on the function and behaviour of nursing‐home residents with dementia Number of experimental groups: 2 Intervention: first 10‐week period: Intervention provided by certified therapeutic recreation specialists in collaboration with the unit managers; design based on level of functioning, personal care schedule, and interests; small group activities among people of similar functioning; co‐ordinated schedule of care established for the treatment group including all aspects of care and therapeutic programming; staff were encouraged to walk with residents, interact socially, and promote functional independence during activities; intervention participants received therapeutic programming and diversional stimulatory activities throughout the day and evening; every aspect of the day considered programming and outcome‐based – all sensory motor activities, no matter how mundane (e.g. hand washing, waking to meals); cooking, herb gardening, group cognitive therapy, fitness sessions, various sensory (water, relaxation activities); second 10‐week period: home staff took over 50% of the programming; third 10‐week period: nursing‐home staff took over all aspects of the programming Control: usual care: same schedule of regular nursing‐home activities and standard nursing care | |
| Outcomes | Physical function in ADL: timed walk over 50 feet | |
| Notes | Funding: National Alzheimer's Association | |
| Risk of bias | ||
| Bias | Authors' judgement | Support for judgement |
| Random sequence generation (selection bias) | Low risk | Quote: "...by name draw without replacement" |
| Allocation concealment (selection bias) | Unclear risk | Insufficient information provided |
| Blinding of participants and personnel (performance bias) | High risk | No blinding of participants |
| Blinding of outcome assessment (detection bias) | Low risk | All evaluators blind to group assignment |
| Blinding of outcome assessment (detection bias) | Low risk | All evaluators blind to group assignment |
| Incomplete outcome data (attrition bias) | Unclear risk | 12 participants died, and 2 were not stable on medications ‐ data from these 14 eliminated from final data analysis |
| Selective reporting (reporting bias) | High risk | MOSES outcomes not reported |
| Other bias | Unclear risk | Risk of contamination: randomisation of individual residents, but intervention involved some staff training, so possibility of confounding |
| Methods | Design: RCT | |
| Participants | Characterisation: visually‐impaired elderly | |
| Interventions | Study aim or objective: to examine the effects of an exercise programme, which focused on improvement of the functional balance of visually‐impaired elderly people Intervention: exercise training (experimental) (N = 27) | |
| Outcomes | Physical function in ADL: TUG (Timed Up and Go) test (seconds) (Podsiadlo 1991) Falls, risk and fear of falling: falls (any episodes for participant) | |
| Notes | ‐ | |
| Risk of bias | ||
| Bias | Authors' judgement | Support for judgement |
| Random sequence generation (selection bias) | Unclear risk | No information provided on random sequence generation |
| Allocation concealment (selection bias) | Low risk | Quote: "Participants were randomly assigned...by drawing from a sealed opaque envelope that contained the number that determined the allocation" |
| Blinding of participants and personnel (performance bias) | High risk | Both control and experimental exercise programmes were designed and conducted by two physiotherapists |
| Blinding of outcome assessment (detection bias) | Low risk | Quote: "Assessment of the functional status of the subjects was conducted by a third physiotherapist who was blinded to the grouping of the subjects" |
| Incomplete outcome data (attrition bias) | Low risk | No losses to follow up in either group |
| Selective reporting (reporting bias) | Unclear risk | Protocol unavailable |
| Other bias | Low risk | No other apparent risks of bias |
| Methods | Design: RCT | |
| Participants | Characterisation: older adults
(5 and 6 were evaluated by their general practitioner) | |
| Interventions | Study aim or objective: to examine the effect of different training protocols on quality of life, vitality, and depression of older adults living in long‐term care facilities Control 2 (of 3): strength training (N = 57) | |
| Outcomes | Physical function in ADL: walking speed over 8 metres, disability in 17 ADLs (Chin A Paw 2006), putting on and off a coat, picking up a pen from the floor while standing | |
| Notes | ‐ | |
| Risk of bias | ||
| Bias | Authors' judgement | Support for judgement |
| Random sequence generation (selection bias) | Low risk | Quote: "The random allocation sequence was generated by computer" |
| Allocation concealment (selection bias) | Low risk | Two independent students assigned participants to their group ‐ implies allocation was concealed |
| Blinding of participants and personnel (performance bias) | Unclear risk | No mention of blinding of participants, but there were four different groups so participants may not have been aware which ones were experimental and which was the control |
| Blinding of outcome assessment (detection bias) | Low risk | Quote: "Data were collected at baseline and after 6 months intervention by three trained research assistants who were blinded to group assignment" |
| Blinding of outcome assessment (detection bias) | Low risk | Quote: "Data were collected at baseline and after 6 months intervention by three trained research assistants who were blinded to group assignment" |
| Incomplete outcome data (attrition bias) | Low risk | Quote: "Dropout of participants was not significantly different among the four groups". Similar reasons for dropout between groups |
| Selective reporting (reporting bias) | Unclear risk | Stated that they were going to report body composition measurements ‐ only referred to in text in associated paper (Chin A Paw 2006) |
| Other bias | Low risk | No other apparent risks of bias |
| Methods | Design: Cluster RCT Strength of ankle dorsiflexors (control group stronger) Balance (control group had better balance both with eyes open and eyes closed) Mobility (control group more mobile) Losses to follow up: 9 (13.2%) | |
| Participants | Country: South Korea Consent: assent accepted Inclusion criteria: ambulatory adults aged over 60 with at least 1 of the following: impaired gait (score of < 10 on gait sub‐scale (maximum score of 12) of the Performance Orientated Assessment of Mobility (POAM)), impaired balance (score of < 14 on POAM balance sub‐scale (maximum 16), history of falling in the previous year, postural hypotension (drop in systolic blood pressure of 20 mmHg from lying to standing, use of 4 or more prescription medications that may affect balance Exclusion criteria: cognitive = severe dementia (score < 20 on Folstein MMSE); medical = inability to complete 12 weeks of exercise because of physical illness; functional = current involvement in any type of regular exercise % Eligible within home: not reported Intervention: N = 29; % women = 79; age (mean) = 76.96 years ± 7.7 years Control: N = 30; % women = 70; age (mean) = 78.73 years ± 6.9 years | |
| Interventions | Study aim or objective: to determine changes in physical fitness (knee and ankle muscle strength, balance, flexibility, and mobility), fall avoidance efficacy, and fall episodes of institutionalised adults after participating in a 12‐week Sun‐style Tai Chi exercise programme Number of experimental groups: 2 Exercise features: Sun style Tai Chi, 10 minutes warming up, 20 minutes of 12 Tai Chi movements, 5 minutes of cooling down, done to music for soothing effect Control: maintained routine activities; did not participate in any regular exercise classes | |
| Outcomes | Falls: falls (any episodes for participant) | |
| Notes | Funding: not reported | |
| Risk of bias | ||
| Bias | Authors' judgement | Support for judgement |
| Random sequence generation (selection bias) | Low risk | Selected two facilities (based on number of residents, location, and facilities) and randomly assigned them to either the experimental or control group by coin tossing |
| Allocation concealment (selection bias) | High risk | Coin toss ‐ allocation could have been foreseen by researchers |
| Blinding of participants and personnel (performance bias) | High risk | Quote: "Participants were aware of their group assignment" |
| Blinding of outcome assessment (detection bias) | Unclear risk | Quote: "Professional team rather than the research team measured physical fitness" |
| Incomplete outcome data (attrition bias) | Low risk | 'As treated' analysis done ‐ measures not reported for all participants initially included, but only two departed from allocation |
| Selective reporting (reporting bias) | Unclear risk | Protocol unavailable |
| Other bias | Low risk | No other apparent risks of bias |
| Methods | Design: RCT | |
| Participants | Characterisation: institutionalised elderly people with mixed dementia | |
| Interventions | Study aim or objective: to analyse the effects of multidisciplinary or physiotherapeutic rehabilitation interventions on the cognition and balance of institutionalised elderly people with mixed dementia | |
| Outcomes | Physical function in ADL: TUG test (steps) (Christofoletti 2008), TUG test (seconds) (Podsiadlo 1991) | |
| Notes | ‐ | |
| Risk of bias | ||
| Bias | Authors' judgement | Support for judgement |
| Random sequence generation (selection bias) | Low risk | Quote: "A sealed envelope with an identification number was assigned to each subject, each one filled with a slip giving the group. When a patient was registered and given a number, the appropriate envelope was opened" |
| Allocation concealment (selection bias) | Low risk | Quote: "A sealed envelope with an identification number was assigned to each subject, each one filled with a slip giving the group. When a patient was registered and given a number, the appropriate envelope was opened" |
| Blinding of participants and personnel (performance bias) | High risk | Quote: "As a common bias presented on most rehabilitation trials, it was not possible to 'blind' the subjects regarding the treatments" |
| Blinding of outcome assessment (detection bias) | Low risk | Quote: "Assessors were 'masked' with respect to the data collected and to those patients that were included or not in this trial" |
| Incomplete outcome data (attrition bias) | High risk | Because of small initial group sizes (mean = 18), the loss of 5 from each intervention group compared with the loss of 3 from the control group may present potential bias |
| Selective reporting (reporting bias) | Unclear risk | Protocol unavailable |
| Other bias | Low risk | No other apparent risks of bias |
| Methods | Design: RCT | |
| Participants | Country: USA Consent: assent accepted Inclusion criteria: capable of communicating and following simple instructions Exclusion criteria: hypertension, debilitating arthritic impairment, requiring cardiac medication % Eligible within home: not reported Activity group: N = 10; 5 women Social group: N = 6; 4 women Control group: N = 7; 3 women | |
| Interventions | Study aim or objective: hypothesised that 12‐week physical activity programme would (1) increase total daily activity level, (2) upgrade participant self care, and (3) increase activity tolerance levels Number of experimental groups: 3 Activity group: stretching and postural exercise, modified weight and circuit training, dancing and walking; led by a therapist trained in physical education instruction and an assistant, for 1 hour, 5 sessions per week for 12 weeks Social group: recreational activities involving no physical exertion, e.g. board games, arts and crafts; led by a recreational therapist and an assistant, for 1 hour, 5 sessions per week for 12 weeks Control group: usual care | |
| Outcomes | Physical function in ADL: self‐care personal neatness evaluation (NOSIE‐30) | |
| Notes | Funding: National Institute of Mental Health (NIMH) U.S. Department of Health, Education, and Welfare (DHEW) Hospital improvement grant Eunice Kennedy Shriver National Institute of Child Health and Human Development (NICHD) grant | |
| Risk of bias | ||
| Bias | Authors' judgement | Support for judgement |
| Random sequence generation (selection bias) | Unclear risk | Quote: "Subjects were assigned randomly to one of three groups" |
| Allocation concealment (selection bias) | Unclear risk | Insufficient information provided |
| Blinding of participants and personnel (performance bias) | High risk | RCT with obvious control |
| Blinding of outcome assessment (detection bias) | Unclear risk | No information reported |
| Blinding of outcome assessment (detection bias) | Unclear risk | No information reported |
| Incomplete outcome data (attrition bias) | Low risk | Quote: "Only two subjects failed to complete the 12‐week experimental period, both in the social activity group" |
| Selective reporting (reporting bias) | Unclear risk | Protocol unavailable |
| Other bias | Low risk | No other apparent risks of bias |
| Methods | Design: RCT | |
| Participants | Country: Canada Inclusion criteria: diagnosis of Alzheimer's disease, MMSE less than 20, MMSE item 8 score of less than 3, ability to walk 5 metres with or without walking aid or supervision Exclusion criteria: medical: cardiac conditions precluding ambulation % Eligible within home: not reported Walk and talk group: N = 30; mean age = 83.23 years (SD 8.34); 16 women Talk‐only group: N = 30; mean age = 81.68 years (SD 7.36); 15 women Control group: N = 26; mean age = 79.78 years (SD 8.30); 8 women | |
| Interventions | Study aim or objective: to investigate the effects of a walking/talking programme on communication, ambulation, and level of function on people with Alzheimer's disease Number of experimental groups: 3 Exercise features: walking Non‐exercise features: talking Walk‐and‐talk group: to walk and talk as much as possible with rest as necessary (guided conversation), 30‐minute sessions, 5 sessions per week for 16 weeks, led by a research assistant Talk‐only group: guided conversation only, 30 minutes, 5 sessions per week for 16 weeks, led by a research assistant Control group: usual care | |
| Outcomes | Physical function in ADL: 2‐minute walk test (Cooper 1968; Cooper 1970) | |
| Notes | Funding: Alzheimer's Society of Canada | |
| Risk of bias | ||
| Bias | Authors' judgement | Support for judgement |
| Random sequence generation (selection bias) | Low risk | Quote: "Residents were assigned within each site to one of three groups using a table of random numbers" |
| Allocation concealment (selection bias) | Unclear risk | Insufficient information provided |
| Blinding of participants and personnel (performance bias) | High risk | Research assistants were blind to the group membership of the residents when completing the measures, but not to the study design |
| Blinding of outcome assessment (detection bias) | Low risk | Does not specifically report blinded assessment for this measurement. However, it does report 1 measure where they were not used, so assume blinded RAs used for measurement
|
| Blinding of outcome assessment (detection bias) | High risk | The nurses caring for the residents completed the LPRS. They were not blind to group membership |
| Incomplete outcome data (attrition bias) | High risk | Losses from each group significantly different P = 0.01 (talk‐only = 5, control = 7, and talk‐and‐walk = 0) |
| Selective reporting (reporting bias) | High risk | Not all observed ADL measures (i.e. LPRS in this study) were reported |
| Other bias | Low risk | No other apparent risks of bias |
| Methods | Design: RCT | |
| Participants | Country: Canada Consent: fully‐informed consent Inclusion criteria: ability to ambulate independently without walking aid, eyesight sufficiently good to read large new print, hearing sufficiently good to hear instructions in normal speaking voice, ability to understand instructions, and ability to participate in exercise programme Exclusion criteria: see inclusion criteria % Eligible within home: 69 Intervention: N = 25 | |
| Interventions | Study aim or objective: to test the hypothesis that increase in postural sway is due to nervous system deterioration, and as a consequence, no improvement is possible – irreversible loss of function Number of experimental groups: 2 Exercise features: exercise class delivered by physiotherapists, activities conducted aim to improve breathing, single and double limb balance, co‐ordination, flexibility, antigravity strength, trunk and ankle strength, and promote general relaxation Control: usual care | |
| Outcomes | Balance: postural sway (measured on a force platform; lateral and anteroposterior sway measured with eyes open and eyes closed) | |
| Notes | Funding: Canadian Geriatrics Society | |
| Risk of bias | ||
| Bias | Authors' judgement | Support for judgement |
| Random sequence generation (selection bias) | Low risk | Quote: "Subjects were randomized into an exercise or control group using the Rand Corporation random tables" |
| Allocation concealment (selection bias) | Unclear risk | Insufficient information provided |
| Blinding of participants and personnel (performance bias) | High risk | No mention of blinding of participants, but usual care in same setting, so intervention would have been obvious |
| Incomplete outcome data (attrition bias) | Low risk | 2 participants dropped out of the exercise group ‐ may be related to intervention, but less than 10% of group |
| Selective reporting (reporting bias) | Unclear risk | Protocol unavailable |
| Other bias | Low risk | No other apparent risks of bias |
| Methods | Design: RCT | |
| Participants | Characterisation: senior hostel residents ADL status details: not reported | |
| Interventions | Study aim or objective: to evaluate the additional effect of functional exercises on balance and lower extremity function among hostel‐dwelling elderly people partaking in strength training Intervention: strength and balance group (N = 16) | |
| Outcomes | Physical function (other): functional test for physical performance (Guralnik 1994), Tinetti Mobility Scale (gait and balance) (Tinetti 1986) | |
| Notes | ‐ | |
| Risk of bias | ||
| Bias | Authors' judgement | Support for judgement |
| Random sequence generation (selection bias) | Low risk | Stated used random number table |
| Allocation concealment (selection bias) | Unclear risk | Insufficient information provided |
| Blinding of participants and personnel (performance bias) | High risk | Stated that all exercise sessions were undertaken by a single exercise trainer. As a result he/she would have been aware of group status |
| Incomplete outcome data (attrition bias) | Low risk | Similar numbers lost for similar reasons |
| Selective reporting (reporting bias) | Unclear risk | Protocol unavailable |
| Other bias | Low risk | No other apparent risks of bias |
| Methods | Design: RCT, repeated measures cross‐over design | |
| Participants | Country: USA Consent: unspecified Inclusion criteria: score of 25 to 40 points on the Paracheck Geriatric rating scale Exclusion criteria: see inclusion criteria % Eligible within home: not reported Group 1: N = 10 | |
| Interventions | Study aim or objective: (1) materials‐based intervention would elicit more repetitions and greater distance of movement than imagery‐based occupation and rote exercise; (2) imagery‐based occupation would elicit more repetitions and greater distance of movement during physical activity than rote exercise Number of experimental groups: 3 Exercise features: materials‐based occupation involved kicking a balloon; imagery‐based occupation involved kicking an imaginary balloon; rote exercise involved being asked to kick your foot as in a demonstration; participants were asked to kick with the same foot as many times as possible before becoming tired Group 1: materials‐based occupation, followed by imagery‐based occupation, followed by rote exercise | |
| Outcomes | Physical function (other): vertical kicking speed, vertical kicking distance | |
| Notes | Funding: not reported | |
| Risk of bias | ||
| Bias | Authors' judgement | Support for judgement |
| Random sequence generation (selection bias) | Unclear risk | Quote: "Subjects were randomly assigned to three groups" |
| Allocation concealment (selection bias) | Unclear risk | Insufficient information provided |
| Blinding of participants and personnel (performance bias) | High risk | Cross‐over design ‐ all participants received all interventions ‐ it is likely that participants would have been able to tell which was the intervention under experiment and which was the control |
| Incomplete outcome data (attrition bias) | Low risk | No missing outcome data |
| Selective reporting (reporting bias) | Unclear risk | Protocol unavailable |
| Other bias | Low risk | Cross‐over design, but intervention unlikely to produce a carry‐over effect |
| Methods | Design: RCT | |
| Participants | Characterisation: ambulatory independent | |
| Interventions | Study aim or objective: to compare the effectiveness of unsupervised home and supervised group exercise on parameters related to risk of falling among older adults Intervention: Supervised group exercise (SGE) group (N = 21) | |
| Outcomes | Physical function in ADL: TUG test (seconds) (Podsiadlo 1991) | |
| Notes | ‐ | |
| Risk of bias | ||
| Bias | Authors' judgement | Support for judgement |
| Random sequence generation (selection bias) | Unclear risk | Quote: "...code number of each subject was written on a card and placed in an envelope, and the envelopes were then put in two groups by a person with no knowledge of the codes" |
| Allocation concealment (selection bias) | Low risk | Quote: "...code number of each subject was written on a card and placed in an envelope, and the envelopes were then put into two groups by a person with no knowledge of the codes" |
| Blinding of participants and personnel (performance bias) | High risk | Participants were in the same home; 1 group supervised, and 1 unsupervised so knowledge of allocation likely |
| Blinding of outcome assessment (detection bias) | Low risk | Quote: "The physiotherapist, who carried out all measurements, both at baseline and after the exercises, was also unaware of the group the subjects were in" |
| Incomplete outcome data (attrition bias) | Unclear risk | Slight imbalance in number of participants lost to follow up between groups (more in UHE group than in SGE group), although similar reasons across groups |
| Selective reporting (reporting bias) | Unclear risk | Protocol unavailable |
| Other bias | Low risk | No other apparent risks of bias |
| Methods | Design: RCT | |
| Participants | Characterisation: frail, long‐term care facility residents, aged 75 years or older | |
| Interventions | Study aim or objective: to examine the effects of structured strength and balance training in frail, elderly long‐term care residents Balance training (10 minutes): exercise balls, balance discs and blocks (20 cm high) used | |
| Outcomes | Physical function in ADL: BI (0 to 100 scale), FIM | |
| Notes | ‐ | |
| Risk of bias | ||
| Bias | Authors' judgement | Support for judgement |
| Random sequence generation (selection bias) | Unclear risk | Matched pairs "divided randomly" |
| Allocation concealment (selection bias) | Unclear risk | Insufficient information provided |
| Blinding of participants and personnel (performance bias) | High risk | No mention of blinding of participants, but RCT in same home and usual care as alternative |
| Blinding of outcome assessment (detection bias) | Unclear risk | Neither the psychologist nor the physiotherapist, who tested muscle function, were informed by the study organisers to which group participants were assigned. Unclear who assessed BI and FIM and if assessors were blinded to allocation |
| Incomplete outcome data (attrition bias) | Unclear risk | Same number of losses to follow‐up in each group, but unclear if reasons for losses to follow‐up were different between groups |
| Selective reporting (reporting bias) | Unclear risk | Protocol unavailable |
| Other bias | Low risk | No other apparent risks of bias |
| Methods | Design: cluster RCT | |
| Participants | Country: the Netherlands Inclusion criteria: see exclusion criteria Exclusion criteria: cognitive: impaired cognition to the extent that they could not process information provided during the testing and exercising; medical = GP judged whether there was a medical contraindication to exercising; functional = unable to walk more than 6 metres independently (aids allowed) % Eligible within home: not reported Functional walking: N = 130 (7 residences); 80 allocated intervention, 50 allocated control In balance: N = 148 (8 residences); 94 allocated intervention, 54 allocated control | |
| Interventions | Study aim or objective: to determine the effects of moderate intensity group‐exercise programme on falls, functional performance, and disability in older adults, and to investigate the effect of frailty on outcome Number of experimental groups: 4 All participants (including control) required to report levels of physical activity to monitor and control contamination from the intervention Interventions: 2 exercise programmes, both with evidence that they were effective in preventing falls, 1 session per week for 4 weeks followed by bi‐weekly sessions for 16 weeks, 90‐minute sessions including 30‐minute social element intended to increase motivation; all groups had their own instructor and assistant Functional walking: 10 exercises: balance, mobility, and transfer training | |
| Outcomes | Risk of falling: time to first fall | |
| Notes | Funding: not reported; no commercial party had any financial interests | |
| Risk of bias | ||
| Bias | Authors' judgement | Support for judgement |
| Random sequence generation (selection bias) | Unclear risk | Quote: "The participating homes were randomly assigned to one of the two exercise intervention programs, using sealed envelopes. Participants in each of the homes were then randomly distributed across an intervention and a control group, using computer‐generated random numbers. The maximum size of the exercise group in each home was set at 12, with the provision that the control group should contain at least 5 participants" |
| Allocation concealment (selection bias) | Unclear risk | Quote: "The participating homes were randomly assigned to one of the two exercise intervention programs, using sealed envelopes" |
| Blinding of participants and personnel (performance bias) | High risk | Quote: "The outcome of the randomization was notified to the participants in a letter after baseline assessment" |
| Blinding of outcome assessment (detection bias) | Unclear risk | Insufficient information ‐ no information included about who undertook the outcome measures |
| Blinding of outcome assessment (detection bias) | Unclear risk | Insufficient information ‐ no information included about who undertook the outcome measures |
| Incomplete outcome data (attrition bias) | Unclear risk | ITT analysis stated. However, baseline figures do not match number of participants initially randomised. 6 participants excluded from analyses of fall data because there was no reliable data available; 30 participants excluded from analyses of physical function and disability data because of missing post‐intervention assessment (24 of whom had dropped out of the study). Reasons not given per group and unclear impact on outcomes |
| Selective reporting (reporting bias) | Unclear risk | Protocol unavailable |
| Other bias | Low risk | No other apparent risks of bias |
| Methods | Design: RCT Baseline difference in strength: exercise + nutrition participants significantly weaker than exercise‐alone participants Losses to follow up: 3 lost from exercise‐only group (1 lack of interest, 1 musculoskeletal pain, 1 pneumonia), 2 from supplement‐only group (1 death, 1 lack of interest), and 1 lost from control group because of death | |
| Participants | Country: USA Consent: not specified Inclusion criteria: aged over 70 years, residential status, ability to walk 6 metres Exclusion criteria: cognitive = severe cognitive impairment; medical = rapidly progressive or terminal illness, acute illness, unstable chronic illness, myocardial infarction, fracture of a lower extremity within 6 months before the study, insulin‐dependent diabetes mellitus, if they were on a weight loss diet or undergoing resistance training at the time of enrolment, if test of muscle strength revealed a musculoskeletal or cardiovascular abnormality % Eligible within home: 26.7 Exercise‐only group: N = 25; mean age = 86.2 years ± 1.0 mean SE; range = 72 to 95 years; 64% women Supplement‐only group: N = 24; mean age = 85.7 years ± 1.2 mean SE; range = 75 to 97 years; 71% women Exercise and supplement group: N = 25; mean age = 87.2 years ± 1.2 mean SE; range = 76 to 98 years; 64% women Control group: N = 26; mean age = 89.2 years ± 0.8 mean SE; range = 78 to 98 years; 54% women | |
| Interventions | Study aim or objective: hypothesis: physical frailty is partially mediated by skeletal‐muscle disuse and marginal nutritional intake, and should therefore be reduced by interventions designed to reverse those deficits Number of experimental groups: 4 A therapeutic recreation specialist delivered the exercise components Exercise‐only group: high‐intensity progressive resistance training of the hip and knee extensors, commencing at 80% of 1 repetition max and progressing as able Supplement‐only group: 240 ml Exceed micronutrient supplement drink daily, representing 360 kilocalories, delivered in an unmarked container Exercise and supplement group: comprised both interventions Control group: 240 ml of a minimally nutritive liquid delivered in the same way, plus 3 activities of the participants' choice offered by the same service, but excluding resistance training | |
| Outcomes | Physical function in ADL: gait velocity over a 6.1 metre course (Fiatarone 1994) | |
| Notes | Funding: National institute of Ageing Agricultural Research Service Public Health Service of Hebrew Rehabilitation Centre, Massachusetts Brookdale Foundation | |
| Risk of bias | ||
| Bias | Authors' judgement | Support for judgement |
| Random sequence generation (selection bias) | Unclear risk | No information provided on randomisation procedure |
| Allocation concealment (selection bias) | Unclear risk | Insufficient information provided |
| Blinding of participants and personnel (performance bias) | High risk | Study performed in one home. As a result, it would have been difficult to blind participants and would have been obvious which groups they were assigned to |
| Blinding of outcome assessment (detection bias) | Unclear risk | Not clear who performed mobility outcome assessments |
| Incomplete outcome data (attrition bias) | High risk | Outcome data missing for some participants because of technical problems or illness at time of testing |
| Selective reporting (reporting bias) | Unclear risk | Protocol unavailable |
| Other bias | Low risk | No other apparent risks of bias |
| Methods | Design: cluster RCT | |
| Participants | Country: UK Consent: fully‐informed Inclusion criteria: > 70 years, mobile, able to participate in test battery, no medical conditions that would interfere with safety regarding training program Exclusion criteria: 6 participants were excluded, but no reasons given % Eligible within home: 76.9 Intervention group: N = 10; mean age = 88 ± 5 years; all women Control group: N = 10; mean age = 87 years ± 4 years; 9 women | |
| Interventions | Study aim or objective: study question: is it possible to improve functional ability in older people by getting them to practise the functional tasks themselves? Number of experimental groups: 3 Exercise features: circuit of 8 functional exercises for 30 seconds initially progressing to a maximum of 1 minute, then increasing difficulty of task Control: reminiscence and recreational sessions; gentle, seated range of movement exercises (trunk and upper limbs only) Personnel delivering interventions not specified | |
| Outcomes | Physical function in ADL: stair ascent/descent, walking distance in 15 seconds | |
| Notes | Funding: not reported | |
| Risk of bias | ||
| Bias | Authors' judgement | Support for judgement |
| Random sequence generation (selection bias) | Unclear risk | This was a cluster randomised trial. No evidence as to how randomisation was determined |
| Allocation concealment (selection bias) | Unclear risk | No evidence to demonstrate if individuals were recruited into the trial before/after the homes had been randomised to intervention or control |
| Blinding of participants and personnel (performance bias) | Unclear risk | No evidence of blinding |
| Blinding of outcome assessment (detection bias) | Unclear risk | No evidence of blinding |
| Incomplete outcome data (attrition bias) | High risk | Missing outcome data (5 dropouts; 4 from intervention) |
| Selective reporting (reporting bias) | Unclear risk | In the results, confidence intervals are only reported for some results (not clear why) |
| Other bias | Low risk | No other apparent risks of bias |
| Methods | Design: RCT | |
| Participants | Country: Canada Consent: assent accepted No participants were currently involved in any physical exercise programme or had any recent exercise history Inclusion criteria: ability to follow directions; ability to walk across a room (with or without assistive device); no recent history of cardiovascular, cerebral vascular, respiratory, systemic, muscular, or uncontrolled metabolic disease Exclusion criteria: see inclusion criteria % Eligible within home: not reported Control: N = 10; 75 to 87 years | |
| Interventions | Study aim or objective: examine the effect of an onsite and simple progressive lower body training programme designed to improve muscle power on functional abilities in frail older adults Number of experimental groups: 2 Exercise features: 10‐minute warm‐up and stretch, strengthening components utilised seated and standing components focusing in lower‐body muscle groups, Thera‐Bands® gradually introduced to increase resistance, number of exercise repetitions were gradually increased and a speed element introduced, 10‐minute cool‐down, personnel delivering interventions not specified Control: no active or placebo intervention, asked to perform no more or no less activity than normal on a daily basis | |
| Outcomes | Physical function in ADL: six‐metre walk (time), TUG test (modified to 8 feet) (Bassey 1992; Rikli 1999) | |
| Notes | Funding: not reported | |
| Risk of bias | ||
| Bias | Authors' judgement | Support for judgement |
| Random sequence generation (selection bias) | Low risk | Quote: "Subjects were randomly assigned in a lottery format" |
| Allocation concealment (selection bias) | Unclear risk | Insufficient information provided |
| Blinding of participants and personnel (performance bias) | High risk | RCT with usual care control, so obvious group assignment |
| Blinding of outcome assessment (detection bias) | Unclear risk | No report of blinding |
| Incomplete outcome data (attrition bias) | Unclear risk | Differential loss to follow up but seems unlikely to be related to intervention |
| Selective reporting (reporting bias) | Unclear risk | Protocol unavailable |
| Other bias | Low risk | No other apparent risks of bias |
| Methods | Design: RCT | |
| Participants | Country: USA Consent: assent accepted Inclusion criteria: > 65 years old, some deficits in self care – requiring assistance with dressing, grooming, and feeding Exclusion criteria: see inclusion criteria % Eligible within home: not reported | |
| Interventions | Study aim or objective: to test the assumption that elderly individuals participating in a range of motion exercise programme will show more of an increase in self care in hygiene and eating than those who do not Exercise features: upper limb and lower limb range of movement exercises; personnel delivering the intervention were not described Control: movies only | |
| Outcomes | Physical function in ADL: Performance Test of Activities of Daily Living (PADL) | |
| Notes | Funding: not reported | |
| Risk of bias | ||
| Bias | Authors' judgement | Support for judgement |
| Random sequence generation (selection bias) | Unclear risk | No information provided on randomisation procedure |
| Allocation concealment (selection bias) | Unclear risk | Insufficient information provided |
| Blinding of participants and personnel (performance bias) | High risk | No mention of blinding of participants, but control group watched movies, and outcome measure was physical so intervention would have been obvious |
| Blinding of outcome assessment (detection bias) | Unclear risk | No details provided |
| Incomplete outcome data (attrition bias) | Unclear risk | No information about losses to follow up |
| Selective reporting (reporting bias) | High risk | Results for pre and post PADL not reported |
| Other bias | Low risk | No other apparent risks of bias |
| Methods | Design: cluster RCT | |
| Participants | Characterisation: elderly care‐home residents | |
| Interventions | Study aim or objective: to assess the effectiveness of an activity programme in improving function, quality of life, and falls in older people in residential care | |
| Outcomes | Physical function in ADL: Late Life Function and Disability Instument (LLFDI) (Sayers 2004), TUG test (seconds) (Podsiadlo 1991), Elderly Mobility Scale (EMS) (Smith 1994) | |
| Notes | ‐ | |
| Risk of bias | ||
| Bias | Authors' judgement | Support for judgement |
| Random sequence generation (selection bias) | Low risk | Randomised homes to the intervention or control group using computer generated random numbers |
| Allocation concealment (selection bias) | Low risk | Quote: "...a biostatistician not involved in recruitment randomized homes to the intervention or control group..." |
| Blinding of participants and personnel (performance bias) | Unclear risk | Cluster design so potential for blinding, but not specifically reported |
| Blinding of outcome assessment (detection bias) | Low risk | Quote: "...research nurses blinded to the group allocation of the homes used standardised methods to assess outcomes..." |
| Blinding of outcome assessment (detection bias) | Low risk | Quote: "...research nurses blinded to the group allocation of the homes used standardised methods to assess outcomes..." |
| Incomplete outcome data (attrition bias) | Low risk | Large losses, but balanced and similar reasons |
| Selective reporting (reporting bias) | Unclear risk | Protocol unavailable |
| Other bias | Low risk | No other apparent risks of bias |
| Methods | Design: RCT | |
| Participants | Country: USA Consent: fully‐informed consent Inclusion criteria: permission of participants' physicians was sought; no participants had any acute illness Exclusion criteria: see inclusion criteria % Eligible within home: not reported Intervention group: N = 12; mean age = 87 year; range = 72 to 101 years; 9 women Control group: N = 12; mean age = 82 years; range = 74 to 100 years; 9 women | |
| Interventions | Study aim or objective: the programme addressed physical activity and psychosocial needs, such as learned helplessness and sadness, without placing additional strain on the hectic schedules of staff Number of experimental groups: 2 Exercise features: Control: participated in usual home activities, with opportunity to participate in sit and get fit programme after the study period | |
| Outcomes | Flexibility: ankle dorsiflexion and plantarflexion (range of motion), shoulder abduction, hip flexion and extension, elbow flexion and extension, shoulder anterior flexion, knee flexion (range of movement) | |
| Notes | Funding: not reported | |
| Risk of bias | ||
| Bias | Authors' judgement | Support for judgement |
| Random sequence generation (selection bias) | Unclear risk | No information provided on randomisation procedure |
| Allocation concealment (selection bias) | Unclear risk | Insufficient information provided |
| Blinding of participants and personnel (performance bias) | High risk | No information provided, but RCT with obvious intervention/control |
| Incomplete outcome data (attrition bias) | Low risk | No attrition |
| Selective reporting (reporting bias) | High risk | Pre and post data not reported in an appropriate format (only reported as percentage change; no absolute figures) |
| Other bias | Low risk | No other apparent risks of bias |
| Methods | Design: RCT | |
| Participants | Country: USA Consent: not specified Inclusion criteria: Parachek score > 25 Exclusion criteria: see inclusion criteria % Eligible within home: not reported | |
| Interventions | Study aim or objective: tested the hypothesis that materials‐based occupation elicits a greater number of repetitions during physical activity in elderly persons than rote exercise Number of experimental groups: 3 Exercise features: materials‐based occupation (kicking balloon); imagery‐based occupation (kicking imaginary balloon); rote exercise (kicking foot as demonstrated) Group 1: materials‐based occupation, then imagery‐based occupation, then rote exercise Participants were instructed to kick as many times as possible and stop when too tired to continue All interventions were supervised by a research assistant, conducted in one‐off sessions, with 3 days in between each 1 | |
| Outcomes | Endurance (physical other): kicking repetitions | |
| Notes | Funding: not reported | |
| Risk of bias | ||
| Bias | Authors' judgement | Support for judgement |
| Random sequence generation (selection bias) | Unclear risk | Quote: "Subjects were randomly assigned..." |
| Allocation concealment (selection bias) | Unclear risk | Insufficient information provided |
| Blinding of participants and personnel (performance bias) | Unclear risk | Not addressed; all three groups received each intervention in different orders |
| Incomplete outcome data (attrition bias) | Low risk | No incomplete outcome data |
| Selective reporting (reporting bias) | Unclear risk | Protocol unavailable |
| Other bias | Low risk | Cross‐over design, but intervention unlikely to produce a carry‐over effect |
| Methods | Design: RCT | |
| Participants | Country: Canada Consent: assent accepted Inclusion criteria: able to stand with minimal assistance, ability to follow simple instructions Exclusion criteria: medical = recent cardiovascular event, vestibular disorder, uncontrolled hypertension, uncontrolled epilepsy, fracture within 4 months, total blindness/deafness, surgery planned for within the next 4 months; functional = holidays planned for within the next 4 months, recent admission (less than 3 months) % Eligible within home: not reported FFLTC (functional fitness for long‐term care) group: N = 55; mean age = 79.7 years; 29 women ROM (range of motion) group: N = 41; mean age = 80.4 years; 30 women | |
| Interventions | Study aim or objective: this study compared traditional range of motion to a 'functional fitness for long‐term care' programme designed to improve strength, balance, flexibility, gait, functional capacity, and strength Number of experimental groups: 2 Exercise features: ROM group: comprised seated exercise to improve range of movement (fingers, hands, arms, knees, ankles), relaxation, vocal exercise, and word/memory games Groups were of mixed ability, supervised by recreation staff | |
| Outcomes | Physical function in ADL: gait speed over 7 metres (self‐selected normal pace), gait speed over 7 metres (fast pace), TUG test (seconds) (Podsiadlo 1991), FIM | |
| Notes | Funding: grants from the Canadian Fitness and Lifestyle Research Institute, The Walter J. Blackburn Family Foundation, The Richard Ivey Foundation, and the Ontario Ministry of Health Long‐term Care | |
| Risk of bias | ||
| Bias | Authors' judgement | Support for judgement |
| Random sequence generation (selection bias) | Low risk | Stated used a random number table |
| Allocation concealment (selection bias) | Unclear risk | Insufficient information provided |
| Blinding of participants and personnel (performance bias) | Unclear risk | Blinding attempted, but potential that blinding was broken as participants were from the same setting |
| Blinding of outcome assessment (detection bias) | Low risk | TUG: stated research assistant blind to study condition |
| Blinding of outcome assessment (detection bias) | Low risk | FIM: stated research assistant blind to study condition |
| Incomplete outcome data (attrition bias) | High risk | Much higher attrition rate in FFLTC than ROM, 19/55 (35%) versus 9/41 (22%), and large numbers |
| Selective reporting (reporting bias) | Unclear risk | Protocol unavailable |
| Other bias | Low risk | No other apparent risks of bias |
| Methods | Design: cluster RCT | |
| Participants | Characterisation: nursing‐home residents Excluded: not reported | |
| Interventions | Study aim or objective: to examine the effect of Tai Chi on health‐related quality of life in nursing‐home residents | |
| Outcomes | Balance: balance (Single Limb Stand Timed test) | |
| Notes | ‐ | |
| Risk of bias | ||
| Bias | Authors' judgement | Support for judgement |
| Random sequence generation (selection bias) | Unclear risk | Author reports homes as randomised, but no information provided on randomisation procedure |
| Allocation concealment (selection bias) | Unclear risk | Insufficient information provided |
| Blinding of participants and personnel (performance bias) | High risk | Stated that the instructor was blind to outcome measures. However, participants could not have been |
| Incomplete outcome data (attrition bias) | Unclear risk | Figures not provided for loss to follow up (hospitalisation, death, or move to other home) for intervention or control group (presented as combined data only) |
| Selective reporting (reporting bias) | Unclear risk | Protocol unavailable |
| Other bias | Low risk | No other apparent risks of bias |
| Methods | Design: RCT | |
| Participants | Country: USA Consent: informed consent from participant or relative and from their doctor Inclusion criteria: nursing home long‐term care resident, physically capable of safe bilateral lower extremity weight‐bearing with supervision or minimal assistance, cognitively able to follow simple directions Exclusion criteria: cognitive = unable or generally unwilling to follow simple directions; medical = inability or medical restriction to bear weight on both lower extremities, less than 65 years of age; functional = participating in skilled rehabilitation (physical therapy or occupational therapy) immediately prior to study % Eligible within home: unclear Group breakdown: not given, 29 to 30 participants in each group | |
| Interventions | Study aim or objective: investigation of the effect of a standing exercise programme on the number of falls and the severity of intrinsic fall risk factors (functional losses of strength, balance and endurance, depression and number of infections) Number of experimental groups: 3 Intervention group: (group 1): comprised exercises in standing and walking activities, triggered when energetic music was played over intercom | |
| Outcomes | Falls: number of falls | |
| Notes | Funding: unclear | |
| Risk of bias | ||
| Bias | Authors' judgement | Support for judgement |
| Random sequence generation (selection bias) | Low risk | Quote: "Assignment to specific activities will be randomized by computer" |
| Allocation concealment (selection bias) | Unclear risk | Insufficient information provided |
| Blinding of participants and personnel (performance bias) | High risk | Blinding of participants would not have been possible ‐ participants would have been aware of which group they were in |
| Blinding of outcome assessment (detection bias) | Unclear risk | Unclear if assessor was blinded |
| Incomplete outcome data (attrition bias) | Low risk | Author states that the 6 participants who were unable to complete the post‐tests were "dispersed among the groups, with reasons for dropping out unrelated to the intervention" |
| Selective reporting (reporting bias) | Unclear risk | Protocol unavailable |
| Other bias | Low risk | No other apparent risks of bias |
| Methods | Design: RCT | |
| Participants | Characterisation: frail elderly women | |
| Interventions | Study aim or objective: to evaluate the effects of exercise therapy using the Takizawa Program | |
| Outcomes | Physical function in ADL: FIM | |
| Notes | ‐ | |
| Risk of bias | ||
| Bias | Authors' judgement | Support for judgement |
| Random sequence generation (selection bias) | Unclear risk | No information provided on randomisation procedure |
| Allocation concealment (selection bias) | Unclear risk | Insufficient information provided |
| Blinding of participants and personnel (performance bias) | High risk | No report of blinding of participants, but usual care so intervention would have been obvious |
| Blinding of outcome assessment (detection bias) | Low risk | Quote: "The evaluators of FIM in this study were the care workers who provided daily care to the patients, and were blind to the patient’s assignments to the Ex or Co group" |
| Incomplete outcome data (attrition bias) | Unclear risk | Slightly more losses to follow up in exercise group than in control group, although same reason provided across groups |
| Selective reporting (reporting bias) | Unclear risk | Protocol unavailable |
| Other bias | Low risk | No other apparent risks of bias |
| Methods | Design: cluster RCT | |
| Participants | Country: Scotland, UK Consent: assent accepted Inclusion criteria: see exclusion criteria Exclusion criteria: cognitive: severe communication difficulties Residential homes all had identical entrance criteria, namely that residents should be able to toilet, dress, and walk independently % Eligible within home: not reported Intervention group: N = 20; mean age = 82.3 years (SD 6.9); 12 women Control group: N = 29; mean age = 79.3 years (SD 6.2); 21 women | |
| Interventions | Study aim or objective: to evaluate whether participation in regular exercise was acceptable to residents of old people's homes, and whether it produced significant improvements in balance, flexibility, strength, or functional capacity compared with a control group who participated in reminiscence sessions Number of experimental groups: 2 Exercise features: full upper limb and lower limb range of movement; seated exercises to music, intended to promote strengthening; exercise groups lasted for 45 minutes, and were conducted twice weekly for 7 months Control: music and reminiscence therapy designed to prompt social interaction | |
| Outcomes | Physical function in ADL: BI (0 to 20) | |
| Notes | Funding: The Mathew Trust The ICL Discretionary Trust | |
| Risk of bias | ||
| Bias | Authors' judgement | Support for judgement |
| Random sequence generation (selection bias) | Low risk | Quote: "Randomisation...prepared from a computer‐generated random numbers table" |
| Allocation concealment (selection bias) | Low risk | Quote: "Randomisation was by opening sealed envelopes supplied in sequence by the study co‐ordinator" |
| Blinding of participants and personnel (performance bias) | Unclear risk | No report of blinding of participants ‐ although exercise groups and reminiscence groups were in different homes, so participants possibly weren't aware if they were intervention or control |
| Blinding of outcome assessment (detection bias) | High risk | All measurements made by the same observer that provided the interventions |
| Incomplete outcome data (attrition bias) | High risk | More losses to follow up in exercise group (25%) than in control group (10%), and losses from exercise group include lack of interest |
| Selective reporting (reporting bias) | Unclear risk | Protocol unavailable |
| Other bias | Low risk | No other apparent risks of bias |
| Methods | Design: cluster RCT | |
| Participants | Country: Scotland, UK Consent: assent accepted Inclusion criteria: volunteers were not excluded on the basis of any medical condition Exclusion criteria: cognitive = severe communication difficulties % Eligible within home: not reported Control group: N = 29; mean age = 82.0 years (9.6); 25 women Residential homes all had identical entrance criteria, namely that residents should be able to toilet, dress, and walk independently | |
| Interventions | Study aim or objective: (1) what are the mechanisms of improvement seen in McMurdo 1993?, (2) in the institutionalised elderly, does participation in regular seated exercise strengthen the quadriceps muscles?, (3) is participation in such exercise associated with improved psychomotor or cognitive function? Number of experimental groups: 2 Exercise features: performed seated exercise to music, number of repetitions and gravity‐resisted exercises were increased during the course of the study, group format, supervised by research physiotherapist Control group: reminiscence therapy designed to prompt social interaction and group discussion, 45 minutes in duration, conducted twice weekly for 6 months, facilitated by research physiotherapist | |
| Outcomes | Physical function in ADL: step test | |
| Notes | Funding: not reported | |
| Risk of bias | ||
| Bias | Authors' judgement | Support for judgement |
| Random sequence generation (selection bias) | Low risk | Quote: "Randomization...prepared from a computer‐generated random table" |
| Allocation concealment (selection bias) | Low risk | Quote: "Randomization was by opening sealed envelopes supplied in sequence by the study coordinator" |
| Blinding of participants and personnel (performance bias) | Unclear risk | Quote: "Pre‐study measurements were undertaken by the research physiotherapist at the same time of day in both groups. Post‐study measurements were undertaken by an independent, blinded observer who was not otherwise involved in the project" |
| Blinding of outcome assessment (detection bias) | Low risk | Quote: "Done by an independent, blinded observer who was not otherwise involved in the project" |
| Incomplete outcome data (attrition bias) | Low risk | Missing outcome data relatively balanced across the groups (all participants accounted for) |
| Selective reporting (reporting bias) | High risk | Only Quadriceps, MMSE and reaction time data reported |
| Other bias | Low risk | No other apparent risks of bias |
| Methods | Design: RCT Significantly more training participants had their primary medical problem disability from cerebrovascular accident Losses to follow up: N = 20 (25.6%) (at initial post‐test): training group N = 13 (6 discharged home, 4 due to illness, 2 deaths, 1 withdrew because of shoulder strain); control group N = 7 (4 discharged home, 1 because of illness, 2 deaths) | |
| Participants | Country: USA Consent: assent accepted Inclusion criteria: > 60 years, impaired functional status (requiring assistance with 1 or more physical activities of daily living) with potential for improvement, able to follow simple commands, wheelchair participants must be able to transfer with modest assistance at most, Veteran's Affairs participants must have an expected length of stay > 4 weeks Exclusion criteria: severe dementia, uncontrolled hypertension, unstable angina, medical condition that would interfere with safety of training protocol, stroke in previous 3 weeks, pacemaker, chronic atrial fibrillation % Eligible within home: not reported Training group: N = 39; mean age = 74.1 years; range = 60 to 90 years; 2 women (7.7%) Control group: N = 39; mean age = 76.9 years; range = 60 to 97 years; 7 women (21.9%) | |
| Interventions | Study aim or objective: to establish whether moderate‐intensity endurance training results in short‐term improvements in strength, endurance, and function Number of experimental groups: 2 All participants participated in training for 4 to 8 weeks, and a minimum of 10 resistance sessions in the 4‐week period were ensured The interventions were delivered in‐group format and led by a physiotherapist and an aide Exercise features: Control group: usual care | |
| Outcomes | Physical function in ADL: walking speed over 20‐foot, self‐selected (Friedman 1988), Performance Test of Activities of Daily Living (PADL), Instrumental Activities of Daily Living (IADL, 7 items) | |
| Notes | Funding: Veterans affairs health services research and development service Transportation logistics precluded more than 2 participants from the community nursing home from training at any given time. As a result, the randomisation scheme for these participants was done using a flip coin every time 2 participants had completed the pre‐test. Though the assessor was blinded to the participants' group assignment, the assessor was not questioned to ascertain the success of blinding | |
| Risk of bias | ||
| Bias | Authors' judgement | Support for judgement |
| Random sequence generation (selection bias) | Low risk | Quote: "The randomization scheme for the VA participants was determined by a computer algorithm stratified by site of care" |
| Allocation concealment (selection bias) | Low risk | Quote: "Assignments to the study groups were concealed in sealed envelopes that were opened after the pretest was completed" |
| Blinding of participants and personnel (performance bias) | High risk | RCT in same setting with usual care, so intervention would be obvious |
| Blinding of outcome assessment (detection bias) | Unclear risk | Regarding strength tests: "The assessor was blinded to the subjects' group assignments (training or control)" |
| Blinding of outcome assessment (detection bias) | Unclear risk | Quote: "Whenever possible, the subject's primary nurse was interviewed to provide information for the PADL and IADL scale." No mention of blinding |
| Incomplete outcome data (attrition bias) | High risk | Almost double the attrition rate in the training group. 25% overall |
| Selective reporting (reporting bias) | High risk | Quote "When post‐hoc we stratified the subjects into most dysfunctional score..." (re: ADL) |
| Other bias | Low risk | No other apparent risks of bias |
| Methods | Design: cluster RCT Participants in the strength training programme had significantly greater strength and ADL scores | |
| Participants | Country: USA Consent: not specified Inclusion criteria: sedentary for at least 6 months prior to commencing programme Exclusion criteria: none stated % Eligible within home: not reported Experimental group: N = 29 | |
| Interventions | Study aim or objective: (1) effects of upper body high‐intensity training on muscular strength, ADLs, and subjective well‐being; (2) whether changes in strength were related to subsequent changes in subjective well‐being and ADLs Number of experimental groups: 2 Exercise features: Control group: comprised fluid movements that incorporated non‐stress exercise and mild stretching activities Groups were led by the same exercise specialist | |
| Outcomes | Physical function in ADL: Instrumental Activities of Daily Living Scale (modified) (Mihalko 1996) | |
| Notes | Funding: not reported | |
| Risk of bias | ||
| Bias | Authors' judgement | Support for judgement |
| Random sequence generation (selection bias) | Unclear risk | Stated "subjects were assigned by residence" |
| Allocation concealment (selection bias) | Unclear risk | Insufficient information provided. |
| Blinding of participants and personnel (performance bias) | Unclear risk | No information provided |
| Blinding of outcome assessment (detection bias) | Unclear risk | No information provided |
| Blinding of outcome assessment (detection bias) | Unclear risk | No information provided |
| Incomplete outcome data (attrition bias) | Unclear risk | The number of participants who completed intervention/control not reported |
| Selective reporting (reporting bias) | High risk | Subjective Exercise Experiences Scale not presented. Comparative statistics for IADL not presented |
| Other bias | Low risk | No other apparent risks of bias |
| Methods | Design: cluster RCT | |
| Participants | Country: USA Consent: assent accepted Inclusion criteria: see exclusion criteria Exclusion criteria: cognitive = severe cognitive disability (Cognitive Performance Scale < 5); medical = unstable cardiac condition (excluded from exercise component only), terminal prognosis, length of stay < 90 days, health complications that prohibited contact % Eligible within home: 55.1 Fit for your life group: N = 142 | |
| Interventions | Study aim or objective: to evaluate how weight training or nursing‐based rehabilitation programmes in nursing homes impact on resident performance of ADLs and objective tests of physical performance Number of experimental groups: 3 Fit for your life group: progressive resistance training of major muscle groups related to function and mobility; led by staff, family, and volunteers; walking for 1 to 5 minutes initially, up to a maximum of 20 minutes continuous walking; resistance training comprised 2 sets of 8 repetitions, with progressively heavier weights; resistance training was conducted 3 times per week, non‐consecutive days, with walking on alternate days, for a minimum of 4 months over a 10‐month study period Self‐care for seniors group: Nursing rehabilitation intervention tailored to individual, with aim of maintaining function or preventing decline Control group: usual care | |
| Outcomes | Physical function in ADL: number of feet walked in 6 minutes ‐ scale score (Morris 1999), MDS: Locomotion (on and off unit items) (Morris 1999), MDS: Late loss ADL (transfer, toilet use, bed mobility, and eating) (Morris 1999), MDS:early loss ADL (dressing and personal hygiene) (Morris 1999), MDS: ADL summary (8 items) (Morris 1999) | |
| Notes | Funding: Grant from National Institute of Health, National Institute on Ageing | |
| Risk of bias | ||
| Bias | Authors' judgement | Support for judgement |
| Random sequence generation (selection bias) | Unclear risk | Facilities were "randomly designated" to be control or experimental sites |
| Allocation concealment (selection bias) | Unclear risk | Insufficient information provided |
| Blinding of participants and personnel (performance bias) | Unclear risk | Not mentioned (although, different homes were assigned to different interventions, so participants would not have been aware of which group they were in) |
| Blinding of outcome assessment (detection bias) | Unclear risk | Not clear who performed observed ADL outcome assessments |
| Blinding of outcome assessment (detection bias) | Low risk | ADL summary: "Assessments were completed by trained research staff, all of whom were blinded to the intervention status of the study subjects" |
| Incomplete outcome data (attrition bias) | High risk | Performance ‐ large number of residents were unable to start to initiate these activities |
| Selective reporting (reporting bias) | Unclear risk | Protocol unavailable |
| Other bias | Low risk | No other apparent risks of bias |
| Methods | Design: RCT | |
| Participants | Country: USA Consent: not specified Inclusion criteria: > 60 years of age, residence in nursing home > 3 months, dependent in 2 or more activities of daily living Exclusion criteria: cognitive = severe dementia, inability to follow 2‐step command; medical = terminal illness/acute medical condition; functional = assaultive behaviour, receiving physiotherapy currently, or within last 2 months % Eligible within home: 7.3 Intervention group: N = 97; mean age = 79.7 years (8.5); 70% women Control group: N = 97; mean age = 81.4 years (7.9); 71 % women | |
| Interventions | Study aim or objective: to assess whether a physical therapy programme tailored to long‐stay residents' disabilities improved their physical function and long‐term health Number of experimental groups: 2 Exercise features: Control group: friendly visits, reading to participants in language of their choice, activities avoided exercise and psychosocial interventions, personnel not described | |
| Outcomes | Falls: number of falls | |
| Notes | Funding: grants from the National Institute on Ageing and Veterans Affairs Health Services Research and Development | |
| Risk of bias | ||
| Bias | Authors' judgement | Support for judgement |
| Random sequence generation (selection bias) | Unclear risk | No information provided on random sequence generation procedure |
| Allocation concealment (selection bias) | Low risk | Quote: "Randomization was performed after baseline assessments by calling a central number" ‐ central allocation |
| Blinding of participants and personnel (performance bias) | Unclear risk | No report of blinding of participants. RCT in same setting, but friendly visits could have blinded intervention/control |
| Blinding of outcome assessment (detection bias) | Unclear risk | Unclear if Katz ADL scale was performed by a blinded assessor |
| Incomplete outcome data (attrition bias) | Low risk | More losses to follow up in control group (N = 9) than in intervention group (N = 5) but all for same reason (death). Total = 194 participants |
| Selective reporting (reporting bias) | Unclear risk | Protocol unavailable |
| Other bias | Low risk | No other apparent risks of bias |
| Methods | Design: RCT | |
| Participants | Country: USA Consent: fully‐informed Inclusion criteria: see exclusion criteria Exclusion criteria: cognitive = mental impairment (unable to understand programme description); medical = serious cardiac disease (CCF, angina), other active illness, significant % Eligible within home: 10 Intervention group: N = 8; age range = 66 to 97 years Control group: N = 7; age range = 64 to 87 years | |
| Interventions | Study aim or objective: to examine the effectiveness of an upper extremity and lower extremity exercise programme on endurance Number of experimental groups: 2 Exercise features: Control group: usual care | |
| Outcomes | Endurance (physical other): heart rate after 2 minutes of exercise, duration of exercise | |
| Notes | Funding: not reported | |
| Risk of bias | ||
| Bias | Authors' judgement | Support for judgement |
| Random sequence generation (selection bias) | Unclear risk | No information provided on randomisation procedure |
| Allocation concealment (selection bias) | Unclear risk | Insufficient information provided |
| Blinding of participants and personnel (performance bias) | High risk | No mention of blinding of participants, but usual care so intervention would have been obvious |
| Incomplete outcome data (attrition bias) | Low risk | Moderate loss to follow up, but balanced across groups with similar reasons |
| Selective reporting (reporting bias) | Unclear risk | Protocol unavailable |
| Other bias | Low risk | No other apparent risks of bias |
| Methods | Design: randomised controlled cross‐over trial | |
| Participants | Country: USA Consent: informed consent from participant where capable, if not, from facility staff or from a responsible party ‐ assent Inclusion criteria: long‐stay resident (at least 30 days and not initially admitted for short‐term care), able to state their name, or in the presence of aphasia, capable of reliably pointing to 2 objects, required assistance by 2 or fewer people for transfer from bed to chair, incontinent of urine or stool, or would be without assistance from staff, not severely behaviourally disturbed, not known to be terminally ill, life expectancy of at least 6 months, not receiving active physical therapy, aged 60 and older Exclusion criteria: see inclusion criteria % Eligible within home: 44 Intervention: N = 52; % women = 53; age: mean = 77.8 years ± 7.6 years Control: N = 55; % women = 50; age: mean = 78.8 years ± 6.3 years N = 528 assessed for eligibility | |
| Interventions | Study aim or objective: to test the effects of a rehabilitative intervention directed at continence, mobility, endurance, and strength (FIT) in older people living in nursing homes Number of experimental groups: 2 Functional incidental training intervention: trained research aides provided opportunities to participate in FIT for 4 to 5 participants every 2 hours between 8am and 4pm Monday to Friday for 8 weeks, so each participant could participate in 4 FIT sessions a day; the intervention included prompted voiding and functionally‐orientated endurance and strengthening exercises; individualised exercise programmes created from baseline data and modified every 2 weeks; goal for 3 sessions of FIT to involve endurance exercise (sit‐to‐stands, walking or wheelchair mobility to a goal time) and 4 sessions to involve strengthening exercises (bicep curls, straight arm exercises, knee extensions, and hip abductions and flexions); daily adherence recorded; supervisors conducted periodic process observations and provided additional training and reinforcement on the protocol where needed to endure quality and consistency Control: usual care | |
| Outcomes | Physical function in ADL: transfer time (seconds; chair to chair and back), FIM (toileting score), FIM (locomotion score), Walk or Wheel Total Time (seconds) during a 10 minute trial, Walk or Wheel (time over 6 metres), Walk or Wheel (total distance in up to 10 minutes (feet) | |
| Notes | Funding: grant from the Department of Veterans Affairs Rehabilitation Services Research Service | |
| Risk of bias | ||
| Bias | Authors' judgement | Support for judgement |
| Random sequence generation (selection bias) | Low risk | Quote: "Randomisation by computer‐generated random numbers" |
| Allocation concealment (selection bias) | Unclear risk | Insufficient information provided |
| Blinding of participants and personnel (performance bias) | High risk | Cross‐over design, so participants would have been aware of each intervention |
| Blinding of outcome assessment (detection bias) | High risk | Project manager (outcome assessor) was masked, but allocation revealed in some cases |
| Blinding of outcome assessment (detection bias) | High risk | Project manager (outcome assessor) was masked, but allocation revealed in some cases |
| Incomplete outcome data (attrition bias) | High risk | 17/35 (49%) in immediate intervention lost versus 12/43 (28%) from control |
| Selective reporting (reporting bias) | Unclear risk | Protocol unavailable |
| Other bias | Low risk | This was a cross‐over trial of an intervention likely to have long‐term effects. Therefore, high risk of carry‐over effects. However, only the first period used in this review; therefore, low risk of bias |
| Methods | Design: cluster RCT | |
| Participants | Characterisation: ambulatory, need minimal assistance with transferring, independent in eating, but dependent in instrumental ADLs | |
| Interventions | Study aim or objective: to determine whether a repetitive ADL activity programme improves health status, life satisfaction, and mobility for older people living in residential care | |
| Outcomes | Physical function in ADL: TUG test (seconds) (Podsiadlo 1991), Elderly Mobility Scale (EMS) (Smith 1994) | |
| Notes | ‐ | |
| Risk of bias | ||
| Bias | Authors' judgement | Support for judgement |
| Random sequence generation (selection bias) | Low risk | Toss of a coin used for allocation (between two wings of a home) |
| Allocation concealment (selection bias) | Low risk | Coin toss performed by independent researcher ‐ suggests allocation concealment |
| Blinding of participants and personnel (performance bias) | Unclear risk | Quote: "Care delivery in each wing was administered independently with no crossover of staff or residents during the study period" |
| Blinding of outcome assessment (detection bias) | Low risk | Quote: "A research nurse blinded to the allocation then collected baseline, 3‐ and 6‐month outcome measures" |
| Incomplete outcome data (attrition bias) | Low risk | Slight imbalance in number of participants lost to follow up between groups (more in control than in intervention), although reasons similar between groups |
| Selective reporting (reporting bias) | Unclear risk | Protocol unavailable |
| Other bias | High risk | Contamination: "Observations of research staff indicated that in two homes the control group residents were observed participating in activities with intervention group residents in the lounge or during walking group outings" |
| Methods | Design: RCT | |
| Participants | Country: UK Consent: not specified Inclusion criteria: diagnosis of dementia, resident of facility, requiring assistance of 1 to 2 persons for transfers, weight‐bearing not precluded by hip/knee contractures, < 18 mobility score, unable to stand/mobilise independently, medically fit to participate Exclusion criteria: medical = signs of severe osteoarthritis, cardiovascular disease, alcoholism, neurological pathology % Eligible within home: not reported Group 1: N = 12 | |
| Interventions | Study aim or objective: Does provision of physiotherapy input improve or maintain mobility skills in elderly people with dementing illness? Number of experimental groups: 2 Group 1: physiotherapy followed by no intervention Physiotherapy comprised movement, music, body awareness, and individual functional mobility training; sessions were conducted by a physiotherapist in individual format, 3 times per week for 12 weeks, followed by 3 weeks of videoing | |
| Outcomes | Physical function (other): Southampton Assessment of Mobility (Pomeroy 1990) | |
| Notes | Funding: Research into Ageing grant | |
| Risk of bias | ||
| Bias | Authors' judgement | Support for judgement |
| Random sequence generation (selection bias) | Low risk | Used a random numbers table |
| Allocation concealment (selection bias) | Unclear risk | Insufficient information provided |
| Blinding of participants and personnel (performance bias) | High risk | Cross‐over design ‐ all participants experienced the intervention and a control phase. The control phase consisted of no intervention. Therefore, it would have been apparent to the participants what the intervention under study was |
| Incomplete outcome data (attrition bias) | High risk | Missing data for participants who did not complete all phases ‐ "these were equally distributed between groups 1 and 2". However, 8/24 (33%) lost to follow up |
| Selective reporting (reporting bias) | Unclear risk | Protocol unavailable |
| Other bias | Low risk | This was a cross‐over trial of an intervention with the potential for carry‐over effects. However, only the first period used in this review so low risk of bias |
| Methods | Design: RCT | |
| Participants | Country: Canada Consent: fully‐informed consent Inclusion and exclusion criteria: not reported % Eligible within home: not reported Intervention group: N = 58; age range = 62 to 97 years; women:men ratio = 3.5:1 Control group: N = 57; age range = 63 to 101; women:men ratio = 3.1:1 | |
| Interventions | Study aim or objective: to determine whether there is a difference in functional status among residents receiving 1 full‐time physiotherapist and occupational therapist per 50 beds (enhanced) or per 200 beds (control) Number of experimental groups: 2 Intervention group: enhanced therapy (physiotherapy/occupational therapy), i.e. increased hours of service on a 1.0 FTE/50 bed ratio, therapy tailored to individual, content/frequency not described Control group: usual treatment comprising minimal therapy input on a 1.0 FTE/200 bed ratio; no further details given | |
| Outcomes | Physical function in ADL: FIM, Functional Assessment Measure, Clinical Outcomes Variables Scale | |
| Notes | Funding: not reported; states that no commercial parties had any interest | |
| Risk of bias | ||
| Bias | Authors' judgement | Support for judgement |
| Random sequence generation (selection bias) | High risk | No information provided on initial sequence generation. Intervention was implemented over two years, with 29 new participants recruited throughout to replace participants who died or were discharged. The researchers had no control over who died, was discharged, or recruited to the groups, and made the assumption that this was a random process |
| Allocation concealment (selection bias) | High risk | No information provided on concealment during initial allocation. The replacement process may have been visible to staff, so allocation could not have been concealed |
| Blinding of participants and personnel (performance bias) | High risk | Stated that the testers and the staff were all blind to which group residents had been assigned. However, potential contact between residents and the occupational therapy and physiotherapy staff with other staff members means unlikely that blinding was achieved |
| Blinding of outcome assessment (detection bias) | Low risk | Stated that the testers and the staff were all blind to which group residents had been assigned |
| Incomplete outcome data (attrition bias) | High risk | Large numbers lost including due to non‐testing, not clear which groups they came from |
| Selective reporting (reporting bias) | High risk | Pre‐intervention outcome scores were not provided (only 6 months, 12 months, 18 months, and 24 months) |
| Other bias | Low risk | No other apparent risks of bias |
| Methods | Design: cluster RCT | |
| Participants | Characterisation: care‐home residents | |
| Interventions | Study aim or objective: to test the effectiveness of a restorative care (Res‐Care) intervention on function, muscle strength, contractures, and quality of life of nursing‐home residents, with secondary aims focused on strengthening self‐efficacy and outcome expectations Control: Control group (N = 231) | |
| Outcomes | Physical function in ADL: BI (0 to 100 scale) | |
| Notes | ‐ | |
| Risk of bias | ||
| Bias | Authors' judgement | Support for judgement |
| Random sequence generation (selection bias) | Unclear risk | No information provided on randomisation procedure |
| Allocation concealment (selection bias) | Unclear risk | Insufficient information provided |
| Blinding of participants and personnel (performance bias) | High risk | Staff involved in delivering intervention were not blind to participants in study/not in study |
| Blinding of outcome assessment (detection bias) | Low risk | Quote: "A team of evaluators who were blinded to randomization and unfamiliar with the details of the Res‐Care intervention measured all outcomes" |
| Blinding of outcome assessment (detection bias) | Low risk | Quote: "A team of evaluators who were blinded to randomization and unfamiliar with the details of the Res‐Care intervention measured all outcomes" |
| Incomplete outcome data (attrition bias) | Low risk | Large numbers lost to follow up, but balanced with similar reasons |
| Selective reporting (reporting bias) | Unclear risk | Protocol unavailable |
| Other bias | Low risk | No other apparent risks of bias |
| Methods | Design: RCT | |
| Participants | Country: USA Consent: not specified Inclusion criteria: Parachek score > 25 Exclusion criteria: see inclusion criteria % Eligible within home: not reported | |
| Interventions | Study aim or objective: to examine the effects of verbally‐elicited imagery in the encouragement of exercise in elderly women Number of experimental groups: 4 Exercise features: Imaging: added‐purpose activity, e.g. reach down as if you are picking up something from the floor Control: rote exercise activity, e.g. reach down to the floor with both hands 2 exercises were performed as above – a reaching‐up exercise and a reaching‐down exercise. Interventions were one‐offs, supervised by a researcher | |
| Outcomes | Endurance (physical other): duration of exercise, frequency of repetition | |
| Notes | Funding: not reported | |
| Risk of bias | ||
| Bias | Authors' judgement | Support for judgement |
| Random sequence generation (selection bias) | Unclear risk | Quote: "...subjects randomly assigned to different orders in accordance with a counterbalanced design" |
| Allocation concealment (selection bias) | Unclear risk | Insufficient information provided |
| Blinding of participants and personnel (performance bias) | Unclear risk | No information given. Participants received both interventions |
| Incomplete outcome data (attrition bias) | Low risk | Three lost from group 1; zero from group 2. Reasons unlikely to be related to intervention‐conflicting appointments and refused to participate (cross‐over) |
| Selective reporting (reporting bias) | Unclear risk | Protocol unavailable |
| Other bias | Low risk | Cross‐over design, but intervention unlikely to produce a carry‐over effect |
| Methods | Design: RCT | |
| Participants | Characterisation: ambulatory participant with Alzheimer's disease | |
| Interventions | Study aim or objective: to investigate the effectiveness of an exercise program in improving ability to perform ADLs, physical performance, and nutritional status and decreasing behavioral disturbance and depression in participants with Alzheimer's disease | |
| Outcomes | Physical function in ADL: Katz ADL Scale (Katz 1963), Get Up and Gotest (Mathias 1986), six‐metre walk (speed m/s) | |
| Notes | ‐ | |
| Risk of bias | ||
| Bias | Authors' judgement | Support for judgement |
| Random sequence generation (selection bias) | Low risk | Quote: "Staff not involved in intervention or assessment performed separate randomization at each site by lottery draw" |
| Allocation concealment (selection bias) | Unclear risk | Quote: "Staff not involved in intervention or assessment performed separate randomization at each site by lottery draw" However, unclear if drawing was concealed, e.g. open hat |
| Blinding of participants and personnel (performance bias) | High risk | Quote: "...single‐blind study..." |
| Blinding of outcome assessment (detection bias) | Low risk | A single geriatrician who was blinded to the intervention assignment measured outcomes at baseline, 6 months, and 12 months on different days from the intervention |
| Blinding of outcome assessment (detection bias) | Low risk | A single geriatrician who was blinded to the intervention assignment measured outcomes at baseline, 6 months, and 12 months on different days from the intervention |
| Incomplete outcome data (attrition bias) | Low risk | Missing outcome data balanced across groups (13 control, 11 exercise) with similar reasons |
| Selective reporting (reporting bias) | Unclear risk | Protocol unavailable |
| Other bias | Low risk | No other apparent risks of bias |
| Methods | Design: cluster RCT | |
| Participants | Country: Sweden (Umeå) ‐ frail older people ‐ activity and nutrition study (FOPANU study) Consent: assent accepted Inclusion criteria: aged 65 years, dependent on assistance from a person in 1 or more ADL according to the Katz index, able to stand up from a chair with arm rests with help from no more than 1 person, MMSE score of 10 or higher, approval from the resident's physician Exclusion criteria: see inclusion criteria % Eligible within home: 39 Exercise + protein drink: 85.0 years ± 6.7 years; women = 78% Exercise + placebo drink: 85.5 years ± 5.5 years; women = 69% Control + protein drink: 82.9 years ± 6.4 years; women = 70% Control + placebo drink: 85.6 years ± 7.0 years; women = 74% | |
| Interventions | Study aim or objective: to determine whether a high‐intensity functional exercise programme improves balance, gait ability, and lower limb strength in activities of daily living, and if an intake of protein‐enriched energy supplement immediately after the exercise increases the effects of the training Number of experimental groups: 4 Exercise features: groups of 3 to 9 participants, supervised by 2 physiotherapists Control: developed by occupational therapists and involved activities while sitting watching films, reading, singing, and conversing; groups of 3 to 9 participants, supervised by 1 occupational therapist; based on themes ‐ the old country shop, famous persons, games from the past; designed to be stimulating, even to people with cognitive impairment Nonexercise features: | |
| Outcomes | Falls: falls (any episodes for participant), fall rate (falls per person years) | |
| Notes | Funding: grants from the City Council of Västerbotten, the Vårdal foundation, the Magnus Bergvalls Foundation, the Äldrecentrum Västerbotten, the Umeå University Foundation for Medical research, the Gun and Bertil Stohne Foundation, Erik and Anne‐Marie Detlof’s foundation, the Loo and Hans Ostermans Foundation, the Borgerskapet in Unmeå Research foundation, the Swedish Research Council and the Swedish Council for Working Life and Social Research and Norrmejerier | |
| Risk of bias | ||
| Bias | Authors' judgement | Support for judgement |
| Random sequence generation (selection bias) | Low risk | Stated that researchers not involved in the study performed the randomisation using lots in sealed non‐transparent envelopes |
| Allocation concealment (selection bias) | Low risk | Stated that researchers not involved in the study performed the randomisation using lots in sealed non‐transparent envelopes |
| Blinding of participants and personnel (performance bias) | Unclear risk | Even though the clusters were in separate flats, they were within the same facilities. As a result, there may have been contact between the exercise intervention group and the control group |
| Blinding of outcome assessment (detection bias) | Low risk | Trained physiotherapists blind to group allocation undertook assessment for mobility/balance outcome measures |
| Incomplete outcome data (attrition bias) | Unclear risk | Stated ITT, but results appear to be 'as treated' (N at 3 months and 6 months is different to N randomised) |
| Selective reporting (reporting bias) | Unclear risk | Protocol unavailable |
| Other bias | Low risk | No other apparent risks of bias |
| Methods | Design: cluster RCT | |
| Participants | Country: UK Consent: not specified Inclusion criteria: residents with stroke, staff asked to screen people with the BI, information on stroke history and cognitive status for the purpose of consent Exclusion criteria: medical = acute illness, terminally ill % Eligible within home: 46 Intervention: 88.6 years ± 6.5 years (62 to 102 years); 83% women Intervention: 6 homes; 63 residents, (3 months: 59 assessed, 3 died; before occupational therapy: 1 died during/after treatment; 6 months: 53 assessed, 6 died) lost 10 to follow up. | |
| Interventions | Study aim or objective: evaluation of occupational therapy intervention to improve self‐care independence for residents with stroke related disability living in care homes Number of experimental groups: 2 Intervention: provided by experienced occupational therapist delivered to the individual, targeted at improving independence in personal activities of daily living, frequency and duration dependent on resident's and therapist's agreed goals, took place over a 3‐month period, intervention group given interview of 1 hour to establish functional ability and agree goals Control: usual care | |
| Outcomes | Physical function in ADL: RMI (Collen 1991), BI (0 to 20) | |
| Notes | The Stroke Association, Health Foundation, Department of Health Research Capacity Development Program | |
| Risk of bias | ||
| Bias | Authors' judgement | Support for judgement |
| Random sequence generation (selection bias) | Low risk | Quote: "Homes were allocated randomly, using computer‐generated random numbers" |
| Allocation concealment (selection bias) | Low risk | Quote: "Randomisation was carried out independently by a statistician" |
| Blinding of participants and personnel (performance bias) | High risk | Quote: "Allocation was revealed only to the occupational therapist, not to the assessors" |
| Blinding of outcome assessment (detection bias) | Low risk | Quote: "Allocation was revealed only to the occupational therapist, not to the assessors" |
| Incomplete outcome data (attrition bias) | Low risk | Imbalance in numbers lost to follow up between intervention and control group, but this was largely due to many deaths in the control group, and unlikely to be related to intervention |
| Selective reporting (reporting bias) | Unclear risk | Protocol unavailable |
| Other bias | Low risk | No other apparent risks of bias |
| Methods | Design: cluster RCT | |
| Participants | Characterisation: care‐home residents with a range of functional, cognitive, and continence impairments | |
| Interventions | Study aim or objective: to assess feasibility, acceptability and potential efficacy of group exercise and staff education intervention to promote continence in older people residing in care homes. To establish measures and information to inform a larger trial. | |
| Outcomes | Physical function in ADL: RMI (Collen 1991) | |
| Notes | ‐ | |
| Risk of bias | ||
| Bias | Authors' judgement | Support for judgement |
| Random sequence generation (selection bias) | Low risk | An independent statistician randomly allocated three care homes to each study group, using computer‐generated random numbers |
| Allocation concealment (selection bias) | Low risk | An independent statistician randomly allocated three care homes to each study group, using computer‐generated random numbers |
| Blinding of participants and personnel (performance bias) | High risk | No report of blinding of participants; those in control group received usual care, so would have been obvious that they weren't receiving an intervention |
| Blinding of outcome assessment (detection bias) | Low risk | Quote: "Study outcomes were assessed...by an assessor who was masked to allocation" |
| Incomplete outcome data (attrition bias) | Low risk | Imbalance in number of participants lost to follow up between groups (more in control than in intervention ‐ unlikely to be related to the intervention) |
| Selective reporting (reporting bias) | Unclear risk | Protocol unavailable. Mean mobility scores (RMI) reported without providing SD or CI |
| Other bias | Low risk | No other apparent risks of bias |
| Methods | Design: cluster RCT | |
| Participants | Characterisation: care home residents with mobility limitations and limitations in ADLs | |
| Interventions | Study aim or objective: to compare effectiveness of physiotherapy and occupational therapy with standard care in care‐home residents who have mobility limitations and are dependent in performing ADLs Physiotherapy and occupational therapy intervention: | |
| Outcomes | Physical function in ADL: TUG test (seconds) (Podsiadlo 1991), RMI (Collen 1991), BI (0 to 20) | |
| Notes | ‐ | |
| Risk of bias | ||
| Bias | Authors' judgement | Support for judgement |
| Random sequence generation (selection bias) | Low risk | Quote: "Randomisation was performed by an independent principal statistician who used a computer‐generated randomisation list" |
| Allocation concealment (selection bias) | Low risk | Quote: "Randomisation was performed by an independent principal statistician who used a computer‐generated randomisation list" |
| Blinding of participants and personnel (performance bias) | High risk | Quote: "Treatment arm was revealed to the treating therapists only, thereby ensuring that allocation was concealed from the independent assessors responsible for all subsequent assessments" |
| Blinding of outcome assessment (detection bias) | Low risk | Quote: "Treatment arm was revealed to the treating therapists only, thereby ensuring that allocation was concealed from the independent assessors responsible for all subsequent assessments" |
| Blinding of outcome assessment (detection bias) | Low risk | Quote: "Treatment arm was revealed to the treating therapists only, thereby ensuring that allocation was concealed from the independent assessors responsible for all subsequent assessments" |
| Incomplete outcome data (attrition bias) | Low risk | Missing outcome data balanced in numbers across intervention groups, with similar reasons for missing data across groups |
| Selective reporting (reporting bias) | High risk | HADS‐D was described as an outcome measure, but not reported post‐intervention and its exclusion not discussed. TUG was not analysed or reported because so few participants were able to complete it |
| Other bias | Low risk | No other apparent risks of bias |
| Methods | Design: RCT | |
| Participants | Characterisation: people with Alzheimer's disease | |
| Interventions | Study aim or objective: to determine the effects of a 12‐week training program for Spanish participants with Alzheimer's disease on their (1) overall functional capacity (muscle strength and flexibility, agility and balance while moving, and endurance fitness), and (2) ability to perform ADLs | |
| Outcomes | Physical function in ADL: TUG test (modified to 8 feet) (Bassey 1992; Rikli 1999), Katz ADL Scale (Katz 1963), BI (0 to 100 scale) | |
| Notes | ‐ | |
| Risk of bias | ||
| Bias | Authors' judgement | Support for judgement |
| Random sequence generation (selection bias) | Unclear risk | No information provided on randomisation procedure |
| Allocation concealment (selection bias) | Unclear risk | Insufficient information provided |
| Blinding of participants and personnel (performance bias) | High risk | Unclear if participants were blinded, but they all came from the same nursing home, and the control group did not receive any intervention so would probably have been obvious which group they were in |
| Blinding of outcome assessment (detection bias) | Low risk | Reported that the study was single‐blind, and the exercise scientist performing the evaluations was different to the 1 delivering the intervention, implying that the assessor was blind to allocation |
| Blinding of outcome assessment (detection bias) | Low risk | Reported that the study was single‐blind, and the exercise scientist performing the evaluations was different to the one delivering the intervention, implying that the assessor was blind to allocation |
| Incomplete outcome data (attrition bias) | Unclear risk | No losses to follow up reported |
| Selective reporting (reporting bias) | Unclear risk | Protocol unavailable |
| Other bias | Low risk | No other apparent risks of bias |
| Methods | Design: RCT | |
| Participants | Country: USA Consent: fully‐informed Inclusion criteria: > 60 years, independently mobile without aid, evidence of gait/balance difficulties (Tinetti Score 30 or less), lower limb weakness (quadriceps/hamstrings < 5), isokinetic quadriceps and hamstrings < 80% of age‐predicted normal Exclusion criteria: cognitive = moderate‐severe dementia (MMSE < 22); medical = asymmetrical focal neurological deficit, lower limb amputation, lower limb discrepancy > 1 inch, significant systematic disease, e.g. cancer; functional = refusal of consent % Eligible within home: 12 Intervention group: N = 6; mean age = 73.38 years ± 4.04 years; all male Control group: N = 6; mean age = 73.83 years ± 4.74; all male | |
| Interventions | Study aim or objective: to determine whether a moderate to high intensity strengthening and aerobic exercise programme can improve the strength, exercise capacity, gait, and balance of deconditioned nursing‐home residents Number of experimental groups: 2 Intervention group: progressive‐resistance lower‐limb weight training and aerobic conditioning, group format: 20 minutes of aerobic exercise, 10 repetitions per lower limb exercise, conducted 3 times per week for 12 weeks; personnel not described Control group: usual care with maintenance physiotherapy when indicated | |
| Outcomes | Physical function in ADL: gait speed/velocity (left and right each) | |
| Notes | Funding: Department of Veterans Affairs Medical Research Service and Rehabilitation Research and Development Service | |
| Risk of bias | ||
| Bias | Authors' judgement | Support for judgement |
| Random sequence generation (selection bias) | High risk | Quote: "...were then randomized." No details reported. However, randomisation not specified at all for subsequent reduction to 12 participants or for the 4 control participants crossed over |
| Allocation concealment (selection bias) | High risk | Quote: "...were then randomized." No details reported. However, randomisation not specified at all for subsequent reduction to 12 participants or for the 4 control participants crossed over |
| Blinding of participants and personnel (performance bias) | High risk | Not reported, but control was usual care; therefore, obvious |
| Blinding of outcome assessment (detection bias) | Unclear risk | No report of blinding of outcome assessment |
| Incomplete outcome data (attrition bias) | High risk | 2 of 6 original exercise‐group participants (33%) lost to follow up. No control group participants lost (1st phase). Unknown number lost from original allocation when group reduced to 6 |
| Selective reporting (reporting bias) | High risk | Original protocol not available, but outcomes reported in such a way that they could not be used in a meta‐analysis (mixing of related and independent participants) |
| Other bias | Low risk | No other apparent risks of bias |
| Methods | Design: RCT | |
| Participants | Country: USA Consent: assent acceptable Inclusion criteria: incontinent of urine, passing basic cognitive screen Exclusion criteria: cognitive = severe cognitive impairment that precluded participation; medical = indwelling catheters; functional = unable to weight bear, unable to propel wheelchairs because of irreversible physical limitations, e.g. paralysis % Eligible within home: 75 Intervention group: N = 36 Control group: N = 40 | |
| Interventions | Study aim or objective: to determine if an exercise intervention (FIT) results in improvements in mobility, endurance, and physical activity when compared with prompted voiding among cognitively and mobility impaired residents Number of experimental groups: 2 Intervention group: prompted voiding and FIT exercise intervention, comprised incontinence care, and social interaction, 1 to 2 stands, 1 transfer, walking/wheeling exercises, and sit‐to‐stand Intervention group received approximately 2 times greater input than the control group, delivered by research staff on an individual basis over 8 weeks Control group: prompted voiding only, comprised incontinence care and social interaction, 1 to 2 stands, and 1 transfer, conducted every 2 hours, 4 times per day, 5 days a week for the 8‐week period, delivered by research staff on an individual basis | |
| Outcomes | Physical function in ADL: wheelchair mobility endurance (wheel as long as he/she could) (Schnelle 1995), walking endurance (walk as long as he/she could (minutes)) (Schnelle 1995), wheelchair speed over maximal wheeling distance, wheelchair speed over 6 metres, walking speed over maximal walking distance, six‐metre walk (speed m/s) | |
| Notes | National Institute on Aging (NIA) Pepper Centre grant | |
| Risk of bias | ||
| Bias | Authors' judgement | Support for judgement |
| Random sequence generation (selection bias) | Unclear risk | Authors state that the residents were randomised to receive either prompted voiding or prompted voiding plus FIT, but do not specify how random sequence was generated |
| Allocation concealment (selection bias) | Unclear risk | Authors state that the residents were randomised to receive either prompted voiding or prompted voiding plus FIT, but do not specify if allocation was concealed |
| Blinding of participants and personnel (performance bias) | Unclear risk | Blinding of participants and personnel not reported. Same setting, but two interventions so could have been blinded |
| Blinding of outcome assessment (detection bias) | High risk | Quote: "It was not possible for all outcome measures to be assessed by blinded raters" |
| Incomplete outcome data (attrition bias) | Unclear risk | Unclear if there was any missing outcome data ‐ number of residents on which outcome data were assessed was not reported |
| Selective reporting (reporting bias) | Unclear risk | Protocol unavailable |
| Other bias | Low risk | No other apparent risks of bias |
| Methods | Design: RCT | |
| Participants | Country: USA Consent: not specified Inclusion criteria: > 65 years of age, medical order for physical restraint or visual documentation of restraint use by research staff, basic cognitive and behavioural responsiveness Exclusion criteria: medical: paralysis, contracture, foot drop, severe arthritic pain % Eligible within home: 94 Intervention group: N = 47 | |
| Interventions | Study aim or objective: to evaluate an exercise protocol designed to improve strength and mobility and decrease injury risk factors in physically restrained nursing‐home residents Number of experimental groups: 2 Intervention group: exercise safety intervention protocol; comprised mobility exercise, safety practice, rowing endurance, and strengthening exercises; targeted pre‐set goals and progressed by 10% each week; conducted on an individual basis by a research staff member, 3 times per week for 9 weeks Control group: usual care | |
| Outcomes | Risk of falling: Safety Assessment for the Frail Elderly (SAFE)Transition Score (Schnelle 1994), SAFE Walk Score (Schnelle 1994), SAFE Total Score (Schnelle 1994), SAFE Judgement Score (Schnelle 1994) | |
| Notes | NIA Pepper Centre grant | |
| Risk of bias | ||
| Bias | Authors' judgement | Support for judgement |
| Random sequence generation (selection bias) | Unclear risk | Authors state that residents were randomised into 1 of the 2 groups, but do not indicate how random sequence was generated |
| Allocation concealment (selection bias) | Unclear risk | Insufficient information provided |
| Blinding of participants and personnel (performance bias) | High risk | No report of blinding of participants, but usual care so intervention would have been obvious |
| Blinding of outcome assessment (detection bias) | High risk | Quote: "Blinding was accomplished on only 50% of the observations" |
| Incomplete outcome data (attrition bias) | High risk | Missing data ‐ standing and walking outcomes could only be measured in ambulatory residents; SAFE assessment not available for the first nursing home |
| Selective reporting (reporting bias) | Unclear risk | Figures not reported for all prespecified outcome measures, but commented upon in results section |
| Other bias | Low risk | No other apparent risks of bias |
| Methods | Design: RCT | |
| Participants | Country: USA Consent: assent accepted Inclusion criteria: incontinent of urine (free of a catheter), able to follow a one‐step instruction Exclusion criteria: medical: residents of post‐acute skilled care units, terminal illness, catheterised % Eligible within home: 73 Intervention group: N = 9; age range = 71 to 95 years; 8 women Control group: N = 7; age range = 65 to 70 years, 76 to 95 years; 4 women | |
| Interventions | Study aim or objective: to examine clinical outcomes and describe the staffing requirements of an incontinence and exercise intervention Number of experimental groups: 2 Intervention group: prompted voiding, walking/wheeling, sit‐stands, supervised by research staff, once daily upper limb resistance training Control group: usual care | |
| Outcomes | Physical function in ADL: walked maximum 10 minutes, wheeled (metres average) 10 minutes (Schnelle 2002), wheeled maximum 10 minutes, standing test (level of assistance) (Schnelle 2002), walked (metres average) 10 minutes (Schnelle 2002), 10‐minute walk/wheel (average distance), walked and wheeled (metres maximum) 10 minutes (Schnelle 2002) | |
| Notes | "Supported by Grant AG13013 from the National Institutes of Health: Mobility and Incontinence Management Effects on Sickness, and Grant AG10415 from the National Institute on Aging: UCLA Claude D. Pepper Older Americans Independence Center" | |
| Risk of bias | ||
| Bias | Authors' judgement | Support for judgement |
| Random sequence generation (selection bias) | Low risk | Quote: "Residents were randomized into intervention and control groups using a computerized randomization program completed after baseline assessments" |
| Allocation concealment (selection bias) | Unclear risk | Insufficient information provided |
| Blinding of participants and personnel (performance bias) | High risk | Likely to have been incomplete blinding. Whilst attempts were made to blind staff involved in the trial "blinding observers to group assignment whenever possible", participants would probably have been aware of treatment allocation |
| Blinding of outcome assessment (detection bias) | High risk | Stated: "...blinding observers to group assignment whenever possible", suggesting this was not accomplished all of the time |
| Incomplete outcome data (attrition bias) | Unclear risk | Loss to follow up moderate, but individual groups not reported (*Primarily* because of death or prolonged illness) |
| Selective reporting (reporting bias) | Unclear risk | Protocol unavailable |
| Other bias | Low risk | No other apparent risks of bias |
| Methods | Design: RCT | |
| Participants | Country: USA Consent: fully‐informed consent Inclusion criteria: > 65 years of age, independently mobile (+/‐ aid), able to speak/understand English, MMSE score > 20 Exclusion criteria: medical = unstable physical condition, terminal illness; functional = abusive behaviour % Eligible within home: not reported Intervention group: N = 9; age range = 71 to 95 years; 8 women Control group: N = 7; age range = 65 to 95 years; 4 women | |
| Interventions | Study aim or objective: to investigate the role of exercise in preventing falls, specifically assessing the effectiveness of an ankle strengthening and walking programme to improve balance, ankle strength, walking speed, and falls efficacy and to decrease falls and fear of falling Number of experimental groups: 2 Intervention group: ankle strengthening programme (heel raises), walking programme (increasing speed/distance), intervention delivered by a researcher Control group: usual care | |
| Outcomes | Risk of falling: Fall Risk Assessment (RAFS II) (Ross 1991) | |
| Notes | Funding: Gerontological Nursing Interventions Research Center grant | |
| Risk of bias | ||
| Bias | Authors' judgement | Support for judgement |
| Random sequence generation (selection bias) | Unclear risk | Quote: "Subjects were matched in pairs and assigned randomly within each pair" |
| Allocation concealment (selection bias) | Unclear risk | Insufficient information provided |
| Blinding of participants and personnel (performance bias) | High risk | No report of blinding of participants, but would probably have been obvious to the participants which group they were in. Control was usual care in same setting |
| Blinding of outcome assessment (detection bias) | Unclear risk | No report of blinding of outcome measurement |
| Incomplete outcome data (attrition bias) | High risk | Missing outcome data for 2 (of 9) participants in the intervention group who could not complete 6‐month measures |
| Selective reporting (reporting bias) | High risk | Some outcome measures not reported |
| Other bias | Low risk | No other apparent risks of bias |
| Methods | Design: RCT, matched‐pairs design Intervention: Control: | |
| Participants | Country: USA Consent: fully‐informed Inclusion criteria: = 65 years, able to ambulate independently or with an assistive device (so they could take part in an ankle strengthening and walking programme), could speak English, did not have an unstable physical condition, did not have evidence of an end‐stage terminal illness, no history of acting out or abusive behaviour, had score of 20 or above on MMSE, doctor's consent sought Exclusion criteria: see inclusion criteria % Eligible within home: not reported Intervention: N = 42, women N = 30 | |
| Interventions | Study aim or objective: to test a 3‐month ankle strengthening and walking programme designed to improve or maintain fall related outcomes Number of experimental groups: 2 Intervention: 3‐month ankle strengthening and walking programme, 3 times weekly, 15 to 20 minutes, programme tailored to individual ability Control: attention placebo to control for effects of attention and motivation, visited weekly by same research team member who conducted the exercise programme, devoted 30 minutes to an activity such as book reading or 'friendly visiting' | |
| Outcomes | Fear of falling: fear of falling (single item 4‐point scale) (Tinetti 1990), Falls Efficacy Scale (modified) (Schoenfelder 2000) (10 item fear of falling) | |
| Notes | Funding: NIH grant | |
| Risk of bias | ||
| Bias | Authors' judgement | Support for judgement |
| Random sequence generation (selection bias) | Unclear risk | Quote: "Subjects...randomly assigned within each pair to intervention or control group" No information provided on randomisation procedure |
| Allocation concealment (selection bias) | Unclear risk | Insufficient information provided |
| Blinding of participants and personnel (performance bias) | Unclear risk | Blinding attempted, but may have been broken |
| Blinding of outcome assessment (detection bias) | Low risk | Quote: "For all assessments conducted at 3 and 6 months, examiners doing the assessments had no contact with the participants other than the assessments once group assignments were made" |
| Blinding of outcome assessment (detection bias) | Low risk | Quote: "For all assessments conducted at 3 and 6 months, examiners doing the assessments had no contact with the participants other than the assessments once group assignments were made" |
| Incomplete outcome data (attrition bias) | Low risk | Similar numbers and reasons for loss to follow up between groups. |
| Selective reporting (reporting bias) | Unclear risk | Protocol unavailable |
| Other bias | Low risk | No other apparent risks of bias |
| Methods | Design: RCT | |
| Participants | Country: Finland Consent: fully‐informed consent Inclusion criteria: = 70, able to stand without a walking aid, able to see visual feedback from a computer screen, able to follow instructions for testing and training Exclusion criteria: see inclusion criteria % Eligible within home: 41% volunteered Exercise group: N = 20; 80.7 years ± 6.1 years | |
| Interventions | Study aim or objective: to investigate the effects of a 4‐week visual feedback‐based balance training on the postural control of frail elderly women living in residential care Exercise features: Control: not specified Groups: both groups told to continue their normal daily routines and not to change their physical activity | |
| Outcomes | Balance: Dynamic Balance Test (3 tests), Standing Balance Test (6 tests), BBS | |
| Notes | Funding: Ministry of Education Juhno Vainio Foundation in Finland | |
| Risk of bias | ||
| Bias | Authors' judgement | Support for judgement |
| Random sequence generation (selection bias) | Low risk | Stated randomisation by the drawing of lots |
| Allocation concealment (selection bias) | Unclear risk | Insufficient information provided |
| Blinding of participants and personnel (performance bias) | High risk | As intervention and control group participants were from the same 2 homes, unlikely they could have been blinded to group allocation |
| Incomplete outcome data (attrition bias) | Low risk | 25% (2/8) lost from control. 15% (3/20) lost from exercise. Limited difference unlikely to relate to intervention or lack of it |
| Selective reporting (reporting bias) | Unclear risk | Protocol unavailable |
| Other bias | Low risk | Stated participants were randomised unequally to exercise group in anticipation of greater dropouts. Heavily imbalanced groups not judged to cause systematic risk of bias |
| Methods | Design: RCT | |
| Participants | Country: USA Consent: assent accepted Inclusion criteria: ambulatory, medical screening prior to inclusion Exclusion criteria: Medical = cardiovascular abnormality – electrocardiograms carried out prior to inclusion % Eligible within home: not reported Experimental group: N = 9; mean age = 71.5 years | |
| Interventions | Study aim or objective: to investigate the effects of physical training on institutionalised old men Number of experimental groups: 2 Experimental group: performed treadmill walking with speed and gradient adjustment to maintain heart rate at 70% of age‐adjusted maximum; sessions lasted 9 minutes for the first 3 weeks, and increased by 3 minutes every subsequent 3 weeks; sessions were conducted daily, Monday to Friday for 12 weeks; persons delivering the intervention were not described Control group: usual care | |
| Outcomes | Endurance (physical other): heart rate | |
| Notes | Funding: not reported | |
| Risk of bias | ||
| Bias | Authors' judgement | Support for judgement |
| Random sequence generation (selection bias) | Unclear risk | Quote: "Twenty‐five male geriatric mental patients were selected... Patients adjudged eligible for participation were randomly placed in either an experimental or control group" |
| Allocation concealment (selection bias) | Unclear risk | Insufficient information provided |
| Blinding of participants and personnel (performance bias) | High risk | No report of blinding of participants but usual care so intervention would have been obvious |
| Incomplete outcome data (attrition bias) | Unclear risk | No reporting of losses to follow up |
| Selective reporting (reporting bias) | Unclear risk | Protocol unavailable |
| Other bias | Low risk | No other apparent risks of bias |
| Methods | Design: RCT | |
| Participants | Country: Australia Consent: assent accepted Inclusion criteria: mild to moderate dementia, assessments made by local Aged Care Assessment Team, level determined by MMSE < 23, resident in an aged care facility, legally and cognitively capable of providing informed consent to participate, able to respond appropriately to the majority of verbal requests, physically capable of undertaking some form of gentle but regular exercise, efforts to ensure participants were joining of their own free choice (frequent questioning where there were memory problems) Exclusion criteria: cognitive = severe dementia, MMSE of 0 to 9 % Eligible within home: not reported Group 1: N = 30; women = 23; mean age = 81 years | |
| Interventions | Study aim or objective: to measure the effects of exercise on cognitive symptoms related to dementia and disability levels Number of experimental groups: 3 Groups: Intervention: based on joint and large muscle group movement with an intention to create gentle aerobic exertion, designed to include those in wheelchairs or with impaired movement, generation‐appropriate music, data only analysed where participant attended = 75% of sessions | |
| Outcomes | Cognition: Clock‐drawing Tool (Shulman 1993) | |
| Notes | Funding: not reported | |
| Risk of bias | ||
| Bias | Authors' judgement | Support for judgement |
| Random sequence generation (selection bias) | Low risk | Stated randomised by lottery method |
| Allocation concealment (selection bias) | Unclear risk | Insufficient information provided |
| Blinding of participants and personnel (performance bias) | High risk | No blinding reported for participants or personnel. Outcome measurements could have been influenced by lack of blinding |
| Incomplete outcome data (attrition bias) | High risk | Data only provided for 75 participants who completed. Ill health, death, or lack of interest resulted in substantial dropouts (128 agreed to participate), but numbers from each groups not reported |
| Selective reporting (reporting bias) | Unclear risk | Protocol unavailable |
| Other bias | Low risk | No other apparent risks of bias |
| Methods | Design: cluster RCT | |
| Participants | Characterisation: elderly women of care facilities | |
| Interventions | Study aim or objective: to compare the effects of a 16 week group exercise program on the physical function and mental health of older elderly women ( ≥ 75 years) compared with younger elderly women (<75 years) | |
| Outcomes | Physical function (other): sit‐to‐stand (average number in 30 seconds) | |
| Notes | ‐ | |
| Risk of bias | ||
| Bias | Authors' judgement | Support for judgement |
| Random sequence generation (selection bias) | Unclear risk | There appears to have been random sequence generation. However, the process is unclear |
| Allocation concealment (selection bias) | Unclear risk | Insufficient information provided |
| Blinding of participants and personnel (performance bias) | High risk | Cluster, but one group usual care |
| Incomplete outcome data (attrition bias) | Low risk | Three lost from control, none from exercise; reasons not related to intervention |
| Selective reporting (reporting bias) | Unclear risk | Protocol unavailable |
| Other bias | Low risk | No other apparent risks of bias |
| Methods | Design: cluster RCT | |
| Participants | Characterisation: elderly residents | |
| Interventions | Study aim or objective: to investigate the effects of low‐intensity and short‐term Tai Chi practice on sleep quality, general well‐being, and physical performance | |
| Outcomes | Physical function (other): 2‐minute step in place | |
| Notes | ‐ | |
| Risk of bias | ||
| Bias | Authors' judgement | Support for judgement |
| Random sequence generation (selection bias) | Low risk | Two care facilities were selected. Assignment to experiment or control was done by simple drawing |
| Allocation concealment (selection bias) | Unclear risk | Insufficient information provided |
| Blinding of participants and personnel (performance bias) | Unclear risk | No report of blinding of participants, although control and experimental groups were in different homes, so participants possibly were not aware if they were intervention or control |
| Incomplete outcome data (attrition bias) | High risk | Imbalance in number of participants lost to follow up between groups (more in intervention than in control) |
| Selective reporting (reporting bias) | Unclear risk | Protocol unavailable |
| Other bias | Low risk | No other apparent risks of bias |
| Methods | Design: RCT | |
| Participants | Country: USA Consent: not specified Inclusion criteria: diagnosis of dementia (on MMSE), 6 or more errors out of 10 on Short Portable Mental Status Questionnaire, ability to stand with assistance of 2 people Exclusion criteria: medical: evidence of stroke, head injury, major psychiatric problem, mental retardation % Eligible within home: 80 | |
| Interventions | Study aim or objective: to compare the effects of skill training, a traditional stimulation approach, and regular care on the ability to perform basic activities of daily living of nursing‐home residents with dementia Number of experimental groups: 3 Skill training group: focused on re‐gaining function in basic ADL through repeated practice, with graded assistance Stimulation group: recreation‐orientated activities, group discussion, music, and relaxation Control group: usual care The interventions were delivered in group format by a clinical specialist in gerontological nursing, assisted by a rehabilitation aide, for 2.5 hours per day, 5 days a week, for 20 weeks | |
| Outcomes | Physical function in ADL: Performance Test of Activities of Daily Living (PADL), Physical Self‐Maintenance Scale (Lawton 1969), | |
| Notes | Funding: The Robert Wood Johnson Foundation grant | |
| Risk of bias | ||
| Bias | Authors' judgement | Support for judgement |
| Random sequence generation (selection bias) | Unclear risk | Stated "randomly assigned", but no information provided on randomisation procedure |
| Allocation concealment (selection bias) | Unclear risk | Insufficient information provided |
| Blinding of participants and personnel (performance bias) | High risk | No evidence that participants or people delivering the intervention were blinded |
| Blinding of outcome assessment (detection bias) | Low risk | Data collectors were blind to group assignment |
| Incomplete outcome data (attrition bias) | Unclear risk | Only 3 were lost to illness/hospitalisation following pre‐testing (4 overall). However, it could not be determined if they from intervention or control group |
| Selective reporting (reporting bias) | Unclear risk | Protocol unavailable |
| Other bias | Low risk | No other apparent risks of bias |
| Methods | Design: RCT | |
| Participants | Country: USA Consent: assent accepted Inclusion criteria: Alzheimer's disease, MMSE < 23, ability to stand, ability to mobilise with assistance +/‐ aid Exclusion criteria: medical = vascular dementia, stroke, Parkinson's disease, major depression, schizophrenia % Eligible within home: not reported Walking group: N = 26; mean age = 87.4 years (SD 5.87) Conversation group: N = 24; mean age = 89.6 years (SD 6.53) Walk and talk group: N = 21 | |
| Interventions | Study aim or objective: to examine the effect of a combination of exercise and conversation with walking‐only exercise and conversation‐only treatments on the functional mobility of frail nursing‐home residents with Alzheimer's disease Number of experimental groups: 3 Walking group: self‐paced with rests as required, and physical assistance, a device or both as required, no conversation initiated, but researcher responded to communication Conversation group: Holland's approach (aphasia) and facilitation for people with Alzheimer’s, used in natural conversation Walk and talk group: both interventions simultaneously within a 30‐minute session | |
| Outcomes | Physical function in ADL: modified 6‐minute walk (Tappen 1997) | |
| Notes | Funding: National Institute for Nursing Research grant | |
| Risk of bias | ||
| Bias | Authors' judgement | Support for judgement |
| Random sequence generation (selection bias) | Unclear risk | Quote: "Random assignment to treatment group" |
| Allocation concealment (selection bias) | Unclear risk | Insufficient information provided |
| Blinding of participants and personnel (performance bias) | Unclear risk | No information regarding blinding of participants. Control involved an intervention (talking), but the only measure was physical |
| Blinding of outcome assessment (detection bias) | Low risk | Quote: "Raters were blinded to treatment group assignment" |
| Incomplete outcome data (attrition bias) | Unclear risk | Reasonably balanced losses, but reasons per group not given |
| Selective reporting (reporting bias) | Unclear risk | Protocol unavailable |
| Other bias | Low risk | No other apparent risks of bias |
| Methods | Design: RCT | |
| Participants | Country: USA Consent: fully‐informed consent Inclusion criteria: able to walk approximately 250 feet independently with or without aid, Tinetti Score 14 to 24 Exclusion criteria: cognitive = dementia; medical = serious illness requiring medical intervention in previous 6 months % Eligible within home: not reported Intervention group: N = 6; mean age = 89 years (SD 5.1); range = 81 to 95 years Control group: N = 7; mean age = 82.2 years (SD 4.6); range = 73 to 88 years | |
| Interventions | Study aim or objective: to determine the effects of 2 exercise programmes on balance in elderly ambulatory people Number of experimental groups: 2 Exercise group I (control group): traditional exercise incorporating balance and strengthening exercises; no specific equipment used; included weight transference, walking, and lower limb strengthening Exercise group 2 (intervention group): traditional exercise as above, plus Swiss ball exercises to improve dynamic balance and strengthening component Both interventions delivered in group format by a physiotherapy student | |
| Outcomes | Falls: falls (any episodes for participant) | |
| Notes | Funding: grants from Kentucky Physical Therapy Association and the University of Louisville Graduate Research fund | |
| Risk of bias | ||
| Bias | Authors' judgement | Support for judgement |
| Random sequence generation (selection bias) | Unclear risk | No information provided on randomisation procedure |
| Allocation concealment (selection bias) | Unclear risk | Insufficient information provided |
| Blinding of participants and personnel (performance bias) | Unclear risk | No information provided; both groups received physical interventions |
| Blinding of outcome assessment (detection bias) | Unclear risk | No report of blinding of outcome assessment |
| Incomplete outcome data (attrition bias) | Unclear risk | 13 participants completed the intervention phase, but unclear if there were 13 at the onset |
| Selective reporting (reporting bias) | Unclear risk | Protocol unavailable |
| Other bias | Low risk | No other apparent risks of bias |
| Methods | Design: RCT | |
| Participants | Country: USA Consent: not specified Inclusion criteria: used the first 30 participants scoring > 25 on Parachek Geriatric Rating Scale, residential status Exclusion criteria: see inclusion criteria % Eligible within home: not reported Intervention: | |
| Interventions | Study aim or objective: hypothesised that participants engaged in the added‐purpose, occupationally‐embedded exercise would engage in more repetitions, and exercise for a longer duration and with fewer stops than the participants engaged in rote exercise Number of experimental groups: 2 Added‐purpose, occupationally‐embedded exercise condition designed, through materials and instructions, to elicit a rotary arm exercise with the added purpose of stirring cookie dough Compared with an occupational form designed to elicit the rotary arm exercise with no added purpose | |
| Outcomes | Endurance (physical other): duration of exercise | |
| Notes | Funding: not reported | |
| Risk of bias | ||
| Bias | Authors' judgement | Support for judgement |
| Random sequence generation (selection bias) | Unclear risk | No information provided on randomisation procedure |
| Allocation concealment (selection bias) | Unclear risk | Insufficient information provided |
| Blinding of participants and personnel (performance bias) | High risk | Personnel unblinded |
| Incomplete outcome data (attrition bias) | Low risk | Appears there were no losses to follow up |
| Selective reporting (reporting bias) | Unclear risk | Protocol unavailable |
| Other bias | Low risk | No other apparent risks of bias |
ADL: activities of daily living
BBS: Berg Balance Scale
BI: Barthel Index
BMI: body mass index
CI: confidence interval
dB: decibels
FIM: Functional Independence Measure
FIT: Functional Incidental Training
GDS: Geriatric Depression Scale
GP: general practitioner
HADS‐D: Hospital Anxiety and Depression Scale (depression subscore)
ITT: intention‐to‐treat
MDS: Minimum Data Set
MMSE: Mini‐Mental State Examination
n/a = not applicable
RCT: randomised controlled trial
RMI: Rivermead Mobility Index
OSAI: Obstructive Sleep Apnea Index
SD: standard deviation
TUG test: Timed Up and Go test
Characteristics of excluded studies [ordered by study ID]
| Study | Reason for exclusion |
| Not primarily physical outcomes of interest (sleep‐orientated) | |
| Review team consensus agreed that the study accommodation (congregate housing) was not synonymous with a long‐term care environment | |
| Participants were self‐caring within a long‐term care environment; interventions were of a psychological, rather than physical, nature | |
| Focus of study was compliance, rather than improving physical condition | |
| Multi‐faceted intervention included staff and resident education, advice on environmental adaptations, and hip protectors | |
| Comparison of the same exercise intervention; 1 group was provided with vitamin supplement | |
| Focus was behavioural management, rather than physical activity | |
| Aimed to prevent admission to long‐term care | |
| Participants were not randomly allocated to study conditions | |
| The intervention was not primarily physical rehabilitation | |
| Participants were assigned to exercise group or comparative group by personal choice (those who did, or did not, want to attend exercise sessions) | |
| Multi‐factorial falls prevention programme including medication review, podiatry, and optometry | |
| The intervention was not aimed at improving physical condition | |
| A review paper that described an apparently relevant study, although insufficient information was provided, and no reference cited. The author was contacted for further information; however, we received no reply | |
| Not a RCT | |
| Evaluated the effect of exercise on depression, rather than physical outcomes | |
| Review team consensus deemed passive interventions to reduce contractures to be beyond the scope of this review | |
| Aimed to improve communication, rather than physical performance measures | |
| No physical outcomes evaluated | |
| Participants not randomised | |
| The participants included visitors to the centre | |
| Interventions targeted cognitive, rather than physical, functioning | |
| Non‐random allocation of participants | |
| Multi‐faceted intervention to address falls prevention | |
| Multi‐faceted intervention to address falls prevention | |
| Communication with the authors identified very few long‐term care residents for whom no separate data were available | |
| This was an abstract only for a poster and included no detailed results | |
| Interventions were not aimed primarily at improving physical condition | |
| Falls risk management programme | |
| Poster with insufficient data to assess inclusion and included no detailed results | |
| The intervention was not intended to address their physical condition | |
| Review team consensus deemed passive interventions to reduce contractures to be beyond the scope of this review | |
| Non‐random allocation to the study conditions | |
| Multi‐faceted intervention to address falls risk | |
| Review team consensus excluded this paper on the basis that no objective physical outcomes measures were used | |
| While the intervention was occupational therapy, the aim was to reduce depression, rather than affect physical condition | |
| Primary focus on reduction of falls | |
| Non‐random allocation to the study conditions | |
| Multi‐facted falls prevention programme | |
| Non‐random allocation to the study conditions | |
| Non‐random allocation of participants | |
| Participants were visitors, rather than residents, of care homes | |
| Only a small proportion of participants were residing in institutional care; the majority were independently living in the community. The authors were contacted for separate data, but none were available | |
| Participants were from out‐patient facilities and nursing homes | |
| Participants were community‐dwelling | |
| Not a physical rehabilitation intervention | |
| Not a RCT | |
| Focused on memory, rather than physical outcomes of interest | |
| Non‐random allocation of participants | |
| Focus on contractures | |
| Particpants recruited from a variety of settings; no separate data available for long‐term care residents | |
| Included independent living and residential‐care participants | |
| Non‐random allocation of participants |
RCT: randomised controlled trial
Characteristics of studies awaiting assessment [ordered by study ID]
| Methods | ‐ |
| Participants | ‐ |
| Interventions | ‐ |
| Outcomes | ‐ |
| Notes | Not yet assessed |
| Methods | ‐ |
| Participants | ‐ |
| Interventions | ‐ |
| Outcomes | ‐ |
| Notes | Not yet assessed |
| Methods | ‐ |
| Participants | ‐ |
| Interventions | ‐ |
| Outcomes | ‐ |
| Notes | Not yet assessed |
| Methods | ‐ |
| Participants | ‐ |
| Interventions | ‐ |
| Outcomes | ‐ |
| Notes | Not yet assessed |
| Methods | RCT |
| Participants | N = 36 Frail older nursing‐home residents |
| Interventions | Low‐intensity exercise programme |
| Outcomes | Disability, strength, functional capacity, balance, agility, and walking speed |
| Notes | Translation needed |
| Methods | ‐ |
| Participants | ‐ |
| Interventions | ‐ |
| Outcomes | ‐ |
| Notes | Not yet assessed |
| Methods | ‐ |
| Participants | ‐ |
| Interventions | ‐ |
| Outcomes | ‐ |
| Notes | Not yet assessed |
| Methods | ‐ |
| Participants | ‐ |
| Interventions | ‐ |
| Outcomes | ‐ |
| Notes | Not yet assessed |
| Methods | ‐ |
| Participants | ‐ |
| Interventions | ‐ |
| Outcomes | ‐ |
| Notes | Not yet assessed |
| Methods | ‐ |
| Participants | ‐ |
| Interventions | ‐ |
| Outcomes | ‐ |
| Notes | Not yet assessed |
| Methods | ‐ |
| Participants | ‐ |
| Interventions | ‐ |
| Outcomes | ‐ |
| Notes | Not yet assessed |
| Methods | ‐ |
| Participants | ‐ |
| Interventions | ‐ |
| Outcomes | ‐ |
| Notes | Not yet assessed |
| Methods | ‐ |
| Participants | ‐ |
| Interventions | ‐ |
| Outcomes | ‐ |
| Notes | Not yet assessed |
| Methods | ‐ |
| Participants | ‐ |
| Interventions | ‐ |
| Outcomes | ‐ |
| Notes | Not yet assessed |
| Methods | ‐ |
| Participants | ‐ |
| Interventions | ‐ |
| Outcomes | ‐ |
| Notes | Not yet assessed |
| Methods | ‐ |
| Participants | ‐ |
| Interventions | ‐ |
| Outcomes | ‐ |
| Notes | Not yet assessed |
| Methods | ‐ |
| Participants | ‐ |
| Interventions | ‐ |
| Outcomes | ‐ |
| Notes | Not yet assessed. Unable to get. |
| Methods | ‐ |
| Participants | ‐ |
| Interventions | ‐ |
| Outcomes | ‐ |
| Notes | Not yet assessed |
| Methods | ‐ |
| Participants | ‐ |
| Interventions | ‐ |
| Outcomes | ‐ |
| Notes | Not yet assessed |
| Methods | ‐ |
| Participants | ‐ |
| Interventions | ‐ |
| Outcomes | ‐ |
| Notes | Not yet assessed |
| Methods | ‐ |
| Participants | ‐ |
| Interventions | ‐ |
| Outcomes | ‐ |
| Notes | Not yet assessed |
| Methods | ‐ |
| Participants | ‐ |
| Interventions | ‐ |
| Outcomes | ‐ |
| Notes | Not yet assessed |
| Methods | ‐ |
| Participants | ‐ |
| Interventions | ‐ |
| Outcomes | ‐ |
| Notes | Not yet assessed. Reports associated with Resnick 2009. |
| Methods | ‐ |
| Participants | ‐ |
| Interventions | ‐ |
| Outcomes | ‐ |
| Notes | Not yet assessed. Reports associated with Rosendahl 2006. |
| Methods | ‐ |
| Participants | ‐ |
| Interventions | ‐ |
| Outcomes | ‐ |
| Notes | Not yet assessed |
| Methods | ‐ |
| Participants | ‐ |
| Interventions | ‐ |
| Outcomes | ‐ |
| Notes | Not yet assessed |
| Methods | ‐ |
| Participants | ‐ |
| Interventions | ‐ |
| Outcomes | ‐ |
| Notes | Translation needed |
| Methods | ‐ |
| Participants | ‐ |
| Interventions | ‐ |
| Outcomes | ‐ |
| Notes | Not yet assessed |
| Methods | ‐ |
| Participants | ‐ |
| Interventions | ‐ |
| Outcomes | ‐ |
| Notes | Not yet assessed |
| Methods | ‐ |
| Participants | ‐ |
| Interventions | ‐ |
| Outcomes | ‐ |
| Notes | Not yet assessed |
| Methods | ‐ |
| Participants | ‐ |
| Interventions | ‐ |
| Outcomes | ‐ |
| Notes | Unable to get. Request sent to author [email protected] ‐ bounced |
Characteristics of ongoing studies [ordered by study ID]
| Trial name or title | Older people's exercise intervention in residential and nursing accommodation |
| Methods | ‐ |
| Participants | Residents in nursing home, over 65 years, able to participate in baseline assessment, able to transfer |
| Interventions | Physical activation and group‐based exercise programme |
| Outcomes | Impact on depression, EQ‐5D, mobility, falls, cognitive function, pain, medication use, hospital admissions |
| Starting date | 1 January 2008 |
| Contact information | Martin Underwood |
| Notes | ‐ |
| Trial name or title | The effect of exercise on muscle, function and cost in VA nursing home residents |
| Methods | ‐ |
| Participants | Residents in VA nursing home, 65 years or older, able to follow one‐step commands |
| Interventions | Low‐intensity exercise |
| Outcomes | Muscle mass, physical function, cost |
| Starting date | 2002 |
| Contact information | ‐ |
| Notes | HSRP20071249 |
| Trial name or title | Physical and daily activity for residents in a nursing home setting ‐ A Nordic multi‐centre study |
| Methods | ‐ |
| Participants | Residents expected to stay in nursing homes > 3 months |
| Interventions | Individually‐tailored enhanced activities of daily living training |
| Outcomes | Physical function, well‐being, amount of activity, falls |
| Starting date | August 2005 |
| Contact information | Kerstin Frandin |
| Notes | ‐ |
| Trial name or title | Health enhancing strength training in nonagenarians (STRONG) |
| Methods | RCT |
| Participants | Sixty residents of a geriatric nursing home (age range = 90 to 102 years) |
| Interventions | Muscle strengthening and aerobic exercises over 6 months |
| Outcomes | SF‐12, Tinetti mobility scale, BI, 1RM leg press, hand grip strength, 8‐metre walk test, 4‐step stairs test, BMI, physical activity (Actigraph), MMSE, falls, and other adverse events |
| Starting date | March 2009 |
| Contact information | Alejandro Lucia [email protected] |
| Notes | ‐ |
BI: Barthel Index
BMI: body mass index
MMSE: Mini‐Mental State Examinsation
RCT: randomised controlled trial
Data and analyses
| Outcome or subgroup title | No. of studies | No. of participants | Statistical method | Effect size |
| 1 Barthel Index Show forest plot | 7 | 857 | Mean Difference (Random, 95% CI) | 6.38 [1.63, 11.12] |
| Analysis 1.1  Comparison 1 Rehabilitation versus control, Outcome 1 Barthel Index. | ||||
| 2 Functional Independence Measure (FIM) Show forest plot | 4 | 303 | Mean Difference (Random, 95% CI) | 4.98 [‐1.55, 11.51] |
| Analysis 1.2  Comparison 1 Rehabilitation versus control, Outcome 2 Functional Independence Measure (FIM). | ||||
| 3 Rivermead Mobility Index (RMI) Show forest plot | 3 | 323 | Mean Difference (Random, 95% CI) | 0.69 [0.04, 1.33] |
| Analysis 1.3 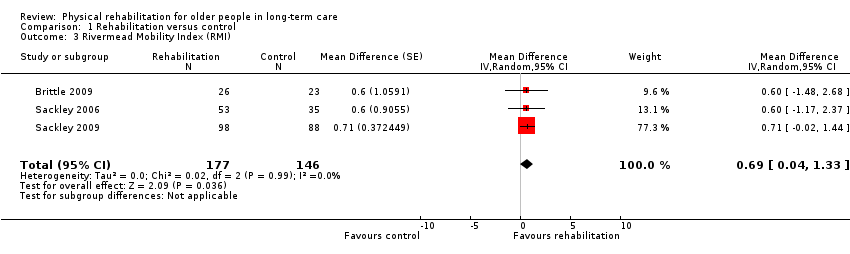 Comparison 1 Rehabilitation versus control, Outcome 3 Rivermead Mobility Index (RMI). | ||||
| 4 Timed Up and Go (TUG) Test Show forest plot | 7 | 885 | Mean Difference (Random, 95% CI) | ‐4.59 [‐9.19, 0.01] |
| Analysis 1.4 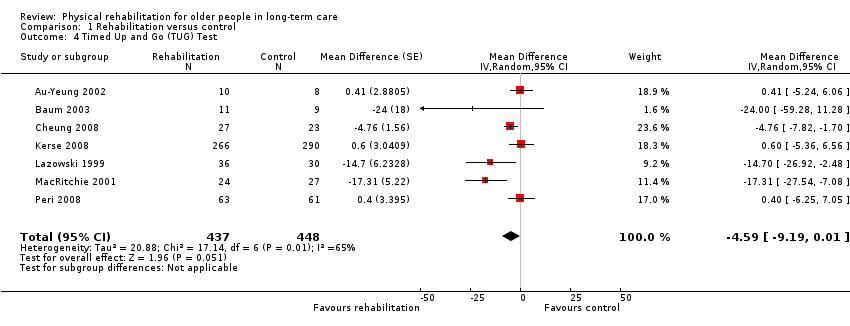 Comparison 1 Rehabilitation versus control, Outcome 4 Timed Up and Go (TUG) Test. | ||||
| 5 Walking speed Show forest plot | 9 | 590 | Mean Difference (Random, 95% CI) | 0.03 [‐0.01, 0.07] |
| Analysis 1.5  Comparison 1 Rehabilitation versus control, Outcome 5 Walking speed. | ||||
| 6 Death Show forest plot | 25 | 3721 | Risk Ratio (M‐H, Random, 95% CI) | 0.95 [0.80, 1.13] |
| Analysis 1.6  Comparison 1 Rehabilitation versus control, Outcome 6 Death. | ||||
| 7 Barthel Index (by risk of bias) Show forest plot | 7 | Mean Difference (Random, 95% CI) | Subtotals only | |
| Analysis 1.7 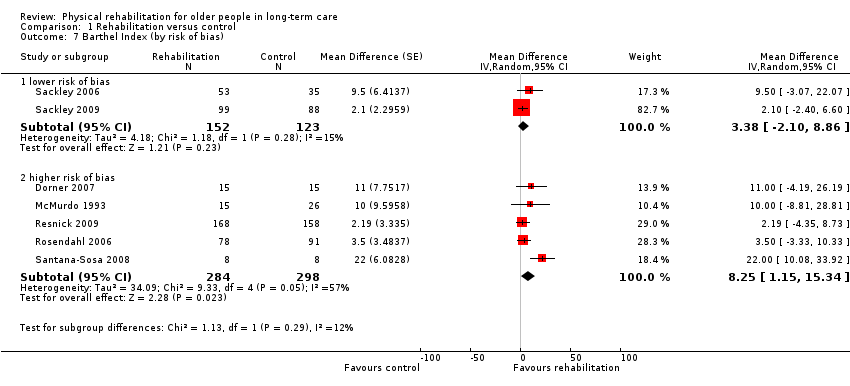 Comparison 1 Rehabilitation versus control, Outcome 7 Barthel Index (by risk of bias). | ||||
| 7.1 lower risk of bias | 2 | 275 | Mean Difference (Random, 95% CI) | 3.38 [‐2.10, 8.86] |
| 7.2 higher risk of bias | 5 | 582 | Mean Difference (Random, 95% CI) | 8.25 [1.15, 15.34] |
| 8 Barthel Index (by duration of intervention) Show forest plot | 7 | Mean Difference (Random, 95% CI) | Subtotals only | |
| Analysis 1.8  Comparison 1 Rehabilitation versus control, Outcome 8 Barthel Index (by duration of intervention). | ||||
| 8.1 shorter (< 3 months intervention) | 2 | 46 | Mean Difference (Random, 95% CI) | 17.55 [6.97, 28.13] |
| 8.2 longer (3+ months intervention) | 5 | 811 | Mean Difference (Random, 95% CI) | 3.08 [‐0.03, 6.19] |
| 9 Barthel Index (by mode of delivery) Show forest plot | 7 | Mean Difference (Random, 95% CI) | Subtotals only | |
| Analysis 1.9 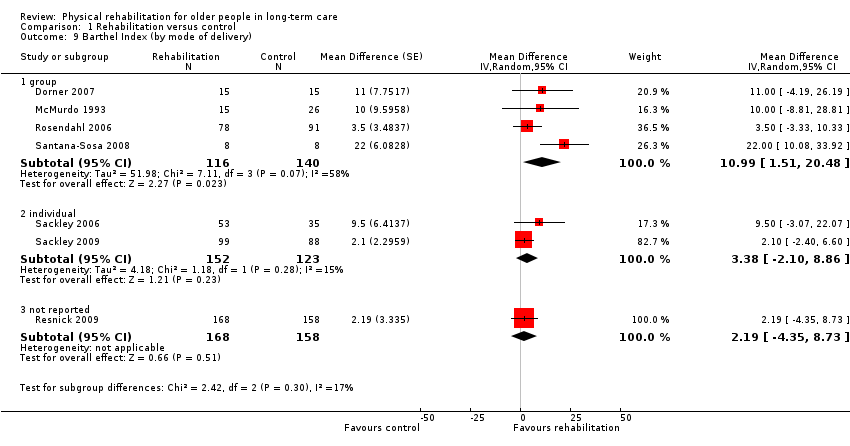 Comparison 1 Rehabilitation versus control, Outcome 9 Barthel Index (by mode of delivery). | ||||
| 9.1 group | 4 | 256 | Mean Difference (Random, 95% CI) | 10.99 [1.51, 20.48] |
| 9.2 individual | 2 | 275 | Mean Difference (Random, 95% CI) | 3.38 [‐2.10, 8.86] |
| 9.3 not reported | 1 | 326 | Mean Difference (Random, 95% CI) | 2.19 [‐4.35, 8.73] |
| 10 Barthel Index (by baseline Barthel Index score) Show forest plot | 6 | Mean Difference (Random, 95% CI) | Subtotals only | |
| Analysis 1.10  Comparison 1 Rehabilitation versus control, Outcome 10 Barthel Index (by baseline Barthel Index score). | ||||
| 10.1 better (baseline Barthel Index score > median) | 3 | 511 | Mean Difference (Random, 95% CI) | 7.94 [‐1.77, 17.64] |
| 10.2 worse (baseline Barthel Index score < median) | 3 | 305 | Mean Difference (Random, 95% CI) | 3.97 [‐0.83, 8.78] |
| 11 Barthel Index (by age) Show forest plot | 7 | Mean Difference (Random, 95% CI) | Subtotals only | |
| Analysis 1.11 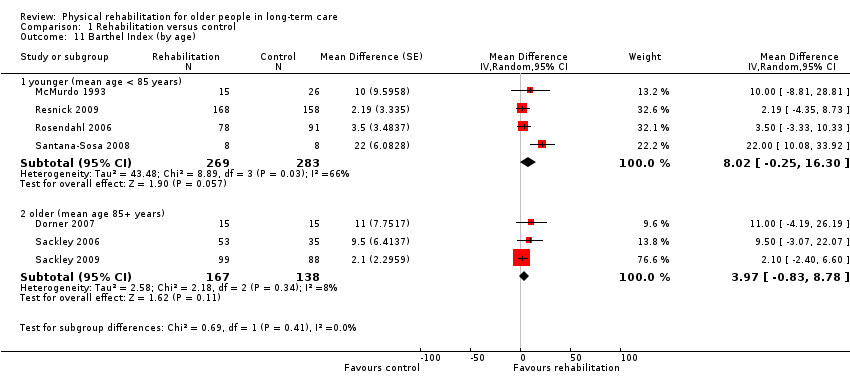 Comparison 1 Rehabilitation versus control, Outcome 11 Barthel Index (by age). | ||||
| 11.1 younger (mean age < 85 years) | 4 | 552 | Mean Difference (Random, 95% CI) | 8.02 [‐0.25, 16.30] |
| 11.2 older (mean age 85+ years) | 3 | 305 | Mean Difference (Random, 95% CI) | 3.97 [‐0.83, 8.78] |
| 12 Barthel Index (by gender) Show forest plot | 7 | Mean Difference (Random, 95% CI) | Subtotals only | |
| Analysis 1.12 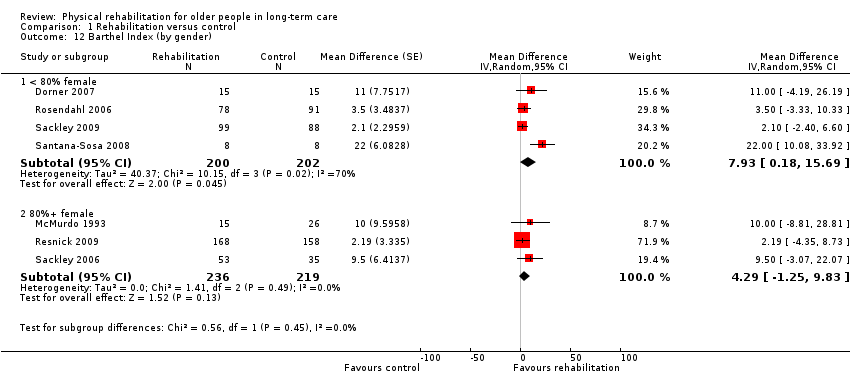 Comparison 1 Rehabilitation versus control, Outcome 12 Barthel Index (by gender). | ||||
| 12.1 < 80% female | 4 | 402 | Mean Difference (Random, 95% CI) | 7.93 [0.18, 15.69] |
| 12.2 80%+ female | 3 | 455 | Mean Difference (Random, 95% CI) | 4.29 [‐1.25, 9.83] |
| 13 Functional Independence Measure (by risk of bias) Show forest plot | 4 | Mean Difference (Random, 95% CI) | Subtotals only | |
| Analysis 1.13 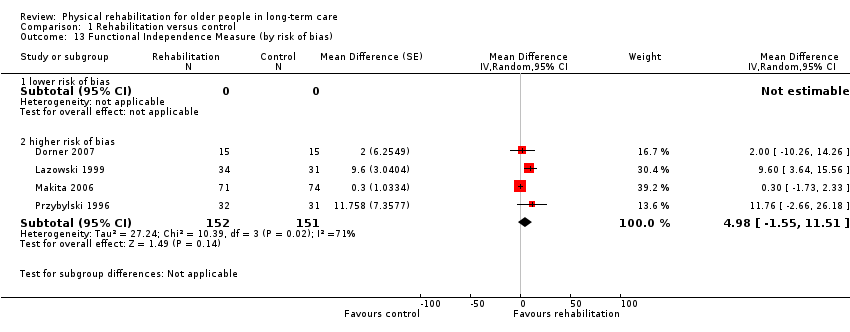 Comparison 1 Rehabilitation versus control, Outcome 13 Functional Independence Measure (by risk of bias). | ||||
| 13.1 lower risk of bias | 0 | 0 | Mean Difference (Random, 95% CI) | 0.0 [0.0, 0.0] |
| 13.2 higher risk of bias | 4 | 303 | Mean Difference (Random, 95% CI) | 4.98 [‐1.55, 11.51] |
| 14 Functional Independence Measure (by duration of intervention) Show forest plot | 4 | Mean Difference (Random, 95% CI) | Subtotals only | |
| Analysis 1.14 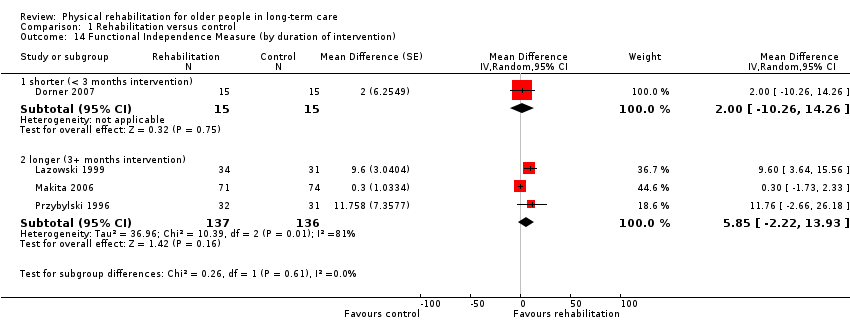 Comparison 1 Rehabilitation versus control, Outcome 14 Functional Independence Measure (by duration of intervention). | ||||
| 14.1 shorter (< 3 months intervention) | 1 | 30 | Mean Difference (Random, 95% CI) | 2.0 [‐10.26, 14.26] |
| 14.2 longer (3+ months intervention) | 3 | 273 | Mean Difference (Random, 95% CI) | 5.85 [‐2.22, 13.93] |
| 15 Functional Independence Measure (by mode of delivery) Show forest plot | 4 | Mean Difference (Random, 95% CI) | Subtotals only | |
| Analysis 1.15 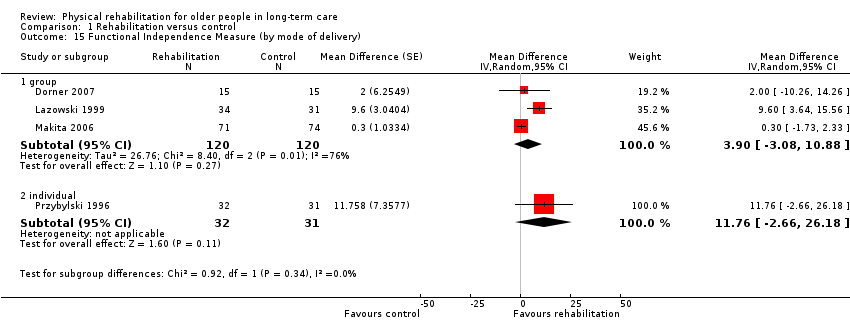 Comparison 1 Rehabilitation versus control, Outcome 15 Functional Independence Measure (by mode of delivery). | ||||
| 15.1 group | 3 | 240 | Mean Difference (Random, 95% CI) | 3.90 [‐3.08, 10.88] |
| 15.2 individual | 1 | 63 | Mean Difference (Random, 95% CI) | 11.76 [‐2.66, 26.18] |
| 16 Functional Independence Measure (by baseline FIM score) Show forest plot | 3 | Mean Difference (Random, 95% CI) | Subtotals only | |
| Analysis 1.16 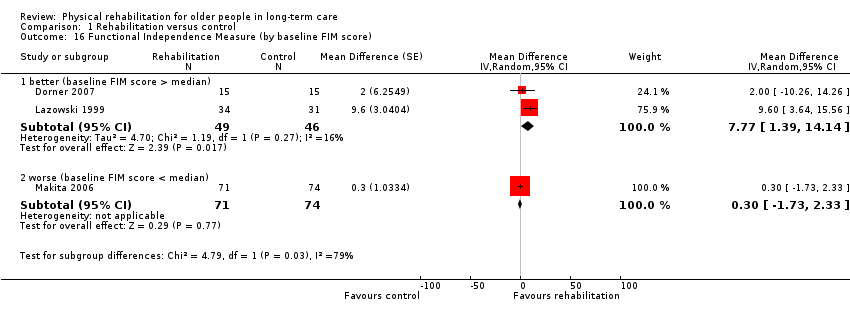 Comparison 1 Rehabilitation versus control, Outcome 16 Functional Independence Measure (by baseline FIM score). | ||||
| 16.1 better (baseline FIM score > median) | 2 | 95 | Mean Difference (Random, 95% CI) | 7.77 [1.39, 14.14] |
| 16.2 worse (baseline FIM score < median) | 1 | 145 | Mean Difference (Random, 95% CI) | 0.3 [‐1.73, 2.33] |
| 17 Functional Independence Measure (by age) Show forest plot | 4 | Mean Difference (Random, 95% CI) | Subtotals only | |
| Analysis 1.17 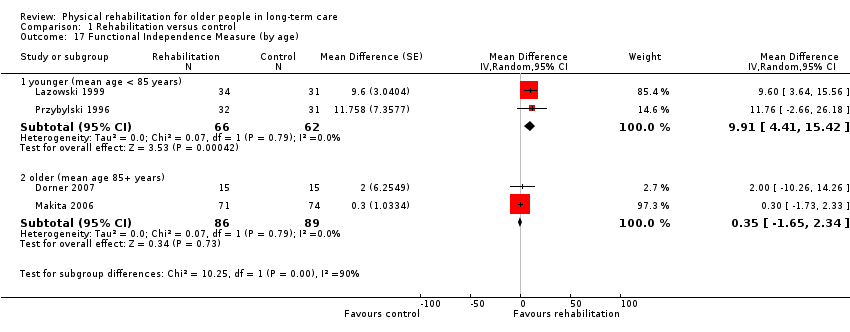 Comparison 1 Rehabilitation versus control, Outcome 17 Functional Independence Measure (by age). | ||||
| 17.1 younger (mean age < 85 years) | 2 | 128 | Mean Difference (Random, 95% CI) | 9.91 [4.41, 15.42] |
| 17.2 older (mean age 85+ years) | 2 | 175 | Mean Difference (Random, 95% CI) | 0.35 [‐1.65, 2.34] |
| 18 Functional Independence Measure (by gender) Show forest plot | 4 | Mean Difference (Random, 95% CI) | Subtotals only | |
| Analysis 1.18  Comparison 1 Rehabilitation versus control, Outcome 18 Functional Independence Measure (by gender). | ||||
| 18.1 < 80% female | 2 | 93 | Mean Difference (Random, 95% CI) | 6.11 [‐3.33, 15.55] |
| 18.2 80%+ female | 2 | 210 | Mean Difference (Random, 95% CI) | 4.51 [‐4.56, 13.58] |
| 19 Rivermead Mobility Index (by risk of bias) Show forest plot | 3 | Mean Difference (Random, 95% CI) | Subtotals only | |
| Analysis 1.19  Comparison 1 Rehabilitation versus control, Outcome 19 Rivermead Mobility Index (by risk of bias). | ||||
| 19.1 lower risk of bias | 3 | 323 | Mean Difference (Random, 95% CI) | 0.69 [0.04, 1.33] |
| 19.2 higher risk of bias | 0 | 0 | Mean Difference (Random, 95% CI) | 0.0 [0.0, 0.0] |
| 20 Rivermead Mobility Index (by duration of intervention) Show forest plot | 3 | Mean Difference (Random, 95% CI) | Subtotals only | |
| Analysis 1.20  Comparison 1 Rehabilitation versus control, Outcome 20 Rivermead Mobility Index (by duration of intervention). | ||||
| 20.1 shorter (< 3 months intervention) | 1 | 49 | Mean Difference (Random, 95% CI) | 0.6 [‐1.48, 2.68] |
| 20.2 longer (3+ months intervention) | 2 | 274 | Mean Difference (Random, 95% CI) | 0.69 [0.02, 1.37] |
| 21 Rivermead Mobility Index (by mode of delivery) Show forest plot | 3 | Mean Difference (Random, 95% CI) | Subtotals only | |
| Analysis 1.21 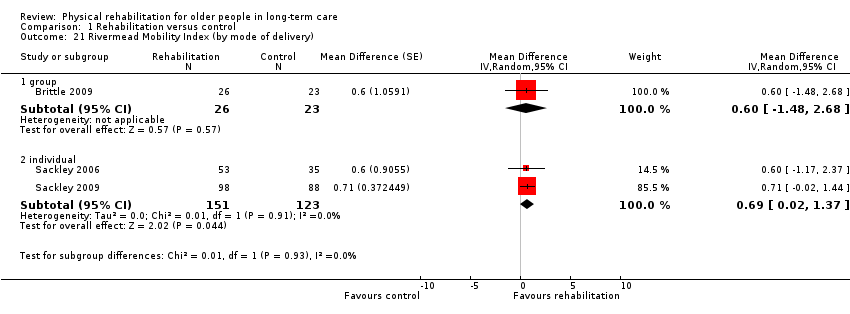 Comparison 1 Rehabilitation versus control, Outcome 21 Rivermead Mobility Index (by mode of delivery). | ||||
| 21.1 group | 1 | 49 | Mean Difference (Random, 95% CI) | 0.6 [‐1.48, 2.68] |
| 21.2 individual | 2 | 274 | Mean Difference (Random, 95% CI) | 0.69 [0.02, 1.37] |
| 22 Rivermead Mobility Index (by baseline RMI score) Show forest plot | 3 | Mean Difference (Random, 95% CI) | Subtotals only | |
| Analysis 1.22  Comparison 1 Rehabilitation versus control, Outcome 22 Rivermead Mobility Index (by baseline RMI score). | ||||
| 22.1 better (baseline RMI score > median) | 2 | 235 | Mean Difference (Random, 95% CI) | 0.70 [0.01, 1.39] |
| 22.2 worse (baseline RMI score < median) | 1 | 88 | Mean Difference (Random, 95% CI) | 0.6 [‐1.17, 2.37] |
| 23 Rivermead Mobility Index (by age) Show forest plot | 3 | Mean Difference (Random, 95% CI) | Subtotals only | |
| Analysis 1.23 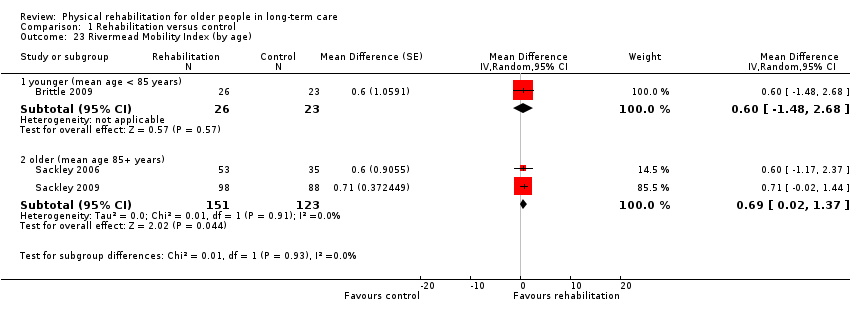 Comparison 1 Rehabilitation versus control, Outcome 23 Rivermead Mobility Index (by age). | ||||
| 23.1 younger (mean age < 85 years) | 1 | 49 | Mean Difference (Random, 95% CI) | 0.6 [‐1.48, 2.68] |
| 23.2 older (mean age 85+ years) | 2 | 274 | Mean Difference (Random, 95% CI) | 0.69 [0.02, 1.37] |
| 24 Rivermead Mobility Index (by gender) Show forest plot | 3 | Mean Difference (Random, 95% CI) | Subtotals only | |
| Analysis 1.24  Comparison 1 Rehabilitation versus control, Outcome 24 Rivermead Mobility Index (by gender). | ||||
| 24.1 < 80% female | 2 | 235 | Mean Difference (Random, 95% CI) | 0.70 [0.01, 1.39] |
| 24.2 80%+ female | 1 | 88 | Mean Difference (Random, 95% CI) | 0.6 [‐1.17, 2.37] |
| 25 TUG Test (by risk of bias) Show forest plot | 7 | Mean Difference (Random, 95% CI) | Subtotals only | |
| Analysis 1.25 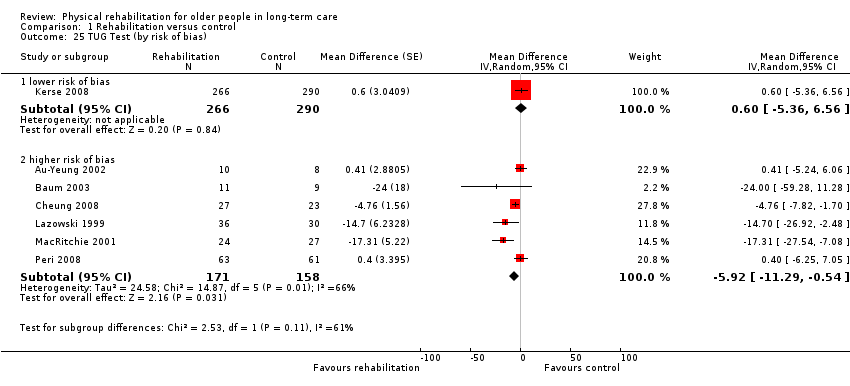 Comparison 1 Rehabilitation versus control, Outcome 25 TUG Test (by risk of bias). | ||||
| 25.1 lower risk of bias | 1 | 556 | Mean Difference (Random, 95% CI) | 0.6 [‐5.36, 6.56] |
| 25.2 higher risk of bias | 6 | 329 | Mean Difference (Random, 95% CI) | ‐5.92 [‐11.29, ‐0.54] |
| 26 TUG Test (by duration of intervention) Show forest plot | 7 | Mean Difference (Random, 95% CI) | Subtotals only | |
| Analysis 1.26  Comparison 1 Rehabilitation versus control, Outcome 26 TUG Test (by duration of intervention). | ||||
| 26.1 shorter (< 6 months intervention) | 4 | 185 | Mean Difference (Random, 95% CI) | ‐7.34 [‐13.93, ‐0.75] |
| 26.2 longer (6+ months intervention) | 3 | 700 | Mean Difference (Random, 95% CI) | 0.13 [‐4.28, 4.53] |
| 27 TUG Test (by mode of delivery) Show forest plot | 7 | Mean Difference (Random, 95% CI) | Subtotals only | |
| Analysis 1.27  Comparison 1 Rehabilitation versus control, Outcome 27 TUG Test (by mode of delivery). | ||||
| 27.1 group | 4 | 154 | Mean Difference (Random, 95% CI) | ‐4.98 [‐10.74, 0.77] |
| 27.2 individual | 3 | 731 | Mean Difference (Random, 95% CI) | ‐4.56 [‐14.02, 4.90] |
| 28 TUG Test (by baseline TUG score) Show forest plot | 7 | Mean Difference (Random, 95% CI) | Subtotals only | |
| Analysis 1.28  Comparison 1 Rehabilitation versus control, Outcome 28 TUG Test (by baseline TUG score). | ||||
| 28.1 better (baseline TUG score < median) | 4 | 185 | Mean Difference (Random, 95% CI) | ‐7.34 [‐13.93, ‐0.75] |
| 28.2 worse (baseline TUG score > median) | 3 | 700 | Mean Difference (Random, 95% CI) | 0.13 [‐4.28, 4.53] |
| 29 TUG Test (by age) Show forest plot | 7 | Mean Difference (Random, 95% CI) | Subtotals only | |
| Analysis 1.29  Comparison 1 Rehabilitation versus control, Outcome 29 TUG Test (by age). | ||||
| 29.1 younger (mean age < 85 years) | 5 | 741 | Mean Difference (Random, 95% CI) | ‐5.39 [‐10.77, ‐0.00] |
| 29.2 older (mean age 85+ years) | 2 | 144 | Mean Difference (Random, 95% CI) | ‐5.40 [‐25.75, 14.96] |
| 30 TUG Test (by gender) Show forest plot | 7 | Mean Difference (Random, 95% CI) | Subtotals only | |
| Analysis 1.30  Comparison 1 Rehabilitation versus control, Outcome 30 TUG Test (by gender). | ||||
| 30.1 < 80% female | 3 | 594 | Mean Difference (Random, 95% CI) | 0.17 [‐3.90, 4.24] |
| 30.2 80%+ female | 4 | 291 | Mean Difference (Random, 95% CI) | ‐7.55 [‐14.28, ‐0.82] |
| 31 Walking speed (by risk of bias) Show forest plot | 9 | Mean Difference (Random, 95% CI) | Subtotals only | |
| Analysis 1.31 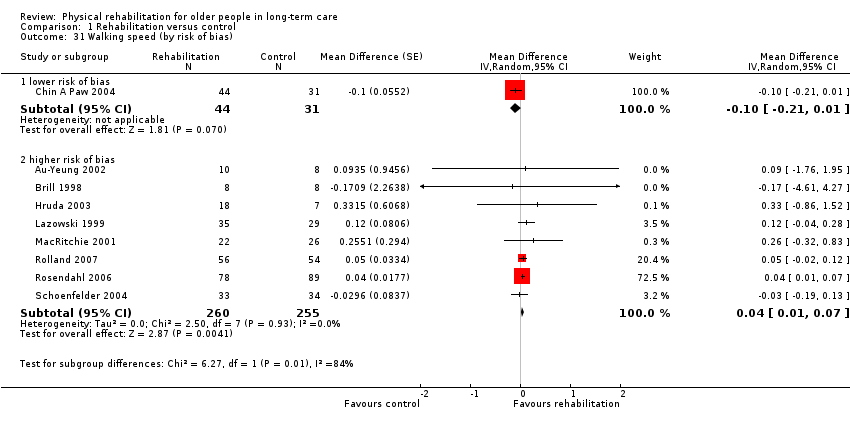 Comparison 1 Rehabilitation versus control, Outcome 31 Walking speed (by risk of bias). | ||||
| 31.1 lower risk of bias | 1 | 75 | Mean Difference (Random, 95% CI) | ‐0.10 [‐0.21, 0.01] |
| 31.2 higher risk of bias | 8 | 515 | Mean Difference (Random, 95% CI) | 0.04 [0.01, 0.07] |
| 32 Walking speed (by duration of intervention) Show forest plot | 9 | Mean Difference (Random, 95% CI) | Subtotals only | |
| Analysis 1.32 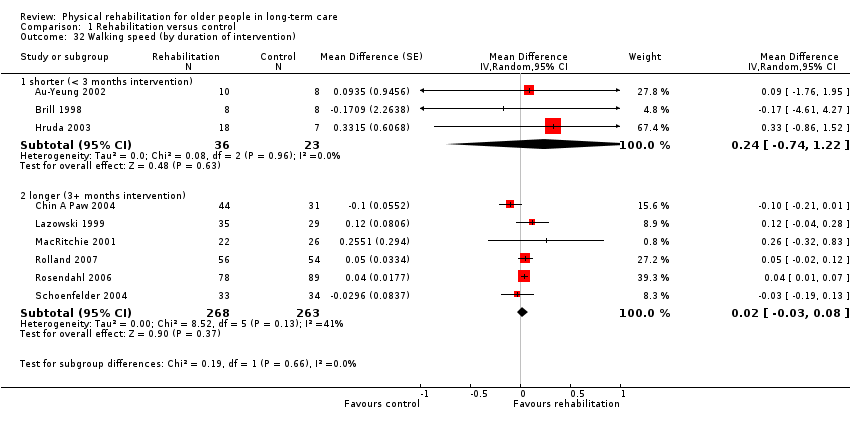 Comparison 1 Rehabilitation versus control, Outcome 32 Walking speed (by duration of intervention). | ||||
| 32.1 shorter (< 3 months intervention) | 3 | 59 | Mean Difference (Random, 95% CI) | 0.24 [‐0.74, 1.22] |
| 32.2 longer (3+ months intervention) | 6 | 531 | Mean Difference (Random, 95% CI) | 0.02 [‐0.03, 0.08] |
| 33 Walking speed (by mode of delivery) Show forest plot | 9 | Mean Difference (Random, 95% CI) | Subtotals only | |
| Analysis 1.33 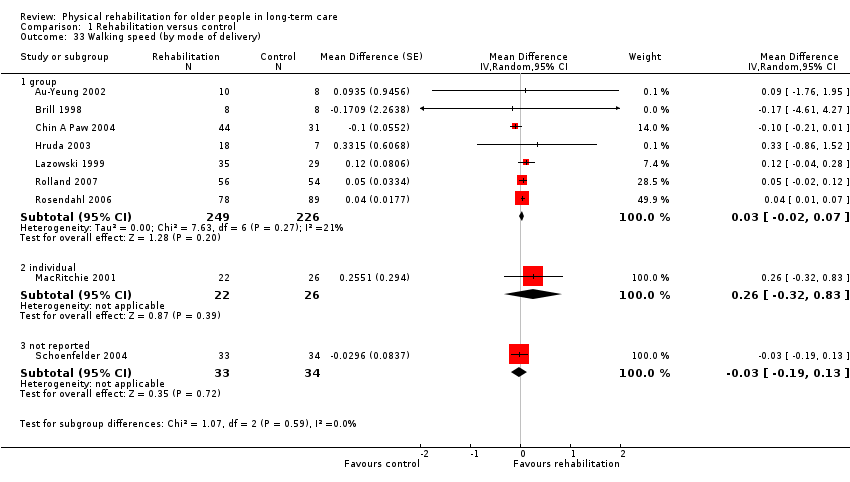 Comparison 1 Rehabilitation versus control, Outcome 33 Walking speed (by mode of delivery). | ||||
| 33.1 group | 7 | 475 | Mean Difference (Random, 95% CI) | 0.03 [‐0.02, 0.07] |
| 33.2 individual | 1 | 48 | Mean Difference (Random, 95% CI) | 0.26 [‐0.32, 0.83] |
| 33.3 not reported | 1 | 67 | Mean Difference (Random, 95% CI) | ‐0.03 [‐0.19, 0.13] |
| 34 Walking speed (by baseline walking speed) Show forest plot | 9 | Mean Difference (Random, 95% CI) | Subtotals only | |
| Analysis 1.34  Comparison 1 Rehabilitation versus control, Outcome 34 Walking speed (by baseline walking speed). | ||||
| 34.1 better (baseline walking speed > median) | 5 | 198 | Mean Difference (Random, 95% CI) | ‐0.00 [‐0.15, 0.14] |
| 34.2 worse (baseline walking speed < median) | 4 | 392 | Mean Difference (Random, 95% CI) | 0.04 [0.01, 0.07] |
| 35 Walking speed (by age) Show forest plot | 9 | Mean Difference (Random, 95% CI) | Subtotals only | |
| Analysis 1.35  Comparison 1 Rehabilitation versus control, Outcome 35 Walking speed (by age). | ||||
| 35.1 younger (mean age < 85 years) | 9 | 590 | Mean Difference (Random, 95% CI) | 0.03 [‐0.01, 0.07] |
| 35.2 older (mean age 85+ years) | 0 | 0 | Mean Difference (Random, 95% CI) | 0.0 [0.0, 0.0] |
| 36 Walking speed (by gender) Show forest plot | 9 | Mean Difference (Random, 95% CI) | Subtotals only | |
| Analysis 1.36  Comparison 1 Rehabilitation versus control, Outcome 36 Walking speed (by gender). | ||||
| 36.1 < 80% female | 5 | 437 | Mean Difference (Random, 95% CI) | 0.01 [‐0.04, 0.07] |
| 36.2 80%+ female | 4 | 153 | Mean Difference (Random, 95% CI) | 0.13 [‐0.02, 0.28] |
| 37 Walking speed (by distance walked) Show forest plot | 9 | Mean Difference (Random, 95% CI) | Subtotals only | |
| Analysis 1.37  Comparison 1 Rehabilitation versus control, Outcome 37 Walking speed (by distance walked). | ||||
| 37.1 less far (< 6 metres) | 2 | 185 | Mean Difference (Random, 95% CI) | 0.04 [0.01, 0.07] |
| 37.2 further (6+ metres) | 7 | 405 | Mean Difference (Random, 95% CI) | 0.01 [‐0.06, 0.09] |
| 38 Death (by risk of bias) Show forest plot | 25 | Risk Ratio (M‐H, Random, 95% CI) | Subtotals only | |
| Analysis 1.38  Comparison 1 Rehabilitation versus control, Outcome 38 Death (by risk of bias). | ||||
| 38.1 lower risk of bias | 6 | 1366 | Risk Ratio (M‐H, Random, 95% CI) | 1.05 [0.76, 1.46] |
| 38.2 higher risk of bias | 19 | 2355 | Risk Ratio (M‐H, Random, 95% CI) | 0.88 [0.71, 1.10] |
| 39 Death (by duration of intervention) Show forest plot | 25 | Risk Ratio (M‐H, Random, 95% CI) | Subtotals only | |
| Analysis 1.39 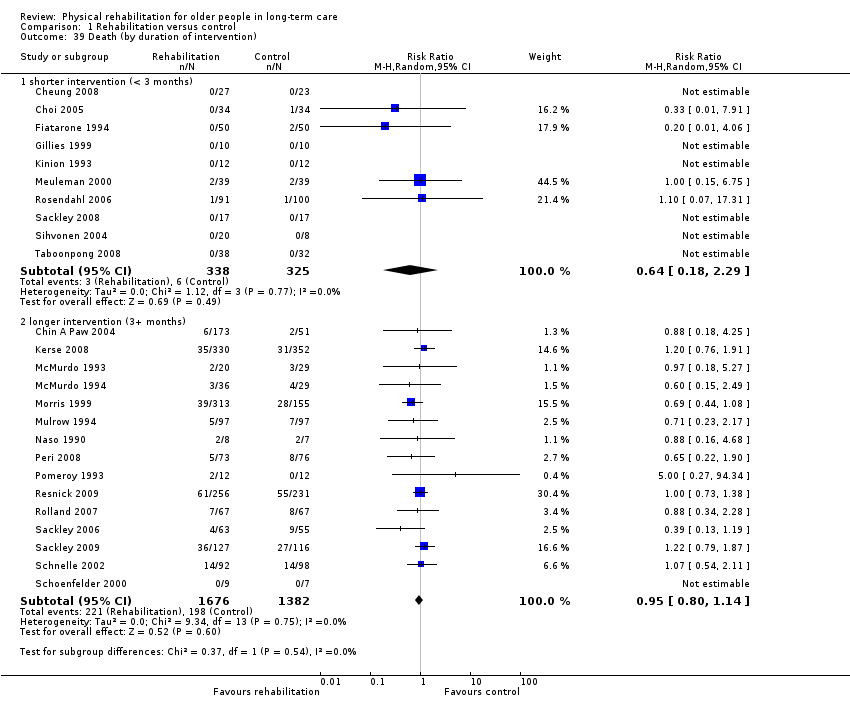 Comparison 1 Rehabilitation versus control, Outcome 39 Death (by duration of intervention). | ||||
| 39.1 shorter intervention (< 3 months) | 10 | 663 | Risk Ratio (M‐H, Random, 95% CI) | 0.64 [0.18, 2.29] |
| 39.2 longer intervention (3+ months) | 15 | 3058 | Risk Ratio (M‐H, Random, 95% CI) | 0.95 [0.80, 1.14] |
| 40 Death (by mode of delivery) Show forest plot | 25 | Risk Ratio (M‐H, Random, 95% CI) | Subtotals only | |
| Analysis 1.40 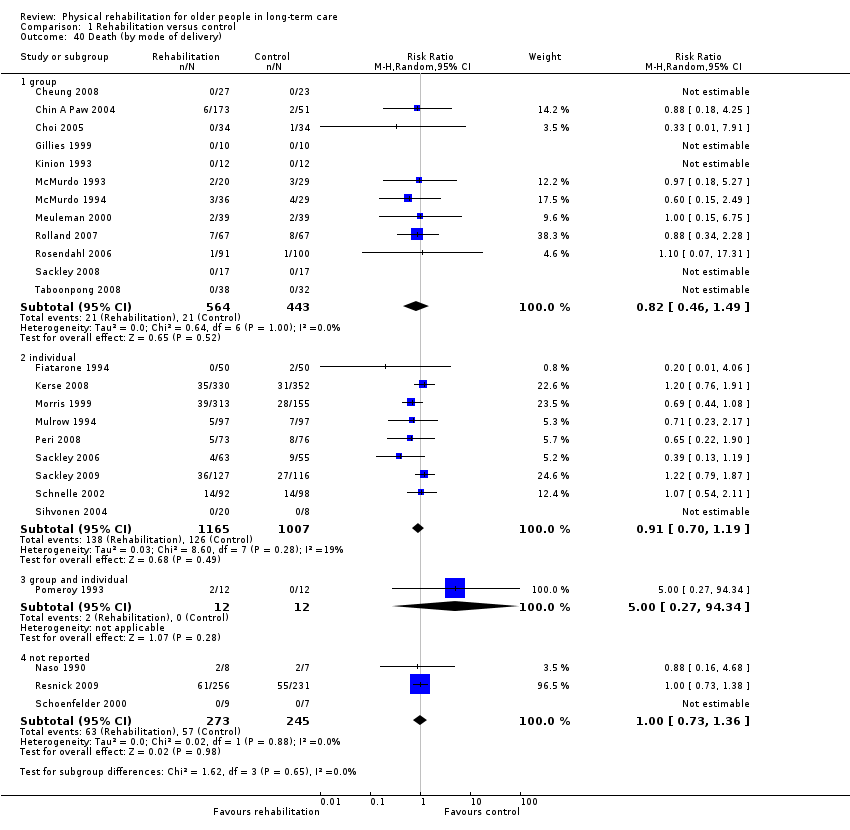 Comparison 1 Rehabilitation versus control, Outcome 40 Death (by mode of delivery). | ||||
| 40.1 group | 12 | 1007 | Risk Ratio (M‐H, Random, 95% CI) | 0.82 [0.46, 1.49] |
| 40.2 individual | 9 | 2172 | Risk Ratio (M‐H, Random, 95% CI) | 0.91 [0.70, 1.19] |
| 40.3 group and individual | 1 | 24 | Risk Ratio (M‐H, Random, 95% CI) | 5.0 [0.27, 94.34] |
| 40.4 not reported | 3 | 518 | Risk Ratio (M‐H, Random, 95% CI) | 1.00 [0.73, 1.36] |
| 41 Death (by age) Show forest plot | 25 | Risk Ratio (M‐H, Random, 95% CI) | Subtotals only | |
| Analysis 1.41  Comparison 1 Rehabilitation versus control, Outcome 41 Death (by age). | ||||
| 41.1 younger (mean age < 85 years) | 16 | 3001 | Risk Ratio (M‐H, Random, 95% CI) | 0.97 [0.81, 1.17] |
| 41.2 older (mean age 85+ years) | 9 | 720 | Risk Ratio (M‐H, Random, 95% CI) | 0.79 [0.49, 1.27] |
| 42 Death (by gender) Show forest plot | 25 | Risk Ratio (M‐H, Random, 95% CI) | Subtotals only | |
| Analysis 1.42  Comparison 1 Rehabilitation versus control, Outcome 42 Death (by gender). | ||||
| 42.1 < 80% female | 12 | 2366 | Risk Ratio (M‐H, Random, 95% CI) | 0.98 [0.77, 1.25] |
| 42.2 80%+ female | 12 | 1340 | Risk Ratio (M‐H, Random, 95% CI) | 0.91 [0.71, 1.18] |
| 42.3 not reported | 1 | 15 | Risk Ratio (M‐H, Random, 95% CI) | 0.88 [0.16, 4.68] |
| 43 Sensitivity analysis: Barthel Index (fixed‐effect) Show forest plot | 7 | 857 | Mean Difference (Fixed, 95% CI) | 4.54 [1.59, 7.49] |
| Analysis 1.43 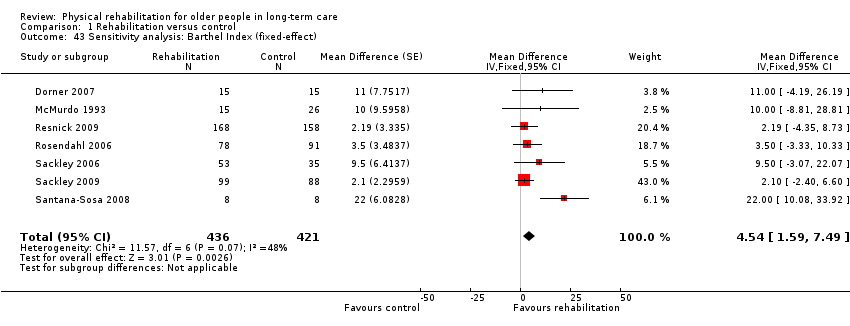 Comparison 1 Rehabilitation versus control, Outcome 43 Sensitivity analysis: Barthel Index (fixed‐effect). | ||||
| 44 Sensitivity analysis: Barthel Index (cluster trials) Show forest plot | 7 | Mean Difference (Random, 95% CI) | Subtotals only | |
| Analysis 1.44 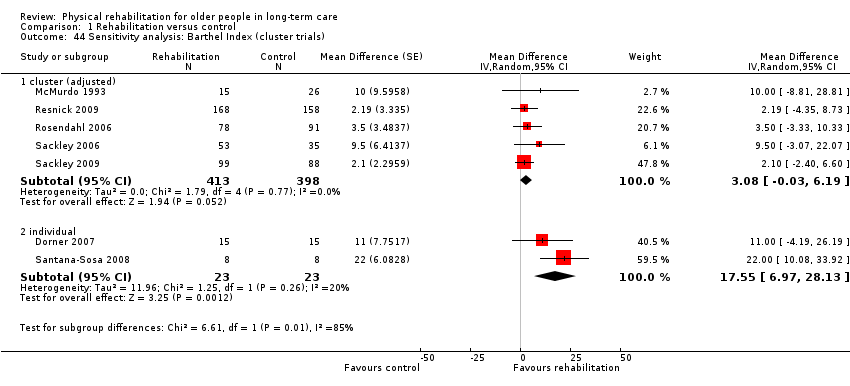 Comparison 1 Rehabilitation versus control, Outcome 44 Sensitivity analysis: Barthel Index (cluster trials). | ||||
| 44.1 cluster (adjusted) | 5 | 811 | Mean Difference (Random, 95% CI) | 3.08 [‐0.03, 6.19] |
| 44.2 individual | 2 | 46 | Mean Difference (Random, 95% CI) | 17.55 [6.97, 28.13] |
| 45 Sensitivity analysis: Functional Independence Measure (fixed‐effect) Show forest plot | 4 | 303 | Mean Difference (Fixed, 95% CI) | 1.46 [‐0.42, 3.34] |
| Analysis 1.45 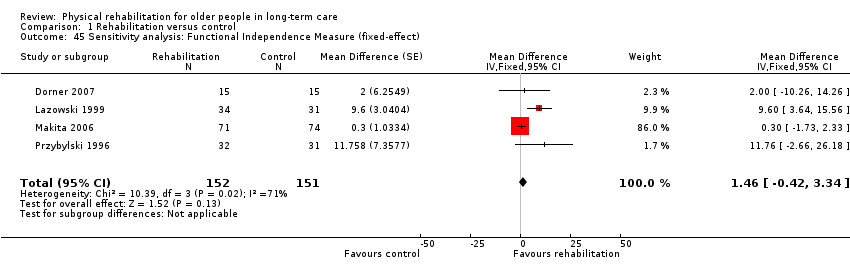 Comparison 1 Rehabilitation versus control, Outcome 45 Sensitivity analysis: Functional Independence Measure (fixed‐effect). | ||||
| 46 Sensitivity analysis: Rivermead Mobility Index (fixed‐effect) Show forest plot | 3 | 323 | Mean Difference (Fixed, 95% CI) | 0.69 [0.04, 1.33] |
| Analysis 1.46 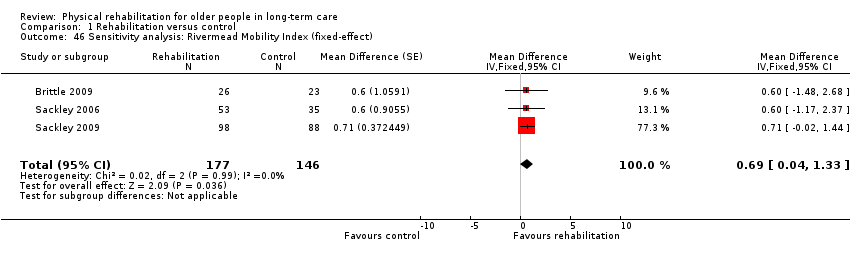 Comparison 1 Rehabilitation versus control, Outcome 46 Sensitivity analysis: Rivermead Mobility Index (fixed‐effect). | ||||
| 47 Sensitivity analysis: TUG Test (fixed‐effect) Show forest plot | 7 | 885 | Mean Difference (Fixed, 95% CI) | ‐3.66 [‐5.86, ‐1.45] |
| Analysis 1.47  Comparison 1 Rehabilitation versus control, Outcome 47 Sensitivity analysis: TUG Test (fixed‐effect). | ||||
| 48 Sensitivity anlaysis: TUG Test (cluster trials) Show forest plot | 7 | Mean Difference (Random, 95% CI) | Subtotals only | |
| Analysis 1.48  Comparison 1 Rehabilitation versus control, Outcome 48 Sensitivity anlaysis: TUG Test (cluster trials). | ||||
| 48.1 cluster (adjusted) | 2 | Mean Difference (Random, 95% CI) | 0.51 [‐3.93, 4.95] | |
| 48.2 individual | 5 | Mean Difference (Random, 95% CI) | ‐7.85 [‐14.34, ‐1.37] | |
| 49 Sensitivity analysis: TUG Test (re‐including Christofoletti 2008) Show forest plot | 8 | 914 | Mean Difference (Random, 95% CI) | ‐8.41 [‐15.53, ‐1.29] |
| Analysis 1.49 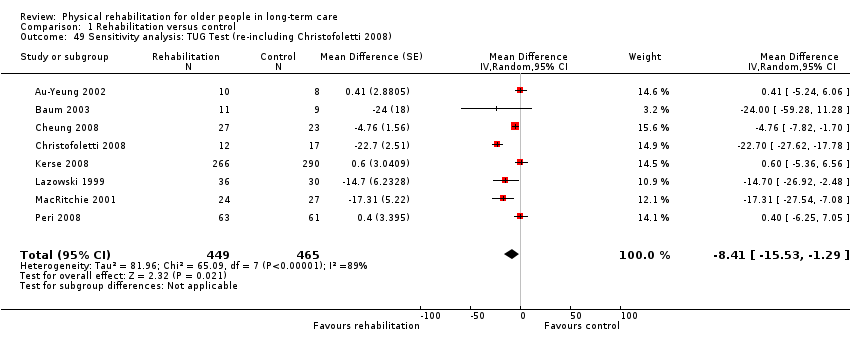 Comparison 1 Rehabilitation versus control, Outcome 49 Sensitivity analysis: TUG Test (re‐including Christofoletti 2008). | ||||
| 50 Sensitivity analysis: Walking speed (fixed‐effect) Show forest plot | 9 | 590 | Mean Difference (Fixed, 95% CI) | 0.03 [0.00, 0.06] |
| Analysis 1.50  Comparison 1 Rehabilitation versus control, Outcome 50 Sensitivity analysis: Walking speed (fixed‐effect). | ||||
| 51 Sensitivity analysis: Walking speed (cluster trials) Show forest plot | 9 | Mean Difference (Random, 95% CI) | Subtotals only | |
| Analysis 1.51 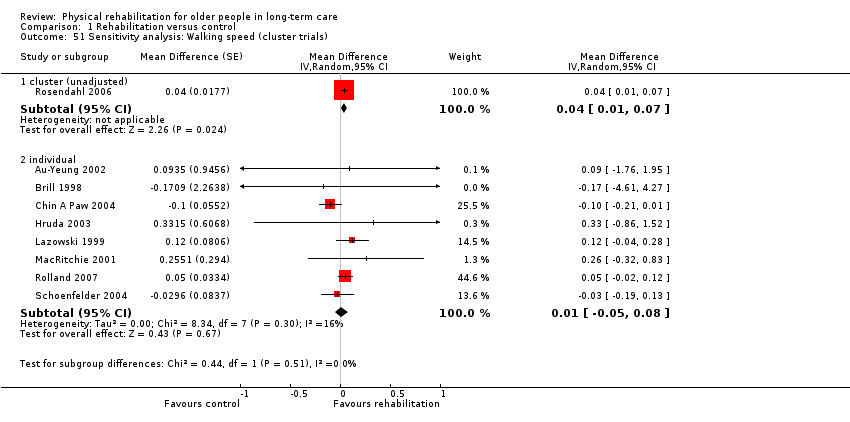 Comparison 1 Rehabilitation versus control, Outcome 51 Sensitivity analysis: Walking speed (cluster trials). | ||||
| 51.1 cluster (unadjusted) | 1 | Mean Difference (Random, 95% CI) | 0.04 [0.01, 0.07] | |
| 51.2 individual | 8 | Mean Difference (Random, 95% CI) | 0.01 [‐0.05, 0.08] | |
| 52 Sensitivity analysis: Death (random‐effects: odds ratio) Show forest plot | 25 | 3721 | Odds Ratio (M‐H, Random, 95% CI) | 0.93 [0.75, 1.15] |
| Analysis 1.52 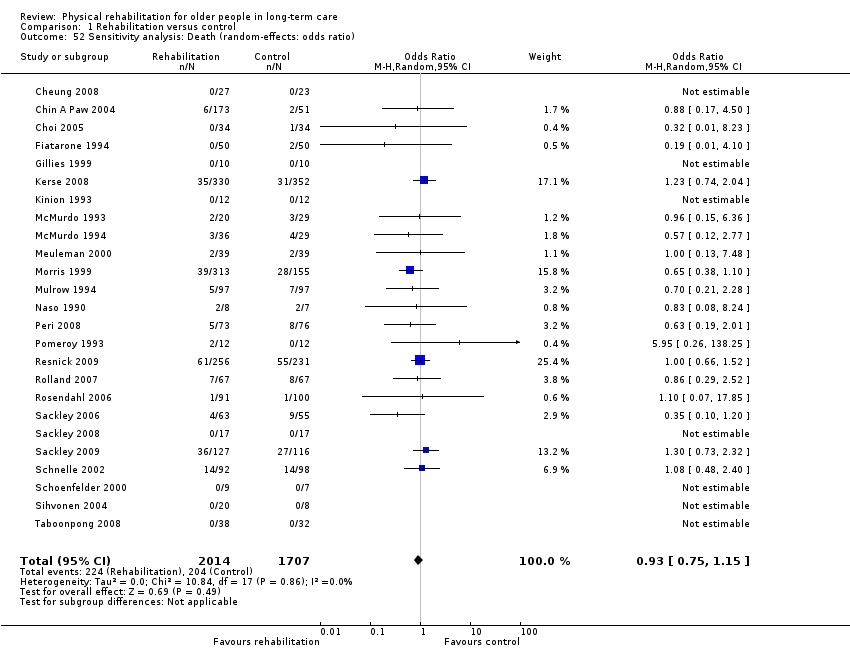 Comparison 1 Rehabilitation versus control, Outcome 52 Sensitivity analysis: Death (random‐effects: odds ratio). | ||||
| 53 Sensitivity analysis: Death (random‐effects: risk difference) Show forest plot | 25 | 3721 | Risk Difference (M‐H, Random, 95% CI) | ‐0.01 [‐0.02, 0.01] |
| Analysis 1.53  Comparison 1 Rehabilitation versus control, Outcome 53 Sensitivity analysis: Death (random‐effects: risk difference). | ||||
| 54 Sensitivity analysis: Death (fixed‐effect) Show forest plot | 25 | 3721 | Risk Ratio (M‐H, Random, 95% CI) | 0.95 [0.80, 1.13] |
| Analysis 1.54 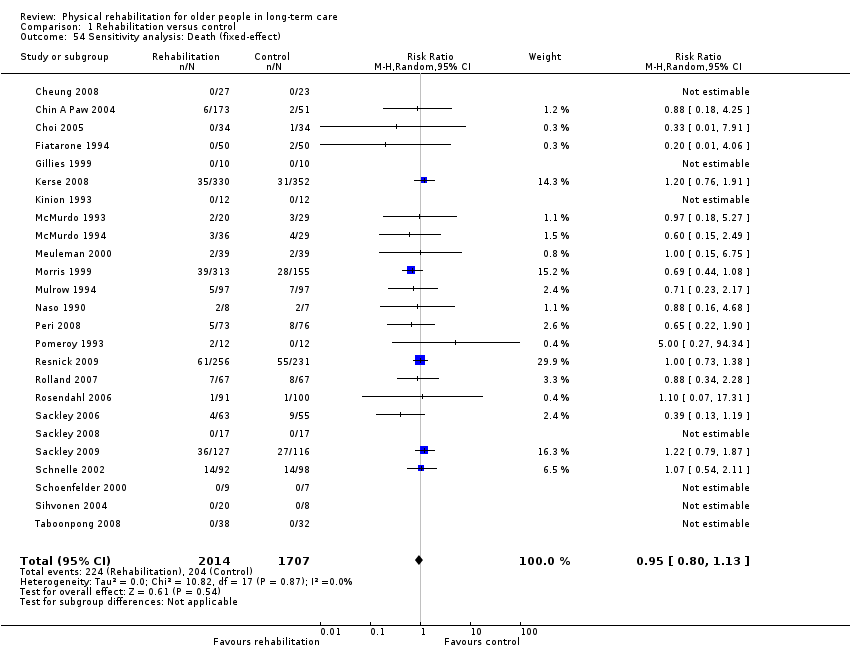 Comparison 1 Rehabilitation versus control, Outcome 54 Sensitivity analysis: Death (fixed‐effect). | ||||
| 55 Sensitivity analysis: Death (fixed‐effect: Peto odds ratio) Show forest plot | 25 | 3721 | Peto Odds Ratio (Peto, Fixed, 95% CI) | 0.93 [0.75, 1.14] |
| Analysis 1.55 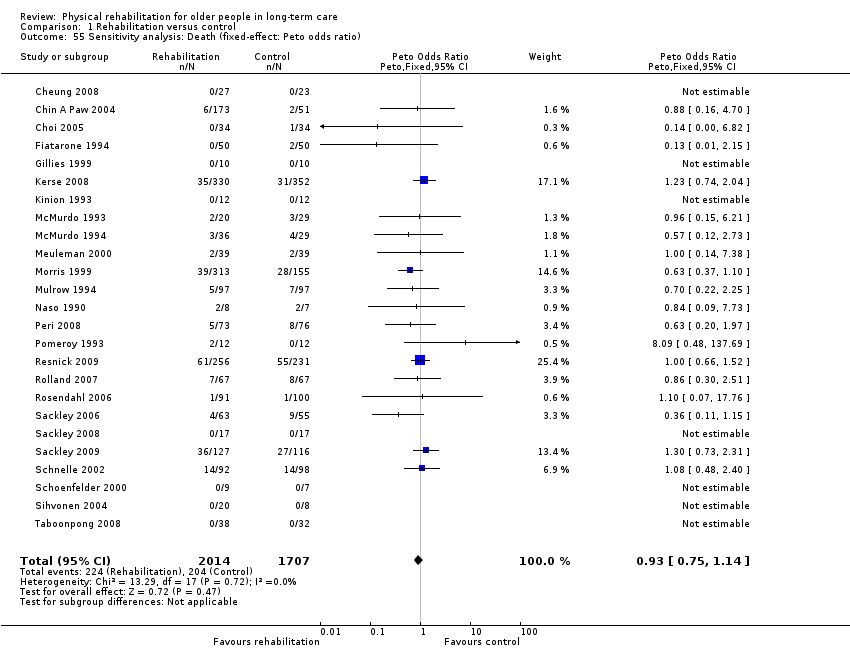 Comparison 1 Rehabilitation versus control, Outcome 55 Sensitivity analysis: Death (fixed‐effect: Peto odds ratio). | ||||
| 56 Sensitivity analysis: Death (cluster trials) Show forest plot | 25 | Risk Ratio (M‐H, Random, 95% CI) | Subtotals only | |
| Analysis 1.56  Comparison 1 Rehabilitation versus control, Outcome 56 Sensitivity analysis: Death (cluster trials). | ||||
| 56.1 cluster (unadjusted) | 13 | 2644 | Risk Ratio (M‐H, Random, 95% CI) | 0.95 [0.79, 1.15] |
| 56.2 individual | 12 | 1077 | Risk Ratio (M‐H, Random, 95% CI) | 0.93 [0.60, 1.44] |
| 57 Sensitivity analysis: Death (including Brittle 2009) Show forest plot | 26 | 3777 | Risk Ratio (M‐H, Random, 95% CI) | 0.94 [0.79, 1.11] |
| Analysis 1.57  Comparison 1 Rehabilitation versus control, Outcome 57 Sensitivity analysis: Death (including Brittle 2009). | ||||
| Outcome or subgroup title | No. of studies | No. of participants | Statistical method | Effect size |
| 1 TUG Test Show forest plot | 2 | 57 | Mean Difference (Random, 95% CI) | ‐7.95 [‐19.22, 3.31] |
| Analysis 2.1 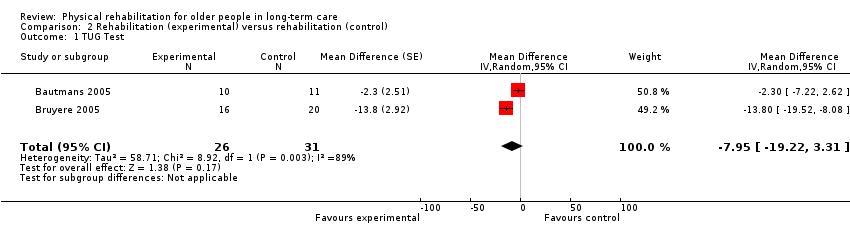 Comparison 2 Rehabilitation (experimental) versus rehabilitation (control), Outcome 1 TUG Test. | ||||
| 2 Death Show forest plot | 4 | 118 | Risk Ratio (M‐H, Random, 95% CI) | 2.67 [0.12, 60.93] |
| Analysis 2.2 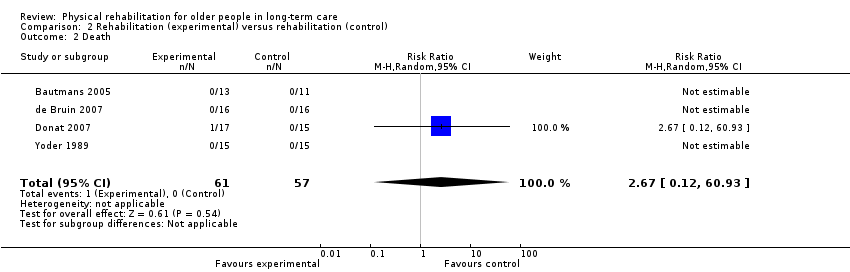 Comparison 2 Rehabilitation (experimental) versus rehabilitation (control), Outcome 2 Death. | ||||
| 3 Sensitivity analysis: TUG Test (fixed‐effect) Show forest plot | 2 | 57 | Mean Difference (Fixed, 95% CI) | ‐7.19 [‐10.92, ‐3.46] |
| Analysis 2.3  Comparison 2 Rehabilitation (experimental) versus rehabilitation (control), Outcome 3 Sensitivity analysis: TUG Test (fixed‐effect). | ||||

Review update flow diagram
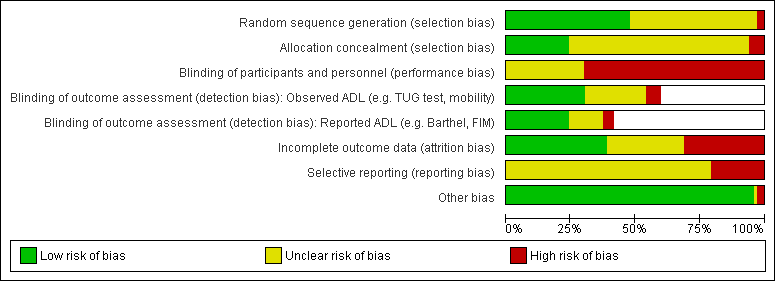
'Risk of bias' graph: review authors' judgements about each 'Risk of bias' item presented as percentages across all included studies

Funnel plot of comparison: 1 Rehabilitation versus control, outcome: 1.1 Barthel Index.
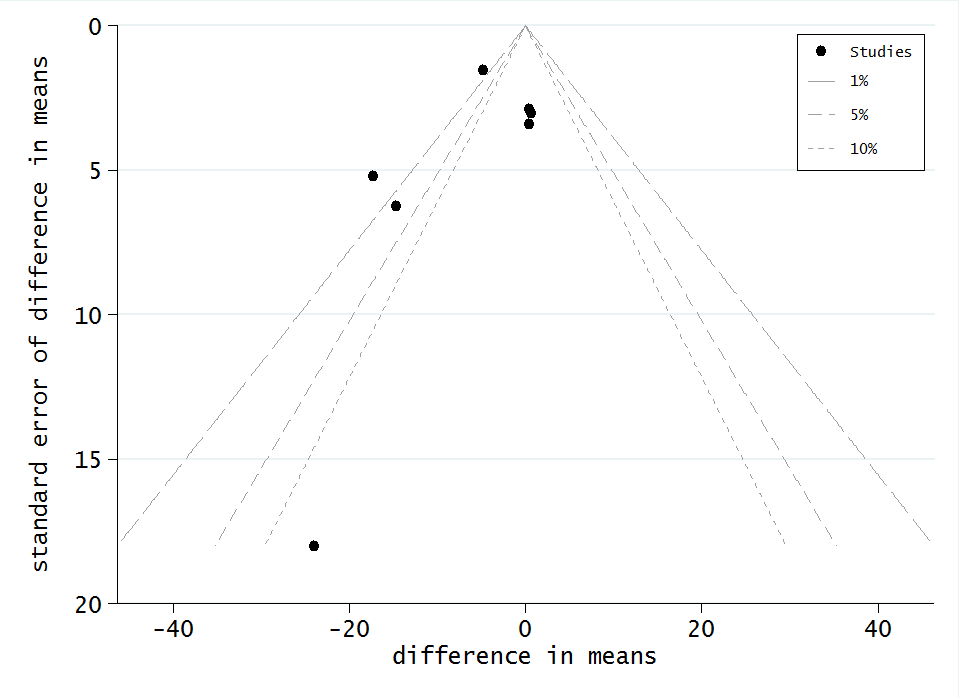
Funnel plot of comparison: 1 Rehabilitation versus control, outcome: 1.4 TUG test

Funnel plot of comparison: 1 Rehabilitation versus control, outcome: 1.5 Walking speed

Funnel plot of comparison: 1 Rehabilitation versus control, outcome: 1.6 Death
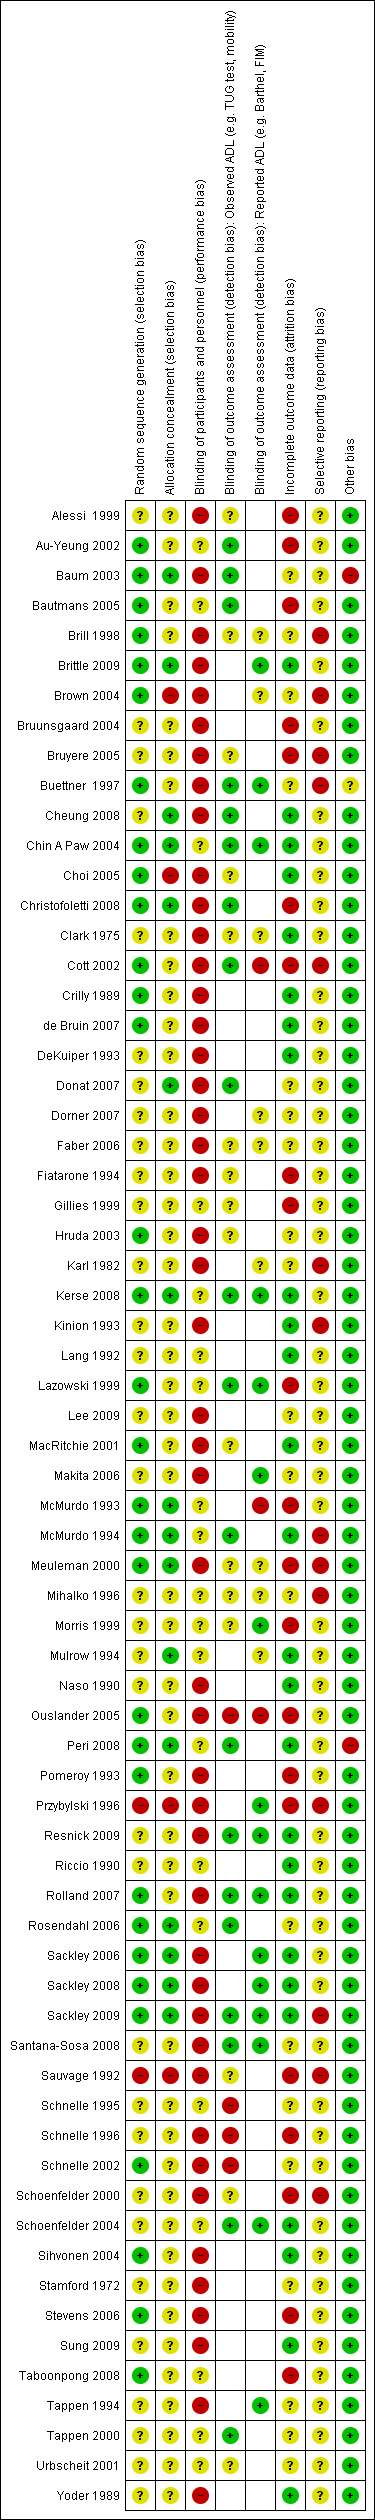
'Risk of bias' summary: review authors' judgements about each 'Risk of bias' item for each included study
Comparison 1 Rehabilitation versus control, Outcome 1 Barthel Index.
Comparison 1 Rehabilitation versus control, Outcome 2 Functional Independence Measure (FIM).
Comparison 1 Rehabilitation versus control, Outcome 3 Rivermead Mobility Index (RMI).
Comparison 1 Rehabilitation versus control, Outcome 4 Timed Up and Go (TUG) Test.
Comparison 1 Rehabilitation versus control, Outcome 5 Walking speed.
Comparison 1 Rehabilitation versus control, Outcome 6 Death.
Comparison 1 Rehabilitation versus control, Outcome 7 Barthel Index (by risk of bias).
Comparison 1 Rehabilitation versus control, Outcome 8 Barthel Index (by duration of intervention).
Comparison 1 Rehabilitation versus control, Outcome 9 Barthel Index (by mode of delivery).
Comparison 1 Rehabilitation versus control, Outcome 10 Barthel Index (by baseline Barthel Index score).
Comparison 1 Rehabilitation versus control, Outcome 11 Barthel Index (by age).
Comparison 1 Rehabilitation versus control, Outcome 12 Barthel Index (by gender).
Comparison 1 Rehabilitation versus control, Outcome 13 Functional Independence Measure (by risk of bias).
Comparison 1 Rehabilitation versus control, Outcome 14 Functional Independence Measure (by duration of intervention).
Comparison 1 Rehabilitation versus control, Outcome 15 Functional Independence Measure (by mode of delivery).
Comparison 1 Rehabilitation versus control, Outcome 16 Functional Independence Measure (by baseline FIM score).
Comparison 1 Rehabilitation versus control, Outcome 17 Functional Independence Measure (by age).
Comparison 1 Rehabilitation versus control, Outcome 18 Functional Independence Measure (by gender).
Comparison 1 Rehabilitation versus control, Outcome 19 Rivermead Mobility Index (by risk of bias).
Comparison 1 Rehabilitation versus control, Outcome 20 Rivermead Mobility Index (by duration of intervention).
Comparison 1 Rehabilitation versus control, Outcome 21 Rivermead Mobility Index (by mode of delivery).
Comparison 1 Rehabilitation versus control, Outcome 22 Rivermead Mobility Index (by baseline RMI score).
Comparison 1 Rehabilitation versus control, Outcome 23 Rivermead Mobility Index (by age).
Comparison 1 Rehabilitation versus control, Outcome 24 Rivermead Mobility Index (by gender).
Comparison 1 Rehabilitation versus control, Outcome 25 TUG Test (by risk of bias).
Comparison 1 Rehabilitation versus control, Outcome 26 TUG Test (by duration of intervention).
Comparison 1 Rehabilitation versus control, Outcome 27 TUG Test (by mode of delivery).
Comparison 1 Rehabilitation versus control, Outcome 28 TUG Test (by baseline TUG score).
Comparison 1 Rehabilitation versus control, Outcome 29 TUG Test (by age).
Comparison 1 Rehabilitation versus control, Outcome 30 TUG Test (by gender).
Comparison 1 Rehabilitation versus control, Outcome 31 Walking speed (by risk of bias).
Comparison 1 Rehabilitation versus control, Outcome 32 Walking speed (by duration of intervention).
Comparison 1 Rehabilitation versus control, Outcome 33 Walking speed (by mode of delivery).
Comparison 1 Rehabilitation versus control, Outcome 34 Walking speed (by baseline walking speed).
Comparison 1 Rehabilitation versus control, Outcome 35 Walking speed (by age).
Comparison 1 Rehabilitation versus control, Outcome 36 Walking speed (by gender).
Comparison 1 Rehabilitation versus control, Outcome 37 Walking speed (by distance walked).
Comparison 1 Rehabilitation versus control, Outcome 38 Death (by risk of bias).
Comparison 1 Rehabilitation versus control, Outcome 39 Death (by duration of intervention).
Comparison 1 Rehabilitation versus control, Outcome 40 Death (by mode of delivery).
Comparison 1 Rehabilitation versus control, Outcome 41 Death (by age).
Comparison 1 Rehabilitation versus control, Outcome 42 Death (by gender).
Comparison 1 Rehabilitation versus control, Outcome 43 Sensitivity analysis: Barthel Index (fixed‐effect).
Comparison 1 Rehabilitation versus control, Outcome 44 Sensitivity analysis: Barthel Index (cluster trials).
Comparison 1 Rehabilitation versus control, Outcome 45 Sensitivity analysis: Functional Independence Measure (fixed‐effect).
Comparison 1 Rehabilitation versus control, Outcome 46 Sensitivity analysis: Rivermead Mobility Index (fixed‐effect).
Comparison 1 Rehabilitation versus control, Outcome 47 Sensitivity analysis: TUG Test (fixed‐effect).
Comparison 1 Rehabilitation versus control, Outcome 48 Sensitivity anlaysis: TUG Test (cluster trials).
Comparison 1 Rehabilitation versus control, Outcome 49 Sensitivity analysis: TUG Test (re‐including Christofoletti 2008).
Comparison 1 Rehabilitation versus control, Outcome 50 Sensitivity analysis: Walking speed (fixed‐effect).
Comparison 1 Rehabilitation versus control, Outcome 51 Sensitivity analysis: Walking speed (cluster trials).
Comparison 1 Rehabilitation versus control, Outcome 52 Sensitivity analysis: Death (random‐effects: odds ratio).
Comparison 1 Rehabilitation versus control, Outcome 53 Sensitivity analysis: Death (random‐effects: risk difference).
Comparison 1 Rehabilitation versus control, Outcome 54 Sensitivity analysis: Death (fixed‐effect).
Comparison 1 Rehabilitation versus control, Outcome 55 Sensitivity analysis: Death (fixed‐effect: Peto odds ratio).
Comparison 1 Rehabilitation versus control, Outcome 56 Sensitivity analysis: Death (cluster trials).
Comparison 1 Rehabilitation versus control, Outcome 57 Sensitivity analysis: Death (including Brittle 2009).
Comparison 2 Rehabilitation (experimental) versus rehabilitation (control), Outcome 1 TUG Test.
Comparison 2 Rehabilitation (experimental) versus rehabilitation (control), Outcome 2 Death.
Comparison 2 Rehabilitation (experimental) versus rehabilitation (control), Outcome 3 Sensitivity analysis: TUG Test (fixed‐effect).
| Outcome or subgroup title | No. of studies | No. of participants | Statistical method | Effect size |
| 1 Barthel Index Show forest plot | 7 | 857 | Mean Difference (Random, 95% CI) | 6.38 [1.63, 11.12] |
| 2 Functional Independence Measure (FIM) Show forest plot | 4 | 303 | Mean Difference (Random, 95% CI) | 4.98 [‐1.55, 11.51] |
| 3 Rivermead Mobility Index (RMI) Show forest plot | 3 | 323 | Mean Difference (Random, 95% CI) | 0.69 [0.04, 1.33] |
| 4 Timed Up and Go (TUG) Test Show forest plot | 7 | 885 | Mean Difference (Random, 95% CI) | ‐4.59 [‐9.19, 0.01] |
| 5 Walking speed Show forest plot | 9 | 590 | Mean Difference (Random, 95% CI) | 0.03 [‐0.01, 0.07] |
| 6 Death Show forest plot | 25 | 3721 | Risk Ratio (M‐H, Random, 95% CI) | 0.95 [0.80, 1.13] |
| 7 Barthel Index (by risk of bias) Show forest plot | 7 | Mean Difference (Random, 95% CI) | Subtotals only | |
| 7.1 lower risk of bias | 2 | 275 | Mean Difference (Random, 95% CI) | 3.38 [‐2.10, 8.86] |
| 7.2 higher risk of bias | 5 | 582 | Mean Difference (Random, 95% CI) | 8.25 [1.15, 15.34] |
| 8 Barthel Index (by duration of intervention) Show forest plot | 7 | Mean Difference (Random, 95% CI) | Subtotals only | |
| 8.1 shorter (< 3 months intervention) | 2 | 46 | Mean Difference (Random, 95% CI) | 17.55 [6.97, 28.13] |
| 8.2 longer (3+ months intervention) | 5 | 811 | Mean Difference (Random, 95% CI) | 3.08 [‐0.03, 6.19] |
| 9 Barthel Index (by mode of delivery) Show forest plot | 7 | Mean Difference (Random, 95% CI) | Subtotals only | |
| 9.1 group | 4 | 256 | Mean Difference (Random, 95% CI) | 10.99 [1.51, 20.48] |
| 9.2 individual | 2 | 275 | Mean Difference (Random, 95% CI) | 3.38 [‐2.10, 8.86] |
| 9.3 not reported | 1 | 326 | Mean Difference (Random, 95% CI) | 2.19 [‐4.35, 8.73] |
| 10 Barthel Index (by baseline Barthel Index score) Show forest plot | 6 | Mean Difference (Random, 95% CI) | Subtotals only | |
| 10.1 better (baseline Barthel Index score > median) | 3 | 511 | Mean Difference (Random, 95% CI) | 7.94 [‐1.77, 17.64] |
| 10.2 worse (baseline Barthel Index score < median) | 3 | 305 | Mean Difference (Random, 95% CI) | 3.97 [‐0.83, 8.78] |
| 11 Barthel Index (by age) Show forest plot | 7 | Mean Difference (Random, 95% CI) | Subtotals only | |
| 11.1 younger (mean age < 85 years) | 4 | 552 | Mean Difference (Random, 95% CI) | 8.02 [‐0.25, 16.30] |
| 11.2 older (mean age 85+ years) | 3 | 305 | Mean Difference (Random, 95% CI) | 3.97 [‐0.83, 8.78] |
| 12 Barthel Index (by gender) Show forest plot | 7 | Mean Difference (Random, 95% CI) | Subtotals only | |
| 12.1 < 80% female | 4 | 402 | Mean Difference (Random, 95% CI) | 7.93 [0.18, 15.69] |
| 12.2 80%+ female | 3 | 455 | Mean Difference (Random, 95% CI) | 4.29 [‐1.25, 9.83] |
| 13 Functional Independence Measure (by risk of bias) Show forest plot | 4 | Mean Difference (Random, 95% CI) | Subtotals only | |
| 13.1 lower risk of bias | 0 | 0 | Mean Difference (Random, 95% CI) | 0.0 [0.0, 0.0] |
| 13.2 higher risk of bias | 4 | 303 | Mean Difference (Random, 95% CI) | 4.98 [‐1.55, 11.51] |
| 14 Functional Independence Measure (by duration of intervention) Show forest plot | 4 | Mean Difference (Random, 95% CI) | Subtotals only | |
| 14.1 shorter (< 3 months intervention) | 1 | 30 | Mean Difference (Random, 95% CI) | 2.0 [‐10.26, 14.26] |
| 14.2 longer (3+ months intervention) | 3 | 273 | Mean Difference (Random, 95% CI) | 5.85 [‐2.22, 13.93] |
| 15 Functional Independence Measure (by mode of delivery) Show forest plot | 4 | Mean Difference (Random, 95% CI) | Subtotals only | |
| 15.1 group | 3 | 240 | Mean Difference (Random, 95% CI) | 3.90 [‐3.08, 10.88] |
| 15.2 individual | 1 | 63 | Mean Difference (Random, 95% CI) | 11.76 [‐2.66, 26.18] |
| 16 Functional Independence Measure (by baseline FIM score) Show forest plot | 3 | Mean Difference (Random, 95% CI) | Subtotals only | |
| 16.1 better (baseline FIM score > median) | 2 | 95 | Mean Difference (Random, 95% CI) | 7.77 [1.39, 14.14] |
| 16.2 worse (baseline FIM score < median) | 1 | 145 | Mean Difference (Random, 95% CI) | 0.3 [‐1.73, 2.33] |
| 17 Functional Independence Measure (by age) Show forest plot | 4 | Mean Difference (Random, 95% CI) | Subtotals only | |
| 17.1 younger (mean age < 85 years) | 2 | 128 | Mean Difference (Random, 95% CI) | 9.91 [4.41, 15.42] |
| 17.2 older (mean age 85+ years) | 2 | 175 | Mean Difference (Random, 95% CI) | 0.35 [‐1.65, 2.34] |
| 18 Functional Independence Measure (by gender) Show forest plot | 4 | Mean Difference (Random, 95% CI) | Subtotals only | |
| 18.1 < 80% female | 2 | 93 | Mean Difference (Random, 95% CI) | 6.11 [‐3.33, 15.55] |
| 18.2 80%+ female | 2 | 210 | Mean Difference (Random, 95% CI) | 4.51 [‐4.56, 13.58] |
| 19 Rivermead Mobility Index (by risk of bias) Show forest plot | 3 | Mean Difference (Random, 95% CI) | Subtotals only | |
| 19.1 lower risk of bias | 3 | 323 | Mean Difference (Random, 95% CI) | 0.69 [0.04, 1.33] |
| 19.2 higher risk of bias | 0 | 0 | Mean Difference (Random, 95% CI) | 0.0 [0.0, 0.0] |
| 20 Rivermead Mobility Index (by duration of intervention) Show forest plot | 3 | Mean Difference (Random, 95% CI) | Subtotals only | |
| 20.1 shorter (< 3 months intervention) | 1 | 49 | Mean Difference (Random, 95% CI) | 0.6 [‐1.48, 2.68] |
| 20.2 longer (3+ months intervention) | 2 | 274 | Mean Difference (Random, 95% CI) | 0.69 [0.02, 1.37] |
| 21 Rivermead Mobility Index (by mode of delivery) Show forest plot | 3 | Mean Difference (Random, 95% CI) | Subtotals only | |
| 21.1 group | 1 | 49 | Mean Difference (Random, 95% CI) | 0.6 [‐1.48, 2.68] |
| 21.2 individual | 2 | 274 | Mean Difference (Random, 95% CI) | 0.69 [0.02, 1.37] |
| 22 Rivermead Mobility Index (by baseline RMI score) Show forest plot | 3 | Mean Difference (Random, 95% CI) | Subtotals only | |
| 22.1 better (baseline RMI score > median) | 2 | 235 | Mean Difference (Random, 95% CI) | 0.70 [0.01, 1.39] |
| 22.2 worse (baseline RMI score < median) | 1 | 88 | Mean Difference (Random, 95% CI) | 0.6 [‐1.17, 2.37] |
| 23 Rivermead Mobility Index (by age) Show forest plot | 3 | Mean Difference (Random, 95% CI) | Subtotals only | |
| 23.1 younger (mean age < 85 years) | 1 | 49 | Mean Difference (Random, 95% CI) | 0.6 [‐1.48, 2.68] |
| 23.2 older (mean age 85+ years) | 2 | 274 | Mean Difference (Random, 95% CI) | 0.69 [0.02, 1.37] |
| 24 Rivermead Mobility Index (by gender) Show forest plot | 3 | Mean Difference (Random, 95% CI) | Subtotals only | |
| 24.1 < 80% female | 2 | 235 | Mean Difference (Random, 95% CI) | 0.70 [0.01, 1.39] |
| 24.2 80%+ female | 1 | 88 | Mean Difference (Random, 95% CI) | 0.6 [‐1.17, 2.37] |
| 25 TUG Test (by risk of bias) Show forest plot | 7 | Mean Difference (Random, 95% CI) | Subtotals only | |
| 25.1 lower risk of bias | 1 | 556 | Mean Difference (Random, 95% CI) | 0.6 [‐5.36, 6.56] |
| 25.2 higher risk of bias | 6 | 329 | Mean Difference (Random, 95% CI) | ‐5.92 [‐11.29, ‐0.54] |
| 26 TUG Test (by duration of intervention) Show forest plot | 7 | Mean Difference (Random, 95% CI) | Subtotals only | |
| 26.1 shorter (< 6 months intervention) | 4 | 185 | Mean Difference (Random, 95% CI) | ‐7.34 [‐13.93, ‐0.75] |
| 26.2 longer (6+ months intervention) | 3 | 700 | Mean Difference (Random, 95% CI) | 0.13 [‐4.28, 4.53] |
| 27 TUG Test (by mode of delivery) Show forest plot | 7 | Mean Difference (Random, 95% CI) | Subtotals only | |
| 27.1 group | 4 | 154 | Mean Difference (Random, 95% CI) | ‐4.98 [‐10.74, 0.77] |
| 27.2 individual | 3 | 731 | Mean Difference (Random, 95% CI) | ‐4.56 [‐14.02, 4.90] |
| 28 TUG Test (by baseline TUG score) Show forest plot | 7 | Mean Difference (Random, 95% CI) | Subtotals only | |
| 28.1 better (baseline TUG score < median) | 4 | 185 | Mean Difference (Random, 95% CI) | ‐7.34 [‐13.93, ‐0.75] |
| 28.2 worse (baseline TUG score > median) | 3 | 700 | Mean Difference (Random, 95% CI) | 0.13 [‐4.28, 4.53] |
| 29 TUG Test (by age) Show forest plot | 7 | Mean Difference (Random, 95% CI) | Subtotals only | |
| 29.1 younger (mean age < 85 years) | 5 | 741 | Mean Difference (Random, 95% CI) | ‐5.39 [‐10.77, ‐0.00] |
| 29.2 older (mean age 85+ years) | 2 | 144 | Mean Difference (Random, 95% CI) | ‐5.40 [‐25.75, 14.96] |
| 30 TUG Test (by gender) Show forest plot | 7 | Mean Difference (Random, 95% CI) | Subtotals only | |
| 30.1 < 80% female | 3 | 594 | Mean Difference (Random, 95% CI) | 0.17 [‐3.90, 4.24] |
| 30.2 80%+ female | 4 | 291 | Mean Difference (Random, 95% CI) | ‐7.55 [‐14.28, ‐0.82] |
| 31 Walking speed (by risk of bias) Show forest plot | 9 | Mean Difference (Random, 95% CI) | Subtotals only | |
| 31.1 lower risk of bias | 1 | 75 | Mean Difference (Random, 95% CI) | ‐0.10 [‐0.21, 0.01] |
| 31.2 higher risk of bias | 8 | 515 | Mean Difference (Random, 95% CI) | 0.04 [0.01, 0.07] |
| 32 Walking speed (by duration of intervention) Show forest plot | 9 | Mean Difference (Random, 95% CI) | Subtotals only | |
| 32.1 shorter (< 3 months intervention) | 3 | 59 | Mean Difference (Random, 95% CI) | 0.24 [‐0.74, 1.22] |
| 32.2 longer (3+ months intervention) | 6 | 531 | Mean Difference (Random, 95% CI) | 0.02 [‐0.03, 0.08] |
| 33 Walking speed (by mode of delivery) Show forest plot | 9 | Mean Difference (Random, 95% CI) | Subtotals only | |
| 33.1 group | 7 | 475 | Mean Difference (Random, 95% CI) | 0.03 [‐0.02, 0.07] |
| 33.2 individual | 1 | 48 | Mean Difference (Random, 95% CI) | 0.26 [‐0.32, 0.83] |
| 33.3 not reported | 1 | 67 | Mean Difference (Random, 95% CI) | ‐0.03 [‐0.19, 0.13] |
| 34 Walking speed (by baseline walking speed) Show forest plot | 9 | Mean Difference (Random, 95% CI) | Subtotals only | |
| 34.1 better (baseline walking speed > median) | 5 | 198 | Mean Difference (Random, 95% CI) | ‐0.00 [‐0.15, 0.14] |
| 34.2 worse (baseline walking speed < median) | 4 | 392 | Mean Difference (Random, 95% CI) | 0.04 [0.01, 0.07] |
| 35 Walking speed (by age) Show forest plot | 9 | Mean Difference (Random, 95% CI) | Subtotals only | |
| 35.1 younger (mean age < 85 years) | 9 | 590 | Mean Difference (Random, 95% CI) | 0.03 [‐0.01, 0.07] |
| 35.2 older (mean age 85+ years) | 0 | 0 | Mean Difference (Random, 95% CI) | 0.0 [0.0, 0.0] |
| 36 Walking speed (by gender) Show forest plot | 9 | Mean Difference (Random, 95% CI) | Subtotals only | |
| 36.1 < 80% female | 5 | 437 | Mean Difference (Random, 95% CI) | 0.01 [‐0.04, 0.07] |
| 36.2 80%+ female | 4 | 153 | Mean Difference (Random, 95% CI) | 0.13 [‐0.02, 0.28] |
| 37 Walking speed (by distance walked) Show forest plot | 9 | Mean Difference (Random, 95% CI) | Subtotals only | |
| 37.1 less far (< 6 metres) | 2 | 185 | Mean Difference (Random, 95% CI) | 0.04 [0.01, 0.07] |
| 37.2 further (6+ metres) | 7 | 405 | Mean Difference (Random, 95% CI) | 0.01 [‐0.06, 0.09] |
| 38 Death (by risk of bias) Show forest plot | 25 | Risk Ratio (M‐H, Random, 95% CI) | Subtotals only | |
| 38.1 lower risk of bias | 6 | 1366 | Risk Ratio (M‐H, Random, 95% CI) | 1.05 [0.76, 1.46] |
| 38.2 higher risk of bias | 19 | 2355 | Risk Ratio (M‐H, Random, 95% CI) | 0.88 [0.71, 1.10] |
| 39 Death (by duration of intervention) Show forest plot | 25 | Risk Ratio (M‐H, Random, 95% CI) | Subtotals only | |
| 39.1 shorter intervention (< 3 months) | 10 | 663 | Risk Ratio (M‐H, Random, 95% CI) | 0.64 [0.18, 2.29] |
| 39.2 longer intervention (3+ months) | 15 | 3058 | Risk Ratio (M‐H, Random, 95% CI) | 0.95 [0.80, 1.14] |
| 40 Death (by mode of delivery) Show forest plot | 25 | Risk Ratio (M‐H, Random, 95% CI) | Subtotals only | |
| 40.1 group | 12 | 1007 | Risk Ratio (M‐H, Random, 95% CI) | 0.82 [0.46, 1.49] |
| 40.2 individual | 9 | 2172 | Risk Ratio (M‐H, Random, 95% CI) | 0.91 [0.70, 1.19] |
| 40.3 group and individual | 1 | 24 | Risk Ratio (M‐H, Random, 95% CI) | 5.0 [0.27, 94.34] |
| 40.4 not reported | 3 | 518 | Risk Ratio (M‐H, Random, 95% CI) | 1.00 [0.73, 1.36] |
| 41 Death (by age) Show forest plot | 25 | Risk Ratio (M‐H, Random, 95% CI) | Subtotals only | |
| 41.1 younger (mean age < 85 years) | 16 | 3001 | Risk Ratio (M‐H, Random, 95% CI) | 0.97 [0.81, 1.17] |
| 41.2 older (mean age 85+ years) | 9 | 720 | Risk Ratio (M‐H, Random, 95% CI) | 0.79 [0.49, 1.27] |
| 42 Death (by gender) Show forest plot | 25 | Risk Ratio (M‐H, Random, 95% CI) | Subtotals only | |
| 42.1 < 80% female | 12 | 2366 | Risk Ratio (M‐H, Random, 95% CI) | 0.98 [0.77, 1.25] |
| 42.2 80%+ female | 12 | 1340 | Risk Ratio (M‐H, Random, 95% CI) | 0.91 [0.71, 1.18] |
| 42.3 not reported | 1 | 15 | Risk Ratio (M‐H, Random, 95% CI) | 0.88 [0.16, 4.68] |
| 43 Sensitivity analysis: Barthel Index (fixed‐effect) Show forest plot | 7 | 857 | Mean Difference (Fixed, 95% CI) | 4.54 [1.59, 7.49] |
| 44 Sensitivity analysis: Barthel Index (cluster trials) Show forest plot | 7 | Mean Difference (Random, 95% CI) | Subtotals only | |
| 44.1 cluster (adjusted) | 5 | 811 | Mean Difference (Random, 95% CI) | 3.08 [‐0.03, 6.19] |
| 44.2 individual | 2 | 46 | Mean Difference (Random, 95% CI) | 17.55 [6.97, 28.13] |
| 45 Sensitivity analysis: Functional Independence Measure (fixed‐effect) Show forest plot | 4 | 303 | Mean Difference (Fixed, 95% CI) | 1.46 [‐0.42, 3.34] |
| 46 Sensitivity analysis: Rivermead Mobility Index (fixed‐effect) Show forest plot | 3 | 323 | Mean Difference (Fixed, 95% CI) | 0.69 [0.04, 1.33] |
| 47 Sensitivity analysis: TUG Test (fixed‐effect) Show forest plot | 7 | 885 | Mean Difference (Fixed, 95% CI) | ‐3.66 [‐5.86, ‐1.45] |
| 48 Sensitivity anlaysis: TUG Test (cluster trials) Show forest plot | 7 | Mean Difference (Random, 95% CI) | Subtotals only | |
| 48.1 cluster (adjusted) | 2 | Mean Difference (Random, 95% CI) | 0.51 [‐3.93, 4.95] | |
| 48.2 individual | 5 | Mean Difference (Random, 95% CI) | ‐7.85 [‐14.34, ‐1.37] | |
| 49 Sensitivity analysis: TUG Test (re‐including Christofoletti 2008) Show forest plot | 8 | 914 | Mean Difference (Random, 95% CI) | ‐8.41 [‐15.53, ‐1.29] |
| 50 Sensitivity analysis: Walking speed (fixed‐effect) Show forest plot | 9 | 590 | Mean Difference (Fixed, 95% CI) | 0.03 [0.00, 0.06] |
| 51 Sensitivity analysis: Walking speed (cluster trials) Show forest plot | 9 | Mean Difference (Random, 95% CI) | Subtotals only | |
| 51.1 cluster (unadjusted) | 1 | Mean Difference (Random, 95% CI) | 0.04 [0.01, 0.07] | |
| 51.2 individual | 8 | Mean Difference (Random, 95% CI) | 0.01 [‐0.05, 0.08] | |
| 52 Sensitivity analysis: Death (random‐effects: odds ratio) Show forest plot | 25 | 3721 | Odds Ratio (M‐H, Random, 95% CI) | 0.93 [0.75, 1.15] |
| 53 Sensitivity analysis: Death (random‐effects: risk difference) Show forest plot | 25 | 3721 | Risk Difference (M‐H, Random, 95% CI) | ‐0.01 [‐0.02, 0.01] |
| 54 Sensitivity analysis: Death (fixed‐effect) Show forest plot | 25 | 3721 | Risk Ratio (M‐H, Random, 95% CI) | 0.95 [0.80, 1.13] |
| 55 Sensitivity analysis: Death (fixed‐effect: Peto odds ratio) Show forest plot | 25 | 3721 | Peto Odds Ratio (Peto, Fixed, 95% CI) | 0.93 [0.75, 1.14] |
| 56 Sensitivity analysis: Death (cluster trials) Show forest plot | 25 | Risk Ratio (M‐H, Random, 95% CI) | Subtotals only | |
| 56.1 cluster (unadjusted) | 13 | 2644 | Risk Ratio (M‐H, Random, 95% CI) | 0.95 [0.79, 1.15] |
| 56.2 individual | 12 | 1077 | Risk Ratio (M‐H, Random, 95% CI) | 0.93 [0.60, 1.44] |
| 57 Sensitivity analysis: Death (including Brittle 2009) Show forest plot | 26 | 3777 | Risk Ratio (M‐H, Random, 95% CI) | 0.94 [0.79, 1.11] |
| Outcome or subgroup title | No. of studies | No. of participants | Statistical method | Effect size |
| 1 TUG Test Show forest plot | 2 | 57 | Mean Difference (Random, 95% CI) | ‐7.95 [‐19.22, 3.31] |
| 2 Death Show forest plot | 4 | 118 | Risk Ratio (M‐H, Random, 95% CI) | 2.67 [0.12, 60.93] |
| 3 Sensitivity analysis: TUG Test (fixed‐effect) Show forest plot | 2 | 57 | Mean Difference (Fixed, 95% CI) | ‐7.19 [‐10.92, ‐3.46] |