Cesárea repetida electiva planificada versus parto vaginal planificado en pacientes con un parto anterior por cesárea
References
References to studies included in this review
Additional references
Jump to:
References to other published versions of this review
Jump to:
Characteristics of studies
Characteristics of included studies [ordered by study ID]
| Methods | Randomised trial conducted in 14 maternity units in Australia between November 2002 and May 2007. | |
| Participants | Women were eligible with a single prior caesarean section, live singleton fetus at 37 weeks' gestational age, and who were considered eligible to attempt VBAC by caregiver. Women with any of the following were excluded: more than 1 prior caesarean; vertical/inverted T/unknown uterine incision; prior uterine rupture; prior uterine surgery involving entry of uterine cavity; prior uterine perforation; multiple pregnancy; any contraindication to vaginal birth (placenta praevia; transverse lie; active genital herpes); cephalopelvic disproportion; lethal congenital anomaly; fetal anomaly associated with mechanical difficulties at birth. | |
| Interventions | 22 eligible women were randomised to either planned vaginal birth or to planned caesarean section. Where women planned vaginal birth, the spontaneous onset of labour was awaited. Where women planned an elective caesarean section, this was scheduled between 38 and 40 weeks' gestation. | |
| Outcomes | The primary outcome was a composite of death or serious adverse outcome for infant. A range of secondary clinical outcomes reflecting serious adverse outcomes for the woman and infant were reported. | |
| Notes | This study was conducted as a randomised trial nested within a larger prospective patient preference study. The inclusion and exclusion criteria and reported outcomes were the same for both the randomised and patient preference components of the study. | |
| Risk of bias | ||
| Bias | Authors' judgement | Support for judgement |
| Random sequence generation (selection bias) | Low risk | Computer‐generated random number sequence. |
| Allocation concealment (selection bias) | Low risk | Telephone randomisation service. |
| Incomplete outcome data (attrition bias) | Low risk | No losses to follow‐up reported. |
| Selective reporting (reporting bias) | Low risk | Outcomes identified in the published protocol have been reported. |
| Other bias | Low risk | No other bias identified. |
| Blinding of participants and personnel (performance bias) | Low risk | No blinding of participants, caregivers or outcome assessors but not considered likely to bias outcomes. |
| Blinding of outcome assessment (detection bias) | Low risk | No blinding of participants, caregivers or outcome assessors but not considered likely to bias outcomes. |
| Methods | Randomised trial conducted in a single maternity unit affiliated with University of Hong Kong, Hong Kong. | |
| Participants | Women were eligible with a single prior caesarean section, who were considered eligible to attempt vaginal birth by their caregiver. Women with a prior vaginal birth or any contraindication to attempting vaginal birth were excluded. | |
| Interventions | 298 eligible women were randomised to either planned vaginal birth or to planned caesarean section prior to 28 weeks' gestation. Where women planned vaginal birth, the spontaneous onset of labour was awaited. Where women planned an elective caesarean section, this was scheduled at 38 weeks' gestation. | |
| Outcomes | The primary outcomes were maternal psychometric assessments (EPDS, Beck Depression Inventory; State‐Trait Anxiety Inventory; General Health Questionnaire (GHQ‐12); Client Satisfaction Questionnaire) measured at 6 months postpartum. | |
| Notes | There are no maternal or infant clinical outcomes reported. | |
| Risk of bias | ||
| Bias | Authors' judgement | Support for judgement |
| Random sequence generation (selection bias) | Low risk | Computer‐generated random number sequence. |
| Allocation concealment (selection bias) | Low risk | Sealed, opaque, sequentially numbered envelopes. |
| Incomplete outcome data (attrition bias) | Low risk | 6 women refused to participate after randomisation; 1 woman was excluded after randomisation due to ineligibility. |
| Selective reporting (reporting bias) | Low risk | Specified primary outcomes are reported; there are no clinical maternal or infant outcomes reported. |
| Other bias | Low risk | No other bias identified. |
| Blinding of participants and personnel (performance bias) | Low risk | No blinding of participants, caregivers or outcome assessors but not considered likely to bias outcomes. |
| Blinding of outcome assessment (detection bias) | Low risk | No blinding of participants, caregivers or outcome assessors but not considered likely to bias outcomes. |
EPDS: Edinburgh Postnatal Depression Scale
VBAC: vaginal birth after caesarean
Data and analyses
| Outcome or subgroup title | No. of studies | No. of participants | Statistical method | Effect size |
| 1 Death or serious maternal morbidity Show forest plot | 1 | 22 | Risk Ratio (M‐H, Fixed, 95% CI) | 0.0 [0.0, 0.0] |
| Analysis 1.1  Comparison 1 Primary outcome, Outcome 1 Death or serious maternal morbidity. | ||||
| 2 Death or serious infant morbidity Show forest plot | 1 | 22 | Risk Ratio (M‐H, Fixed, 95% CI) | 0.0 [0.0, 0.0] |
| Analysis 1.2  Comparison 1 Primary outcome, Outcome 2 Death or serious infant morbidity. | ||||
| Outcome or subgroup title | No. of studies | No. of participants | Statistical method | Effect size |
| 1 Vaginal birth Show forest plot | 1 | 22 | Risk Ratio (M‐H, Fixed, 95% CI) | 0.34 [0.09, 1.29] |
| Analysis 2.1  Comparison 2 Secondary maternal outcomes, Outcome 1 Vaginal birth. | ||||
| 2 Caesarean section Show forest plot | 1 | 22 | Risk Ratio (M‐H, Fixed, 95% CI) | 1.92 [0.92, 4.01] |
| Analysis 2.2  Comparison 2 Secondary maternal outcomes, Outcome 2 Caesarean section. | ||||
| 3 Uterine rupture Show forest plot | 1 | 22 | Risk Ratio (M‐H, Fixed, 95% CI) | 0.0 [0.0, 0.0] |
| Analysis 2.3  Comparison 2 Secondary maternal outcomes, Outcome 3 Uterine rupture. | ||||
| 4 Haemorrhage or need for blood transfusion Show forest plot | 1 | 22 | Risk Ratio (M‐H, Fixed, 95% CI) | 1.2 [0.20, 7.05] |
| Analysis 2.4  Comparison 2 Secondary maternal outcomes, Outcome 4 Haemorrhage or need for blood transfusion. | ||||
| 5 Hysterectomy Show forest plot | 1 | 22 | Risk Ratio (M‐H, Fixed, 95% CI) | 0.0 [0.0, 0.0] |
| Analysis 2.5  Comparison 2 Secondary maternal outcomes, Outcome 5 Hysterectomy. | ||||
| 6 Vulval or perineal haematoma Show forest plot | 1 | 22 | Risk Ratio (M‐H, Fixed, 95% CI) | 0.0 [0.0, 0.0] |
| Analysis 2.6  Comparison 2 Secondary maternal outcomes, Outcome 6 Vulval or perineal haematoma. | ||||
| 7 Deep vein thrombosis Show forest plot | 1 | 22 | Risk Ratio (M‐H, Fixed, 95% CI) | 0.0 [0.0, 0.0] |
| Analysis 2.7  Comparison 2 Secondary maternal outcomes, Outcome 7 Deep vein thrombosis. | ||||
| 8 Pulmonary embolus Show forest plot | 1 | 22 | Risk Ratio (M‐H, Fixed, 95% CI) | 0.0 [0.0, 0.0] |
| Analysis 2.8  Comparison 2 Secondary maternal outcomes, Outcome 8 Pulmonary embolus. | ||||
| 9 Pneumonia Show forest plot | 1 | 22 | Risk Ratio (M‐H, Fixed, 95% CI) | 0.0 [0.0, 0.0] |
| Analysis 2.9  Comparison 2 Secondary maternal outcomes, Outcome 9 Pneumonia. | ||||
| 10 Adult respiratory distress syndrome Show forest plot | 1 | 22 | Risk Ratio (M‐H, Fixed, 95% CI) | 0.0 [0.0, 0.0] |
| Analysis 2.10  Comparison 2 Secondary maternal outcomes, Outcome 10 Adult respiratory distress syndrome. | ||||
| 11 Wound Infection Show forest plot | 1 | 22 | Risk Ratio (M‐H, Fixed, 95% CI) | 0.0 [0.0, 0.0] |
| Analysis 2.11  Comparison 2 Secondary maternal outcomes, Outcome 11 Wound Infection. | ||||
| 12 Wound dehiscence Show forest plot | 1 | 22 | Risk Ratio (M‐H, Fixed, 95% CI) | 0.0 [0.0, 0.0] |
| Analysis 2.12  Comparison 2 Secondary maternal outcomes, Outcome 12 Wound dehiscence. | ||||
| 13 Organ damage Show forest plot | 1 | 22 | Risk Ratio (M‐H, Fixed, 95% CI) | 0.0 [0.0, 0.0] |
| Analysis 2.13  Comparison 2 Secondary maternal outcomes, Outcome 13 Organ damage. | ||||
| 14 Development of fistula Show forest plot | 1 | 22 | Risk Ratio (M‐H, Fixed, 95% CI) | 0.0 [0.0, 0.0] |
| Analysis 2.14  Comparison 2 Secondary maternal outcomes, Outcome 14 Development of fistula. | ||||
| 15 Bowel obstruction Show forest plot | 1 | 22 | Risk Ratio (M‐H, Fixed, 95% CI) | 0.0 [0.0, 0.0] |
| Analysis 2.15  Comparison 2 Secondary maternal outcomes, Outcome 15 Bowel obstruction. | ||||
| 16 Pulmonary oedema Show forest plot | 1 | 22 | Risk Ratio (M‐H, Fixed, 95% CI) | 0.0 [0.0, 0.0] |
| Analysis 2.16  Comparison 2 Secondary maternal outcomes, Outcome 16 Pulmonary oedema. | ||||
| 17 Stroke Show forest plot | 1 | 22 | Risk Ratio (M‐H, Fixed, 95% CI) | 0.0 [0.0, 0.0] |
| Analysis 2.17  Comparison 2 Secondary maternal outcomes, Outcome 17 Stroke. | ||||
| 18 Cardiac arrest Show forest plot | 1 | 22 | Risk Ratio (M‐H, Fixed, 95% CI) | 0.0 [0.0, 0.0] |
| Analysis 2.18  Comparison 2 Secondary maternal outcomes, Outcome 18 Cardiac arrest. | ||||
| 19 Respiratory arrest Show forest plot | 1 | 22 | Risk Ratio (M‐H, Fixed, 95% CI) | 0.0 [0.0, 0.0] |
| Analysis 2.19  Comparison 2 Secondary maternal outcomes, Outcome 19 Respiratory arrest. | ||||
| 20 Maternal death Show forest plot | 1 | 22 | Risk Ratio (M‐H, Fixed, 95% CI) | 0.0 [0.0, 0.0] |
| Analysis 2.20  Comparison 2 Secondary maternal outcomes, Outcome 20 Maternal death. | ||||
| Outcome or subgroup title | No. of studies | No. of participants | Statistical method | Effect size |
| 1 Perinatal death Show forest plot | 1 | 22 | Risk Ratio (M‐H, Fixed, 95% CI) | 0.0 [0.0, 0.0] |
| Analysis 3.1  Comparison 3 Secondary infant outcomes, Outcome 1 Perinatal death. | ||||
| 2 Apgar score less than 7 at 5 minutes Show forest plot | 1 | 22 | Risk Ratio (M‐H, Fixed, 95% CI) | 0.0 [0.0, 0.0] |
| Analysis 3.2  Comparison 3 Secondary infant outcomes, Outcome 2 Apgar score less than 7 at 5 minutes. | ||||
| 3 Birthweight Show forest plot | 1 | 22 | Mean Difference (IV, Fixed, 95% CI) | ‐133.0 [‐513.12, 247.12] |
| Analysis 3.3  Comparison 3 Secondary infant outcomes, Outcome 3 Birthweight. | ||||
| 4 Intensive care unit admission Show forest plot | 1 | 22 | Risk Ratio (M‐H, Fixed, 95% CI) | 0.0 [0.0, 0.0] |
| Analysis 3.4  Comparison 3 Secondary infant outcomes, Outcome 4 Intensive care unit admission. | ||||
| 5 Birth trauma Show forest plot | 1 | 22 | Risk Ratio (M‐H, Fixed, 95% CI) | 0.0 [0.0, 0.0] |
| Analysis 3.5  Comparison 3 Secondary infant outcomes, Outcome 5 Birth trauma. | ||||
| 6 Seizures Show forest plot | 1 | 22 | Risk Ratio (M‐H, Fixed, 95% CI) | 0.0 [0.0, 0.0] |
| Analysis 3.6 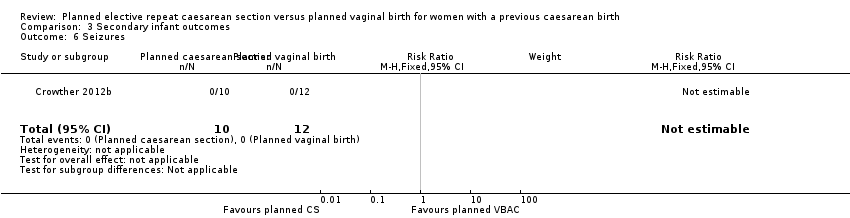 Comparison 3 Secondary infant outcomes, Outcome 6 Seizures. | ||||
| 7 Neonatal encephalopathy Show forest plot | 1 | 22 | Risk Ratio (M‐H, Fixed, 95% CI) | 0.0 [0.0, 0.0] |
| Analysis 3.7  Comparison 3 Secondary infant outcomes, Outcome 7 Neonatal encephalopathy. | ||||
| 8 Severe respiratory distress syndrome Show forest plot | 1 | 22 | Risk Ratio (M‐H, Fixed, 95% CI) | 0.0 [0.0, 0.0] |
| Analysis 3.8  Comparison 3 Secondary infant outcomes, Outcome 8 Severe respiratory distress syndrome. | ||||
| 9 Necrotising enterocolitis Show forest plot | 1 | 22 | Risk Ratio (M‐H, Fixed, 95% CI) | 0.0 [0.0, 0.0] |
| Analysis 3.9  Comparison 3 Secondary infant outcomes, Outcome 9 Necrotising enterocolitis. | ||||
| 10 Systemic infection Show forest plot | 1 | 22 | Risk Ratio (M‐H, Fixed, 95% CI) | 0.0 [0.0, 0.0] |
| Analysis 3.10  Comparison 3 Secondary infant outcomes, Outcome 10 Systemic infection. | ||||
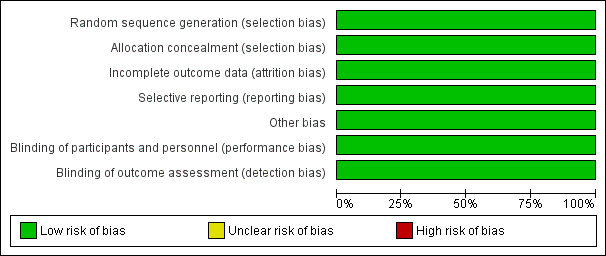
Risk of bias graph: review authors' judgements about each risk of bias item presented as percentages across all included studies.
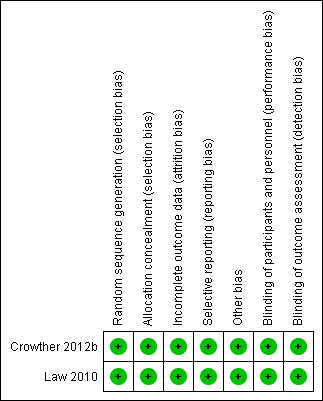
Risk of bias summary: review authors' judgements about each risk of bias item for each included study.
Comparison 1 Primary outcome, Outcome 1 Death or serious maternal morbidity.
Comparison 1 Primary outcome, Outcome 2 Death or serious infant morbidity.
Comparison 2 Secondary maternal outcomes, Outcome 1 Vaginal birth.
Comparison 2 Secondary maternal outcomes, Outcome 2 Caesarean section.
Comparison 2 Secondary maternal outcomes, Outcome 3 Uterine rupture.
Comparison 2 Secondary maternal outcomes, Outcome 4 Haemorrhage or need for blood transfusion.
Comparison 2 Secondary maternal outcomes, Outcome 5 Hysterectomy.
Comparison 2 Secondary maternal outcomes, Outcome 6 Vulval or perineal haematoma.
Comparison 2 Secondary maternal outcomes, Outcome 7 Deep vein thrombosis.
Comparison 2 Secondary maternal outcomes, Outcome 8 Pulmonary embolus.
Comparison 2 Secondary maternal outcomes, Outcome 9 Pneumonia.
Comparison 2 Secondary maternal outcomes, Outcome 10 Adult respiratory distress syndrome.
Comparison 2 Secondary maternal outcomes, Outcome 11 Wound Infection.
Comparison 2 Secondary maternal outcomes, Outcome 12 Wound dehiscence.
Comparison 2 Secondary maternal outcomes, Outcome 13 Organ damage.
Comparison 2 Secondary maternal outcomes, Outcome 14 Development of fistula.
Comparison 2 Secondary maternal outcomes, Outcome 15 Bowel obstruction.
Comparison 2 Secondary maternal outcomes, Outcome 16 Pulmonary oedema.
Comparison 2 Secondary maternal outcomes, Outcome 17 Stroke.
Comparison 2 Secondary maternal outcomes, Outcome 18 Cardiac arrest.
Comparison 2 Secondary maternal outcomes, Outcome 19 Respiratory arrest.
Comparison 2 Secondary maternal outcomes, Outcome 20 Maternal death.
Comparison 3 Secondary infant outcomes, Outcome 1 Perinatal death.
Comparison 3 Secondary infant outcomes, Outcome 2 Apgar score less than 7 at 5 minutes.
Comparison 3 Secondary infant outcomes, Outcome 3 Birthweight.
Comparison 3 Secondary infant outcomes, Outcome 4 Intensive care unit admission.
Comparison 3 Secondary infant outcomes, Outcome 5 Birth trauma.
Comparison 3 Secondary infant outcomes, Outcome 6 Seizures.
Comparison 3 Secondary infant outcomes, Outcome 7 Neonatal encephalopathy.
Comparison 3 Secondary infant outcomes, Outcome 8 Severe respiratory distress syndrome.
Comparison 3 Secondary infant outcomes, Outcome 9 Necrotising enterocolitis.
Comparison 3 Secondary infant outcomes, Outcome 10 Systemic infection.
| Outcome or subgroup title | No. of studies | No. of participants | Statistical method | Effect size |
| 1 Death or serious maternal morbidity Show forest plot | 1 | 22 | Risk Ratio (M‐H, Fixed, 95% CI) | 0.0 [0.0, 0.0] |
| 2 Death or serious infant morbidity Show forest plot | 1 | 22 | Risk Ratio (M‐H, Fixed, 95% CI) | 0.0 [0.0, 0.0] |
| Outcome or subgroup title | No. of studies | No. of participants | Statistical method | Effect size |
| 1 Vaginal birth Show forest plot | 1 | 22 | Risk Ratio (M‐H, Fixed, 95% CI) | 0.34 [0.09, 1.29] |
| 2 Caesarean section Show forest plot | 1 | 22 | Risk Ratio (M‐H, Fixed, 95% CI) | 1.92 [0.92, 4.01] |
| 3 Uterine rupture Show forest plot | 1 | 22 | Risk Ratio (M‐H, Fixed, 95% CI) | 0.0 [0.0, 0.0] |
| 4 Haemorrhage or need for blood transfusion Show forest plot | 1 | 22 | Risk Ratio (M‐H, Fixed, 95% CI) | 1.2 [0.20, 7.05] |
| 5 Hysterectomy Show forest plot | 1 | 22 | Risk Ratio (M‐H, Fixed, 95% CI) | 0.0 [0.0, 0.0] |
| 6 Vulval or perineal haematoma Show forest plot | 1 | 22 | Risk Ratio (M‐H, Fixed, 95% CI) | 0.0 [0.0, 0.0] |
| 7 Deep vein thrombosis Show forest plot | 1 | 22 | Risk Ratio (M‐H, Fixed, 95% CI) | 0.0 [0.0, 0.0] |
| 8 Pulmonary embolus Show forest plot | 1 | 22 | Risk Ratio (M‐H, Fixed, 95% CI) | 0.0 [0.0, 0.0] |
| 9 Pneumonia Show forest plot | 1 | 22 | Risk Ratio (M‐H, Fixed, 95% CI) | 0.0 [0.0, 0.0] |
| 10 Adult respiratory distress syndrome Show forest plot | 1 | 22 | Risk Ratio (M‐H, Fixed, 95% CI) | 0.0 [0.0, 0.0] |
| 11 Wound Infection Show forest plot | 1 | 22 | Risk Ratio (M‐H, Fixed, 95% CI) | 0.0 [0.0, 0.0] |
| 12 Wound dehiscence Show forest plot | 1 | 22 | Risk Ratio (M‐H, Fixed, 95% CI) | 0.0 [0.0, 0.0] |
| 13 Organ damage Show forest plot | 1 | 22 | Risk Ratio (M‐H, Fixed, 95% CI) | 0.0 [0.0, 0.0] |
| 14 Development of fistula Show forest plot | 1 | 22 | Risk Ratio (M‐H, Fixed, 95% CI) | 0.0 [0.0, 0.0] |
| 15 Bowel obstruction Show forest plot | 1 | 22 | Risk Ratio (M‐H, Fixed, 95% CI) | 0.0 [0.0, 0.0] |
| 16 Pulmonary oedema Show forest plot | 1 | 22 | Risk Ratio (M‐H, Fixed, 95% CI) | 0.0 [0.0, 0.0] |
| 17 Stroke Show forest plot | 1 | 22 | Risk Ratio (M‐H, Fixed, 95% CI) | 0.0 [0.0, 0.0] |
| 18 Cardiac arrest Show forest plot | 1 | 22 | Risk Ratio (M‐H, Fixed, 95% CI) | 0.0 [0.0, 0.0] |
| 19 Respiratory arrest Show forest plot | 1 | 22 | Risk Ratio (M‐H, Fixed, 95% CI) | 0.0 [0.0, 0.0] |
| 20 Maternal death Show forest plot | 1 | 22 | Risk Ratio (M‐H, Fixed, 95% CI) | 0.0 [0.0, 0.0] |
| Outcome or subgroup title | No. of studies | No. of participants | Statistical method | Effect size |
| 1 Perinatal death Show forest plot | 1 | 22 | Risk Ratio (M‐H, Fixed, 95% CI) | 0.0 [0.0, 0.0] |
| 2 Apgar score less than 7 at 5 minutes Show forest plot | 1 | 22 | Risk Ratio (M‐H, Fixed, 95% CI) | 0.0 [0.0, 0.0] |
| 3 Birthweight Show forest plot | 1 | 22 | Mean Difference (IV, Fixed, 95% CI) | ‐133.0 [‐513.12, 247.12] |
| 4 Intensive care unit admission Show forest plot | 1 | 22 | Risk Ratio (M‐H, Fixed, 95% CI) | 0.0 [0.0, 0.0] |
| 5 Birth trauma Show forest plot | 1 | 22 | Risk Ratio (M‐H, Fixed, 95% CI) | 0.0 [0.0, 0.0] |
| 6 Seizures Show forest plot | 1 | 22 | Risk Ratio (M‐H, Fixed, 95% CI) | 0.0 [0.0, 0.0] |
| 7 Neonatal encephalopathy Show forest plot | 1 | 22 | Risk Ratio (M‐H, Fixed, 95% CI) | 0.0 [0.0, 0.0] |
| 8 Severe respiratory distress syndrome Show forest plot | 1 | 22 | Risk Ratio (M‐H, Fixed, 95% CI) | 0.0 [0.0, 0.0] |
| 9 Necrotising enterocolitis Show forest plot | 1 | 22 | Risk Ratio (M‐H, Fixed, 95% CI) | 0.0 [0.0, 0.0] |
| 10 Systemic infection Show forest plot | 1 | 22 | Risk Ratio (M‐H, Fixed, 95% CI) | 0.0 [0.0, 0.0] |