Interventions to prevent hypothermia at birth in preterm and/or low birth weight infants
Information
- DOI:
- https://doi.org/10.1002/14651858.CD004210.pub5Copy DOI

- Database:
-
- Cochrane Database of Systematic Reviews
- Version published:
-
- 12 February 2018see what's new
- Type:
-
- Intervention
- Stage:
-
- Review
- Cochrane Editorial Group:
-
Cochrane Neonatal Group
- Copyright:
-
- Copyright © 2018 The Cochrane Collaboration. Published by John Wiley & Sons, Ltd.
Article metrics
Altmetric:
Cited by:
Authors
Contributions of authors
This review was conceived by the Northern Ireland Neonatal Intensive Care Outcomes Research and Evaluation Group (NICORE).
The contact review author (EC) co‐ordinated the review and prepared the manuscript in RevMan 5.3. EC and the QUB Medical Faculty Librarians designed the search strategy. EC drafted the data extraction proforma, which was edited by FA, HH, LJ, and SV. FA, HH, LJ, SV, and EC (this update, EC and FA) screened abstracts and papers against the inclusion criteria, appraised their quality, and extracted trial data. EC entered the data into RevMan 5.3. HH, LJ, and SV provided clinical input at all stages of the review process. FA and HH provided methodological input. All review authors were involved equally in development of content of the final manuscript.
Sources of support
Internal sources
-
Northern Ireland Neonatal Intensive Care Outcomes Research and Evaluation Group (NICORE), UK.
-
Eunice Kennedy Shriver National Institute of Child Health and Human Development National Institutes of Health, Department of Health and Human Services, USA.
Editorial support of the Cochrane Neonatal Review Group has been funded with Federal funds from the Eunice Kennedy Shriver National Institute of Child Health and Human Development National Institutes of Health, Department of Health and Human Services, USA, under Contract No. HHSN275201600005C
External sources
-
Research & Development Office ‐ Northern Ireland, UK.
Declarations of interest
SV is principal investigator on three studies that met the review eligibility criteria and was excluded from the study appraisal process for these studies.
Acknowledgements
Diarmuid Kennedy, Angela Thompson, Alex McIlroy, and Patricia Watt, Faculty Librarians Medicine and Health Sciences, Queen's University Belfast; Mike Stevenson, Consultant in Medical Statistics; Nuala Livingston, Cochrane Editorial Unit (London); Roger Soll, Colleen Ovelman, and Yolanda Brosseau, Cochrane Neonatal Review Group (CNRG); Suzanne Sweeney, Texas Woman's University Library, Texas Woman's University.
Version history
| Published | Title | Stage | Authors | Version |
| 2018 Feb 12 | Interventions to prevent hypothermia at birth in preterm and/or low birth weight infants | Review | Emma M McCall, Fiona Alderdice, Henry L Halliday, Sunita Vohra, Linda Johnston | |
| 2010 Mar 17 | Interventions to prevent hypothermia at birth in preterm and/or low birthweight infants | Review | Emma M McCall, Fiona Alderdice, Henry L Halliday, John G Jenkins, Sunita Vohra | |
| 2008 Jan 23 | Interventions to prevent hypothermia at birth in preterm and/or low birthweight infants | Review | Emma M McCall, Fiona Alderdice, Henry L Halliday, John G Jenkins, Sunita Vohra | |
| 2005 Jan 24 | Interventions to prevent hypothermia at birth in preterm and/or low birthweight babies | Review | Emma M McCall, Fiona Alderdice, Henry L Halliday, John G Jenkins, Sunita Vohra | |
| 2003 Apr 22 | Interventions to prevent hypothermia at birth in preterm and/or low birthweight babies | Protocol | Emma M McCall, Fiona A Alderdice, Henry L Halliday, John G Jenkins, Sunita Vohra | |
Differences between protocol and review
For this review update, we expanded our inclusion criteria to reflect changes in clinical practice. We remain focused on interventions to prevent hypothermia applied immediately at birth apart from 'routine' care (as defined in our original protocol) but have also included randomised and quasi‐randomised controlled trials comparing any other single/combination of intervention(s) also designed for prevention of hypothermia in preterm and/or low birth weight infants, and applied within 10 minutes after birth in the delivery room.
We added the methods and the plan for 'Summary of findings' tables and GRADE recommendations, which were not included in the original protocol nor in the original review.
Keywords
MeSH
Medical Subject Headings (MeSH) Keywords
Medical Subject Headings Check Words
Humans; Infant, Newborn;
PICOs

Study flow diagram: review update.

Risk of bias summary: review authors' judgements about each risk of bias item for each included study.
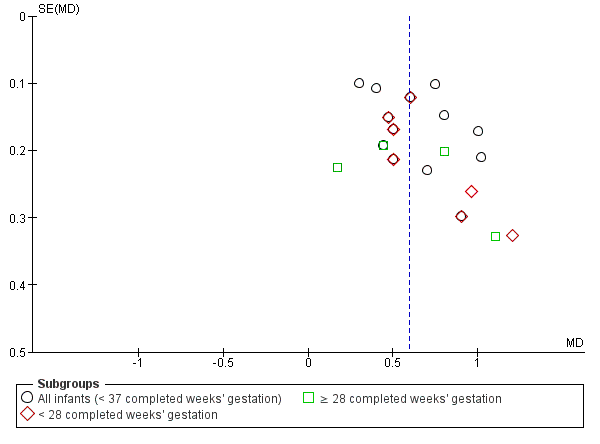
Funnel plot of comparison: 1 Plastic wrap or bag versus routine care, outcome: 1.1 Core body temperature (°C) on admission to NICU or up to 2 hours after birth.
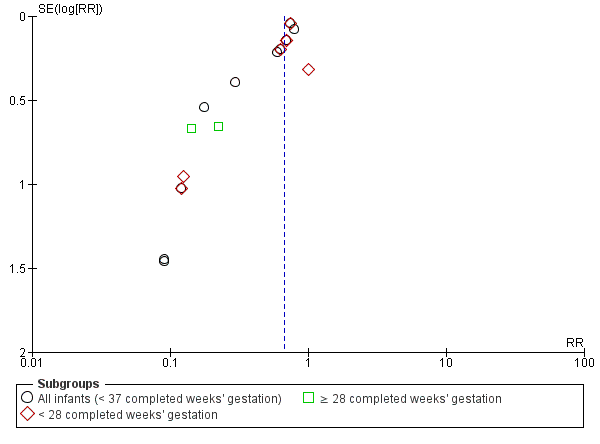
Funnel plot of comparison: 1 Plastic wrap or bag versus routine care, outcome: 1.2 Hypothermia on admission to NICU: core body temperature < 36.5°C or skin temperature < 36°C.

Funnel plot of comparison: 1 Plastic wrap or bag versus routine care, outcome: 1.19 Mortality (death within hospital stay or at 6 months' corrected gestation).

Comparison 1 Plastic wrap or bag versus routine care, Outcome 1 Core body temperature (°C) on admission to NICU or up to 2 hours after birth.

Comparison 1 Plastic wrap or bag versus routine care, Outcome 2 Hypothermia on admission to NICU: core body temperature < 36.5°C or skin temperature < 36°C.

Comparison 1 Plastic wrap or bag versus routine care, Outcome 3 Outside normothermic range on admission to NICU or up to 2 hours after birth.
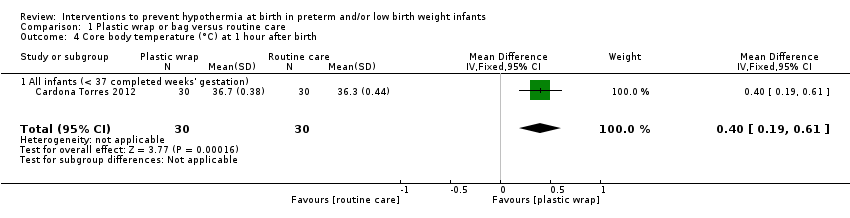
Comparison 1 Plastic wrap or bag versus routine care, Outcome 4 Core body temperature (°C) at 1 hour after birth.

Comparison 1 Plastic wrap or bag versus routine care, Outcome 5 Core body temperature (°C) at 90 minutes after birth.

Comparison 1 Plastic wrap or bag versus routine care, Outcome 6 Core body temperature (°C) at 2 hours after birth.

Comparison 1 Plastic wrap or bag versus routine care, Outcome 7 Core body temperature (°C) post stabilisation.

Comparison 1 Plastic wrap or bag versus routine care, Outcome 8 Hypothermia post stabilisation: core body temperature < 36.5°C or skin temperature < 36°C.

Comparison 1 Plastic wrap or bag versus routine care, Outcome 9 Outside normothermic range post stabilisation.

Comparison 1 Plastic wrap or bag versus routine care, Outcome 10 Core body temperature (°C) 30 minutes after initial NICU admission temperature was taken.
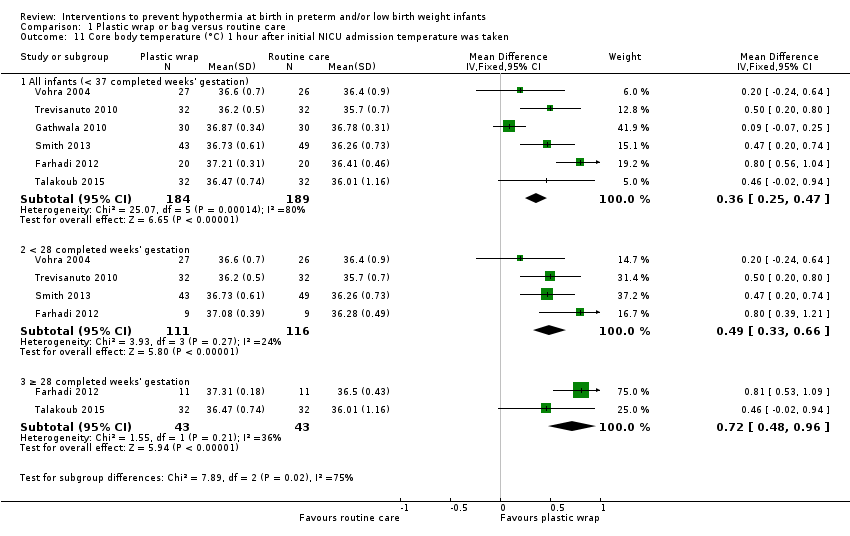
Comparison 1 Plastic wrap or bag versus routine care, Outcome 11 Core body temperature (°C) 1 hour after initial NICU admission temperature was taken.

Comparison 1 Plastic wrap or bag versus routine care, Outcome 12 Core body temperature (°C) 90 minutes after initial NICU admission temperature was taken.

Comparison 1 Plastic wrap or bag versus routine care, Outcome 13 Core body temperature (°C) 2 hours after initial NICU admission temperature was taken.

Comparison 1 Plastic wrap or bag versus routine care, Outcome 14 Hyperthermia on admission to NICU: core body temperature > 37.5°C.
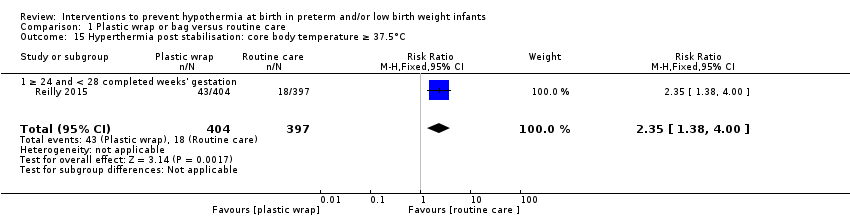
Comparison 1 Plastic wrap or bag versus routine care, Outcome 15 Hyperthermia post stabilisation: core body temperature ≥ 37.5°C.

Comparison 1 Plastic wrap or bag versus routine care, Outcome 16 Major brain injury.

Comparison 1 Plastic wrap or bag versus routine care, Outcome 17 Intraventicular haemorrhage (all grades).
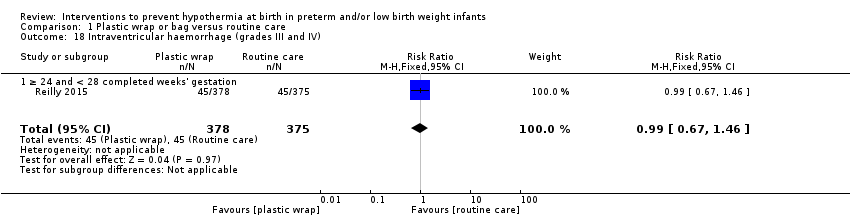
Comparison 1 Plastic wrap or bag versus routine care, Outcome 18 Intraventricular haemorrhage (grades III and IV).

Comparison 1 Plastic wrap or bag versus routine care, Outcome 19 Mortality (death within hospital stay or at 6 months' corrected gestation).

Comparison 1 Plastic wrap or bag versus routine care, Outcome 20 Arterial oxygen saturation (percentage).

Comparison 1 Plastic wrap or bag versus routine care, Outcome 21 Bicarbonate (mmol/L).

Comparison 1 Plastic wrap or bag versus routine care, Outcome 22 Blood gas pH (first).

Comparison 1 Plastic wrap or bag versus routine care, Outcome 23 Blood gas pH < 7.25.

Comparison 1 Plastic wrap or bag versus routine care, Outcome 24 Blood glucose concentration (mmol/L) (first).

Comparison 1 Plastic wrap or bag versus routine care, Outcome 25 Blood glucose < 2.6 mmol/L.

Comparison 1 Plastic wrap or bag versus routine care, Outcome 26 Blood glucose > 6 mmol/L.
| Study | Group | N | Median | Interquartile range | P value |
| All infants (< 37 completed weeks' gestation) | |||||
| Cardona Torres 2012 | Plastic bag without drying | 30 | 5.4 | 3.2 ‐ 8.8 | p > 0.05 |
| Cardona Torres 2012 | Routine care | 30 | 3.6 | 2.7 ‐ 4.4 | |
Comparison 1 Plastic wrap or bag versus routine care, Outcome 27 Blood glucose concentration mmol/L at 120 minutes after birth.
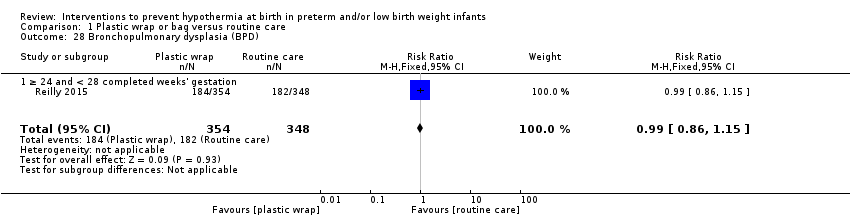
Comparison 1 Plastic wrap or bag versus routine care, Outcome 28 Bronchopulmonary dysplasia (BPD).
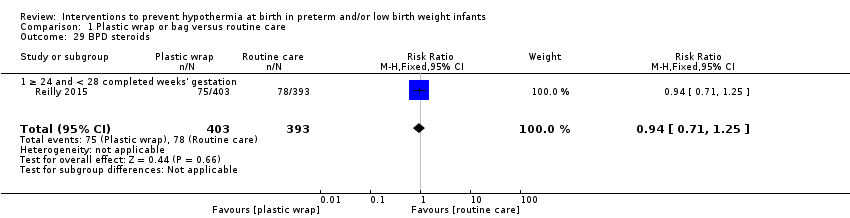
Comparison 1 Plastic wrap or bag versus routine care, Outcome 29 BPD steroids.

Comparison 1 Plastic wrap or bag versus routine care, Outcome 30 Duration of hospitalisation (days).
| Study | Group | N | Median | IQR | P‐value |
| Rohana 2011 | Intervention (polyethylene wrap) | 50 | 37 | 16.0 to 61.5 | 0.29 |
| Rohana 2011 | Control (routine care) | 60 | 30 | 15.2 to 46.0 | |
Comparison 1 Plastic wrap or bag versus routine care, Outcome 31 Duration of hospitalisation (days).
| Study | Group | N | Median | IQR | P‐value |
| Rohana 2011 | Intervention (polyethylene wrap) | 50 | 27.0 | 3.5 to 43.8 | 0.29 |
| Rohana 2011 | Control (routine care) | 60 | 15.0 | 1 to 41.2 | |
Comparison 1 Plastic wrap or bag versus routine care, Outcome 32 Duration of continuous positive airway pressure (CPAP) (days).
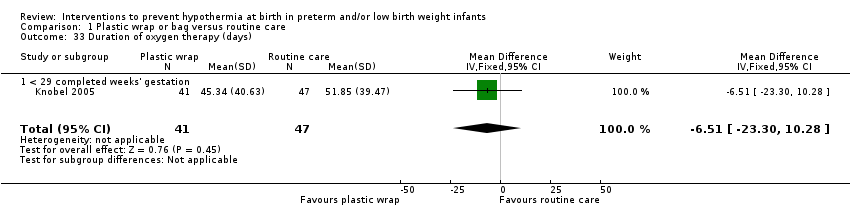
Comparison 1 Plastic wrap or bag versus routine care, Outcome 33 Duration of oxygen therapy (days).
| Study | Group | N | Median | IQR | P‐value |
| Rohana 2011 | Intervention (polyethylene wrap) | 50 | 3.0 | 0 to 3 | 0.30 |
| Rohana 2011 | Control (routine care) | 60 | 2.6 | 0 to 2 | |
Comparison 1 Plastic wrap or bag versus routine care, Outcome 34 Duration of ventilation (days).
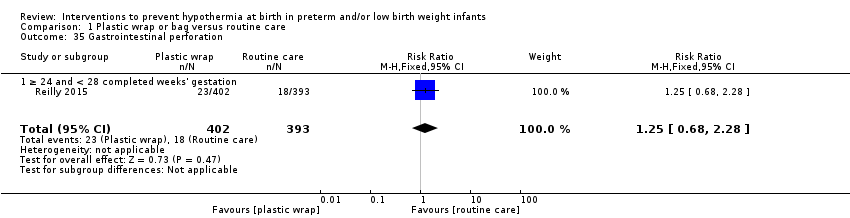
Comparison 1 Plastic wrap or bag versus routine care, Outcome 35 Gastrointestinal perforation.

Comparison 1 Plastic wrap or bag versus routine care, Outcome 36 Intubation in delivery room.
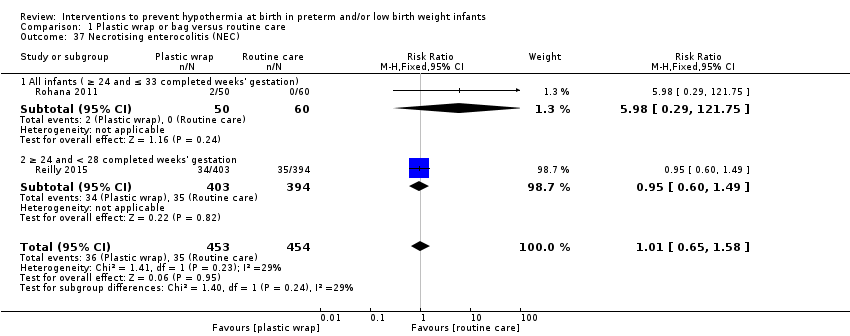
Comparison 1 Plastic wrap or bag versus routine care, Outcome 37 Necrotising enterocolitis (NEC).

Comparison 1 Plastic wrap or bag versus routine care, Outcome 38 Patent ductus arteriosus (PDA).

Comparison 1 Plastic wrap or bag versus routine care, Outcome 39 Pneumothorax.

Comparison 1 Plastic wrap or bag versus routine care, Outcome 40 Pulmonary haemorrhage.

Comparison 1 Plastic wrap or bag versus routine care, Outcome 41 Requirement for bubble continuous positive airway pressure (BCPAP).

Comparison 1 Plastic wrap or bag versus routine care, Outcome 42 Requirement for ventilation.

Comparison 1 Plastic wrap or bag versus routine care, Outcome 43 Respiratory distress syndrome (RDS).

Comparison 1 Plastic wrap or bag versus routine care, Outcome 44 Retinopathy of prematurity (ROP).

Comparison 1 Plastic wrap or bag versus routine care, Outcome 45 Sepsis (late).

Comparison 1 Plastic wrap or bag versus routine care, Outcome 46 Sepsis (early).

Comparison 2 Plastic wrap versus routine care (interhospital neonatal transport), Outcome 1 Core body temperature (°C) on admission to NICU or up to 2 hours after birth.

Comparison 2 Plastic wrap versus routine care (interhospital neonatal transport), Outcome 2 Hypothermia on admission to NICU: core body temperature < 36.5°C or skin temperature < 36°C.

Comparison 2 Plastic wrap versus routine care (interhospital neonatal transport), Outcome 3 Decrease in temperature (axillary °C) from baseline before transport to NICU admission.
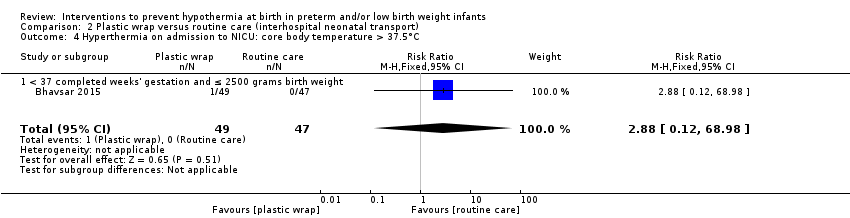
Comparison 2 Plastic wrap versus routine care (interhospital neonatal transport), Outcome 4 Hyperthermia on admission to NICU: core body temperature > 37.5°C.

Comparison 2 Plastic wrap versus routine care (interhospital neonatal transport), Outcome 5 Base excess.
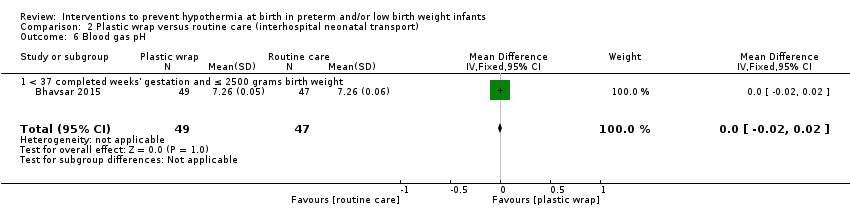
Comparison 2 Plastic wrap versus routine care (interhospital neonatal transport), Outcome 6 Blood gas pH.
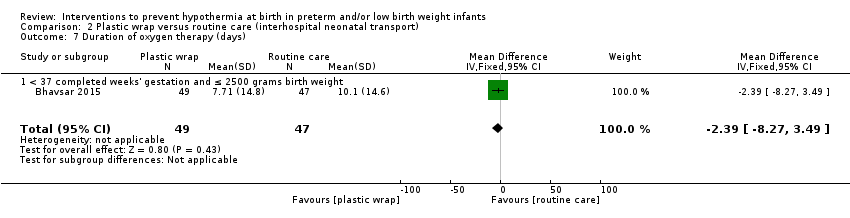
Comparison 2 Plastic wrap versus routine care (interhospital neonatal transport), Outcome 7 Duration of oxygen therapy (days).
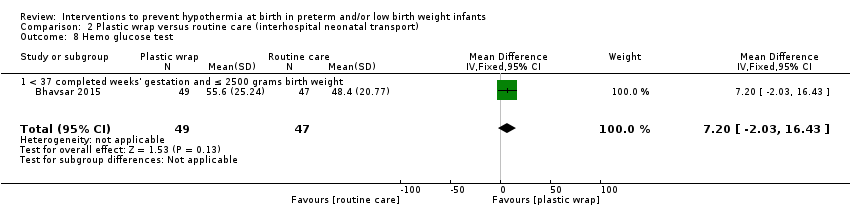
Comparison 2 Plastic wrap versus routine care (interhospital neonatal transport), Outcome 8 Hemo glucose test.

Comparison 2 Plastic wrap versus routine care (interhospital neonatal transport), Outcome 9 Hypoglycaemia (blood glucose level < 40 mg/dL within 2 hours of birth).

Comparison 2 Plastic wrap versus routine care (interhospital neonatal transport), Outcome 10 Severe metabolic acidosis.

Comparison 3 Plastic bag with previous drying versus routine care, Outcome 1 Core body temperature (°C) 30 minutes after birth.
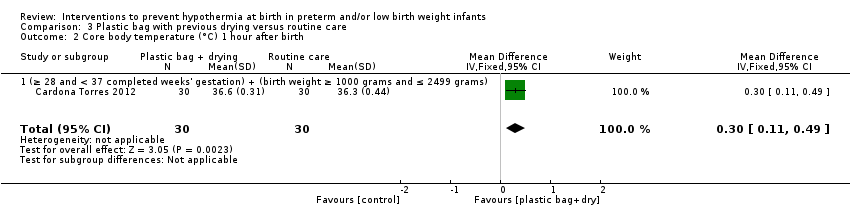
Comparison 3 Plastic bag with previous drying versus routine care, Outcome 2 Core body temperature (°C) 1 hour after birth.

Comparison 3 Plastic bag with previous drying versus routine care, Outcome 3 Core body temperature (°C) 90 minutes after birth.

Comparison 3 Plastic bag with previous drying versus routine care, Outcome 4 Core body temperature (°C) 2 hours after birth.
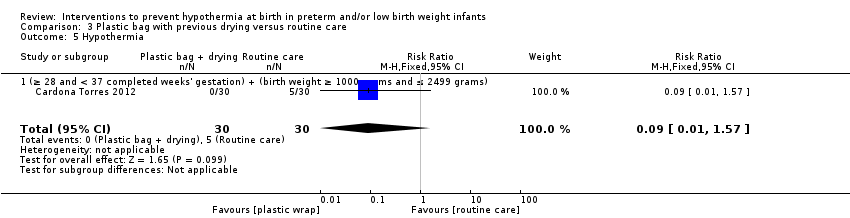
Comparison 3 Plastic bag with previous drying versus routine care, Outcome 5 Hypothermia.
| Study | Group | N | Median | Interquartile range | P value |
| (≥ 28 and < 37 completed weeks' gestation) + (birth weight ≥ 1000 grams and ≤ 2499 grams) | |||||
| Cardona Torres 2012 | Plastic bag with drying | 30 | 3.75 | 2.6 ‐ 5.5 | p > o.o5 |
| Cardona Torres 2012 | Control | 30 | 3.56 | 2.7 ‐ 4.4 | |
Comparison 3 Plastic bag with previous drying versus routine care, Outcome 6 Glucose concentration (mmol/L) at 120 minutes after birth.

Comparison 4 Plastic cap versus routine care (no cap), Outcome 1 Core body temperature (°C) on admission to NICU or up to 2 hours after birth.

Comparison 4 Plastic cap versus routine care (no cap), Outcome 2 Hypothermia on admission to NICU: core body temperature < 36.4°C.

Comparison 4 Plastic cap versus routine care (no cap), Outcome 3 Outside normothermic range on admission to NICU or up to 2 hours after birth.

Comparison 4 Plastic cap versus routine care (no cap), Outcome 4 Core body temperature (°C) 1 hour after initial NICU admission temperature was taken.
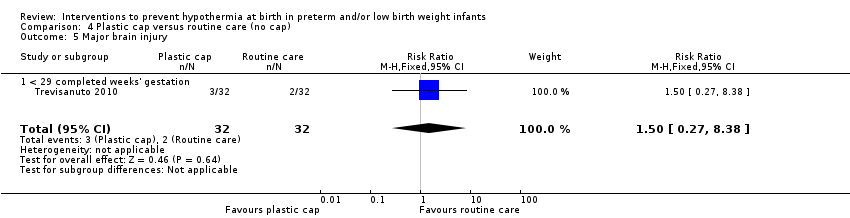
Comparison 4 Plastic cap versus routine care (no cap), Outcome 5 Major brain injury.

Comparison 4 Plastic cap versus routine care (no cap), Outcome 6 Mortality (death within hospital stay).

Comparison 4 Plastic cap versus routine care (no cap), Outcome 7 Bicarbonate (mmol/L).

Comparison 4 Plastic cap versus routine care (no cap), Outcome 8 Blood gas pH (first).

Comparison 4 Plastic cap versus routine care (no cap), Outcome 9 First serum glucose concentration (mmol/L) on admission to NICU.

Comparison 4 Plastic cap versus routine care (no cap), Outcome 10 Intubation at birth.

Comparison 5 Plastic bag and plastic cap versus routine care, Outcome 1 Core body temperature (°C) on admission to NICU or up to 2 hours after birth.
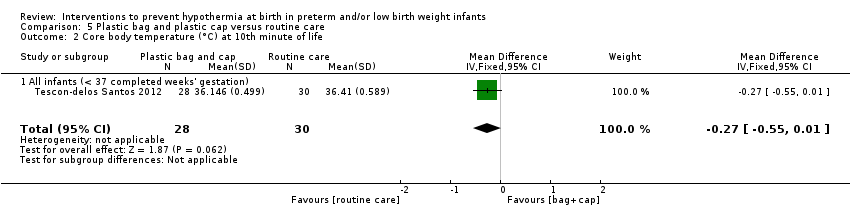
Comparison 5 Plastic bag and plastic cap versus routine care, Outcome 2 Core body temperature (°C) at 10th minute of life.

Comparison 5 Plastic bag and plastic cap versus routine care, Outcome 3 Core body temperature (°C) at 15th minute of life.

Comparison 5 Plastic bag and plastic cap versus routine care, Outcome 4 Core body temperature (°C) at 30th minute of life.

Comparison 5 Plastic bag and plastic cap versus routine care, Outcome 5 Core body temperature (°C) at 1 hour of life.
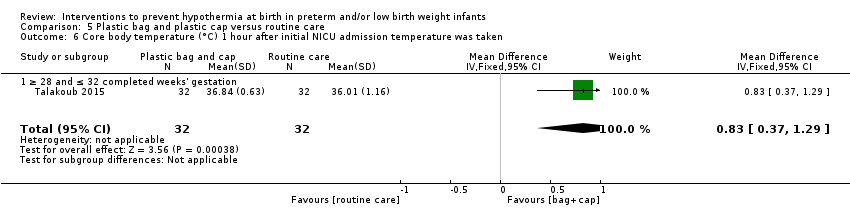
Comparison 5 Plastic bag and plastic cap versus routine care, Outcome 6 Core body temperature (°C) 1 hour after initial NICU admission temperature was taken.

Comparison 5 Plastic bag and plastic cap versus routine care, Outcome 7 Core body temperature (°C) 2 hours after initial NICU admission temperature was taken.

Comparison 5 Plastic bag and plastic cap versus routine care, Outcome 8 Hyperthermia: core body temperature > 37.0°C.

Comparison 5 Plastic bag and plastic cap versus routine care, Outcome 9 Hyponatraemia (serum sodium concentration < 130 mmol/L).

Comparison 5 Plastic bag and plastic cap versus routine care, Outcome 10 Weight (grams) at fifth day of life.

Comparison 6 Plastic bag with previous drying versus plastic bag without previous drying, Outcome 1 Core body temperature (°C) 30 minutes after birth.

Comparison 6 Plastic bag with previous drying versus plastic bag without previous drying, Outcome 2 Core body temperature (°C) 1 hour after birth.

Comparison 6 Plastic bag with previous drying versus plastic bag without previous drying, Outcome 3 Core body temperature (°C) 90 minutes after birth.
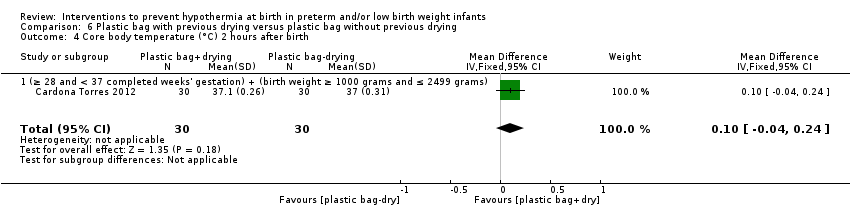
Comparison 6 Plastic bag with previous drying versus plastic bag without previous drying, Outcome 4 Core body temperature (°C) 2 hours after birth.

Comparison 6 Plastic bag with previous drying versus plastic bag without previous drying, Outcome 5 Hyperthermia.
| Study | Group | N | Median | Interquartile range | P value |
| (≥ 28 and < 37 completed weeks' gestation) + (birth weight ≥ 1000 grams and ≤ 2499 grams) | |||||
| Cardona Torres 2012 | Plastic bag with drying | 30 | 3.8 | 2.6 ‐ 5.5 | P > 0.05 |
| Cardona Torres 2012 | Plasic bag without drying | 30 | 5.4 | 3.2 ‐ 8.8 | |
Comparison 6 Plastic bag with previous drying versus plastic bag without previous drying, Outcome 6 Glucose concentration (mmol/L) at 2 hours after birth.

Comparison 7 Plastic cap versus plastic bag, Outcome 1 Core body temperature (°C) on admission to NICU or up to 2 hours after birth.

Comparison 7 Plastic cap versus plastic bag, Outcome 2 Hypothermia on admission to NICU: core body temperature < 36.4°C.

Comparison 7 Plastic cap versus plastic bag, Outcome 3 Outside normothermic range on admission to NICU or up to 2 hours after birth.

Comparison 7 Plastic cap versus plastic bag, Outcome 4 Core body temperature (°C) 1 hour after initial temperature on admission to NICU taken.

Comparison 7 Plastic cap versus plastic bag, Outcome 5 Hyperthermia on admission to NICU: core body temperature > 37.5°C.

Comparison 7 Plastic cap versus plastic bag, Outcome 6 Major brain injury.
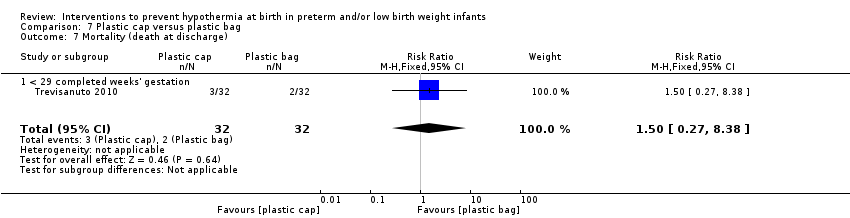
Comparison 7 Plastic cap versus plastic bag, Outcome 7 Mortality (death at discharge).

Comparison 7 Plastic cap versus plastic bag, Outcome 8 Bicarbonate concentration (mmol/L).

Comparison 7 Plastic cap versus plastic bag, Outcome 9 Blood gas pH.

Comparison 7 Plastic cap versus plastic bag, Outcome 10 First serum glucose concentration (mmol/L) on admission to NICU.

Comparison 7 Plastic cap versus plastic bag, Outcome 11 Intubation at birth.

Comparison 8 Plastic bag versus plastic wrap, Outcome 1 Core body temperature (°C) 20 minutes after birth.

Comparison 8 Plastic bag versus plastic wrap, Outcome 2 Core body temperature (°C) 40 minutes after birth.

Comparison 8 Plastic bag versus plastic wrap, Outcome 3 Core body temperature (°C) 1 hour after birth.

Comparison 8 Plastic bag versus plastic wrap, Outcome 4 Decrease in core body temperature (°C) during 1 hour after birth.

Comparison 8 Plastic bag versus plastic wrap, Outcome 5 Hypothermia within 1 hour after birth: core body temperature < 36.5°C or skin temperature < 36°C.

Comparison 8 Plastic bag versus plastic wrap, Outcome 6 Moderate hypothermia within 1 hour after birth: core body temperature 32°C to 35.9°C.
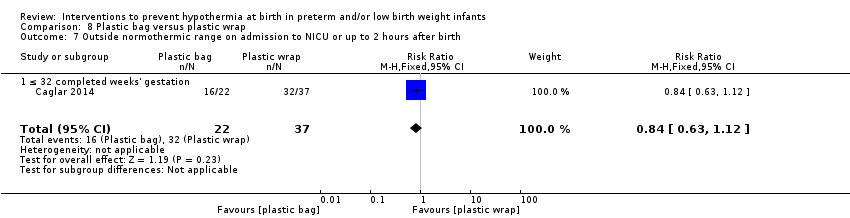
Comparison 8 Plastic bag versus plastic wrap, Outcome 7 Outside normothermic range on admission to NICU or up to 2 hours after birth.

Comparison 9 Plastic total body wrap (body + head) versus plastic body wrap (head uncovered), Outcome 1 Core body temperature (°C) on admission to NICU.

Comparison 9 Plastic total body wrap (body + head) versus plastic body wrap (head uncovered), Outcome 2 Hypothermia on admission to NICU: core body temperature < 36.5°C.

Comparison 9 Plastic total body wrap (body + head) versus plastic body wrap (head uncovered), Outcome 3 Mild hypothermia on admission to NICU: core body temperature 36°C to 36.4°C.

Comparison 9 Plastic total body wrap (body + head) versus plastic body wrap (head uncovered), Outcome 4 Moderate hypothermia on admission to NICU: core body temperature < 32.0°C to 35.9°C.

Comparison 9 Plastic total body wrap (body + head) versus plastic body wrap (head uncovered), Outcome 5 Outside normothermic range on admission to NICU or within 2 hours after birth.

Comparison 9 Plastic total body wrap (body + head) versus plastic body wrap (head uncovered), Outcome 6 Core body temperature (°C) 1 hour after admission to NICU.

Comparison 9 Plastic total body wrap (body + head) versus plastic body wrap (head uncovered), Outcome 7 Hyperthermia on admission to NICU: core body temperature > 37.5°C.

Comparison 9 Plastic total body wrap (body + head) versus plastic body wrap (head uncovered), Outcome 8 Intraventricular haemorrhage.

Comparison 9 Plastic total body wrap (body + head) versus plastic body wrap (head uncovered), Outcome 9 Periventricular leukomalacia.

Comparison 9 Plastic total body wrap (body + head) versus plastic body wrap (head uncovered), Outcome 10 Mortality.

Comparison 9 Plastic total body wrap (body + head) versus plastic body wrap (head uncovered), Outcome 11 Bronchopulmonary dysplasia (BPD).

Comparison 9 Plastic total body wrap (body + head) versus plastic body wrap (head uncovered), Outcome 12 Necrotising enterocolitis.

Comparison 10 Plastic bag and plastic hat versus plastic bag and cotton hat, Outcome 1 Core body temperature (°C) on admission to NICU or up to 2 hours after birth.

Comparison 10 Plastic bag and plastic hat versus plastic bag and cotton hat, Outcome 2 Core body temperature (°C) 1 hour after admission to NICU.
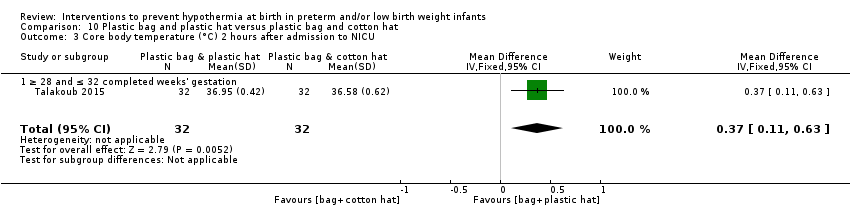
Comparison 10 Plastic bag and plastic hat versus plastic bag and cotton hat, Outcome 3 Core body temperature (°C) 2 hours after admission to NICU.

Comparison 11 Stockinette cap versus routine care (no cap), Outcome 1 Core body temperature (°C) on admission to NICU or up to 2 hours after birth.

Comparison 11 Stockinette cap versus routine care (no cap), Outcome 2 Hypothermia on admission to NICU: core body temperature < 36.5°C or skin temperature < 36°C.
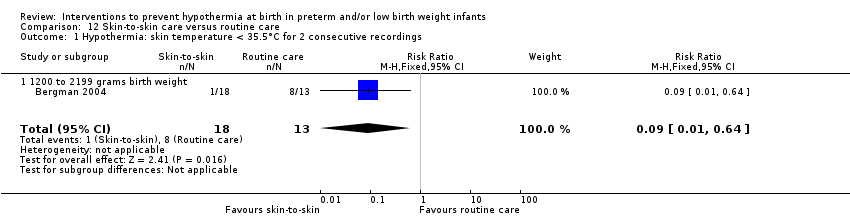
Comparison 12 Skin‐to‐skin care versus routine care, Outcome 1 Hypothermia: skin temperature < 35.5°C for 2 consecutive recordings.
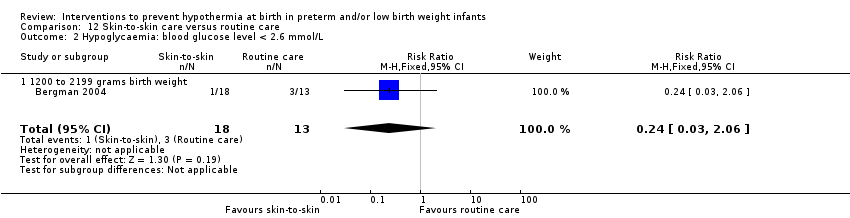
Comparison 12 Skin‐to‐skin care versus routine care, Outcome 2 Hypoglycaemia: blood glucose level < 2.6 mmol/L.

Comparison 13 Thermal mattress versus routine care, Outcome 1 Core body temperature (°C) on admission to NICU or up to 2 hours after birth.
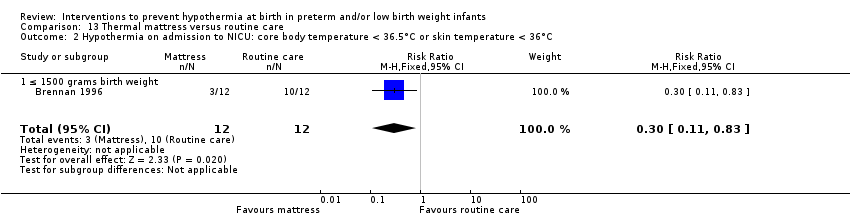
Comparison 13 Thermal mattress versus routine care, Outcome 2 Hypothermia on admission to NICU: core body temperature < 36.5°C or skin temperature < 36°C.

Comparison 13 Thermal mattress versus routine care, Outcome 3 Moderate hypothermia on admission to NICU: core body temperature < 36°C.
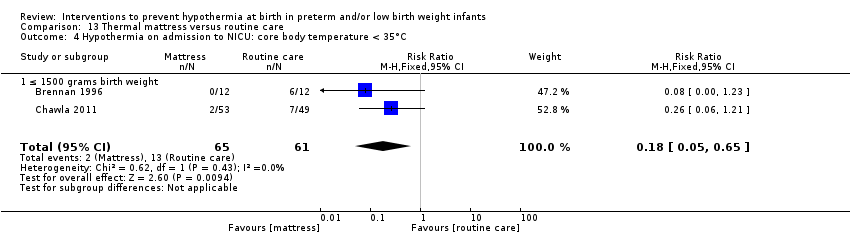
Comparison 13 Thermal mattress versus routine care, Outcome 4 Hypothermia on admission to NICU: core body temperature < 35°C.

Comparison 13 Thermal mattress versus routine care, Outcome 5 Outside normothermic range on admission to NICU or up to 2 hours after birth.

Comparison 13 Thermal mattress versus routine care, Outcome 6 Hyperthermia on admission to NICU: core body temperature > 37.5°C.

Comparison 13 Thermal mattress versus routine care, Outcome 7 Mortality.

Comparison 13 Thermal mattress versus routine care, Outcome 8 Major brain injury ‐ IVH (grade Ⅲ or Ⅳ).

Comparison 13 Thermal mattress versus routine care, Outcome 9 Major brain injury ‐ cystic periventricular leukomalacia.

Comparison 13 Thermal mattress versus routine care, Outcome 10 Bronchopulmonary dysplasia (BPD).
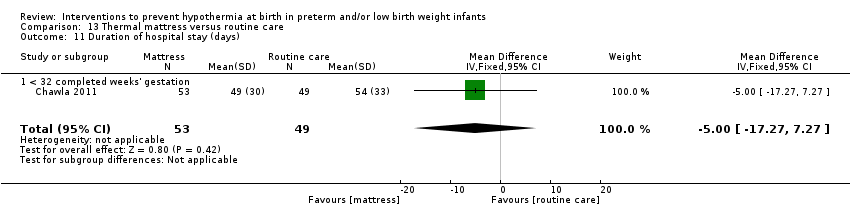
Comparison 13 Thermal mattress versus routine care, Outcome 11 Duration of hospital stay (days).

Comparison 13 Thermal mattress versus routine care, Outcome 12 Duration of ventilation (days).

Comparison 13 Thermal mattress versus routine care, Outcome 13 Duration of oxygen requirements (days).
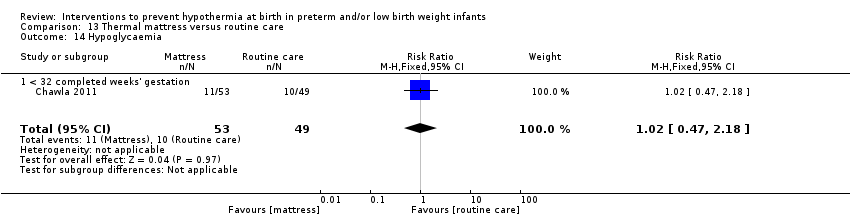
Comparison 13 Thermal mattress versus routine care, Outcome 14 Hypoglycaemia.
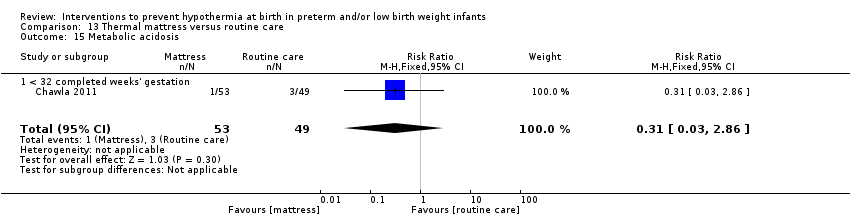
Comparison 13 Thermal mattress versus routine care, Outcome 15 Metabolic acidosis.

Comparison 13 Thermal mattress versus routine care, Outcome 16 Necrotising enterocolitis (NEC).

Comparison 13 Thermal mattress versus routine care, Outcome 17 Sepsis.

Comparison 14 Thermal mattress versus plastic wrap or bag, Outcome 1 Core body temperature (°C) on admission to NICU or up to 2 hours after birth.
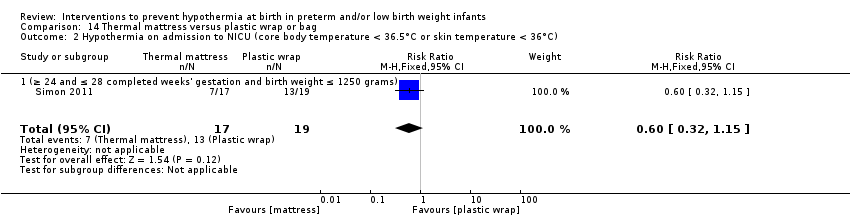
Comparison 14 Thermal mattress versus plastic wrap or bag, Outcome 2 Hypothermia on admission to NICU (core body temperature < 36.5°C or skin temperature < 36°C).

Comparison 14 Thermal mattress versus plastic wrap or bag, Outcome 3 Outside normothermic range on admission to NICU or up to 2 hours after birth.

Comparison 14 Thermal mattress versus plastic wrap or bag, Outcome 4 Hyperthermia on admission to NICU: core body temperature > 37.5°C.
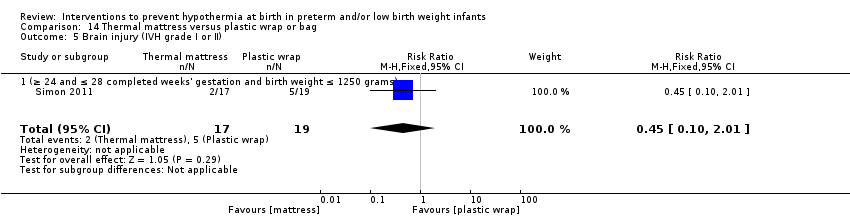
Comparison 14 Thermal mattress versus plastic wrap or bag, Outcome 5 Brain injury (IVH grade Ⅰ or Ⅱ).

Comparison 14 Thermal mattress versus plastic wrap or bag, Outcome 6 Major brain injury (IVH grade Ⅲ or Ⅳ).

Comparison 14 Thermal mattress versus plastic wrap or bag, Outcome 7 Mortality (death before discharge).

Comparison 14 Thermal mattress versus plastic wrap or bag, Outcome 8 Bronchopulmonary dysplasia (BPD).

Comparison 14 Thermal mattress versus plastic wrap or bag, Outcome 9 Hypotension during first 24 hours of life.

Comparison 14 Thermal mattress versus plastic wrap or bag, Outcome 10 Necrotising enterocolitis (NEC).
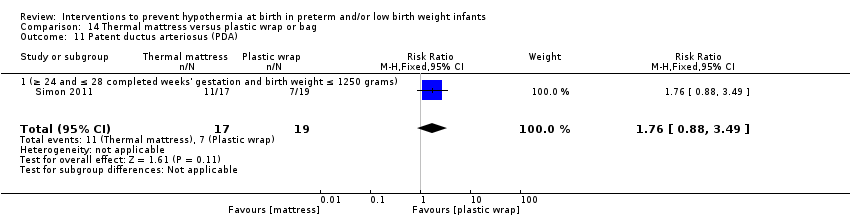
Comparison 14 Thermal mattress versus plastic wrap or bag, Outcome 11 Patent ductus arteriosus (PDA).

Comparison 14 Thermal mattress versus plastic wrap or bag, Outcome 12 PDA ‐ medication only.
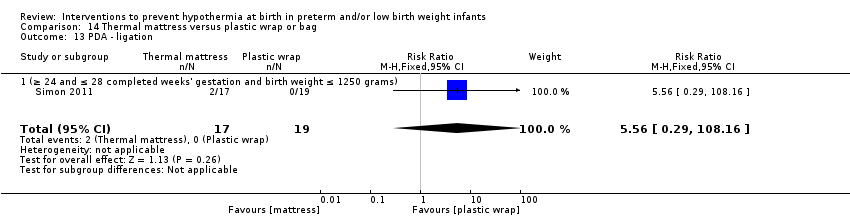
Comparison 14 Thermal mattress versus plastic wrap or bag, Outcome 13 PDA ‐ ligation.
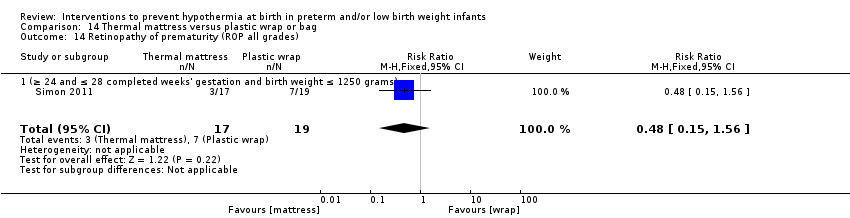
Comparison 14 Thermal mattress versus plastic wrap or bag, Outcome 14 Retinopathy of prematurity (ROP all grades).

Comparison 14 Thermal mattress versus plastic wrap or bag, Outcome 15 Retinopathy of prematurity (ROP laser therapy).

Comparison 14 Thermal mattress versus plastic wrap or bag, Outcome 16 Spontaneous intestinal perforation (SIP).

Comparison 14 Thermal mattress versus plastic wrap or bag, Outcome 17 Worst base deficit in first 24 hours of life.

Comparison 14 Thermal mattress versus plastic wrap or bag, Outcome 18 Worst pH in first 24 hours of life.
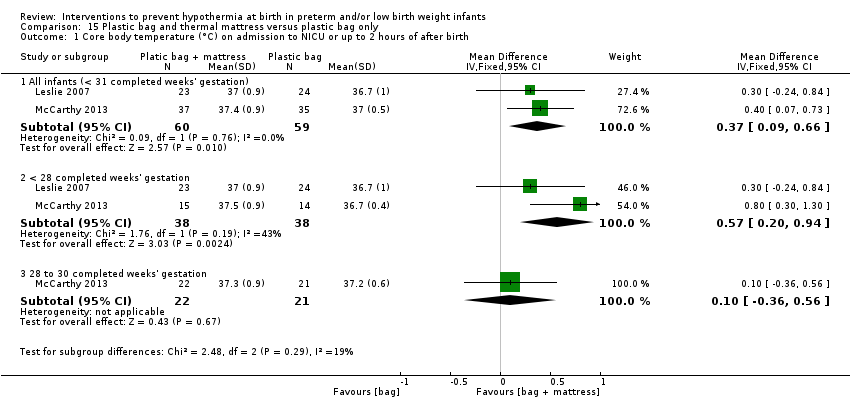
Comparison 15 Plastic bag and thermal mattress versus plastic bag only, Outcome 1 Core body temperature (°C) on admission to NICU or up to 2 hours of after birth.
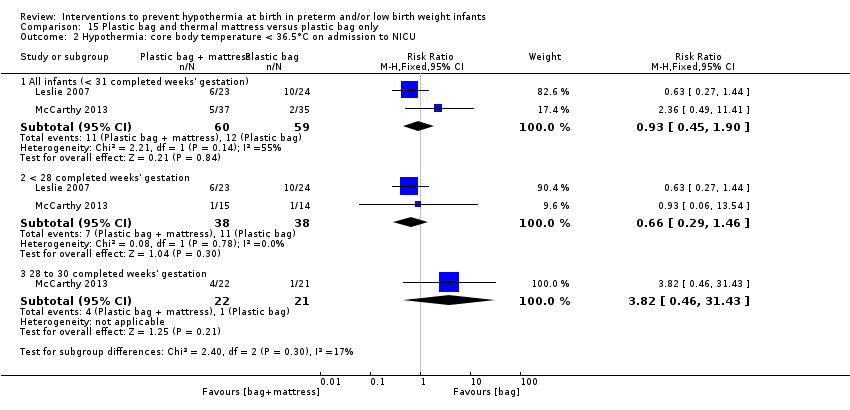
Comparison 15 Plastic bag and thermal mattress versus plastic bag only, Outcome 2 Hypothermia: core body temperature < 36.5°C on admission to NICU.

Comparison 15 Plastic bag and thermal mattress versus plastic bag only, Outcome 3 Outside normothermic range on admission to NICU or up to 2 hours after birth.

Comparison 15 Plastic bag and thermal mattress versus plastic bag only, Outcome 4 Hyperthermia on admission to NICU: core body temperature > 37.5°C.

Comparison 15 Plastic bag and thermal mattress versus plastic bag only, Outcome 5 Major brain injury.

Comparison 15 Plastic bag and thermal mattress versus plastic bag only, Outcome 6 Mortality (death before hospital discharge).
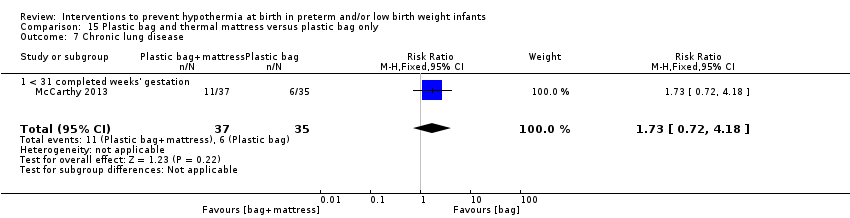
Comparison 15 Plastic bag and thermal mattress versus plastic bag only, Outcome 7 Chronic lung disease.

Comparison 15 Plastic bag and thermal mattress versus plastic bag only, Outcome 8 Coagulation support.

Comparison 15 Plastic bag and thermal mattress versus plastic bag only, Outcome 9 Inotrope use.

Comparison 15 Plastic bag and thermal mattress versus plastic bag only, Outcome 10 Intubated during admission.

Comparison 15 Plastic bag and thermal mattress versus plastic bag only, Outcome 11 ≥ 1 dose surfactant during admission.
| Plastic wrap or bag compared with routine care in preterm and/or low birth weight infants | ||||||
| Patient or population: preterm and/or low birth weight infants | ||||||
| Outcomes | Anticipated absolute effects* (95% CI) | Relative effect | No. of participants | Quality of the evidence | Comments | |
| Risk with routine care | Risk with plastic wrap or bag | |||||
| Core body temperature (°C) on admission to NICU or up to 2 hours after birth | Mean core body temperature (°C) on admission to NICU or up to 2 hours after birth ranged from 34.80 to 36.2. | MD 0.58 higher | ‐ | 1633 | ⊕⊕⊕⊝ | Publication bias was attributed to non‐significant smaller trials. We removed smaller trials with statistical significance, leading to a balanced funnel plot. Conclusions were similar. |
| Hypothermia on admission to NICU: core body temperature < 36.5°C or skin temperature < 36°C | Study population | RR 0.67 | 1417 | ⊕⊕⊕⊝ | Publication bias was attributed to non‐significant smaller trials. We removed smaller trials with statistical significance, leading to a balanced funnel plot. Conclusions were similar. | |
| 738 per 1000 | 495 per 1000 | |||||
| Core body temperature (°C) 1 hour after initial NICU admission temperature was taken | Mean core body temperature (°C) 1 hour after initial NICU admission temperature was taken ranged from 35.70 to 36.78. | MD 0.36 higher | ‐ | 373 | ⊕⊕⊕⊝ | Although heterogeneity was high for subgroup differences, overall effect remained highly significant. |
| Hyperthermia on admission to NICU: core body temperature > 37.5°C | Study population | RR 3.91 | 1523 | ⊕⊕⊕⊝ | ||
| 12 per 1000 | 46 per 1000 | |||||
| Major brain injury (within hospital stay) | Study population | RR 0.78 | 1100 | ⊕⊕⊕⊝ | ||
| 62 per 1000 | 49 per 1000 | |||||
| Pulmonary haemorrhage (within hospital stay) | Study population | RR 0.60 | 796 | ⊕⊕⊕⊝ | ||
| 112 per 1000 | 67 per 1000 | |||||
| Mortality (death within hospital stay or at 6 months' corrected gestation) | Study population | RR 0.91 | 1447 | ⊕⊕⊕⊝ | Publication bias was unlikely to have affected findings of the meta‐analysis. | |
| 168 per 1000 | 153 per 1000 | |||||
| *The risk in the intervention group (and its 95% confidence interval) is based on the assumed risk in the comparison group and the relative effect of the intervention (and its 95% CI). | ||||||
| GRADE Working Group grades of evidence. | ||||||
| aNot downgraded for risk of bias owing to lack of blinding of outcome assessors. We examined one study that had taken measurements over time. The differential between wrap and routine care groups appeared to increase with time, which is not what would be expected if the difference was due to knowledge of assignment groups. bNot downgraded for inconsistency because on removal of smaller studies, the remainder were characteristically very consistent and the effect size remained largely unchanged. cDowngraded one level for publication bias. dDowngraded one level for inconsistency (considerable differences in effect size across studies). eDowngraded one level for imprecision (conclusions were based on 50 incidences of hyperthermia in total ‐ these were sufficient to show significance but with wide 95% CIs). fDowngraded one level for imprecision (numbers of incidences were below OIS guidance). gDowngraded one level for imprecision (evidence came from only one study). hNot downgraded for imprecision (numbers were below OIS guidance, but 95% CIs for RR just attained ± 25% of best estimate). | ||||||
| Outcome or subgroup title | No. of studies | No. of participants | Statistical method | Effect size |
| 1 Core body temperature (°C) on admission to NICU or up to 2 hours after birth Show forest plot | 13 | Mean Difference (IV, Fixed, 95% CI) | Subtotals only | |
| 1.1 All infants (< 37 completed weeks' gestation) | 13 | 1633 | Mean Difference (IV, Fixed, 95% CI) | 0.58 [0.50, 0.66] |
| 1.2 < 28 completed weeks' gestation | 8 | 1171 | Mean Difference (IV, Fixed, 95% CI) | 0.65 [0.52, 0.79] |
| 1.3 ≥ 28 completed weeks' gestation | 4 | 200 | Mean Difference (IV, Fixed, 95% CI) | 0.56 [0.34, 0.78] |
| 2 Hypothermia on admission to NICU: core body temperature < 36.5°C or skin temperature < 36°C Show forest plot | 10 | Risk Ratio (M‐H, Fixed, 95% CI) | Subtotals only | |
| 2.1 All infants (< 37 completed weeks' gestation) | 10 | 1417 | Risk Ratio (M‐H, Fixed, 95% CI) | 0.67 [0.62, 0.72] |
| 2.2 < 28 completed weeks' gestation | 6 | 1029 | Risk Ratio (M‐H, Fixed, 95% CI) | 0.70 [0.65, 0.77] |
| 2.3 ≥ 28 completed weeks' gestation | 2 | 55 | Risk Ratio (M‐H, Fixed, 95% CI) | 0.17 [0.07, 0.43] |
| 3 Outside normothermic range on admission to NICU or up to 2 hours after birth Show forest plot | 5 | Risk Ratio (M‐H, Fixed, 95% CI) | Subtotals only | |
| 3.1 All infants (< 37 completed weeks' gestation) | 5 | 1048 | Risk Ratio (M‐H, Fixed, 95% CI) | 0.75 [0.69, 0.81] |
| 3.2 < 28 completed weeks' gestation | 3 | 871 | Risk Ratio (M‐H, Fixed, 95% CI) | 0.81 [0.75, 0.88] |
| 3.3 ≥ 28 completed weeks' gestation | 1 | 33 | Risk Ratio (M‐H, Fixed, 95% CI) | 0.14 [0.04, 0.52] |
| 4 Core body temperature (°C) at 1 hour after birth Show forest plot | 1 | 60 | Mean Difference (IV, Fixed, 95% CI) | 0.40 [0.19, 0.61] |
| 4.1 All infants (< 37 completed weeks' gestation) | 1 | 60 | Mean Difference (IV, Fixed, 95% CI) | 0.40 [0.19, 0.61] |
| 5 Core body temperature (°C) at 90 minutes after birth Show forest plot | 1 | 60 | Mean Difference (IV, Fixed, 95% CI) | 0.40 [0.18, 0.62] |
| 5.1 All infants (< 37 completed weeks' gestation) | 1 | 60 | Mean Difference (IV, Fixed, 95% CI) | 0.40 [0.18, 0.62] |
| 6 Core body temperature (°C) at 2 hours after birth Show forest plot | 1 | 60 | Mean Difference (IV, Fixed, 95% CI) | 0.30 [0.13, 0.47] |
| 6.1 All infants (< 37 completed weeks' gestation) | 1 | 60 | Mean Difference (IV, Fixed, 95% CI) | 0.30 [0.13, 0.47] |
| 7 Core body temperature (°C) post stabilisation Show forest plot | 2 | Mean Difference (IV, Fixed, 95% CI) | Subtotals only | |
| 7.1 All infants (< 37 completed weeks' gestation) | 2 | 911 | Mean Difference (IV, Fixed, 95% CI) | 0.43 [0.22, 0.64] |
| 7.2 < 28 completed weeks' gestation | 2 | 838 | Mean Difference (IV, Fixed, 95% CI) | 0.44 [0.20, 0.67] |
| 7.3 ≥ 28 completed weeks' gestation | 1 | 73 | Mean Difference (IV, Fixed, 95% CI) | 0.40 [‐0.00, 0.80] |
| 8 Hypothermia post stabilisation: core body temperature < 36.5°C or skin temperature < 36°C Show forest plot | 2 | 841 | Risk Ratio (M‐H, Fixed, 95% CI) | 0.76 [0.65, 0.88] |
| 8.1 All infants (≤ 32 completed weeks' gestation) | 1 | 40 | Risk Ratio (M‐H, Fixed, 95% CI) | 0.05 [0.00, 0.76] |
| 8.2 < 28 completed weeks' gestation | 1 | 801 | Risk Ratio (M‐H, Fixed, 95% CI) | 0.79 [0.69, 0.92] |
| 9 Outside normothermic range post stabilisation Show forest plot | 2 | 841 | Risk Ratio (M‐H, Fixed, 95% CI) | 0.88 [0.78, 1.00] |
| 9.1 All infants (≤ 32 completed weeks' gestation) | 1 | 40 | Risk Ratio (M‐H, Fixed, 95% CI) | 0.1 [0.01, 0.71] |
| 9.2 < 28 completed weeks' gestation | 1 | 801 | Risk Ratio (M‐H, Fixed, 95% CI) | 0.92 [0.81, 1.04] |
| 10 Core body temperature (°C) 30 minutes after initial NICU admission temperature was taken Show forest plot | 1 | 92 | Mean Difference (IV, Fixed, 95% CI) | 0.57 [0.27, 0.87] |
| 10.1 ≤ 29 completed weeks' gestation | 1 | 92 | Mean Difference (IV, Fixed, 95% CI) | 0.57 [0.27, 0.87] |
| 11 Core body temperature (°C) 1 hour after initial NICU admission temperature was taken Show forest plot | 6 | Mean Difference (IV, Fixed, 95% CI) | Subtotals only | |
| 11.1 All infants (< 37 completed weeks' gestation) | 6 | 373 | Mean Difference (IV, Fixed, 95% CI) | 0.36 [0.25, 0.47] |
| 11.2 < 28 completed weeks' gestation | 4 | 227 | Mean Difference (IV, Fixed, 95% CI) | 0.49 [0.33, 0.66] |
| 11.3 ≥ 28 completed weeks' gestation | 2 | 86 | Mean Difference (IV, Fixed, 95% CI) | 0.72 [0.48, 0.96] |
| 12 Core body temperature (°C) 90 minutes after initial NICU admission temperature was taken Show forest plot | 1 | 92 | Mean Difference (IV, Fixed, 95% CI) | 0.56 [0.27, 0.85] |
| 12.1 ≤ 29 completed weeks' gestation | 1 | 92 | Mean Difference (IV, Fixed, 95% CI) | 0.56 [0.27, 0.85] |
| 13 Core body temperature (°C) 2 hours after initial NICU admission temperature was taken Show forest plot | 2 | 156 | Mean Difference (IV, Fixed, 95% CI) | 0.37 [0.16, 0.59] |
| 13.1 < 28 completed weeks' gestation | 1 | 92 | Mean Difference (IV, Fixed, 95% CI) | 0.28 [0.04, 0.52] |
| 13.2 ≥ 28 completed weeks' gestation | 1 | 64 | Mean Difference (IV, Fixed, 95% CI) | 0.74 [0.26, 1.22] |
| 14 Hyperthermia on admission to NICU: core body temperature > 37.5°C Show forest plot | 12 | Risk Ratio (M‐H, Fixed, 95% CI) | Subtotals only | |
| 14.1 All infants (< 37 completed weeks' gestation) | 12 | 1523 | Risk Ratio (M‐H, Fixed, 95% CI) | 3.91 [2.05, 7.44] |
| 14.2 < 28 completed weeks' gestation | 7 | 1121 | Risk Ratio (M‐H, Fixed, 95% CI) | 4.00 [2.04, 7.83] |
| 14.3 ≥ 28 completed weeks' gestation | 3 | 138 | Risk Ratio (M‐H, Fixed, 95% CI) | 0.0 [0.0, 0.0] |
| 15 Hyperthermia post stabilisation: core body temperature ≥ 37.5°C Show forest plot | 1 | 801 | Risk Ratio (M‐H, Fixed, 95% CI) | 2.35 [1.38, 4.00] |
| 15.1 ≥ 24 and < 28 completed weeks' gestation | 1 | 801 | Risk Ratio (M‐H, Fixed, 95% CI) | 2.35 [1.38, 4.00] |
| 16 Major brain injury Show forest plot | 5 | 1100 | Risk Ratio (M‐H, Fixed, 95% CI) | 0.78 [0.47, 1.27] |
| 16.1 All infants (≤ 33 completed weeks' gestation) | 1 | 110 | Risk Ratio (M‐H, Fixed, 95% CI) | 0.3 [0.03, 2.60] |
| 16.2 < 28 completed weeks' gestation | 4 | 990 | Risk Ratio (M‐H, Fixed, 95% CI) | 0.83 [0.50, 1.39] |
| 17 Intraventicular haemorrhage (all grades) Show forest plot | 3 | 880 | Risk Ratio (M‐H, Fixed, 95% CI) | 0.92 [0.77, 1.09] |
| 17.1 < 28 completed weeks' gestation | 3 | 880 | Risk Ratio (M‐H, Fixed, 95% CI) | 0.92 [0.77, 1.09] |
| 18 Intraventricular haemorrhage (grades III and IV) Show forest plot | 1 | 753 | Risk Ratio (M‐H, Fixed, 95% CI) | 0.99 [0.67, 1.46] |
| 18.1 ≥ 24 and < 28 completed weeks' gestation | 1 | 753 | Risk Ratio (M‐H, Fixed, 95% CI) | 0.99 [0.67, 1.46] |
| 19 Mortality (death within hospital stay or at 6 months' corrected gestation) Show forest plot | 10 | Risk Ratio (M‐H, Fixed, 95% CI) | Subtotals only | |
| 19.1 All infants (< 37 weeks' gestation) | 10 | 1447 | Risk Ratio (M‐H, Fixed, 95% CI) | 0.91 [0.73, 1.15] |
| 19.2 < 28 completed weeks' gestation | 6 | 1114 | Risk Ratio (M‐H, Fixed, 95% CI) | 0.92 [0.72, 1.18] |
| 19.3 ≥ 28 completed weeks' gestation | 1 | 41 | Risk Ratio (M‐H, Fixed, 95% CI) | 0.0 [0.0, 0.0] |
| 20 Arterial oxygen saturation (percentage) Show forest plot | 1 | 40 | Mean Difference (IV, Fixed, 95% CI) | ‐4.10 [‐14.00, 7.80] |
| 20.1 ≤ 32 completed weeks' gestation | 1 | 40 | Mean Difference (IV, Fixed, 95% CI) | ‐4.10 [‐14.00, 7.80] |
| 21 Bicarbonate (mmol/L) Show forest plot | 2 | 117 | Mean Difference (IV, Fixed, 95% CI) | 0.31 [‐0.72, 1.35] |
| 21.1 < 28 completed weeks' gestation | 2 | 117 | Mean Difference (IV, Fixed, 95% CI) | 0.31 [‐0.72, 1.35] |
| 22 Blood gas pH (first) Show forest plot | 2 | 117 | Mean Difference (IV, Fixed, 95% CI) | 0.01 [‐0.02, 0.04] |
| 22.1 < 28 completed weeks' gestation | 2 | 117 | Mean Difference (IV, Fixed, 95% CI) | 0.01 [‐0.02, 0.04] |
| 23 Blood gas pH < 7.25 Show forest plot | 1 | 84 | Risk Ratio (M‐H, Fixed, 95% CI) | 0.81 [0.55, 1.20] |
| 23.1 ≤ 29 completed weeks' gestation | 1 | 84 | Risk Ratio (M‐H, Fixed, 95% CI) | 0.81 [0.55, 1.20] |
| 24 Blood glucose concentration (mmol/L) (first) Show forest plot | 4 | 195 | Mean Difference (IV, Fixed, 95% CI) | ‐0.14 [‐0.50, 0.21] |
| 24.1 All infants (≤ 32 completed weeks' gestation) | 2 | 78 | Mean Difference (IV, Fixed, 95% CI) | ‐0.62 [‐1.37, 0.12] |
| 24.2 < 28 completed weeks' gestation | 2 | 117 | Mean Difference (IV, Fixed, 95% CI) | ‐0.00 [‐0.41, 0.41] |
| 25 Blood glucose < 2.6 mmol/L Show forest plot | 1 | 85 | Risk Ratio (M‐H, Fixed, 95% CI) | 0.66 [0.31, 1.43] |
| 25.1 ≤ 29 completed weeks' gestation | 1 | 85 | Risk Ratio (M‐H, Fixed, 95% CI) | 0.66 [0.31, 1.43] |
| 26 Blood glucose > 6 mmol/L Show forest plot | 1 | 85 | Risk Ratio (M‐H, Fixed, 95% CI) | 1.07 [0.23, 5.02] |
| 26.1 ≤ 29 completed weeks' gestation | 1 | 85 | Risk Ratio (M‐H, Fixed, 95% CI) | 1.07 [0.23, 5.02] |
| 27 Blood glucose concentration mmol/L at 120 minutes after birth Show forest plot | Other data | No numeric data | ||
| 27.1 All infants (< 37 completed weeks' gestation) | Other data | No numeric data | ||
| 28 Bronchopulmonary dysplasia (BPD) Show forest plot | 1 | 702 | Risk Ratio (M‐H, Fixed, 95% CI) | 0.99 [0.86, 1.15] |
| 28.1 ≥ 24 and < 28 completed weeks' gestation | 1 | 702 | Risk Ratio (M‐H, Fixed, 95% CI) | 0.99 [0.86, 1.15] |
| 29 BPD steroids Show forest plot | 1 | 796 | Risk Ratio (M‐H, Fixed, 95% CI) | 0.94 [0.71, 1.25] |
| 29.1 ≥ 24 and < 28 completed weeks' gestation | 1 | 796 | Risk Ratio (M‐H, Fixed, 95% CI) | 0.94 [0.71, 1.25] |
| 30 Duration of hospitalisation (days) Show forest plot | 2 | 126 | Mean Difference (IV, Fixed, 95% CI) | ‐6.35 [‐17.27, 4.56] |
| 30.1 All infants (≤ 32 completed weeks' gestation) | 1 | 38 | Mean Difference (IV, Fixed, 95% CI) | ‐7.50 [‐24.17, 9.17] |
| 30.2 < 28 completed weeks' gestation | 1 | 88 | Mean Difference (IV, Fixed, 95% CI) | ‐5.49 [‐19.93, 8.95] |
| 31 Duration of hospitalisation (days) Show forest plot | Other data | No numeric data | ||
| 32 Duration of continuous positive airway pressure (CPAP) (days) Show forest plot | Other data | No numeric data | ||
| 33 Duration of oxygen therapy (days) Show forest plot | 1 | 88 | Mean Difference (IV, Fixed, 95% CI) | ‐6.51 [‐23.30, 10.28] |
| 33.1 < 29 completed weeks' gestation | 1 | 88 | Mean Difference (IV, Fixed, 95% CI) | ‐6.51 [‐23.30, 10.28] |
| 34 Duration of ventilation (days) Show forest plot | Other data | No numeric data | ||
| 35 Gastrointestinal perforation Show forest plot | 1 | 795 | Risk Ratio (M‐H, Fixed, 95% CI) | 1.25 [0.68, 2.28] |
| 35.1 ≥ 24 and < 28 completed weeks' gestation | 1 | 795 | Risk Ratio (M‐H, Fixed, 95% CI) | 1.25 [0.68, 2.28] |
| 36 Intubation in delivery room Show forest plot | 1 | 64 | Risk Ratio (M‐H, Fixed, 95% CI) | 1.0 [0.63, 1.58] |
| 36.1 < 29 completed weeks' gestation | 1 | 64 | Risk Ratio (M‐H, Fixed, 95% CI) | 1.0 [0.63, 1.58] |
| 37 Necrotising enterocolitis (NEC) Show forest plot | 2 | 907 | Risk Ratio (M‐H, Fixed, 95% CI) | 1.01 [0.65, 1.58] |
| 37.1 All infants ( ≥ 24 and ≤ 33 completed weeks' gestation) | 1 | 110 | Risk Ratio (M‐H, Fixed, 95% CI) | 5.98 [0.29, 121.75] |
| 37.2 ≥ 24 and < 28 completed weeks' gestation | 1 | 797 | Risk Ratio (M‐H, Fixed, 95% CI) | 0.95 [0.60, 1.49] |
| 38 Patent ductus arteriosus (PDA) Show forest plot | 2 | 905 | Risk Ratio (M‐H, Fixed, 95% CI) | 0.90 [0.78, 1.03] |
| 38.1 All infants (≥ 24 and ≤ 33 completed weeks' gestation) | 1 | 110 | Risk Ratio (M‐H, Fixed, 95% CI) | 0.8 [0.39, 1.62] |
| 38.2 ≥ 24 and < 28 completed weeks' gestation | 1 | 795 | Risk Ratio (M‐H, Fixed, 95% CI) | 0.90 [0.79, 1.04] |
| 39 Pneumothorax Show forest plot | 1 | 796 | Risk Ratio (M‐H, Fixed, 95% CI) | 0.98 [0.56, 1.69] |
| 39.1 ≥ 24 and < 28 completed weeks' gestation | 1 | 796 | Risk Ratio (M‐H, Fixed, 95% CI) | 0.98 [0.56, 1.69] |
| 40 Pulmonary haemorrhage Show forest plot | 1 | 796 | Risk Ratio (M‐H, Fixed, 95% CI) | 0.60 [0.38, 0.95] |
| 40.1 ≥ 24 and < 28 completed weeks' gestation | 1 | 796 | Risk Ratio (M‐H, Fixed, 95% CI) | 0.60 [0.38, 0.95] |
| 41 Requirement for bubble continuous positive airway pressure (BCPAP) Show forest plot | 1 | 92 | Risk Ratio (M‐H, Fixed, 95% CI) | 0.97 [0.81, 1.18] |
| 41.1 ≤ 29 completed weeks' gestation | 1 | 92 | Risk Ratio (M‐H, Fixed, 95% CI) | 0.97 [0.81, 1.18] |
| 42 Requirement for ventilation Show forest plot | 1 | 92 | Risk Ratio (M‐H, Fixed, 95% CI) | 0.92 [0.70, 1.20] |
| 42.1 ≤ 29 completed weeks' gestation | 1 | 92 | Risk Ratio (M‐H, Fixed, 95% CI) | 0.92 [0.70, 1.20] |
| 43 Respiratory distress syndrome (RDS) Show forest plot | 2 | 910 | Risk Ratio (M‐H, Fixed, 95% CI) | 1.01 [0.97, 1.06] |
| 43.1 All infants (≥ 24 and ≤ 33 completed weeks' gestation) | 1 | 110 | Risk Ratio (M‐H, Fixed, 95% CI) | 1.04 [0.78, 1.38] |
| 43.2 ≥ 24 and < 28 completed weeks' gestation | 1 | 800 | Risk Ratio (M‐H, Fixed, 95% CI) | 1.01 [0.97, 1.05] |
| 44 Retinopathy of prematurity (ROP) Show forest plot | 1 | 606 | Risk Ratio (M‐H, Fixed, 95% CI) | 1.00 [0.72, 1.40] |
| 44.1 ≥ 24 and < 28 completed weeks' gestation | 1 | 606 | Risk Ratio (M‐H, Fixed, 95% CI) | 1.00 [0.72, 1.40] |
| 45 Sepsis (late) Show forest plot | 2 | 830 | Risk Ratio (M‐H, Fixed, 95% CI) | 0.88 [0.70, 1.10] |
| 45.1 ≤ 29 completed weeks' gestation | 2 | 830 | Risk Ratio (M‐H, Fixed, 95% CI) | 0.88 [0.70, 1.10] |
| 46 Sepsis (early) Show forest plot | 2 | 883 | Risk Ratio (M‐H, Fixed, 95% CI) | 0.69 [0.38, 1.29] |
| 46.1 ≤ 29 completed weeks' gestation | 2 | 883 | Risk Ratio (M‐H, Fixed, 95% CI) | 0.69 [0.38, 1.29] |
| Outcome or subgroup title | No. of studies | No. of participants | Statistical method | Effect size |
| 1 Core body temperature (°C) on admission to NICU or up to 2 hours after birth Show forest plot | 1 | 96 | Mean Difference (IV, Fixed, 95% CI) | 0.70 [0.32, 1.08] |
| 1.1 < 37 completed weeks' gestation and ≤ 2500 grams birth weight | 1 | 96 | Mean Difference (IV, Fixed, 95% CI) | 0.70 [0.32, 1.08] |
| 2 Hypothermia on admission to NICU: core body temperature < 36.5°C or skin temperature < 36°C Show forest plot | 1 | 96 | Risk Ratio (M‐H, Fixed, 95% CI) | 0.48 [0.27, 0.84] |
| 2.1 < 37 completed weeks' gestation and ≤ 2500 grams birth weight | 1 | 96 | Risk Ratio (M‐H, Fixed, 95% CI) | 0.48 [0.27, 0.84] |
| 3 Decrease in temperature (axillary °C) from baseline before transport to NICU admission Show forest plot | 1 | 96 | Mean Difference (IV, Fixed, 95% CI) | ‐0.40 [‐0.61, ‐0.19] |
| 3.1 < 37 completed weeks' gestation and ≤ 2500 grams birth weight | 1 | 96 | Mean Difference (IV, Fixed, 95% CI) | ‐0.40 [‐0.61, ‐0.19] |
| 4 Hyperthermia on admission to NICU: core body temperature > 37.5°C Show forest plot | 1 | 96 | Risk Ratio (M‐H, Fixed, 95% CI) | 2.88 [0.12, 68.98] |
| 4.1 < 37 completed weeks' gestation and ≤ 2500 grams birth weight | 1 | 96 | Risk Ratio (M‐H, Fixed, 95% CI) | 2.88 [0.12, 68.98] |
| 5 Base excess Show forest plot | 1 | 96 | Mean Difference (IV, Fixed, 95% CI) | 0.60 [‐0.49, 1.69] |
| 5.1 < 37 completed weeks' gestation and ≤ 2500 grams birth weight | 1 | 96 | Mean Difference (IV, Fixed, 95% CI) | 0.60 [‐0.49, 1.69] |
| 6 Blood gas pH Show forest plot | 1 | 96 | Mean Difference (IV, Fixed, 95% CI) | 0.0 [‐0.02, 0.02] |
| 6.1 < 37 completed weeks' gestation and ≤ 2500 grams birth weight | 1 | 96 | Mean Difference (IV, Fixed, 95% CI) | 0.0 [‐0.02, 0.02] |
| 7 Duration of oxygen therapy (days) Show forest plot | 1 | 96 | Mean Difference (IV, Fixed, 95% CI) | ‐2.39 [‐8.27, 3.49] |
| 7.1 < 37 completed weeks' gestation and ≤ 2500 grams birth weight | 1 | 96 | Mean Difference (IV, Fixed, 95% CI) | ‐2.39 [‐8.27, 3.49] |
| 8 Hemo glucose test Show forest plot | 1 | 96 | Mean Difference (IV, Fixed, 95% CI) | 7.20 [‐2.03, 16.43] |
| 8.1 < 37 completed weeks' gestation and ≤ 2500 grams birth weight | 1 | 96 | Mean Difference (IV, Fixed, 95% CI) | 7.20 [‐2.03, 16.43] |
| 9 Hypoglycaemia (blood glucose level < 40 mg/dL within 2 hours of birth) Show forest plot | 1 | 96 | Risk Ratio (M‐H, Fixed, 95% CI) | 0.55 [0.31, 0.98] |
| 9.1 < 37 completed weeks' gestation and ≤ 2500 grams birth weight | 1 | 96 | Risk Ratio (M‐H, Fixed, 95% CI) | 0.55 [0.31, 0.98] |
| 10 Severe metabolic acidosis Show forest plot | 1 | 96 | Risk Ratio (M‐H, Fixed, 95% CI) | 1.15 [0.38, 3.52] |
| 10.1 < 37 completed weeks' gestation and ≤ 2500 grams birth weight | 1 | 96 | Risk Ratio (M‐H, Fixed, 95% CI) | 1.15 [0.38, 3.52] |
| Outcome or subgroup title | No. of studies | No. of participants | Statistical method | Effect size |
| 1 Core body temperature (°C) 30 minutes after birth Show forest plot | 1 | 60 | Mean Difference (IV, Fixed, 95% CI) | 0.30 [0.12, 0.48] |
| 1.1 (≥ 28 and < 37 completed weeks' gestation) + (birth weight ≥ 1000 grams and ≤ 2499 grams) | 1 | 60 | Mean Difference (IV, Fixed, 95% CI) | 0.30 [0.12, 0.48] |
| 2 Core body temperature (°C) 1 hour after birth Show forest plot | 1 | 60 | Mean Difference (IV, Fixed, 95% CI) | 0.30 [0.11, 0.49] |
| 2.1 (≥ 28 and < 37 completed weeks' gestation) + (birth weight ≥ 1000 grams and ≤ 2499 grams) | 1 | 60 | Mean Difference (IV, Fixed, 95% CI) | 0.30 [0.11, 0.49] |
| 3 Core body temperature (°C) 90 minutes after birth Show forest plot | 1 | 60 | Mean Difference (IV, Fixed, 95% CI) | 0.30 [0.12, 0.48] |
| 3.1 (≥ 28 and < 37 completed weeks' gestation) + (birth weight ≥ 1000 grams and ≤ 2499 grams) | 1 | 60 | Mean Difference (IV, Fixed, 95% CI) | 0.30 [0.12, 0.48] |
| 4 Core body temperature (°C) 2 hours after birth Show forest plot | 1 | 60 | Mean Difference (IV, Fixed, 95% CI) | 0.40 [0.24, 0.56] |
| 4.1 (≥ 28 and < 37 completed weeks' gestation) + (birth weight ≥ 1000 grams and ≤ 2499 grams) | 1 | 60 | Mean Difference (IV, Fixed, 95% CI) | 0.40 [0.24, 0.56] |
| 5 Hypothermia Show forest plot | 1 | 60 | Risk Ratio (M‐H, Fixed, 95% CI) | 0.09 [0.01, 1.57] |
| 5.1 (≥ 28 and < 37 completed weeks' gestation) + (birth weight ≥ 1000 grams and ≤ 2499 grams) | 1 | 60 | Risk Ratio (M‐H, Fixed, 95% CI) | 0.09 [0.01, 1.57] |
| 6 Glucose concentration (mmol/L) at 120 minutes after birth Show forest plot | Other data | No numeric data | ||
| 6.1 (≥ 28 and < 37 completed weeks' gestation) + (birth weight ≥ 1000 grams and ≤ 2499 grams) | Other data | No numeric data | ||
| Outcome or subgroup title | No. of studies | No. of participants | Statistical method | Effect size |
| 1 Core body temperature (°C) on admission to NICU or up to 2 hours after birth Show forest plot | 1 | 64 | Mean Difference (IV, Fixed, 95% CI) | 0.80 [0.41, 1.19] |
| 1.1 < 29 completed weeks' gestation | 1 | 64 | Mean Difference (IV, Fixed, 95% CI) | 0.80 [0.41, 1.19] |
| 2 Hypothermia on admission to NICU: core body temperature < 36.4°C Show forest plot | 1 | 64 | Risk Ratio (M‐H, Fixed, 95% CI) | 0.48 [0.32, 0.73] |
| 2.1 < 29 completed weeks' gestation | 1 | 64 | Risk Ratio (M‐H, Fixed, 95% CI) | 0.48 [0.32, 0.73] |
| 3 Outside normothermic range on admission to NICU or up to 2 hours after birth Show forest plot | 1 | 64 | Risk Ratio (M‐H, Fixed, 95% CI) | 0.48 [0.32, 0.73] |
| 3.1 < 29 completed weeks' gestation | 1 | 64 | Risk Ratio (M‐H, Fixed, 95% CI) | 0.48 [0.32, 0.73] |
| 4 Core body temperature (°C) 1 hour after initial NICU admission temperature was taken Show forest plot | 1 | 64 | Mean Difference (IV, Fixed, 95% CI) | 0.80 [0.46, 1.14] |
| 4.1 < 29 completed weeks' gestation | 1 | 64 | Mean Difference (IV, Fixed, 95% CI) | 0.80 [0.46, 1.14] |
| 5 Major brain injury Show forest plot | 1 | 64 | Risk Ratio (M‐H, Fixed, 95% CI) | 1.5 [0.27, 8.38] |
| 5.1 < 29 completed weeks' gestation | 1 | 64 | Risk Ratio (M‐H, Fixed, 95% CI) | 1.5 [0.27, 8.38] |
| 6 Mortality (death within hospital stay) Show forest plot | 1 | 64 | Risk Ratio (M‐H, Fixed, 95% CI) | 1.5 [0.27, 8.38] |
| 6.1 < 29 completed weeks' gestation | 1 | 64 | Risk Ratio (M‐H, Fixed, 95% CI) | 1.5 [0.27, 8.38] |
| 7 Bicarbonate (mmol/L) Show forest plot | 1 | 64 | Mean Difference (IV, Fixed, 95% CI) | 1.0 [‐0.25, 2.25] |
| 7.1 < 29 completed weeks' gestation | 1 | 64 | Mean Difference (IV, Fixed, 95% CI) | 1.0 [‐0.25, 2.25] |
| 8 Blood gas pH (first) Show forest plot | 1 | 64 | Mean Difference (IV, Fixed, 95% CI) | 0.01 [‐0.03, 0.05] |
| 8.1 < 29 completed weeks' gestation | 1 | 64 | Mean Difference (IV, Fixed, 95% CI) | 0.01 [‐0.03, 0.05] |
| 9 First serum glucose concentration (mmol/L) on admission to NICU Show forest plot | 1 | 64 | Mean Difference (IV, Fixed, 95% CI) | 0.10 [‐0.42, 0.62] |
| 9.1 < 29 completed weeks' gestation | 1 | 64 | Mean Difference (IV, Fixed, 95% CI) | 0.10 [‐0.42, 0.62] |
| 10 Intubation at birth Show forest plot | 1 | 64 | Risk Ratio (M‐H, Fixed, 95% CI) | 0.82 [0.49, 1.37] |
| 10.1 < 29 completed weeks' gestation | 1 | 64 | Risk Ratio (M‐H, Fixed, 95% CI) | 0.82 [0.49, 1.37] |
| Outcome or subgroup title | No. of studies | No. of participants | Statistical method | Effect size |
| 1 Core body temperature (°C) on admission to NICU or up to 2 hours after birth Show forest plot | 2 | 122 | Mean Difference (IV, Fixed, 95% CI) | 0.32 [0.15, 0.50] |
| 1.1 All infants (< 37 completed weeks' gestation) | 2 | 122 | Mean Difference (IV, Fixed, 95% CI) | 0.32 [0.15, 0.50] |
| 2 Core body temperature (°C) at 10th minute of life Show forest plot | 1 | 58 | Mean Difference (IV, Fixed, 95% CI) | ‐0.27 [‐0.55, 0.01] |
| 2.1 All infants (< 37 completed weeks' gestation) | 1 | 58 | Mean Difference (IV, Fixed, 95% CI) | ‐0.27 [‐0.55, 0.01] |
| 3 Core body temperature (°C) at 15th minute of life Show forest plot | 1 | 58 | Mean Difference (IV, Fixed, 95% CI) | ‐0.26 [‐0.56, 0.05] |
| 3.1 All infants (< 37 completed weeks' gestation) | 1 | 58 | Mean Difference (IV, Fixed, 95% CI) | ‐0.26 [‐0.56, 0.05] |
| 4 Core body temperature (°C) at 30th minute of life Show forest plot | 1 | 58 | Mean Difference (IV, Fixed, 95% CI) | 0.06 [‐0.23, 0.35] |
| 4.1 All infants (< 37 completed weeks' gestation) | 1 | 58 | Mean Difference (IV, Fixed, 95% CI) | 0.06 [‐0.23, 0.35] |
| 5 Core body temperature (°C) at 1 hour of life Show forest plot | 1 | 58 | Mean Difference (IV, Fixed, 95% CI) | ‐0.02 [‐0.32, 0.27] |
| 5.1 All infants (< 37 completed weeks' gestation) | 1 | 58 | Mean Difference (IV, Fixed, 95% CI) | ‐0.02 [‐0.32, 0.27] |
| 6 Core body temperature (°C) 1 hour after initial NICU admission temperature was taken Show forest plot | 1 | 64 | Mean Difference (IV, Fixed, 95% CI) | 0.83 [0.37, 1.29] |
| 6.1 ≥ 28 and ≤ 32 completed weeks' gestation | 1 | 64 | Mean Difference (IV, Fixed, 95% CI) | 0.83 [0.37, 1.29] |
| 7 Core body temperature (°C) 2 hours after initial NICU admission temperature was taken Show forest plot | 1 | 64 | Mean Difference (IV, Fixed, 95% CI) | 1.11 [0.65, 1.57] |
| 7.1 ≥ 28 and ≤ 32 completed weeks' gestation | 1 | 64 | Mean Difference (IV, Fixed, 95% CI) | 1.11 [0.65, 1.57] |
| 8 Hyperthermia: core body temperature > 37.0°C Show forest plot | 2 | 122 | Risk Ratio (M‐H, Fixed, 95% CI) | 0.18 [0.02, 1.39] |
| 8.1 All infants (< 37 completed weeks' gestation) | 2 | 122 | Risk Ratio (M‐H, Fixed, 95% CI) | 0.18 [0.02, 1.39] |
| 9 Hyponatraemia (serum sodium concentration < 130 mmol/L) Show forest plot | 1 | 58 | Risk Ratio (M‐H, Fixed, 95% CI) | 1.43 [0.35, 5.83] |
| 9.1 All infants (< 37 completed weeks' gestation) | 1 | 58 | Risk Ratio (M‐H, Fixed, 95% CI) | 1.43 [0.35, 5.83] |
| 10 Weight (grams) at fifth day of life Show forest plot | 1 | 58 | Mean Difference (IV, Fixed, 95% CI) | ‐74.20 [‐301.63, 153.23] |
| 10.1 All infants (< 37 completed weeks' gestation) | 1 | 58 | Mean Difference (IV, Fixed, 95% CI) | ‐74.20 [‐301.63, 153.23] |
| Outcome or subgroup title | No. of studies | No. of participants | Statistical method | Effect size |
| 1 Core body temperature (°C) 30 minutes after birth Show forest plot | 1 | 60 | Mean Difference (IV, Fixed, 95% CI) | 0.0 [‐0.17, 0.17] |
| 1.1 (≥ 28 and < 37 completed weeks' gestation) + (birth weight ≥ 1000 grams and ≤ 2499 grams) | 1 | 60 | Mean Difference (IV, Fixed, 95% CI) | 0.0 [‐0.17, 0.17] |
| 2 Core body temperature (°C) 1 hour after birth Show forest plot | 1 | 60 | Mean Difference (IV, Fixed, 95% CI) | ‐0.10 [‐0.28, 0.08] |
| 2.1 (≥ 28 and < 37 completed weeks' gestation) + (birth weight ≥ 1000 grams and ≤ 2499 grams) | 1 | 60 | Mean Difference (IV, Fixed, 95% CI) | ‐0.10 [‐0.28, 0.08] |
| 3 Core body temperature (°C) 90 minutes after birth Show forest plot | 1 | 60 | Mean Difference (IV, Fixed, 95% CI) | ‐0.10 [‐0.29, 0.09] |
| 3.1 (≥ 28 and < 37 completed weeks' gestation) + (birth weight ≥ 1000 grams and ≤ 2499 grams) | 1 | 60 | Mean Difference (IV, Fixed, 95% CI) | ‐0.10 [‐0.29, 0.09] |
| 4 Core body temperature (°C) 2 hours after birth Show forest plot | 1 | 60 | Mean Difference (IV, Fixed, 95% CI) | 0.10 [‐0.04, 0.24] |
| 4.1 (≥ 28 and < 37 completed weeks' gestation) + (birth weight ≥ 1000 grams and ≤ 2499 grams) | 1 | 60 | Mean Difference (IV, Fixed, 95% CI) | 0.10 [‐0.04, 0.24] |
| 5 Hyperthermia Show forest plot | 1 | 60 | Risk Ratio (M‐H, Fixed, 95% CI) | 0.33 [0.01, 7.87] |
| 5.1 (≥ 28 and < 37 completed weeks' gestation) + (birth weight ≥ 1000 grams and ≤ 2499 grams) | 1 | 60 | Risk Ratio (M‐H, Fixed, 95% CI) | 0.33 [0.01, 7.87] |
| 6 Glucose concentration (mmol/L) at 2 hours after birth Show forest plot | Other data | No numeric data | ||
| 6.1 (≥ 28 and < 37 completed weeks' gestation) + (birth weight ≥ 1000 grams and ≤ 2499 grams) | Other data | No numeric data | ||
| Outcome or subgroup title | No. of studies | No. of participants | Statistical method | Effect size |
| 1 Core body temperature (°C) on admission to NICU or up to 2 hours after birth Show forest plot | 1 | 64 | Mean Difference (IV, Fixed, 95% CI) | 0.30 [‐0.12, 0.72] |
| 1.1 < 29 completed weeks' gestation | 1 | 64 | Mean Difference (IV, Fixed, 95% CI) | 0.30 [‐0.12, 0.72] |
| 2 Hypothermia on admission to NICU: core body temperature < 36.4°C Show forest plot | 1 | 64 | Risk Ratio (M‐H, Fixed, 95% CI) | 0.7 [0.43, 1.13] |
| 2.1 < 29 completed weeks' gestation | 1 | 64 | Risk Ratio (M‐H, Fixed, 95% CI) | 0.7 [0.43, 1.13] |
| 3 Outside normothermic range on admission to NICU or up to 2 hours after birth Show forest plot | 1 | 64 | Risk Ratio (M‐H, Fixed, 95% CI) | 0.64 [0.40, 1.01] |
| 3.1 < 29 completed weeks' gestation | 1 | 64 | Risk Ratio (M‐H, Fixed, 95% CI) | 0.64 [0.40, 1.01] |
| 4 Core body temperature (°C) 1 hour after initial temperature on admission to NICU taken Show forest plot | 1 | 64 | Mean Difference (IV, Fixed, 95% CI) | 0.30 [0.00, 0.60] |
| 4.1 < 29 completed weeks' gestation | 1 | 64 | Mean Difference (IV, Fixed, 95% CI) | 0.30 [0.00, 0.60] |
| 5 Hyperthermia on admission to NICU: core body temperature > 37.5°C Show forest plot | 1 | 64 | Risk Ratio (M‐H, Fixed, 95% CI) | 0.2 [0.01, 4.01] |
| 5.1 < 29 completed weeks' gestation | 1 | 64 | Risk Ratio (M‐H, Fixed, 95% CI) | 0.2 [0.01, 4.01] |
| 6 Major brain injury Show forest plot | 1 | 64 | Risk Ratio (M‐H, Fixed, 95% CI) | 1.5 [0.27, 8.38] |
| 6.1 < 29 completed weeks' gestation | 1 | 64 | Risk Ratio (M‐H, Fixed, 95% CI) | 1.5 [0.27, 8.38] |
| 7 Mortality (death at discharge) Show forest plot | 1 | 64 | Risk Ratio (M‐H, Fixed, 95% CI) | 1.5 [0.27, 8.38] |
| 7.1 < 29 completed weeks' gestation | 1 | 64 | Risk Ratio (M‐H, Fixed, 95% CI) | 1.5 [0.27, 8.38] |
| 8 Bicarbonate concentration (mmol/L) Show forest plot | 1 | 64 | Mean Difference (IV, Fixed, 95% CI) | 1.0 [0.02, 1.98] |
| 8.1 < 29 completed weeks' gestation | 1 | 64 | Mean Difference (IV, Fixed, 95% CI) | 1.0 [0.02, 1.98] |
| 9 Blood gas pH Show forest plot | 1 | 64 | Mean Difference (IV, Fixed, 95% CI) | ‐0.02 [‐0.06, 0.02] |
| 9.1 < 29 completed weeks' gestation | 1 | 64 | Mean Difference (IV, Fixed, 95% CI) | ‐0.02 [‐0.06, 0.02] |
| 10 First serum glucose concentration (mmol/L) on admission to NICU Show forest plot | 1 | 64 | Mean Difference (IV, Fixed, 95% CI) | 0.0 [‐0.50, 0.50] |
| 10.1 < 29 completed weeks' gestation | 1 | 64 | Mean Difference (IV, Fixed, 95% CI) | 0.0 [‐0.50, 0.50] |
| 11 Intubation at birth Show forest plot | 1 | 64 | Risk Ratio (M‐H, Fixed, 95% CI) | 0.82 [0.49, 1.37] |
| 11.1 < 29 completed weeks' gestation | 1 | 64 | Risk Ratio (M‐H, Fixed, 95% CI) | 0.82 [0.49, 1.37] |
| Outcome or subgroup title | No. of studies | No. of participants | Statistical method | Effect size |
| 1 Core body temperature (°C) 20 minutes after birth Show forest plot | 1 | 59 | Mean Difference (IV, Fixed, 95% CI) | 0.14 [0.08, 0.20] |
| 1.1 ≤ 32 completed weeks' gestation | 1 | 59 | Mean Difference (IV, Fixed, 95% CI) | 0.14 [0.08, 0.20] |
| 2 Core body temperature (°C) 40 minutes after birth Show forest plot | 1 | 59 | Mean Difference (IV, Fixed, 95% CI) | 0.30 [0.24, 0.36] |
| 2.1 ≤ 32 completed weeks' gestation | 1 | 59 | Mean Difference (IV, Fixed, 95% CI) | 0.30 [0.24, 0.36] |
| 3 Core body temperature (°C) 1 hour after birth Show forest plot | 1 | 59 | Mean Difference (IV, Fixed, 95% CI) | 0.35 [0.29, 0.41] |
| 3.1 ≤ 32 completed weeks' gestation | 1 | 59 | Mean Difference (IV, Fixed, 95% CI) | 0.35 [0.29, 0.41] |
| 4 Decrease in core body temperature (°C) during 1 hour after birth Show forest plot | 1 | 59 | Mean Difference (IV, Fixed, 95% CI) | ‐1.34 [‐2.22, ‐0.46] |
| 4.1 ≤ 32 completed weeks' gestation | 1 | 59 | Mean Difference (IV, Fixed, 95% CI) | ‐1.34 [‐2.22, ‐0.46] |
| 5 Hypothermia within 1 hour after birth: core body temperature < 36.5°C or skin temperature < 36°C Show forest plot | 1 | 59 | Risk Ratio (M‐H, Fixed, 95% CI) | 0.84 [0.63, 1.12] |
| 5.1 ≤ 32 completed weeks' gestation | 1 | 59 | Risk Ratio (M‐H, Fixed, 95% CI) | 0.84 [0.63, 1.12] |
| 6 Moderate hypothermia within 1 hour after birth: core body temperature 32°C to 35.9°C Show forest plot | 1 | 59 | Risk Ratio (M‐H, Fixed, 95% CI) | 0.56 [0.31, 1.02] |
| 6.1 ≤ 32 completed weeks' gestation | 1 | 59 | Risk Ratio (M‐H, Fixed, 95% CI) | 0.56 [0.31, 1.02] |
| 7 Outside normothermic range on admission to NICU or up to 2 hours after birth Show forest plot | 1 | 59 | Risk Ratio (M‐H, Fixed, 95% CI) | 0.84 [0.63, 1.12] |
| 7.1 ≤ 32 completed weeks' gestation | 1 | 59 | Risk Ratio (M‐H, Fixed, 95% CI) | 0.84 [0.63, 1.12] |
| Outcome or subgroup title | No. of studies | No. of participants | Statistical method | Effect size |
| 1 Core body temperature (°C) on admission to NICU Show forest plot | 1 | 100 | Mean Difference (IV, Fixed, 95% CI) | 0.10 [‐0.18, 0.38] |
| 1.1 < 29 completed weeks' gestation | 1 | 100 | Mean Difference (IV, Fixed, 95% CI) | 0.10 [‐0.18, 0.38] |
| 2 Hypothermia on admission to NICU: core body temperature < 36.5°C Show forest plot | 1 | 100 | Risk Ratio (M‐H, Fixed, 95% CI) | 0.87 [0.55, 1.37] |
| 2.1 < 29 completed weeks' gestation | 1 | 100 | Risk Ratio (M‐H, Fixed, 95% CI) | 0.87 [0.55, 1.37] |
| 3 Mild hypothermia on admission to NICU: core body temperature 36°C to 36.4°C Show forest plot | 1 | 100 | Risk Ratio (M‐H, Fixed, 95% CI) | 1.08 [0.56, 2.05] |
| 3.1 < 29 completed weeks' gestation | 1 | 100 | Risk Ratio (M‐H, Fixed, 95% CI) | 1.08 [0.56, 2.05] |
| 4 Moderate hypothermia on admission to NICU: core body temperature < 32.0°C to 35.9°C Show forest plot | 1 | 100 | Risk Ratio (M‐H, Fixed, 95% CI) | 0.6 [0.24, 1.53] |
| 4.1 < 29 completed weeks' gestation | 1 | 100 | Risk Ratio (M‐H, Fixed, 95% CI) | 0.6 [0.24, 1.53] |
| 5 Outside normothermic range on admission to NICU or within 2 hours after birth Show forest plot | 1 | 100 | Risk Ratio (M‐H, Fixed, 95% CI) | 0.88 [0.59, 1.32] |
| 5.1 < 29 completed weeks' gestation | 1 | 100 | Risk Ratio (M‐H, Fixed, 95% CI) | 0.88 [0.59, 1.32] |
| 6 Core body temperature (°C) 1 hour after admission to NICU Show forest plot | 1 | 100 | Mean Difference (IV, Fixed, 95% CI) | ‐0.10 [‐0.47, 0.27] |
| 6.1 < 29 completed weeks' gestation | 1 | 100 | Mean Difference (IV, Fixed, 95% CI) | ‐0.10 [‐0.47, 0.27] |
| 7 Hyperthermia on admission to NICU: core body temperature > 37.5°C Show forest plot | 1 | 100 | Risk Ratio (M‐H, Fixed, 95% CI) | 1.0 [0.21, 4.72] |
| 7.1 < 29 completed weeks' gestation | 1 | 100 | Risk Ratio (M‐H, Fixed, 95% CI) | 1.0 [0.21, 4.72] |
| 8 Intraventricular haemorrhage Show forest plot | 1 | 100 | Risk Ratio (M‐H, Fixed, 95% CI) | 0.8 [0.34, 1.86] |
| 8.1 < 29 completed weeks' gestation | 1 | 100 | Risk Ratio (M‐H, Fixed, 95% CI) | 0.8 [0.34, 1.86] |
| 9 Periventricular leukomalacia Show forest plot | 1 | 100 | Risk Ratio (M‐H, Fixed, 95% CI) | 1.0 [0.06, 15.55] |
| 9.1 < 29 completed weeks' gestation | 1 | 100 | Risk Ratio (M‐H, Fixed, 95% CI) | 1.0 [0.06, 15.55] |
| 10 Mortality Show forest plot | 1 | 100 | Risk Ratio (M‐H, Fixed, 95% CI) | 0.29 [0.06, 1.31] |
| 10.1 < 29 completed weeks' gestation | 1 | 100 | Risk Ratio (M‐H, Fixed, 95% CI) | 0.29 [0.06, 1.31] |
| 11 Bronchopulmonary dysplasia (BPD) Show forest plot | 1 | 100 | Risk Ratio (M‐H, Fixed, 95% CI) | 1.0 [0.59, 1.69] |
| 11.1 < 29 completed weeks' gestation | 1 | 100 | Risk Ratio (M‐H, Fixed, 95% CI) | 1.0 [0.59, 1.69] |
| 12 Necrotising enterocolitis Show forest plot | 1 | 100 | Risk Ratio (M‐H, Fixed, 95% CI) | 1.0 [0.41, 2.46] |
| 12.1 < 29 completed weeks' gestation | 1 | 100 | Risk Ratio (M‐H, Fixed, 95% CI) | 1.0 [0.41, 2.46] |
| Outcome or subgroup title | No. of studies | No. of participants | Statistical method | Effect size |
| 1 Core body temperature (°C) on admission to NICU or up to 2 hours after birth Show forest plot | 1 | 64 | Mean Difference (IV, Fixed, 95% CI) | 0.32 [0.02, 0.62] |
| 1.1 ≥ 28 and ≤ 32 completed weeks' gestation | 1 | 64 | Mean Difference (IV, Fixed, 95% CI) | 0.32 [0.02, 0.62] |
| 2 Core body temperature (°C) 1 hour after admission to NICU Show forest plot | 1 | 64 | Mean Difference (IV, Fixed, 95% CI) | 0.37 [0.03, 0.71] |
| 2.1 ≥ 28 and ≤ 32 completed weeks' gestation | 1 | 64 | Mean Difference (IV, Fixed, 95% CI) | 0.37 [0.03, 0.71] |
| 3 Core body temperature (°C) 2 hours after admission to NICU Show forest plot | 1 | 64 | Mean Difference (IV, Fixed, 95% CI) | 0.37 [0.11, 0.63] |
| 3.1 ≥ 28 and ≤ 32 completed weeks' gestation | 1 | 64 | Mean Difference (IV, Fixed, 95% CI) | 0.37 [0.11, 0.63] |
| Outcome or subgroup title | No. of studies | No. of participants | Statistical method | Effect size |
| 1 Core body temperature (°C) on admission to NICU or up to 2 hours after birth Show forest plot | 1 | Mean Difference (IV, Fixed, 95% CI) | Subtotals only | |
| 1.1 All infants (32 to 36 completed weeks' gestation) | 1 | 40 | Mean Difference (IV, Fixed, 95% CI) | 0.10 [‐0.21, 0.41] |
| 1.2 < 2000 grams birth weight | 1 | 10 | Mean Difference (IV, Fixed, 95% CI) | 0.70 [‐0.01, 1.41] |
| 1.3 ≥ 2000 grams birth weight | 1 | 30 | Mean Difference (IV, Fixed, 95% CI) | 0.0 [‐0.37, 0.37] |
| 2 Hypothermia on admission to NICU: core body temperature < 36.5°C or skin temperature < 36°C Show forest plot | 1 | 40 | Risk Ratio (M‐H, Fixed, 95% CI) | 0.90 [0.48, 1.71] |
| 2.1 32 to 36 completed weeks' gestation | 1 | 40 | Risk Ratio (M‐H, Fixed, 95% CI) | 0.90 [0.48, 1.71] |
| Outcome or subgroup title | No. of studies | No. of participants | Statistical method | Effect size |
| 1 Hypothermia: skin temperature < 35.5°C for 2 consecutive recordings Show forest plot | 1 | 31 | Risk Ratio (M‐H, Fixed, 95% CI) | 0.09 [0.01, 0.64] |
| 1.1 1200 to 2199 grams birth weight | 1 | 31 | Risk Ratio (M‐H, Fixed, 95% CI) | 0.09 [0.01, 0.64] |
| 2 Hypoglycaemia: blood glucose level < 2.6 mmol/L Show forest plot | 1 | 31 | Risk Ratio (M‐H, Fixed, 95% CI) | 0.24 [0.03, 2.06] |
| 2.1 1200 to 2199 grams birth weight | 1 | 31 | Risk Ratio (M‐H, Fixed, 95% CI) | 0.24 [0.03, 2.06] |
| Outcome or subgroup title | No. of studies | No. of participants | Statistical method | Effect size |
| 1 Core body temperature (°C) on admission to NICU or up to 2 hours after birth Show forest plot | 2 | 126 | Mean Difference (IV, Fixed, 95% CI) | 0.65 [0.36, 0.94] |
| 1.1 ≤ 1500 grams birth weight | 2 | 126 | Mean Difference (IV, Fixed, 95% CI) | 0.65 [0.36, 0.94] |
| 2 Hypothermia on admission to NICU: core body temperature < 36.5°C or skin temperature < 36°C Show forest plot | 1 | 24 | Risk Ratio (M‐H, Fixed, 95% CI) | 0.3 [0.11, 0.83] |
| 2.1 ≤ 1500 grams birth weight | 1 | 24 | Risk Ratio (M‐H, Fixed, 95% CI) | 0.3 [0.11, 0.83] |
| 3 Moderate hypothermia on admission to NICU: core body temperature < 36°C Show forest plot | 2 | 126 | Risk Ratio (M‐H, Fixed, 95% CI) | 0.49 [0.32, 0.76] |
| 3.1 ≤ 1500 grams birth weight | 2 | 126 | Risk Ratio (M‐H, Fixed, 95% CI) | 0.49 [0.32, 0.76] |
| 4 Hypothermia on admission to NICU: core body temperature < 35°C Show forest plot | 2 | 126 | Risk Ratio (M‐H, Fixed, 95% CI) | 0.18 [0.05, 0.65] |
| 4.1 ≤ 1500 grams birth weight | 2 | 126 | Risk Ratio (M‐H, Fixed, 95% CI) | 0.18 [0.05, 0.65] |
| 5 Outside normothermic range on admission to NICU or up to 2 hours after birth Show forest plot | 1 | 24 | Risk Ratio (M‐H, Fixed, 95% CI) | 0.3 [0.11, 0.83] |
| 5.1 ≤ 1500 grams birth weight | 1 | 24 | Risk Ratio (M‐H, Fixed, 95% CI) | 0.3 [0.11, 0.83] |
| 6 Hyperthermia on admission to NICU: core body temperature > 37.5°C Show forest plot | 2 | 126 | Risk Ratio (M‐H, Fixed, 95% CI) | 4.63 [0.23, 94.10] |
| 6.1 < 32 completed weeks' gestation | 2 | 126 | Risk Ratio (M‐H, Fixed, 95% CI) | 4.63 [0.23, 94.10] |
| 7 Mortality Show forest plot | 1 | 102 | Risk Ratio (M‐H, Fixed, 95% CI) | 0.31 [0.01, 7.40] |
| 7.1 < 32 completed weeks' gestation | 1 | 102 | Risk Ratio (M‐H, Fixed, 95% CI) | 0.31 [0.01, 7.40] |
| 8 Major brain injury ‐ IVH (grade Ⅲ or Ⅳ) Show forest plot | 1 | 102 | Risk Ratio (M‐H, Fixed, 95% CI) | 4.62 [0.56, 38.19] |
| 8.1 < 32 completed weeks' gestation | 1 | 102 | Risk Ratio (M‐H, Fixed, 95% CI) | 4.62 [0.56, 38.19] |
| 9 Major brain injury ‐ cystic periventricular leukomalacia Show forest plot | 1 | 102 | Risk Ratio (M‐H, Fixed, 95% CI) | 1.39 [0.24, 7.95] |
| 9.1 < 32 completed weeks' gestation | 1 | 102 | Risk Ratio (M‐H, Fixed, 95% CI) | 1.39 [0.24, 7.95] |
| 10 Bronchopulmonary dysplasia (BPD) Show forest plot | 1 | 102 | Risk Ratio (M‐H, Fixed, 95% CI) | 1.34 [0.69, 2.61] |
| 10.1 < 32 completed weeks' gestation | 1 | 102 | Risk Ratio (M‐H, Fixed, 95% CI) | 1.34 [0.69, 2.61] |
| 11 Duration of hospital stay (days) Show forest plot | 1 | 102 | Mean Difference (IV, Fixed, 95% CI) | ‐5.0 [‐17.27, 7.27] |
| 11.1 < 32 completed weeks' gestation | 1 | 102 | Mean Difference (IV, Fixed, 95% CI) | ‐5.0 [‐17.27, 7.27] |
| 12 Duration of ventilation (days) Show forest plot | 1 | 102 | Mean Difference (IV, Fixed, 95% CI) | ‐4.0 [‐12.67, 4.67] |
| 12.1 < 32 completed weeks' gestation | 1 | 102 | Mean Difference (IV, Fixed, 95% CI) | ‐4.0 [‐12.67, 4.67] |
| 13 Duration of oxygen requirements (days) Show forest plot | 1 | 102 | Mean Difference (IV, Fixed, 95% CI) | ‐7.0 [‐19.66, 5.66] |
| 13.1 < 32 completed weeks' gestation | 1 | 102 | Mean Difference (IV, Fixed, 95% CI) | ‐7.0 [‐19.66, 5.66] |
| 14 Hypoglycaemia Show forest plot | 1 | 102 | Risk Ratio (M‐H, Fixed, 95% CI) | 1.02 [0.47, 2.18] |
| 14.1 < 32 completed weeks' gestation | 1 | 102 | Risk Ratio (M‐H, Fixed, 95% CI) | 1.02 [0.47, 2.18] |
| 15 Metabolic acidosis Show forest plot | 1 | 102 | Risk Ratio (M‐H, Fixed, 95% CI) | 0.31 [0.03, 2.86] |
| 15.1 < 32 completed weeks' gestation | 1 | 102 | Risk Ratio (M‐H, Fixed, 95% CI) | 0.31 [0.03, 2.86] |
| 16 Necrotising enterocolitis (NEC) Show forest plot | 1 | 102 | Risk Ratio (M‐H, Fixed, 95% CI) | 0.64 [0.33, 1.23] |
| 16.1 < 32 completed weeks' gestation | 1 | 102 | Risk Ratio (M‐H, Fixed, 95% CI) | 0.64 [0.33, 1.23] |
| 17 Sepsis Show forest plot | 1 | 102 | Risk Ratio (M‐H, Fixed, 95% CI) | 0.92 [0.48, 1.79] |
| 17.1 < 32 completed weeks' gestation | 1 | 102 | Risk Ratio (M‐H, Fixed, 95% CI) | 0.92 [0.48, 1.79] |
| Outcome or subgroup title | No. of studies | No. of participants | Statistical method | Effect size |
| 1 Core body temperature (°C) on admission to NICU or up to 2 hours after birth Show forest plot | 2 | 77 | Mean Difference (IV, Fixed, 95% CI) | 0.18 [‐0.18, 0.54] |
| 1.1 ≤ 28 completed weeks' gestation | 2 | 77 | Mean Difference (IV, Fixed, 95% CI) | 0.18 [‐0.18, 0.54] |
| 2 Hypothermia on admission to NICU (core body temperature < 36.5°C or skin temperature < 36°C) Show forest plot | 1 | 36 | Risk Ratio (M‐H, Fixed, 95% CI) | 0.60 [0.32, 1.15] |
| 2.1 (≥ 24 and ≤ 28 completed weeks' gestation and birth weight ≤ 1250 grams) | 1 | 36 | Risk Ratio (M‐H, Fixed, 95% CI) | 0.60 [0.32, 1.15] |
| 3 Outside normothermic range on admission to NICU or up to 2 hours after birth Show forest plot | 1 | 36 | Risk Ratio (M‐H, Fixed, 95% CI) | 0.69 [0.38, 1.24] |
| 3.1 (≥ 24 and ≤ 28 completed weeks' gestation and birth weight ≤ 1250 grams) | 1 | 36 | Risk Ratio (M‐H, Fixed, 95% CI) | 0.69 [0.38, 1.24] |
| 4 Hyperthermia on admission to NICU: core body temperature > 37.5°C Show forest plot | 1 | 36 | Risk Ratio (M‐H, Fixed, 95% CI) | 3.33 [0.14, 76.75] |
| 4.1 (≥ 24 and ≤ 28 completed weeks' gestation and birth weight ≤ 1250 grams) | 1 | 36 | Risk Ratio (M‐H, Fixed, 95% CI) | 3.33 [0.14, 76.75] |
| 5 Brain injury (IVH grade Ⅰ or Ⅱ) Show forest plot | 1 | 36 | Risk Ratio (M‐H, Fixed, 95% CI) | 0.45 [0.10, 2.01] |
| 5.1 (≥ 24 and ≤ 28 completed weeks' gestation and birth weight ≤ 1250 grams) | 1 | 36 | Risk Ratio (M‐H, Fixed, 95% CI) | 0.45 [0.10, 2.01] |
| 6 Major brain injury (IVH grade Ⅲ or Ⅳ) Show forest plot | 2 | 77 | Risk Ratio (M‐H, Fixed, 95% CI) | 0.91 [0.31, 2.71] |
| 6.1 ≤ 28 completed weeks' gestation | 2 | 77 | Risk Ratio (M‐H, Fixed, 95% CI) | 0.91 [0.31, 2.71] |
| 7 Mortality (death before discharge) Show forest plot | 2 | 77 | Risk Ratio (M‐H, Fixed, 95% CI) | 1.10 [0.39, 3.17] |
| 7.1 ≤ 28 completed weeks' gestation | 2 | 77 | Risk Ratio (M‐H, Fixed, 95% CI) | 1.10 [0.39, 3.17] |
| 8 Bronchopulmonary dysplasia (BPD) Show forest plot | 1 | 36 | Risk Ratio (M‐H, Fixed, 95% CI) | 0.75 [0.40, 1.37] |
| 8.1 (≥ 24 and ≤ 28 completed weeks' gestation and birth weight ≤ 1250 grams) | 1 | 36 | Risk Ratio (M‐H, Fixed, 95% CI) | 0.75 [0.40, 1.37] |
| 9 Hypotension during first 24 hours of life Show forest plot | 1 | 41 | Risk Ratio (M‐H, Fixed, 95% CI) | 1.5 [0.71, 3.17] |
| 9.1 ≤ 28 completed weeks' gestation | 1 | 41 | Risk Ratio (M‐H, Fixed, 95% CI) | 1.5 [0.71, 3.17] |
| 10 Necrotising enterocolitis (NEC) Show forest plot | 2 | 77 | Risk Ratio (M‐H, Fixed, 95% CI) | 1.92 [0.61, 5.97] |
| 10.1 ≤ 28 completed weeks' gestation | 2 | 77 | Risk Ratio (M‐H, Fixed, 95% CI) | 1.92 [0.61, 5.97] |
| 11 Patent ductus arteriosus (PDA) Show forest plot | 1 | 36 | Risk Ratio (M‐H, Fixed, 95% CI) | 1.76 [0.88, 3.49] |
| 11.1 (≥ 24 and ≤ 28 completed weeks' gestation and birth weight ≤ 1250 grams) | 1 | 36 | Risk Ratio (M‐H, Fixed, 95% CI) | 1.76 [0.88, 3.49] |
| 12 PDA ‐ medication only Show forest plot | 1 | 36 | Risk Ratio (M‐H, Fixed, 95% CI) | 1.44 [0.69, 3.01] |
| 12.1 (≥ 24 and ≤ 28 completed weeks' gestation and birth weight ≤ 1250 grams) | 1 | 36 | Risk Ratio (M‐H, Fixed, 95% CI) | 1.44 [0.69, 3.01] |
| 13 PDA ‐ ligation Show forest plot | 1 | 36 | Risk Ratio (M‐H, Fixed, 95% CI) | 5.56 [0.29, 108.16] |
| 13.1 (≥ 24 and ≤ 28 completed weeks' gestation and birth weight ≤ 1250 grams) | 1 | 36 | Risk Ratio (M‐H, Fixed, 95% CI) | 5.56 [0.29, 108.16] |
| 14 Retinopathy of prematurity (ROP all grades) Show forest plot | 1 | 36 | Risk Ratio (M‐H, Fixed, 95% CI) | 0.48 [0.15, 1.56] |
| 14.1 (≥ 24 and ≤ 28 completed weeks' gestation and birth weight ≤ 1250 grams) | 1 | 36 | Risk Ratio (M‐H, Fixed, 95% CI) | 0.48 [0.15, 1.56] |
| 15 Retinopathy of prematurity (ROP laser therapy) Show forest plot | 1 | 41 | Risk Ratio (M‐H, Fixed, 95% CI) | 0.53 [0.05, 5.35] |
| 15.1 ≤ 28 completed weeks' gestation | 1 | 41 | Risk Ratio (M‐H, Fixed, 95% CI) | 0.53 [0.05, 5.35] |
| 16 Spontaneous intestinal perforation (SIP) Show forest plot | 1 | 41 | Risk Ratio (M‐H, Fixed, 95% CI) | 0.53 [0.11, 2.56] |
| 16.1 ≤ 28 completed weeks' gestation | 1 | 41 | Risk Ratio (M‐H, Fixed, 95% CI) | 0.53 [0.11, 2.56] |
| 17 Worst base deficit in first 24 hours of life Show forest plot | 1 | 41 | Mean Difference (IV, Fixed, 95% CI) | ‐1.70 [‐3.99, 0.59] |
| 17.1 ≤ 28 completed weeks' gestation | 1 | 41 | Mean Difference (IV, Fixed, 95% CI) | ‐1.70 [‐3.99, 0.59] |
| 18 Worst pH in first 24 hours of life Show forest plot | 1 | 41 | Mean Difference (IV, Fixed, 95% CI) | ‐0.09 [‐0.13, ‐0.05] |
| 18.1 ≤ 28 completed weeks' gestation | 1 | 41 | Mean Difference (IV, Fixed, 95% CI) | ‐0.09 [‐0.13, ‐0.05] |
| Outcome or subgroup title | No. of studies | No. of participants | Statistical method | Effect size |
| 1 Core body temperature (°C) on admission to NICU or up to 2 hours of after birth Show forest plot | 2 | Mean Difference (IV, Fixed, 95% CI) | Subtotals only | |
| 1.1 All infants (< 31 completed weeks' gestation) | 2 | 119 | Mean Difference (IV, Fixed, 95% CI) | 0.37 [0.09, 0.66] |
| 1.2 < 28 completed weeks' gestation | 2 | 76 | Mean Difference (IV, Fixed, 95% CI) | 0.57 [0.20, 0.94] |
| 1.3 28 to 30 completed weeks' gestation | 1 | 43 | Mean Difference (IV, Fixed, 95% CI) | 0.10 [‐0.36, 0.56] |
| 2 Hypothermia: core body temperature < 36.5°C on admission to NICU Show forest plot | 2 | Risk Ratio (M‐H, Fixed, 95% CI) | Subtotals only | |
| 2.1 All infants (< 31 completed weeks' gestation) | 2 | 119 | Risk Ratio (M‐H, Fixed, 95% CI) | 0.93 [0.45, 1.90] |
| 2.2 < 28 completed weeks' gestation | 2 | 76 | Risk Ratio (M‐H, Fixed, 95% CI) | 0.66 [0.29, 1.46] |
| 2.3 28 to 30 completed weeks' gestation | 1 | 43 | Risk Ratio (M‐H, Fixed, 95% CI) | 3.82 [0.46, 31.43] |
| 3 Outside normothermic range on admission to NICU or up to 2 hours after birth Show forest plot | 2 | Risk Ratio (M‐H, Fixed, 95% CI) | Subtotals only | |
| 3.1 All infants (< 31 completed weeks' gestation) | 2 | 119 | Risk Ratio (M‐H, Fixed, 95% CI) | 1.46 [0.94, 2.27] |
| 3.2 < 28 completed weeks' gestation | 2 | 76 | Risk Ratio (M‐H, Fixed, 95% CI) | 1.23 [0.69, 2.18] |
| 3.3 28 to 30 weeks' gestation | 1 | 43 | Risk Ratio (M‐H, Fixed, 95% CI) | 1.91 [0.96, 3.78] |
| 4 Hyperthermia on admission to NICU: core body temperature > 37.5°C Show forest plot | 2 | Risk Ratio (M‐H, Fixed, 95% CI) | Subtotals only | |
| 4.1 All infants (< 31 completed weeks' gestation) | 2 | 119 | Risk Ratio (M‐H, Fixed, 95% CI) | 2.15 [1.07, 4.32] |
| 4.2 < 28 completed weeks' gestation | 2 | 76 | Risk Ratio (M‐H, Fixed, 95% CI) | 2.99 [0.93, 9.65] |
| 4.3 28 to 30 completed weeks' gestation | 1 | 43 | Risk Ratio (M‐H, Fixed, 95% CI) | 1.59 [0.70, 3.60] |
| 5 Major brain injury Show forest plot | 1 | 72 | Risk Ratio (M‐H, Fixed, 95% CI) | 0.32 [0.03, 2.89] |
| 5.1 < 31 completed weeks' gestation | 1 | 72 | Risk Ratio (M‐H, Fixed, 95% CI) | 0.32 [0.03, 2.89] |
| 6 Mortality (death before hospital discharge) Show forest plot | 2 | 119 | Risk Ratio (M‐H, Fixed, 95% CI) | 0.73 [0.32, 1.66] |
| 6.1 < 31 completed weeks' gestation | 2 | 119 | Risk Ratio (M‐H, Fixed, 95% CI) | 0.73 [0.32, 1.66] |
| 7 Chronic lung disease Show forest plot | 1 | 72 | Risk Ratio (M‐H, Fixed, 95% CI) | 1.73 [0.72, 4.18] |
| 7.1 < 31 completed weeks' gestation | 1 | 72 | Risk Ratio (M‐H, Fixed, 95% CI) | 1.73 [0.72, 4.18] |
| 8 Coagulation support Show forest plot | 1 | 47 | Risk Ratio (M‐H, Fixed, 95% CI) | 1.04 [0.30, 3.69] |
| 8.1 < 29 completed weeks' gestation | 1 | 47 | Risk Ratio (M‐H, Fixed, 95% CI) | 1.04 [0.30, 3.69] |
| 9 Inotrope use Show forest plot | 2 | 119 | Risk Ratio (M‐H, Fixed, 95% CI) | 1.14 [0.61, 2.11] |
| 9.1 < 31 completed weeks' gestation | 2 | 119 | Risk Ratio (M‐H, Fixed, 95% CI) | 1.14 [0.61, 2.11] |
| 10 Intubated during admission Show forest plot | 1 | 72 | Risk Ratio (M‐H, Fixed, 95% CI) | 0.98 [0.73, 1.32] |
| 10.1 < 31 completed weeks' gestation | 1 | 72 | Risk Ratio (M‐H, Fixed, 95% CI) | 0.98 [0.73, 1.32] |
| 11 ≥ 1 dose surfactant during admission Show forest plot | 1 | 72 | Risk Ratio (M‐H, Fixed, 95% CI) | 0.99 [0.70, 1.38] |
| 11.1 < 31 completed weeks' gestation | 1 | 72 | Risk Ratio (M‐H, Fixed, 95% CI) | 0.99 [0.70, 1.38] |