Interventions to prevent hypothermia at birth in preterm and/or low birth weight infants
Abstract
Background
Newborn admission temperature is a strong predictor of outcomes across all gestations. Hypothermia immediately after birth remains a worldwide issue and, if prolonged, is associated with harm. Keeping preterm infants warm is difficult even when recommended routine thermal care guidelines are followed in the delivery room.
Objectives
To assess the efficacy and safety of interventions designed for prevention of hypothermia in preterm and/or low birth weight infants applied within 10 minutes after birth in the delivery room, compared with routine thermal care or any other single/combination of intervention(s) also designed for prevention of hypothermia in preterm and/or low birth weight infants applied within 10 minutes after birth in the delivery room.
Search methods
We used the standard search strategy of Cochrane Neonatal to search the Cochrane Central Register of Controlled Trials (CENTRAL; 2016, Issue 5), MEDLINE via PubMed (1966 to 30 June 2016), Embase (1980 to 30 June 2016), and CINAHL (1982 to 30 June 2016). We also searched clinical trials databases, conference proceedings, and reference lists of retrieved articles for randomised controlled trials and quasi‐randomised trials.
Selection criteria
Trials using randomised or quasi‐randomised allocations to test interventions designed to prevent hypothermia (apart from 'routine' thermal care) applied within 10 minutes after birth in the delivery room for infants at < 37 weeks' gestation and/or birth weight ≤ 2500 grams.
Data collection and analysis
We used Cochrane Neonatal methods when performing data collection and analysis.
Main results
Twenty‐five studies across 15 comparison groups met the inclusion criteria, categorised as: barriers to heat loss (18 studies); external heat sources (three studies); and combinations of interventions (four studies).
Barriers to heat loss
Plastic wrap or bag versus routine care
Plastic wraps improved core body temperature on admission to the neonatal intensive care unit (NICU) or up to two hours after birth (mean difference (MD) 0.58°C, 95% confidence interval (CI) 0.50 to 0.66; 13 studies; 1633 infants), and fewer infants had hypothermia on admission to the NICU or up to two hours after birth (typical risk ratio (RR) 0.67, 95% CI 0.62 to 0.72; typical risk reduction (RD) ‐0.25, 95% CI ‐0.29 to ‐0.20; number needed to treat for an additional beneficial outcome (NNTB) 4, 95% CI 4 to 5; 10 studies; 1417 infants). Risk of hyperthermia on admission to the NICU or up to two hours after birth was increased in infants in the wrapped group (typical RR 3.91, 95% CI 2.05 to 7.44; typical RD 0.04, 95% CI 0.02 to 0.06; number needed to treat for an additional harmful outcome (NNTH) 25, 95% CI 17 to 50; 12 studies; 1523 infants), but overall, fewer infants receiving plastic wrap were outside the normothermic range (typical RR 0.75, 95% CI 0.69 to 0.81; typical RD ‐0.20, 95% CI ‐0.26 to ‐0.15; NNTH 5, 95% CI 4 to 7; five studies; 1048 infants).
Evidence was insufficient to suggest that plastic wraps or bags significantly reduce risk of death during hospital stay or other major morbidities, with the exception of reducing risk of pulmonary haemorrhage.
Evidence of practices regarding permutations on this general approach is still emerging and has been based on the findings of only one or two small studies.
External heat sources
Evidence is emerging on the efficacy of external heat sources, including skin‐to‐skin care (SSC) versus routine care (one study; 31 infants) and thermal mattress versus routine care (two studies; 126 infants).
SSC was shown to be effective in reducing risk of hypothermia when compared with conventional incubator care for infants with birth weight ≥ 1200 and ≤ 2199 grams (RR 0.09, 95% CI 0.01 to 0.64; RD ‐0.56, 95% CI ‐0.84 to ‐0.27; NNTB 2, 95% CI 1 to 4). Thermal (transwarmer) mattress significantly kept infants ≤ 1500 grams warmer (MD 0.65°C, 95% CI 0.36 to 0.94) and reduced the incidence of hypothermia on admission to the NICU, with no significant difference in hyperthermia risk.
Combinations of interventions
Two studies (77 infants) compared thermal mattresses versus plastic wraps or bags for infants at ≤ 28 weeks' gestation. Investigators reported no significant differences in core body temperature nor in the incidence of hypothermia, hyperthermia, or core body temperature outside the normothermic range on admission to the NICU.
Two additional studies (119 infants) compared plastic bags and thermal mattresses versus plastic bags alone for infants at < 31 weeks' gestation. Meta‐analysis of these two studies showed improvement in core body temperature on admission to the NICU or up to two hours after birth, but an increase in hyperthermia. Data show no significant difference in the risk of having a core body temperature outside the normothermic range on admission to the NICU nor in the risk of other reported morbidities.
Authors' conclusions
Evidence of moderate quality shows that use of plastic wraps or bags compared with routine care led to higher temperatures on admission to NICUs with less hypothermia, particularly for extremely preterm infants. Thermal mattresses and SSC also reduced hypothermia risk when compared with routine care, but findings are based on two or fewer small studies. Caution must be taken to avoid iatrogenic hyperthermia, particularly when multiple interventions are used simultaneously. Limited evidence suggests benefit and no evidence of harm for most short‐term morbidity outcomes known to be associated with hypothermia, including major brain injury, bronchopulmonary dysplasia, retinopathy of prematurity, necrotising enterocolitis, and nosocomial infection. Many observational studies have shown increased mortality among preterm hypothermic infants compared with those who maintain normothermia, yet evidence is insufficient to suggest that these interventions reduce risk of in‐hospital mortality across all comparison groups. Hypothermia may be a marker for illness and poorer outcomes by association rather than by causality. Limitations of this review include small numbers of identified studies; small sample sizes; and variations in methods and definitions used for hypothermia, hyperthermia, normothermia, routine care, and morbidity, along with lack of power to detect effects on morbidity and mortality across most comparison groups. Future studies should: be adequately powered to detect rarer outcomes; apply standardised morbidity definitions; focus on longer‐term outcomes, particularly neurodevelopmental outcomes.
PICOs
Plain language summary
Interventions to prevent hypothermia at birth in preterm and/or low birth weight infants
Review question: What is known about the efficacy and safety of interventions designed to prevent hypothermia in preterm and/or low birth weight babies applied within 10 minutes after birth in the delivery room, compared with routine thermal care or any other single/combination of intervention(s)?
Background: Preventing low body temperature at birth in preterm and low birth weight babies may be important for survival and long‐term outcomes. Babies rely on external help to maintain temperature, particularly in the first 12 hours of life. For vulnerable babies born preterm or at low birth weight, abnormally low body temperature (hypothermia) is a worldwide issue across all climates and has been linked to a variety of complications including death. Preventive action is taken by reducing heat loss and/or providing warmth through external heat sources. Precautionary steps routinely include ensuring a warm delivery room; drying immediately after birth, especially the head; wrapping in prewarmed dry blankets (including the head); prewarming surfaces; and eliminating draughts.
Search date: We used the standard search strategy of the Cochrane Neonatal Review Group to search CENTRAL (2016, Issue 5), MEDLINE (1966 to 30 June 2016), Embase (1980 to 30 June 2016), and the Cumulative Index to Nursing and Allied Health Literature (CINAHL; 1982 to 30 June 2016). We also searched clinical trials databases, conference proceedings, and reference lists of retrieved articles for randomised controlled trials and quasi‐randomised trials.
Key results: This review identified 25 studies involving 2433 babies; researchers used additional preventive actions in the first 10 minutes of life to prevent problems with hypothermia. Use of plastic coverings, heated mattresses, and skin‐to‐skin contact kept infants warmer (and within normal body temperature ranges) than routine preventive action. However, care must be taken, particularly when these methods are combined, to avoid the unintended effect of making babies too warm, which may be harmful. Limitations consist of small numbers of babies and studies included in some comparison groups; variations in methods and definitions used for normal body temperature and routine care; and differences in materials used.
Although this review confirmed that some of these measures are effective in preventing hypothermia, results across all studies show no reduction in deaths and only limited improvement in short‐term complications or illnesses normally associated with being too cold. Findings suggest that perhaps hypothermia is a marker for poorer outcomes, particularly in the most immature and smallest babies, rather than a direct cause. Review authors recommend that future studies should be large enough to detect changes for rarer illnesses, should define these illnesses in the same way so they can be combined across studies, and should focus on longer‐term consequences.
Quality of the evidence: Overall for the main comparison group (plastic wraps or bags vs routine care), we are moderately confident that trial results and our conclusions are reliable. Across the remaining comparison groups, evidence is insufficient to allow firm judgements mainly because numbers of studies and sample sizes are small.
In comparisons of plastic wraps or bags versus routine care to keep preterm or low birth weight babies warm, we rated the quality of evidence as moderate for key outcomes. Across outcomes reporting on babies' regulation of their body temperature, we suspect that some small trials showing that the intervention did not keep these babies warmer may not have been published, findings of studies were not in agreement, or evidence was based on small numbers of studies or events. For major complications of brain injury and bleeding into the lung (pulmonary haemorrhage), the number of events was too small or findings were based on only one study. We suspect that some small trials reporting deaths may not have been published; however this was unlikely to have affected review findings.
Authors' conclusions
Summary of findings
| Plastic wrap or bag compared with routine care in preterm and/or low birth weight infants | ||||||
| Patient or population: preterm and/or low birth weight infants | ||||||
| Outcomes | Anticipated absolute effects* (95% CI) | Relative effect | No. of participants | Quality of the evidence | Comments | |
| Risk with routine care | Risk with plastic wrap or bag | |||||
| Core body temperature (°C) on admission to NICU or up to 2 hours after birth | Mean core body temperature (°C) on admission to NICU or up to 2 hours after birth ranged from 34.80 to 36.2. | MD 0.58 higher | ‐ | 1633 | ⊕⊕⊕⊝ | Publication bias was attributed to non‐significant smaller trials. We removed smaller trials with statistical significance, leading to a balanced funnel plot. Conclusions were similar. |
| Hypothermia on admission to NICU: core body temperature < 36.5°C or skin temperature < 36°C | Study population | RR 0.67 | 1417 | ⊕⊕⊕⊝ | Publication bias was attributed to non‐significant smaller trials. We removed smaller trials with statistical significance, leading to a balanced funnel plot. Conclusions were similar. | |
| 738 per 1000 | 495 per 1000 | |||||
| Core body temperature (°C) 1 hour after initial NICU admission temperature was taken | Mean core body temperature (°C) 1 hour after initial NICU admission temperature was taken ranged from 35.70 to 36.78. | MD 0.36 higher | ‐ | 373 | ⊕⊕⊕⊝ | Although heterogeneity was high for subgroup differences, overall effect remained highly significant. |
| Hyperthermia on admission to NICU: core body temperature > 37.5°C | Study population | RR 3.91 | 1523 | ⊕⊕⊕⊝ | ||
| 12 per 1000 | 46 per 1000 | |||||
| Major brain injury (within hospital stay) | Study population | RR 0.78 | 1100 | ⊕⊕⊕⊝ | ||
| 62 per 1000 | 49 per 1000 | |||||
| Pulmonary haemorrhage (within hospital stay) | Study population | RR 0.60 | 796 | ⊕⊕⊕⊝ | ||
| 112 per 1000 | 67 per 1000 | |||||
| Mortality (death within hospital stay or at 6 months' corrected gestation) | Study population | RR 0.91 | 1447 | ⊕⊕⊕⊝ | Publication bias was unlikely to have affected findings of the meta‐analysis. | |
| 168 per 1000 | 153 per 1000 | |||||
| *The risk in the intervention group (and its 95% confidence interval) is based on the assumed risk in the comparison group and the relative effect of the intervention (and its 95% CI). | ||||||
| GRADE Working Group grades of evidence. | ||||||
| aNot downgraded for risk of bias owing to lack of blinding of outcome assessors. We examined one study that had taken measurements over time. The differential between wrap and routine care groups appeared to increase with time, which is not what would be expected if the difference was due to knowledge of assignment groups. bNot downgraded for inconsistency because on removal of smaller studies, the remainder were characteristically very consistent and the effect size remained largely unchanged. cDowngraded one level for publication bias. dDowngraded one level for inconsistency (considerable differences in effect size across studies). eDowngraded one level for imprecision (conclusions were based on 50 incidences of hyperthermia in total ‐ these were sufficient to show significance but with wide 95% CIs). fDowngraded one level for imprecision (numbers of incidences were below OIS guidance). gDowngraded one level for imprecision (evidence came from only one study). hNot downgraded for imprecision (numbers were below OIS guidance, but 95% CIs for RR just attained ± 25% of best estimate). | ||||||
Background
Keeping preterm infants sufficiently warm immediately after birth, especially during resuscitation, is difficult even when routine thermal care guidelines are followed. Hypothermia is defined by the World Health Organization (WHO) as a core body temperature < 36.5°C, or a skin temperature < 36°C (WHO 1997). However, temperature ranges for preterm infants vary, depending on the site of measurement and the device used (Knobel‐Dail 2015). Globally, newborn hypothermia remains a challenge in both resource‐poor and resource‐rich settings and across all climates. Lunze 2013 reported hypothermia prevalence rates in a systematic review of literature pertaining to low‐ and middle‐income countries. Hospital rates varied widely from 8% (< 34.5°C) within 12 hours of birth (Guinea‐Bissau, Africa) to 85% (< 36°C) on admission (Harare, Zimbabwe, Africa), and community rates ranged from 11% (< 35.6°C) on the first day of life (Haryana, India) to 92% (< 36.5°C) during the first month (Sarlahi, Nepal) (Lunze 2013). The Vermont Oxford Network (VON) 2016 database summary, including infants of birth weight from 501 to 1500 grams, shows an unadjusted network rate of 14.6% (8067 of 55,246 infants) for core body temperature < 36℃ within the first hour after admission to neonatal intensive care units (NICUs) (VON 2017). The highest rates occurred amongst the smallest (22.1% of 501 to 750 grams) and most immature infants (26.2% at < 24 weeks' gestation) (VON 2017). These data were collated from 988 participating centres across 28 countries of high‐ or upper‐middle‐income status (The World Bank 2016). The VON also analysed admission temperature data for 454,617 very low birth weight (VLBW) infants surviving for 12 hours or longer in 1112 NICUs during the period from 2009 to 2016 (VON 2017a). Although these data show improvement in admission hypothermia rates (temperatures < 36.5°C) ranging from 52.6% (2009) to 38.2% (2016), nearly 4 in 10 infants (excluding early deaths) were cold on admission to the NICU. Similarly, in the UK, for infants born in 2015 and 2016, the National Neonatal Audit Programme (NNAP) highlighted hypothermia as an ongoing area of concern, with 28% (2054 of 7351; 2015) and 25% (1930 of 7758; 2016) of infants at < 32 weeks' gestation having a recorded temperature below the recommended temperature range (36.5°C to 37.5°C) within one hour of birth (NNAP 2016; NNAP 2017). Consequently, implementation, or sustained use, of evidence‐based thermal care strategies is needed to address this issue.
Description of the condition
The newborn cannot shiver (Scopes 1963) and relies on interventions for protection against exposure to cold. The ability to maintain an equilibrium between heat loss and heat gain despite variation in environmental temperatures is restricted during the first 12 hours of life (Buczkowski‐Bickmann 1992; Smales 1978). After birth, deep body and skin temperature of the term newborn can drop at a rate of approximately 0.1°C and 0.3°C per minute, respectively, unless immediate action is taken (Adamson 1965a). Although cold stress may be important for initiating breathing, and induced cooling may help protect the brain of asphyxiated term or near term newborns (Harned 1970), prolonged exposure to cold should be avoided, especially in the preterm infant. Factors that increase the risk of hypothermia include prematurity and decreasing birth weight (Chang 2015; Laptook 2007; Miller 2011; Mullany 2010); intrauterine growth restriction (Borse 1997; Hey 1975); and asphyxia, congenital anomalies such as gastroschisis, and damage to the central nervous system (Buczkowski‐Bickmann 1992). Extended periods of cold stress have been associated with harmful side effects including hypoglycaemia (Elliott 1957), respiratory distress and chronic lung disease (Boo 2013; Costeloe 2000; Pomerance 1974), necrotising enterocolitis (Yu 1984), hypoxia and metabolic acidosis (Adamson 1965; Gandy 1964), coagulation defects (Chadd 1972), delayed readjustment from foetal to newborn circulation (Stephenson 1970), acute renal failure and intraventricular haemorrhage (Boo 2013; Miller 2011), poor weight gain (Glass 1968), late‐onset sepsis (Laptook 2007), and death (de Almeida 2014; Elliott 1957; Miller 2011).
The association between admission hypothermia and mortality is well documented in the literature. The 2015 International Liaison Committee on Resuscitation critically appraised 36 observational studies (published between 1964 and 2014) demonstrating increased risk of mortality associated with hypothermia at admission in non‐asphyxiated infants at birth (Perlman 2015; Wyllie 2015). Review authors initially judged this evidence to be of low quality but subsequently upgraded the quality to moderate on the basis of effect size, dose effect, and single direction of evidence. Across all gestations, admission temperature was shown to be a strong predictor of mortality and morbidity. Laptook 2007 indicated that for every 1°C decrease in admission temperature, the odds of in‐hospital mortality increased by 28% and the odds of late‐onset sepsis increased by 11% in a cohort of 5277 low birth weight infants. This study also highlighted a birth weight/intubation interaction, with admission temperature showing an average difference of 1.4°C between an infant of 401 and 1400 grams compared with 0.4°C for birth weight alone. More recently, Wilson 2016 and Lyu 2015 assessed the association between admission temperature and neonatal mortality and morbidity in population cohort studies of 5697 very preterm infants from 19 regions in 11 European countries (Wilson 2016), as well as 9833 infants at < 33 weeks' gestation in Canadian NICUs (Lyu 2015). Use of mixed‐effects generalised adjusted linear models revealed that an admission temperature < 35°C was associated with increased early (one to six days) neonatal death (risk ratio (RR) 2.41, 95% confidence interval (CI) 1.45 to 4.00) and late (7 to 28 days) neonatal death (RR 1.79, 95% CI 1.15 to 2.78) but showed no association after 28 days of life (Wilson 2016). Overall, for every 1°C rise in admission temperature, mortality fell by 15% (Wilson 2016). Lyu 2015 identified an admission temperature range (axillary or rectal) of 36.5°C to 37.2°C associated with the lowest rates of a composite mortality/morbidity outcome and with individual major morbidities (major brain injury, severe retinopathy of prematurity, bronchopulmonary dysplasia, necrotising enterocolitis, nosocomial infection/sepsis, and duration of ventilation). However, Wilson 2016 found no association between admission temperature and neonatal morbidity when adjusting analyses for obstetrical characteristics. These retrospective observational studies had several limiting factors, including lack of standardised practice for temperature measurement (site, timing, and instrument) and lack of data for potential confounding factors such as maternal temperature or use of humidified gases. Further investigation is needed to explore the pathways from admission hypothermia to mortality, and to ascertain whether hypothermia is a step in the causal pathway possibly via late sepsis (Laptook 2007), or, alternatively, whether hypothermia is a marker for illness and poorer outcomes by association rather than by causality.
Rapid postnatal fall in body temperature is attributable to a combination of physical characteristics (e.g. large surface area in relation to body weight and a thin layer of insulating fat) and environmental factors in the delivery room. Extent of total heat loss and the four modes of heat exchange (conduction, convection, radiation, and evaporation) are influenced by ambient air temperature, pressure and relative humidity, and temperature of surrounding surfaces (Capobianco 1980; Thomas 1994). Increased rate of heat loss is mainly caused by evaporation of amniotic fluid from the skin surface when the wet newborn moves from the warm environment of the uterus into a cool, dry delivery room (Adamson 1965a; Hammarlund 1980). To maintain core body temperature within the normal range of 36.5°C to 37.5°C (skin temperature of 0.5°C to 1.0°C lower) (Hey 1970; Oliver 1965), the term infant produces heat from breakdown of brown fat (non‐shivering thermogenesis) and peripheral vasoconstriction (Davis 1980; Stern 1970). When skin temperature falls to 35°C to 36°C, non‐shivering thermogenesis is initiated (Bruck 1961). The WHO classifies a core body temperature for newborns from 36°C to 36.4°C as mild hypothermia, from 32°C to 35.9°C as moderate hypothermia, and < 32°C as severe (WHO 1997). Preterm infants have the combined disadvantages of a large surface area in relation to body weight, decreased fat for heat production and insulation, decreased glycogen stores, immature skin, which increases water loss, and poor vascular control. They experience even higher evaporative heat losses than term infants on the first day, especially at low ambient relative humidity (Hammarlund 1979). For each millilitre of water that evaporates from the skin, 560 calories of heat is lost (Rutter 2000). Currently, no formal definition of 'normal' temperatures for preterm infants is accepted, and methods and accuracy of temperature measurement continue to be debated (Bailey 2000; Smith 2004; Smith 2013a).
The external (skin environment) temperature gradient is pivotal in influencing the infant's response to cold (Adamson 1965); here the healthcare professional can intervene in the delivery room to minimise the risk of hypothermia. Standard care includes ensuring a warm delivery room at a minimum of 25°C (WHO 1997), drying the infant thoroughly immediately after birth (especially the head) (Bloom 1994), removing any wet blankets, wrapping in a prewarmed blanket, prewarming any contact surfaces, eliminating draughts, and maintaining close proximity to outside walls (Capobianco 1980). If available, radiant warmers for resuscitation and stabilisation allow easy access and are effective in preventing heat loss, provided the infant is immediately dried and placed under the prewarmed heater (Dahm 1972; Du 1969). Although the infant gains heat via radiation, potential losses through convection and evaporation are increased, and these losses are exacerbated if drying is inadequate. Servo‐control is advantageous for avoidance of overheating or underheating if absorption of heat is obstructed by coverings. Since this review was first published (McCall 2005), standard thermal care has evolved, and emerging research evidence encompasses several other preventive measures that were originally considered to exceed routine management.
In practice, achieving optimal ambient delivery room temperatures for preterm infants may prove difficult (Chitty 2013; Knobel 2005a). Reilly 2015 reported that 86% of infants enrolled in the multi‐centre Heat Loss Prvention (HeLP) trial were initially resuscitated in delivery room ambient temperatures ≤ 25°C. In a small randomised controlled trial (RCT) (N = 91) conducted in Eastern China (Jia 2012), researchers found that mean core body temperature was significantly higher in infants at ≤ 32 weeks' gestation who were born in a warm room (ambient temperature range 24°C to 26°C; mean (standard deviation ‐ SD) 25.1 (0.6)) compared with those born in regular rooms (ambient temperature set at 20°C to 23°C; mean (SD) 22.5 (0.6)). This increase in ambient temperature was associated with a 0.5°C higher mean NICU admission temperature and a 31.9% reduction in the rate of hypothermia. However, this study excluded use of additional thermal care interventions, resulting in a high rate of hypothermia even in warm rooms. Another larger RCT (N = 825 infants) determined that an increase in ambient operating room temperature to 23°C (in addition to gestation‐specific thermal care practices) at the time of caesarean delivery reduces the rate of neonatal hypothermia (core body temperature < 36.5°C) on arrival to the admitting nursery compared with the standard temperature of 20°C (35% vs 50%; P < 0.001) (Duryea 2016). Data also show a trend towards increased hyperthermia (core body temperature ≥ 38.0°C) in the intervention group. Hypothermia was less frequent at lower gestations because these infants received additional preventive measures such as plastic poncho and cap (< 32 weeks' gestation) and warmed gel mattresses (< 28 weeks' gestation). For preterm infants (n = 147), data show no differences in rates of hypothermia and hyperthermia between groups. Ninety‐three per cent of 62 surgeons stated that ambient temperatures of 23°C would be considered acceptable if improvement in neonatal outcomes could be demonstrated. Bhatt 2007 recommended that all delivery rooms should be fitted with individual thermostat and humidity controls to allow adjustment for preterm delivery by gestational age and birth weight. This supports recent American Heart Association (AHA), European Resuscitation Council (ERC), and International Liaison Committee on Resuscitation (ILCOR) guidance on temperature maintenance in the delivery room (Perlman 2015). For preterm infants at < 32 weeks' gestation under radiant warmers, a combination of interventions is recommended, which may include ambient temperature of 23°C to 25°C as recommended by Perlman 2015 and delivery room temperature above 25°C for preterm infants at < 28 weeks' gestation as recommended by Wyllie 2015. However, in practice, even with a thermostat, it may not be possible to effectively change the delivery room temperature in time for a delivery.
Description of the intervention
For the purposes of this review, studies to investigate the effectiveness of additional measures to reduce heat loss in the immediate postnatal period fall into two main groups.
-
Barriers to heat loss.
-
External heat sources.
Interventions in the first group focus mainly on reducing evaporative heat losses (LeBlanc 1991); they include wraps and/or head coverings made from a variety of materials (Chaput 1979; Coles 1979; Holzman 1985; Lang 2004). Baum 1968 tested a polyester suit lined with aluminium, known as the 'silver swaddler', which was designed to prevent hypothermia by reducing all modes of heat transfer to the environment. This was effective for infants with birth weight > 3000 grams, but because the material is opaque, it is not practical for use during resuscitation. Transparent plastic coverings such as bubble wrap (Besch 1971), as well as single‐layer gowns (Hobbs 1975), are effective in the delivery room for full‐term healthy newborns and those with birth weight > 2000 grams, respectively. Use of an occlusive polyethylene transparent wrap or bag immediately at birth improved admission temperatures in non‐randomised studies of infants at < 27 weeks' gestation (Bredemeyer 2005), between 28 and 30 weeks (marginal below 28 weeks) (Ibrahim 2009), and at < 33 weeks' gestation (Lenclen 2002), as well as in very low birth weight infants and extremely low birth weight infants when compared with routine care (Abd‐El Hamid 2012; Carroll 2010). Investigators have also used hoods or heat shields that are not in contact with the infant's body, in conjunction with a radiant warmer or incubator (Baumgart 1981; Bell 1980). Researchers have used barrier creams, waxes, and protective films such as Aquaphor to reduce heat loss in immature infants, but these substances normally are not applied within 10 minutes of birth (Nopper 1996).
Interventions in the second group include heated mattresses and the more inherent approach of skin‐to‐skin care (SSC) or kangaroo mother care (KMC). Low‐cost heated‐water‐filled cot mattresses have been shown to be as effective as air‐heated incubators in healthy preterm and/or low birth weight infants (Gray 2004; Green‐Abate 1994; Sarman 1989; Sarman 1992), and as effective as space‐heated rooms in low‐resource settings (Green‐Abate 1994); they are also effective in decreasing hypothermia during transport of very low birth weight infants (L'Herault 2001). More recently, exothermic chemical gel (sodium acetate) mattresses have been utilised during newborn resuscitation and stabilisation of preterm infants (Almeida 2009; Ibrahim 2010; Pinheiro 2011). These mattresses emit latent heat of crystallisation when activated (Carmichael 2007). The Transwarmer mattress was tested in vitro, and investigators stressed the importance of activation before use to avoid unnecessary heat losses that may occur as a consequence of placing an infant on a non‐activated mattress (McCarthy 2012). During 'immediate birth or very early skin‐to‐skin' contact, the infant is placed on the mother's chest or abdomen during the first minute after birth and suctioned, and, if well enough, the infant is thoroughly dried and placed in a light blanket. A hat may be placed on the infant's head to minimise heat loss (Moore 2016). The benefits of uninterrupted skin‐to‐skin contact immediately after birth are well documented and include improvements in thermal control and physiological stability; however, SSC has been focussed primarily on healthy term infants or poststabilisation preterm and/or low birth weight infants (Boundy 2016; Britton 1980; Christensson 1992; Phillips 2013). Of 86 studies included in a recent systematic review (RCTs and observational studies) that documented initiation time of SSC, only seven (8%) reported initiation immediately after birth, and 41 (48%) presented stability criteria for initiation (Boundy 2016). Fourteen studies that initiated SSC only after stabilisation, or when other criteria were met, reported temperature as a continuous outcome; two studies did not provide information on timing of initiation. Mean body temperature was significantly higher in the intervention group compared with the control group (14 studies; mean difference (MD) 0.24°C; 95% CI 0.15 to 0.33), although heterogeneity was high. This effect was similar for preterm (< 37 weeks' gestation) and low birth weight (< 2500 grams) infant subgroups. KMC significantly reduced the risk of hypothermia compared with conventional care (typical RR 0.22, 95% CI 0.12 to 0.41; nine studies). In a small study comprising 26 infants at ≤ 26 weeks' gestation (postnatal age two to nine days), Karlsson 2012 demonstrated that SSC can be safely initiated and facilitates temperature control during the first week of life, even among those receiving intensive care. A recent cohort of 90 moderately preterm infants at 32 to 34 weeks' gestation in Norway prospectively assessed the feasibility and safety of early SSC in the delivery room after vaginal birth compared with immediate transfer to the NICU in a conventional incubator (Kristoffersen 2016). Data show no statistically significant temperature differences between the two groups at 30 minutes after birth. However, this study was at risk of bias owing to differences in measurement sites for temperature (SSC (rectal) and incubator (axillary)) and underpowering of the study. Nevertheless, investigators implemented SSC immediately after birth with no additional resources and found SSC to be both feasible and safe for this group of infants.
In recent years, several studies have focussed on new strategies devised to maintain preterm infants' warmth at birth, such as use of humidified air during respiratory support to improve admission temperatures. In 2010, te Pas and colleagues, in a small, prospective observational cohort study, demonstrated a reduction in moderate hypothermia (core body temperature < 36°C) in the heated group (53% vs 19%; P < 0.001) among infants at ≤ 32 weeks' gestation. Trial authors recommended further research to assess short‐ and long‐term outcomes and cost versus benefit (te Pas 2010). The bench test study Shearman 2012, which also emphasised the need for more research into safety issues pertaining to heating and humidifying gas at resuscitation, supported this decision before any other clinical trials were initiated. Subsequently, a more recent RCT (N = 203) assessed the effect on admission temperature of adding heated humidified gases (HHGs) during respiratory support at birth and during transport of infants at < 32 weeks' gestation (Meyer 2015). Standard thermal care employed at the time of the study included warm delivery rooms (25°C to 26°C), preheated radiant warmer surfaces, occlusive body wrap (without drying), and placement of hats. This study showed that use of HHG appeared to be safe and possibly beneficial for infants at < 28 weeks' gestation. Fewer infants (31%) in the HHG group had temperatures outside the normothermic range (36.5°C to 37.5°C) compared with infants in the cold, dry gas group (58%) (P = 0.03). Similarly, McGrory 2017 conducted an RCT (N = 273) at two Australian centres to assess whether use of HHG during stabilisation of infants at < 30 weeks' gestation decreases hypothermia rates at NICU admission (core body temperature < 36.5°C). A significant reduction in admission hypothermia (27% in the HHG group vs 43% in the control group) was reported without an overall increased risk of hyperthermia (core body temperature > 37.5°C), although the trend towards an increased incidence of hyperthermia for lower gestations in the HHG group suggests the need for caution and careful temperature monitoring. McGrory 2017 also noted the need to balance benefits, costs, and risks of introducing an additional piece of delivery room equipment and indicated that consideration should be given to other low‐cost interventions such as increasing ambient temperature or using exothermic mattresses.
All these interventions have potential disadvantages, for example, Newton 2003 reported that significantly more infants (at < 30 weeks' gestation) wrapped in polyethylene bags were hyperthermic ( > 37°C) when compared with unwrapped historical control infants. Brun 1997 noted that use of a chemical hot pack during resuscitation of a newborn infant resulted in third‐degree burns, and recommended that these should not be used unless the peak temperature of the pack is < 44°C. McCarthy 2011 and McCarthy 2013 reported that in infants at < 31 weeks' gestation, using an exothermic mattress as well as a polyethylene bag caused increased hyperthermia on admission to the NICU when compared with only placing infants in polyethylene bags. Ibrahim 2010 reported a higher incidence of admission hyperthermia (usually transient) associated with use of acetate gel mattresses in combination with polyethylene bags at resuscitation in preterm infants at < 28 weeks' gestation. However, Pinheiro 2011 concluded that chemical warming packs added to plastic wrapping are useful for reducing hypothermia during stabilisation of very low birth weight infants without producing significant hyperthermia, and that their usefulness outweighs any potential rare adverse effects such as focal skin injury. Increasingly, these interventions are used in combination, and it is imperative that clinicians carefully monitor infant temperatures to avert harm, because hyperthermia also increases risks of neonatal mortality and morbidity (Perlman 2015).
How the intervention might work
Interventions to reduce hypothermia at birth should decrease total heat losses or should provide external heat without compromising accessibility during resuscitation; these interventions should have minimal side effects (such as hyperthermia, burns, maceration, or infection).
Why it is important to do this review
Neonatal hypothermia after birth remains a worldwide issue across all climates (Costeloe 2000; Lunze 2013; NNAP 2016; VON 2017), as well as all levels of income (Ali 2012; Christensson 1988; Jaleel 2011; Johanson 1992; Kumar 2009; Laptook 2007; Tafari 1973), and, if prolonged, can lead to harm. Over 50 years ago, Silverman 1958 and Day 1964 showed that reducing heat losses in preterm infants in the first few days after birth increased survival rates. The association of hypothermia with neonatal mortality and adverse clinical outcomes is well known. Early intervention in the delivery room, particularly for preterm infants undergoing resuscitation (Laptook 2008), is therefore a matter of high priority if hypothermia is to be prevented. Soll 2008 re‐emphasised the need to address and understand the consequences of poor thermal care for the newborn to improve clinical outcomes. Cordaro 2012 suggested that admission hypothermia in low birth weight preterm infants is not a "complication of prematurity; it is a consequence of healthcare provider inattentiveness." Current concerted and collaborative efforts to reduce the incidence of hypothermia on admission to neonatal units have included rapid cycle quality improvement initiatives and implementation of 'intervention bundles', such as staff education, checklists, consistent room air temperature, use of polyethylene bags or caps and thermal mattresses, and transfer in a warmed incubator (Arrindell 2012; Caldas 2017; DeMauro 2013; Harer 2017; Ho 2007; Kaplan 2009; Kumar 2012; Lee 2008; Lewis 2011; Silvestri 2012; Yip 2017). Manai 2013 reported that the rate of admission hypothermia in preterm low birth weight infants was reduced from 44% to 0% within a two‐year period at a regional NICU in San Jose. This study applied a multi‐disciplinary, standardised, evidence‐based thermal management approach before delivery and through NICU admission, implemented via the rapid cycle Plan‐Do‐Study‐Act quality improvement method. Additional studies in high‐income settings adopting this approach have reported comparable successes in prevention of hypothermia without incurring hyperthermia or other adverse complications (Pearlman 2012; Pinheiro 2011; Pinheiro 2014; Russo 2014). The primary objective of adopting evidence‐based thermal care practices during stabilisation and transfer to the NICU is to achieve and maintain normothermia while avoiding both iatrogenic hypothermia and hyperthermia (McCall 2014). Therefore, this review provides healthcare professionals with a critical appraisal of available evidence, with focus on individual or combinations of interventions applied within 10 minutes after birth in the delivery room, and is limited to preterm and/or low birth weight infants because these infants are most susceptible to adverse effects of hypothermia. Longer‐term thermal management and spatial or environmental strategies for increasing warming are beyond the scope of this review, which provides an update of a Cochrane Review first published as McCall 2005, and later updated in McCall 2008 and McCall 2010.
Objectives
Primary
To assess the efficacy and safety of interventions designed for prevention of hypothermia in preterm and/or low birth weight infants applied within 10 minutes after birth in the delivery room, compared with routine thermal care or any other single/combination of intervention(s) also designed for prevention of hypothermia in preterm and/or low birth weight infants applied within 10 minutes after birth in the delivery room.
Secondary
To assess effects of these interventions on complications associated with preterm birth, hypothermia, and adverse outcomes.
Methods
Criteria for considering studies for this review
Types of studies
All trials using randomised or quasi‐randomised allocation to test a specific intervention(s) designed to prevent hypothermia immediately after birth.
Types of participants
Preterm infants at < 37 weeks' gestation (according to best obstetrical estimate at time of delivery) or low birth weight infants weighing ≤ 2500 grams, for whom intervention(s) to prevent hypothermia is/are applied within 10 minutes after birth in the delivery room. These infants and small‐for‐gestation infants were eligible for inclusion.
Excluded were Infants with major congenital malformations, especially abdominal wall defects.
Types of interventions
Any intervention(s) applied within 10 minutes after birth in the delivery room apart from ROUTINE THERMAL CARE, which was defined as any of the following routine practices: providing a warm delivery room (at a minimum temperature of 25°C ‐ rarely achieved in practice), drying the infant immediately after birth, removing wet blankets and wrapping in a prewarmed blanket, prewarming any contact surfaces, avoiding draughts, and, in developed countries (The World Bank 2016), using radiant warmers or incubators.
We studied the following interventions.
-
Barriers to heat loss applied to any part of the body of the preterm and/or low birth weight infant within 10 minutes after birth in the delivery room.
-
-
Coverings such as transparent plastic wraps and bags made of low‐density polyethylene (LDPE) or linear low‐density polyethylene (LLDPE) or polyvinylidene chloride (PVDC).
-
Semipermeable membranes such as Opsite or Tegaderm.
-
Other additional swaddling materials or wraps (excluding delivery room blankets) such as the 'silver swaddler'.
-
-
External heat sources (non‐routine) initiated within 10 minutes after birth in the delivery room.
-
-
Skin‐to‐skin care.
-
Heated/gel/chemical mattresses.
-
Types of outcome measures
Primary outcomes
-
Temperature of the infant taken on admission to the neonatal intensive care unit (NICU) or up to two hours after birth. We assessed temperature as both continuous and dichotomous variables.
-
-
We accepted rectal, axillary, oral, or tympanic temperature measurements as equivalent core body temperature, and we accepted abdominal skin temperature for skin temperature. When both core temperature and skin temperature were recorded, core temperature took priority. When multiple temperatures were recorded (i.e. within different time frames up to two hours after birth), the lowest temperature recorded took priority.
-
A core body temperature < 36.5°C or a skin temperature < 36°C indicated the presence of hypothermia within control and intervention groups.
-
For hypothermia, we used core body temperature and skin temperature subgroupings as defined by WHO 1997 to determine three levels of severity.
-
-
-
-
Mild hypothermia or cold stress: core body temperature 36°C to 36.4°C, or skin temperature 35.5°C to 35.9°C.
-
Moderate hypothermia: core body temperature 32°C to 35.9°C, or skin temperature 31.5°C to 35.4°C.
-
Severe hypothermia: core body temperature < 32°C, or skin temperature < 31.5°C.
-
-
Secondary outcomes
We categorised these outcomes as morbidity and as adverse outcomes due to the intervention.
Morbidity
-
Hypoglycaemia (defined by a blood glucose level < 2.0 mmol/L within two hours of birth)
-
Respiratory distress syndrome (RDS) (defined by clinical signs of grunting, flaring, retractions, cyanosis in room air, tachypnoea and a radiological picture of reticulogranular mottling, and air bronchogram)
-
Surfactant given at any time
-
Intubation in the delivery room
-
Requirement for ventilation and duration of ventilation (days)
-
Length of stay (days)
-
Mortality: death within seven days, death within 28 days, and/or death during hospital stay
-
Severe metabolic acidosis (defined by a pH < 7.20 and/or a base deficit > 10 mmol/L within the first three days of life)
-
Intraventricular haemorrhage (defined according to the criteria of head ultrasonography performed before 14 days of life) (Lee 2000; Papile 1978)
-
Patent ductus arteriosus (defined by clinical diagnosis + treatment with indomethacin or ibuprofen or surgical ligation, or both) (Lee 2000)
-
Chronic lung disease (defined by oxygen dependency at 36 weeks' postmenstrual age for an infant born at ≤ 32 weeks' gestation) (Lee 2000; Shennan 1988)
-
Necrotising enterocolitis (defined according to the criteria of Bell 1978 as stage 2 or higher and classified as medical (clinical symptoms and signs + evidence of pneumatosis on abdominal radiographs), or according to the criteria of Lee 2000 and classified as surgical (histological evidence of NEC on surgical specimen of intestine))
-
Acute renal failure (defined by Stapleton 1987 as a serum creatinine level > 1.5 mg/dL (> 130 μmol/L) and oliguria (urine output < 1 mL/kg/h))
Adverse outcomes due to the intervention
-
Hyperthermia (defined as temperature on admission to NICU or within two hours of birth ≥ 38°C)
-
Burns within three days of birth
-
Maceration within three days of birth
-
Skin or systemic infection secondary to intervention within the first week of birth (defined by a culture of pathogenic bacteria from normally sterile body tissue or fluid)
-
Antibiotic course of five days or longer started within the first seven days of birth
-
Interference with resuscitation and other practices (e.g. umbilical vein catheter placement for fluid replacement, chest tube insertion)
-
Fluid problems such as dehydration or fluid overload, electrolyte imbalance such as hypernatraemia (serum sodium > 150 mmol/L) or hyponatraemia (< 130 mmol/L)
-
Any other unexplained adverse outcome attributed to the intervention within seven days of birth
-
Negative psychological outcomes (perception of care by parents)
Search methods for identification of studies
We used the standard Cochrane search strategy (Higgins 2011).
Electronic searches
We used the criteria and standard methods of Cochrane and the Cochrane Neonatal Review Group (see the Cochrane Neonatal Group search strategy for specialized register). We conducted a comprehensive search that included the following.
-
Cochrane Central Register of Controlled Trials (CENTRAL; 2016, Issue 5) in the Cochrane Library.
-
MEDLINE via PubMed (1966 to 30 June 2016).
-
Embase (1980 to 30 June 2016).
-
Cumulative Index to Nursing and Allied Health Literature (CINAHL; 1982 to 30 June 2016).
We have detailed the MEDLINE search strategy in Appendix 1. We devised similar search strategies using appropriate terminology for each electronic database plus database‐specific limiters for RCTs and neonates (see Appendix 2 for full search strategies for each database). We applied no language restrictions.
We searched clinical trials registries for ongoing and recently completed trials.
-
US National Institutes of Health Database (clinicaltrials.gov).
-
World Health Organization International Trials Registry and Platform (www.whoint/ictrp/search/en/).
-
International Standard Randomised Controlled Trial Number Registry (ISRCTN Registry).
In addition, we searched the following databases.
-
Online Computer Library Center (OCLC) WorldCat (January 2013).
-
Database of Abstracts of Reviews of Effects (DARE) (1994 to January 2013).
-
Conference/symposia proceedings via the British Library's Electronic Table of Contents (ZETOC) (1993 to January 2013).
-
International Statistical Institute (ISI) proceedings (1990 to January 2013).
We conducted the current update of this review in two phases.
-
Phase one: search end date January 2013.
-
Phase two: search end date June 2016.
After consultation with the Cochrane Neonatal Review Group, we restricted phase two to full manuscripts of RCTs published in the English language; therefore publication and language bias cannot be ruled out.
Searching other resources
We handsearched the reference lists of any articles selected for inclusion in this review to identify additional relevant articles.
Data collection and analysis
We followed the standard Cochrane method for conducting a systematic review, as described in the Cochrane Handbook for Systematic Reviews of Interventions (Higgins 2011).
Selection of studies
We designed the search strategy and searched electronic databases in association with Faculty Librarians at Queen's University Belfast. Two independent review authors (EC, FA) separately assessed the full list of titles and abstracts for eligibility and retrieved the full text of those considered relevant. Each review author clearly stated reasons for exclusion of studies. One included study required formal translation into English language (Farhadi 2012). We documented the selection process using a PRISMA flow chart (see Figure 1). We produced a Characteristics of included studies table for each study considered eligible for inclusion, as well as a Characteristics of excluded studies table for each study excluded after examination (we included the reason for exclusion).

Study flow diagram: review update.
Data extraction and management
Two independent review authors (EC, FA) separately extracted, assessed, and coded all data for each study using a form that was designed specifically for this review. We replaced any standard error of the mean with the corresponding standard deviation. We resolved disagreements by discussion and corresponded with study investigators regarding further methodological data and results, as required. We extracted important information with respect to trial characteristics, participant characteristics, intervention characteristics, and outcome measures.
Assessment of risk of bias in included studies
Two independent review authors (EC, FA) separately assessed studies that fulfilled the criteria for inclusion for risk of bias and extracted data using prepared proformas. We judged risk of bias according to the six domains outlined in the risk of bias tool provided in the Cochrane Handbook for Systematic Reviews of Interventions (Higgins 2011).
-
Random sequence generation.
-
Allocation concealment.
-
Blinding of participants and healthcare providers/personnel.
-
Blinding of outcome assessors.
-
Incomplete outcome data.
-
Selective reporting.
-
Other potential threats to validity.
Team members reached complete agreement and sought additional information from investigators for 18 included trials (Bhavsar 2015; Caglar 2014; Cardona Torres 2012; Chantaroj 2011; Farhadi 2012; Gathwala 2010; Knobel 2005; Leadford 2013; Leslie 2007; Mathew 2012; McCarthy 2013; Reilly 2015; Rohana 2011; Smith 2013; Tescon‐delos Santos 2012; Trevisanuto 2010; Vohra 1999; Vohra 2004). We did not blind review authors to authors nor to institutions. In three instances, a team member was also an author of a selected trial, so we excluded that team member from the study appraisal process. We detailed the methodological information retrieved in the Characteristics of included studies tables.
In addition, we assessed the following issues and entered our findings into the 'Risk of bias' table.
Selection bias (random sequence generation and allocation concealment)
For each included trial, we planned to categorise the risk of selection bias as follows.
Random sequence generation
-
Low risk: Investigators describe a random component in the sequence generation process, such as referring to a random number table, using a computer random number generator, tossing a coin, shuffling cards or envelopes, throwing dice, drawing lots, or minimising.
-
High risk: Investigators describe a non‐random component in the sequence generation process such as sequence generated by odd or even date of birth, sequence generated by some rule based on date or day of admission, sequence generated by some rule based on hospital or clinic record number, allocation by judgement of the clinician, allocation by preference of the participant, allocation based on the results of a laboratory test or series of tests, or allocation by availability of the intervention.
-
Unclear risk: No or unclear information is provided.
Allocation concealment
For each included trial, we planned to categorise risk of bias regarding allocation concealment as follows.
-
Low risk: Participants and investigators enrolling participants could not foresee assignment because one of the following, or an equivalent method, was used to conceal allocation: central allocation (including telephone, web‐based, and pharmacy‐controlled randomisation), sequentially numbered drug containers or identical appearance, or sequentially numbered sealed opaque envelopes.
-
High risk: Participants and investigators enrolling participants could possibly foresee assignments and thus introduce selection bias, such as allocation based on open random allocation schedule (e.g. a list of random numbers), unsealed or non‐opaque envelopes, alternation or rotation, date of birth, or case record number.
-
Unclear risk: No or unclear information is provided.
Blinding (performance bias)
For each included trial, we planned to categorise the methods used to blind study personnel from knowledge of which intervention a participant received.
-
Low risk: Investigators describe no blinding or incomplete blinding, but review authors judge that the outcome is not likely to be influenced by lack of blinding; blinding of participants and of key study personnel is ensured, and it is unlikely that blinding could have been broken.
-
High risk: Investigators describe no blinding or incomplete blinding, and the outcome is likely to be influenced by lack of blinding; blinding of key trial participants and personnel is attempted, but it is likely that blinding could have been broken, and the outcome is likely to be influenced by lack of blinding.
-
Unclear risk: No or unclear information is provided.
Blinding (detection bias)
For each included trial, we planned to categorise the methods used to blind outcome assessors from knowledge of which intervention a participant received.
-
Low risk: Investigators describe no blinding or incomplete blinding, but review authors judge that the outcome is not likely to be influenced by lack of blinding; blinding of participants and of key study personnel is ensured, and it is unlikely that blinding could have been broken.
-
High risk: Investigators describe no blinding of outcome assessment, but review authors judge that the outcome measurement is not likely to be influenced by lack of blinding; blinding of outcome assessment is ensured, but it is likely that blinding could have been broken, and the outcome measurement is likely to be influenced by lack of blinding.
-
Unclear risk: No or unclear information is provided.
Incomplete outcome data (attrition bias)
For each included trial and for each outcome, we planned to describe the completeness of data including attrition and exclusions from the analysis.
-
Low risk.
-
No missing outcome data.
-
Reasons for missing outcome data unlikely to be related to true outcome (for survival data, censoring unlikely to introduce bias).
-
Missing outcome data balanced in numbers across intervention groups, with similar reasons for missing data across groups.
-
For dichotomous outcome data, the proportion of missing outcomes compared with observed event risk is not enough to have a clinically relevant impact on the intervention effect estimate.
-
For continuous outcome data, plausible effect size (difference in means or standardised difference in means) among missing outcomes is not enough to have a clinically relevant impact on observed effect size.
-
-
Missing data have been imputed by appropriate methods.
-
-
High risk.
-
Reason for missing outcome data likely to be related to true outcome, with imbalance in numbers or reasons for missing data across intervention groups.
-
For dichotomous outcome data, proportion of missing outcomes compared with observed event risk enough to induce clinically relevant bias in intervention effect estimate.
-
For continuous outcome data, plausible effect size (difference in means or standardised difference in means) among missing outcomes enough to induce clinically relevant bias in observed effect size.
-
-
"As‐treated" analysis done with substantial departure of the intervention received from that assigned at randomisation.
-
Potentially inappropriate application of simple imputation.
-
-
Unclear risk: No or unclear information is provided.
Selective reporting (reporting bias)
For each included trial, we planned to describe how we investigated the risk of selective outcome reporting bias and what we found. We planned to access all protocols of included trials through clinical trials registries (clinicaltrials.gov; controlled‐trials.com; who.int/ictrp) and through direct contact with trial authors.
We planned to assess methods as follows.
-
Low risk: Study protocol is available and all of the trial's prespecified (primary and secondary) outcomes of interest in the review have been reported in the prespecified way; or study protocol is not available but it is clear that published reports include all expected outcomes, including those that were prespecified (convincing text of this nature may be uncommon).
-
High risk: Not all of the trial's prespecified primary outcomes have been reported; one or more primary outcomes is reported via measurements, analysis methods, or subsets of data (e.g. subscales) that were not prespecified; one or more reported primary outcomes were not prespecified (unless clear justification for their reporting is provided, such as an unexpected adverse effect); one or more outcomes of interest in the review are reported incompletely so they cannot be entered into a meta‐analysis; or the study report fails to include results for a key outcome that would be expected to have been reported for such a trial.
-
Unclear risk: No or unclear information is provided (study protocol was not available).
Other potential sources of bias (other bias)
For each included trial, we planned to describe any important concerns that we had about other possible sources of bias (e.g. whether a potential source of bias is related to the specific study design used).
We planned to assess whether each trial was free of other problems that could put it at risk of bias.
-
Low risk: Trial appears to be free of other sources of bias.
-
High risk: Trial has at least one important risk of bias (e.g. trial had a potential source of bias related to the specific study design used or has been claimed to have been fraudulent or had some other problem).
-
Unclear risk: Risk of bias may be present, but information is insufficient to assess whether an important risk of bias exists, or rationale or evidence that an identified problem will introduce bias is insufficient.
Measures of treatment effect
We calculated risk ratios (RRs) and 95% confidence intervals (CIs) for dichotomous outcomes. From the risk difference (RD), we calculated the number needed to treat for an additional beneficial outcome (NNTB) or the number needed to treat for an additional harmful outcome (NNTH) along with 95% confidence limits. We calculated mean differences (MDs) and 95% confidence limits for continuous outcomes.
Unit of analysis issues
The unit of analysis was the participating infant in individually randomised trials. When a trial had multiple arms, we assigned each comparison, if independent, to the appropriate separate comparison group for meta‐analysis. We found no cluster‐randomised trials, but they are eligible for inclusion. Planned analyses would include adjusting sample sizes using the methods described in the Cochrane Handbook for Systematic Reviews of Interventions (Section 16.3.4 or 16.3.6) (Higgins 2011) along with an estimate of the intracluster correlation coefficient (ICC) derived from the trial, from a similar trial, or from a study of a similar population. We would perform a subgroup analysis to investigate effects of the randomisation unit if feasible.
Dealing with missing data
We contacted trial authors regarding missing data (methodological data, outcome data for subgroups, and missing data, such as standard deviations) via a number of strategies, namely, the contact email address provided on the published manuscript, "Researchgate" (ResearchGate 2016), and institutional email addresses. We excluded studies to the Characteristics of excluded studies table or assigned them to the Characteristics of studies awaiting classification table when we had insufficient information to determine the study design and efforts to contact trial authors were unsuccessful.
Assessment of heterogeneity
We estimated treatment effects of individual trials and examined heterogeneity between trials by inspecting forest plots and quantifying the impact of heterogeneity using the I² statistic: low (> 25% and < 50%), moderate (≥ 50% and < 75%), and high (≥ 75%) (Higgins 2003). If we detected substantial statistical heterogeneity, we explored possible causes (e.g. differences in study quality, participants, intervention regimens, or outcome assessments) by performing post hoc subgroup analyses.
Assessment of reporting biases
We assessed the symmetry of funnel plots for publication bias when we included 10 or more trials in a meta‐analysis. When possible, we investigated the possibility of reporting bias for included studies by comparing the primary and secondary outcomes reported in full manuscripts with prespecified outcomes as published in study protocols or in online clinical trials registers (US National Institutes of Health Database, available at http://ClinicalTrials.gov; International Standard Randomised Controlled Trial Number Registry, available at http://controlled‐trials.com; World Health Organization International Trials Registry and Platform, available at http://apps.who.int/trialsearch/).
Data synthesis
We performed meta‐analysis using Review Manager software version 5.3 (RevMan 2014) as supplied by Cochrane. For estimates of typical risk ratio and risk difference, we used the Mantel‐Haenszel method. For measured quantities, we used the inverse variance method. We performed all meta‐analyses using the fixed‐effect model.
Quality of evidence
We used the Grading of Recommendations Assessment, Development and Evaluation (GRADE) approach, as outlined in the GRADE Handbook (Schünemann 2013), to assess the quality of evidence for the following (clinically relevant) outcomes for the main comparison group.
-
Core body temperature (°C) on admission to NICU or up to two hours after birth.
-
Hypothermia on admission to NICU: core body temperature < 36.5°C or skin temperature < 36°C.
-
Core body temperature (°C) one hour after initial NICU admission temperature was taken.
-
Hyperthermia on admission to NICU: core body temperature > 37.5°C.
-
Major brain injury within hospital stay.
-
Pulmonary haemorrhage within hospital stay.
-
Mortality (death within hospital stay or at six months' corrected gestation).
Two independent review authors (EM, FA) and a statistician (MS) assessed the quality of evidence for each of the outcomes listed above. We considered evidence from RCTs as high quality but downgraded the evidence one level for serious (or two levels for very serious) limitations on the basis of the following: design (risk of bias), consistency across studies, directness of evidence, precision of estimates, and presence of publication bias. We used the GRADEpro Guideline Development Tool (GRADEpro GDT) to create a ‘Summary of findings’ table to report the quality of the evidence.
The GRADE approach results in an assessment of the quality of a body of evidence according to one of four grades.
-
High: We are very confident that the true effect lies close to that of the estimate of the effect.
-
Moderate: We are moderately confident in the effect estimate: The true effect is likely to be close to the estimate of the effect, but there is a possibility that it is substantially different.
-
Low: Our confidence in the effect estimate is limited: The true effect may be substantially different from the estimate of the effect.
-
Very low: We have very little confidence in the effect estimate: The true effect is likely to be substantially different from the estimate of effect.
Subgroup analysis and investigation of heterogeneity
We planned to carry out subgroup analyses by intervention, by birth weight/gestational age, and by income grouping of the country of study, to determine whether effectiveness varies according to:
-
Interventions applied.
-
Birth weight and gestation within the following categories.
-
Birth weight (< 1500 grams; 1500 to 2500 grams).
-
Gestation (< 28 weeks; 28 to 32 weeks; 33 to 37 weeks).
-
We determined the income grouping for the country in which each included trial was conducted using the World Bank list of economies: low‐income, lower middle‐income, upper middle‐income, and high‐income (The World Bank 2016). "Low‐income and middle‐income economies are sometimes referred to as developing economies. The use of the term is convenient; it is not intended to imply that all economies in the group are experiencing similar development or that other economies have reached a preferred or final stage of development. Classification by income does not necessarily reflect development status" (The World Bank 2013).
However, the subgroups reported in the included studies were not compatible with those prespecified. Therefore, we carried out post facto subgroup analyses based on reported gestation and birth weight subcategories when appropriate within each comparison group.
Sensitivity analysis
We planned to explore the impact of the level of bias by undertaking sensitivity analyses. If needed, we planned to incorporate summary assessments of risk of bias into explicit measures of the quality of evidence using the GRADE system (GRADEpro GDT) for the primary outcome measure (core body temperature on admission to NICU or up to two hours after birth) and for key secondary outcome measures.
Results
Description of studies
See the Characteristics of included studies table, the 'Risk of bias' table (Figure 2), and Characteristics of excluded studies, Characteristics of studies awaiting classification, and Characteristics of ongoing studies tables.

Risk of bias summary: review authors' judgements about each risk of bias item for each included study.
Results of the search
Figure 1 shows the flow diagram for screening, selection, and assessment of studies generated by the 2009 to 2016 updated literature searches.
In the previous version of this review (McCall 2010), we included seven studies (Bergman 2004; Brennan 1996; Knobel 2005; Roberts 1981; Trevisanuto 2010; Vohra 1999; Vohra 2004), and we excluded 90 studies. One study was awaiting assessment (Punnahitananda 2008), and one study that was ongoing at that time ‐ Vohra 2004 [pers comm]) ‐ has since been completed and published (Reilly 2015).
For this update, we excluded Punnahitananda 2008 (see Characteristics of excluded studies table) and included Reilly 2015 (see Characteristics of included studies table). In addition, in the light of expansion of our inclusion criteria (i.e. to include comparisons with any other single/combination of intervention(s) also designed for prevention of hypothermia in preterm and/or low birth weight infants applied within 10 minutes after birth in the delivery room), we reassessed previously excluded studies and included two ‐ Mathew 2008 (subset) and NCT00603837 ‐ that have since been published in full (Mathew 2012; Simon 2011). We identified 25 new studies through our updated searches and after screening and assessment included 15 of them (Bhavsar 2015; Caglar 2014; Cardona Torres 2012; Chantaroj 2011; Chawla 2011; Doglioni 2014; Farhadi 2012; Gathwala 2010; Leadford 2013; Leslie 2007; McCarthy 2013; Rohana 2011; Smith 2013; Talakoub 2015; Tescon‐delos Santos 2012). We are awaiting further details from investigators on two additional studies (Ahmed 2013; Castro 2007), and on one study currently under review for publication (Nimbalkar 2015). We included these in the Characteristics of studies awaiting classification table. In addition, we classified seven studies as ongoing (CRTI/2014/11/005200; CTRI/2016/02/006673; ISRCTN13184012; NCT01604317; NCT02189746; NCT02250079; NCT02311972), details of which we provided in the Characteristics of ongoing studies table. We also excluded 43 new randomised or quasi‐randomised controlled trials and provided reasons for their exclusion in the Characteristics of excluded studies table. We excluded 27 non‐randomised studies but, as in previous versions of this review, did not include them in the Characteristics of excluded studies table.
Overall, building upon previous versions of this review (McCall 2005; McCall 2008; McCall 2010), we identified 35 studies, of which we included 25 (Bergman 2004; Bhavsar 2015; Brennan 1996; Caglar 2014; Cardona Torres 2012; Chantaroj 2011; Chawla 2011; Doglioni 2014; Farhadi 2012; Gathwala 2010; Knobel 2005; Leadford 2013; Leslie 2007; Mathew 2012; McCarthy 2013; Reilly 2015; Roberts 1981; Rohana 2011; Simon 2011; Smith 2013; Talakoub 2015; Tescon‐delos Santos 2012; Trevisanuto 2010; Vohra 1999; Vohra 2004); three studies are awaiting classification (Ahmed 2013; Castro 2007; Nimbalkar 2015), and seven studies are ongoing (CRTI/2014/11/005200; CTRI/2016/02/006673; ISRCTN13184012; NCT01604317; NCT02189746; NCT02250079; NCT02311972). One RCT recently published outside the current search dates became known to the review authors and is therefore also awaiting classification in the next update (Shafie 2017).
Included studies
In all, we included in this review 25 studies involving 2481 randomised infants (2433 completing the studies): two theses (Brennan 1996; Roberts 1981), 22 published manuscripts (Bhavsar 2015; Bergman 2004; Caglar 2014; Cardona Torres 2012; Chantaroj 2011; Chawla 2011; Doglioni 2014; Farhadi 2012; Gathwala 2010; Knobel 2005; Leadford 2013; Mathew 2012; McCarthy 2013; Reilly 2015; Rohana 2011; Simon 2011; Smith 2013; Talakoub 2015; Tescon‐delos Santos 2012; Trevisanuto 2010; Vohra 1999; Vohra 2004), and one conference abstract coupled with additional unpublished information received from trial authors (Leslie 2007).
Participants and settings
Investigators categorised participants by gestation (all preterm) in 17 studies (Caglar 2014; Chawla 2011; Doglioni 2014; Farhadi 2012; Knobel 2005; Leslie 2007; Mathew 2012; McCarthy 2013; Reilly 2015; Roberts 1981; Rohana 2011; Smith 2013; Talakoub 2015; Tescon‐delos Santos 2012; Trevisanuto 2010; Vohra 1999; Vohra 2004), by birth weight (all low birth weight) in two studies (Bergman 2004; Brennan 1996), and by both gestation and birth weight inclusion criteria in six studies (Bhavsar 2015; Cardona Torres 2012; Chantaroj 2011; Gathwala 2010; Leadford 2013; Simon 2011).
The upper gestational age eligibility criterion across studies was within the extremely preterm category (< 28 weeks' gestation) in two studies (Reilly 2015; Vohra 2004); within the very preterm category (28 to 31 weeks' gestation) in 10 studies (Chawla 2011; Doglioni 2014; Knobel 2005; Leslie 2007; Mathew 2012; McCarthy 2013; Simon 2011; Smith 2013; Trevisanuto 2010; Vohra 1999); within the moderately preterm category (32 to 33 weeks' gestation) in six studies (Caglar 2014; Chantaroj 2011; Gathwala 2010; Farhadi 2012; Rohana 2011; Talakoub 2015), and within the late preterm category (34 to 36 weeks' gestation) in five studies (Bhavsar 2015; Cardona Torres 2012; Leadford 2013; Roberts 1981; Tescon‐delos Santos 2012). Two additional studies with no gestational age criteria included infants weighing ≥ 1200 to ≤ 2199 grams and weighing ≤ 1500 grams, respectively (Bergman 2004; Brennan 1996). The most frequently reported exclusion criterion was congenital malformations, particularly neural tube defects, omphalocoele, gastroschisis, or other open lesions that would cause greater than normal heat loss at delivery.
Most included studies were single‐centred. Four studies were conducted at two or more participating centres, namely, Bergman 2004 and Talakoub 2015 (two centres), Doglioni 2014 (three centres), and Reilly 2015 (39 centres). Sample size ranged from 24 randomised (24 completing the study) in a small single‐centred study (Brennan 1996), to 813 randomised (801 completing the study) in a large multi‐centred study (Reilly 2015); median sample size across all studies was 62 randomised. Four studies were conducted in lower middle‐income countries: India (Bhavsar 2015; Gathwala 2010), Zambia (Leadford 2013), and the Phillippines (Tescon‐delos Santos 2012); and seven in upper middle‐income countries: South Africa (Bergman 2004), Mexico (Cardona Torres 2012), Thailand (Chantaroj 2011), Turkey (Caglar 2014), Iran (Farhadi 2012; Talakoub 2015) and Malaysia (Rohana 2011). All other studies took place in high‐income countries: USA (Brennan 1996; Chawla 2011; Knobel 2005; Mathew 2012; Roberts 1981; Simon 2011), Canada (Vohra 1999; Vohra 2004), Ireland (McCarthy 2013), Australia (Smith 2013), Italy (Doglioni 2014; Trevisanuto 2010), UK (Leslie 2007), and at multiple centres in high‐income countries (Reilly 2015).
Interventions
Interventions included in this review fall into three major groups: barriers to heat loss, external heat sources, and combinations of interventions.
-
Eleven comparisons (18 studies: 2121 infants randomised, 2080 completing the studies) fell within the barriers to heat loss category: plastic wrap or bag versus routine care (Cardona Torres 2012; Chantaroj 2011; Farhadi 2012; Gathwala 2010; Knobel 2005; Leadford 2013; Reilly 2015; Rohana 2011; Smith 2013; Talakoub 2015; Trevisanuto 2010; Vohra 1999; Vohra 2004), plastic wrap versus routine care during interhospital neonatal transport (Bhavsar 2015), plastic bag with previous drying versus routine care (Cardona Torres 2012), plastic cap versus routine care (no cap) (Trevisanuto 2010), plastic bag and plastic cap versus routine care (Talakoub 2015; Tescon‐delos Santos 2012), plastic bag with previous drying versus plastic bag without previous drying (Cardona Torres 2012), plastic cap versus plastic bag (Trevisanuto 2010), plastic bag versus plastic wrap (Caglar 2014), plastic total body wrap (body + head) versus plastic body wrap (head uncovered) (Doglioni 2014), plastic bag and plastic hat versus plastic bag and cotton hat (Talakoub 2015), and stockinet cap versus routine care (no cap) (Roberts 1981).
-
Two comparisons (three studies: 161 infants randomised,157 completing the studies) fell within the external heat sources category: skin‐to‐skin care versus routine care (Bergman 2004), and thermal mattress versus routine care (Brennan 1996; Chawla 2011).
-
Two comparisons (four studies: 199 infants randomised, 196 completing the studies) fell within the combinations of interventions category: thermal mattress versus plastic wrap or bag (Mathew 2012; Simon 2011), and plastic bag and thermal mattress versus plastic bag only (Leslie 2007; McCarthy 2013).
All interventions were applied immediately after birth in the delivery room. Available information indicates that all studies used a combination of external heat sources (radiant warmer/drop light, warmer table, transport incubator) and caps as part of routine thermal care (control group and/or intervention group). Three studies also employed plastic barriers or shields as part of routine care (Bergman 2004; Chantaroj 2011; Chawla 2011). Bergman 2004 compared skin‐to‐skin contact versus routine care. Infants in the routine care group were immediately transferred to a prewarmed servo‐controlled closed incubator, which remained with the mother in the delivery ward for the first hour. If the skin temperature became < 36°C, a cap and booties were applied and a heat shield was placed over the infant. If this was insufficient, a sheet of plastic was framed over the foot end of the heat shield and the outlet of warm air funnelled over the infant. Chawla 2011 compared thermal mattress versus routine care for infants at < 32 weeks' gestation. All infants received routine thermal care including hats and radiant warmers and were transported to the NICU in prewarmed incubators set at 37°C. In addition, infants at < 28 weeks' gestation were also placed without drying in a reclosable plastic bag below the neck. Chantaroj 2011 compared plastic bag versus routine care, and after initial stabilisation, infants in the routine care group were covered with a polyvinyl wrap as part of standard care before transfer to the NICU. With evolving routine thermal care throughout the lifetime of this review, more recent studies have considered the use of plastic wraps or bags applied immediately at birth as part of routine thermal care (e.g. Caglar 2014; Leslie 2007; McCarthy 2013). However, for the purpose of assigning included studies to a comparison group in this review, 'plastic wrap or bag' has remained an intervention/active comparator rather than being referred to as 'routine care', in keeping with the prespecified definition at the review protocol stage.
During two studies, researchers attempted to keep the ambient delivery room temperature at 26°C for preterm births (Chantaroj 2011; Knobel 2005). Investigators reported a range of routine delivery room ambient temperatures from a cool 20°C to 21°C (Farhadi 2012), through 24°C (Trevisanuto 2010), through 25°C (Leadford 2013), to a warm 26°C to 28°C (Tescon‐delos Santos 2012). Despite attempts to keep delivery room temperatures static, researchers reported ranges of 18°C to 31°C (Knobel 2005). We have provided full details of additional thermal care measures in the Characteristics of included studies table.
Outcomes
Four studies (Gathwala 2010; Mathew 2012; Talakoub 2015; Tescon‐delos Santos 2012) reported the primary outcome measure (temperature of the infant on admission to NICU or up to two hours after birth) as a continuous variable, one study as a dichotomous variable (derived from skin temperature in °C) (Bergman 2004), and the remaining 20 studies as both a continuous and a dichotomous variable (Bhavsar 2015; Brennan 1996; Caglar 2014; Cardona Torres 2012; Chantaroj 2011; Chawla 2011; Doglioni 2014; Farhadi 2012; Knobel 2005; Leadford 2013; Leslie 2007; McCarthy 2013; Reilly 2015; Roberts 1981; Rohana 2011; Simon 2011; Smith 2013; Trevisanuto 2010; Vohra 1999; Vohra 2004). Overall, across studies,18 studies reported core body temperature in °C axillary (Bhavsar 2015; Brennan 1996; Caglar 2014; Cardona Torres 2012; Chawla 2011; Doglioni 2014; Farhadi 2012; Leadford 2013; Leslie 2007; Mathew 2012; Reilly 2015; Roberts 1981; Rohana 2011; Simon 2011; Smith 2013; Talakoub 2015; Tescon‐delos Santos 2012; Trevisanuto 2010), four studies °C rectal (Chantaroj 2011; Knobel 2005; Vohra 1999; Vohra 2004), and two studies both axillary and rectal (Gathwala 2010; McCarthy 2013); one study reported skin temperature in °C (Bergman 2004). Definitions of hypothermia were not consistent across studies. One large multi‐centred study was powered for all‐cause mortality at discharge (or at six months' corrected gestation, if the infant remained in hospital), reporting baseline and poststabilisation core body temperature (°C axillary) as secondary outcomes (Reilly 2015).
Earlier studies provided limited reporting of prespecified secondary outcomes, but more recent studies have reported important secondary outcome measures, including mortality, major brain injury, bronchopulmonary dysplasia (BPD), necrotising enterocolitis (NEC), retinopathy of prematurity (ROP), sepsis, and adverse events, particularly hyperthermia on admission to the NICU.
Summary descriptions of individual studies
We have presented the main characteristics of included studies in the Characteristics of included studies table.
Excluded studies
In all, for this update, 43 new randomised or quasi‐randomised controlled trials did not meet our inclusion criteria or were considered to be 'near misses' and are included in the Characteristics of excluded studies table. Primary reasons for exclusion include the following: Participants were term (i.e. at ≥ 37 weeks' gestation) (n = 11 studies); the intervention was not applied immediately at birth (within 10 minutes) in the delivery room (n = 26 studies); the intervention was not considered to be over and above routine thermal care (n = 2 studies); the intervention was considered to be beyond the remit of this review (n = 2 studies); and methodological information was insufficient for an informed decision regarding eligibility (n = 2 studies).
We have provided reasons for exclusion for all individual studies (n = 132 studies) in the Characteristics of excluded studies table.
Risk of bias in included studies
Figure 2 presents the risk of bias summary detailing review authors' judgements about each risk of bias item for each included study. Additional details and the review authors' supporting statements for risk of bias are available in the Characteristics of included studies table.
Allocation
Generation of the allocation sequence was adequate (computer generated, lot drawing, random number tables) in most studies (84%), inadequate in two studies (Chawla 2011; Tescon‐delos Santos 2012), and unclear in two studies (Cardona Torres 2012; Rohana 2011). Allocation concealment was adequate in 52% of studies, inadequate in six studies (Chantaroj 2011; Chawla 2011; Farhadi 2012; Simon 2011; Smith 2013; Tescon‐delos Santos 2012), and unclear in six studies (Bergman 2004; Brennan 1996; Cardona Torres 2012; Gathwala 2010; Roberts 1981; Talakoub 2015). Four studies reported using sealed opaque envelopes but did not explicitly state that these were sequentially numbered; we therefore assessed these studies as having high risk for selection bias (Chantaroj 2011; Farhadi 2012; Simon 2011; Smith 2013). Nine studies also employed random sequences balanced in blocks of two, four, or six participants (Bhavsar 2015; Chantaroj 2011; Farhadi 2012; Leslie 2007; Mathew 2012; McCarthy 2013; Roberts 1981; Trevisanuto 2010; Vohra 2004). We noted some potential for inadequate allocation concealment and therefore cannot rule out selection bias. However, on assessment, we did not penalise studies for this. Overall, across both domains, we considered 12 studies (48%) to be at low risk of potential selection bias (Bhavsar 2015; Caglar 2014; Doglioni 2014; Knobel 2005; Leadford 2013; Leslie 2007; Mathew 2012; McCarthy 2013; Reilly 2015; Trevisanuto 2010; Vohra 1999; Vohra 2004).
Blinding
Across 92% of included studies, we noted no attempt to blind healthcare participants and personnel to the intervention (unclear but unlikely in two studies ‐ Smith 2013; Talakoub 2015). However, lack of blinding is often not feasible for non‐pharmacological interventions (Boutron 2008). Outcome measures were objective and so were less likely to be biased than subjective outcome measures. For our primary outcome measure ‐ core body or skin temperature ‐ we conducted a simple linear regression analysis using the temperature time series (birth to 120 minutes) for one intervention and control reported in Cardona Torres 2012 . We found a significant linear trend (P < 0.029) and widening of the mean temperature difference between control and intervention groups (polyethylene bag without previous drying). This pattern of results suggests that detection bias was unlikely. In addition, we assessed secondary outcome data for key morbidities throughout the neonatal stay when personnel were less likely to be aware of the original allocation group. Only three studies (Bergman 2004; Reilly 2015; Tescon‐delos Santos 2012) reported any attempt to blind outcome assessors or the data analysis team to the intervention; therefore, we cannot rule out potential biases for the other studies.
Incomplete outcome data
No studies reported incomplete outcome data ≥ 20%. All randomised infants completed the trial in most (64%) studies. Of the remaining 10 studies (Bergman 2004; Bhavsar 2015; Cardona Torres 2012; Reilly 2015; Rohana 2011; Simon 2011; Smith 2013; Talakoub 2015; Vohra 1999; Vohra 2004), nine studies clearly stated reasons for missing data. Data show losses to follow‐up as follows: Bergman 2004 (4 of 35, or 3%), Bhavsar 2015 (5 of 101, or 5%), Cardona Torres 2012 (9 of 99, or 9%), Reilly 2015 (12 of 813, or 1.5%), Rohana 2011 (5 of 115, or 4%), Simon 2011 (3 of 39, or 8%), Smith 2013 (3 of 95, or 3%),Talakoub 2015 (2 of 98, or 2%), Vohra 1999 (3 of 62, or 5%), and Vohra 2004 (2 of 55, or 4%). Two studies carried out an intention‐to‐treat analysis including all infants initially enrolled (Reilly 2015; Simon 2011). We categorised all studies as having low risk of attrition bias.
Selective reporting
We did not have access to study protocols for 16 included studies; therefore we assessed potential risk of reporting bias as limited. We accessed online clinical trial registries or protocols published in journals for nine studies and found that all or most study outcomes detailed at the time of registration were also reported in the published manuscript; therefore we categorised these as having low risk of reporting bias (Cardona Torres 2012; Doglioni 2014; Farhadi 2012; Leadford 2013; McCarthy 2013; Reilly 2015; Simon 2011; Smith 2013; Trevisanuto 2010). Information was insufficient for assessment of risk of bias for the remaining 16 studies.
Other potential sources of bias
Overall, 14 studies (56%) appeared to be free from any additional sources of bias. We categorised one study as having unclear risk of other sources of potential bias owing to the significantly longer time from birth to admission for infants in the plastic bag + thermal mattress group when compared with the plastic bag group (24 vs 19 minutes; P = 0.008) (McCarthy 2013). Trial authors presented findings derived from a regression analysis that explored the relationship between time to admission and admission temperature, showing some evidence of a positive correlation between time to admission and rectal temperature in both groups, although the association was weak. Further multiple regression analyses suggest that maternal temperature and transport incubator temperature had an effect on infant temperature and the presence of hyperthermia, although these associations were not significant enough to explain differences between the two groups. Trial authors suggested that increased time from birth to admission in the plastic bag and thermal mattress group may have been a consequence of non‐masking of treatment allocation. This may have resulted in greater vigilance among carers regarding infants who were not in the plastic bag and mattress group; we therefore moved these infants to the NICU faster group (shorter time from birth to admission) to avoid hypothermia.
We categorised 10 studies as having high risk of other sources of potential bias based on the following details.
-
Bergman 2004 showed potential for selection bias in that the assigned research nurse was unavailable for 99 potentially eligible mother‐infant dyads. The aetiology of hypothermia in these infants may have differed from the causes studied. In addition, recruitment for this study was terminated on the basis of significant results after an interim analysis was conducted.
-
Data from Bhavsar 2015 show that infants in the intervention group were significantly (P < 0.05) heavier than those in the control group. This fact could have potentially influenced the effect size because smaller infants are more susceptible to heat loss.
-
For Cardona Torres 2012, we found potential for selection bias in that infants in the intervention group were significantly smaller than those in the control group. This could have been a consequence of poor randomisation.
-
Knobel 2005 attempted to maintain delivery room temperature at 26°C for all preterm deliveries, but actual temperatures ranged from 18.9°C to 31.1°C. On post hoc analysis, we found that warmer delivery room temperatures were associated with higher admission temperatures, but only the subgroup of infants who were both delivered in warm rooms and placed in plastic bags had a mean temperature > 36.4°C. Data show no significant differences between intervention and control groups for mean delivery room temperature. After controlling for delivery room temperature, we found that the mean temperature on admission to the NICU in the intervention group was still 0.6°C higher than in the control group.
-
Leslie 2007 was underpowered (powered to detect a difference in mean temperature (intervention and control) of 0.8°C).
-
Roberts 1981 reported some imbalance between study groups in mean delivery room axillary temperatures for infants < 2000 grams. Analysis of covariance shows that delivery room axillary temperature had a significant effect on infant axillary temperature on admission to the NICU. When we statistically equalised the two groups with respect to delivery room axillary temperature, we noted no significant differences between the two interventions.
-
Simon 2011 showed potential for selection bias in that the assigned researcher was unavailable for 141 of 148 excluded cases. The aetiology of hypothermia in these infants may have differed from the causes studied. Trial authors noted greater variability of use between practitioners when the intervention was polyethylene wrap as opposed to the thermal mattress. In some cases, displacement of the wrap could have resulted in heat loss; therefore we cannot rule out performance bias.
-
Smith 2013 showed potential for performance bias when the infant underwent prolonged resuscitation, or when placement of a nappy or umbilical lines tended to dislodge the NeoWrap, potentially resulting in heat loss and therefore an underestimated effect size. Times to arrival to the NICU from the delivery room varied.
-
Tescon‐delos Santos 2012 reported that trial authors provided additional swaddling with prewarmed blankets for infants with a recorded axillary temperature < 36.5°C, which prevented further occurrence of hypothermia and potentially masked any true effect of the intervention (polyethylene body wrap and cap). A higher incidence of further swaddling in the control group resulted in higher mean temperatures during the first 15 minutes of life. This additional swaddling may also have been influenced by greater attention of healthcare providers (not blinded to the intervention) to the control group. Therefore we cannot rule out performance bias.
-
Vohra 1999 showed some imbalance in birth weight between study groups. However the birth weight adjusted difference in mean rectal temperature of 1.54°C for the smaller group remained significant. For infants at < 28 weeks' gestation, mean birth weight was 914 grams (SD 163) for the plastic wrap group and 742 grams (SD 206) for the non‐wrap group; therefore, results could be potentially biased towards the wrap group because the non‐wrap group was lighter and more vulnerable to heat loss.
In addition, Reilly 2015 reported several protocol violations among treatment groups, including delayed application of the wrap, wrap opening during the study period, and early removal of the wrap. However, data show significantly higher mean baseline and poststabilisation temperatures for the wrap group. Other violations included use of adjunct heat sources in small numbers of infants in both wrap and non‐wrap groups, which was unlikely to affect findings. We therefore assigned this study low risk of other bias.
Effects of interventions
Results of meta‐analyses
In all, we included in this review 25 studies involving 2481 randomised infants (2433 completing the studies). We presented 15 comparison groups across three main categories: barriers to heat loss, external (additional) heat sources, and combinations of interventions. The barriers to heat loss category consisted of 11 comparisons: plastic wrap or bag versus routine care (Cardona Torres 2012; Chantaroj 2011; Farhadi 2012; Gathwala 2010; Knobel 2005; Leadford 2013; Reilly 2015; Rohana 2011; Smith 2013; Talakoub 2015; Trevisanuto 2010; Vohra 1999; Vohra 2004), plastic wrap versus routine care during interhospital neonatal transport (Bhavsar 2015), plastic bag with previous drying versus routine care (Cardona Torres 2012), plastic cap versus routine care (no cap) (Trevisanuto 2010), plastic bag and plastic cap versus routine care (Talakoub 2015; Tescon‐delos Santos 2012), plastic bag with previous drying versus plastic bag without previous drying (Cardona Torres 2012), plastic cap versus plastic bag (Trevisanuto 2010), plastic bag versus plastic wrap (Caglar 2014), plastic total body wrap (body + head) versus plastic body wrap (head uncovered) (Doglioni 2014), plastic bag and plastic hat versus plastic bag and cotton hat (Talakoub 2015), and stockinet cap versus routine care (no cap) (Roberts 1981). The external heat source category consisted of two comparison groups: skin‐to‐skin care versus routine care (Bergman 2004), and thermal mattress versus routine care (Brennan 1996; Chawla 2011). Two additional comparison groups compared combinations of interventions: plastic wrap or bag versus thermal mattress (Mathew 2012; Simon 2011), and plastic bag + thermal mattress versus plastic bag only (Leslie 2007; McCarthy 2013).
Barriers to heat loss category
Plastic wrap or bag versus routine care (Comparison 1)
Primary outcomes
Core body temperature (°C) of the infant taken on admission to the NICU or up to two hours after birth (Outcome 1.1)
Thirteen studies comprising 1633 infants reported core body temperature (°C rectal or axillary) on admission to the NICU (Chantaroj 2011; Farhadi 2012; Gathwala 2010; Knobel 2005; Reilly 2015; Rohana 2011; Smith 2013; Talakoub 2015; Trevisanuto 2010; Vohra 1999; Vohra 2004), at 30 minutes after birth (Cardona Torres 2012), and at one hour after birth (Leadford 2013). Reilly 2015 defined baseline temperature as temperature taken after cardiorespiratory stabilisation upon direct admission to the NICU or after arrival to the NICU if immediate resuscitation took place in the delivery room. Most studies reported that the time from birth to admission to the NICU ranged from around 20 minutes to 45 minutes; therefore, we included the 30‐minute temperature measurement from the Cardona Torres 2012 study, rather than the primary endpoint of 120 minutes. Each individual study showed a significant effect in favour of the intervention group (plastic wrap or bag) for infants across gestations, with the exception of Vohra 1999, which showed no significant differences in effect for the subgroup of infants at 28 to 31 weeks' gestation. Four studies did not provide subgroup data (Cardona Torres 2012; Chantaroj 2011; Gathwala 2010; Leadford 2013); we therefore grouped them together in the 'all infant' category with a range of gestations from 26 to 37 weeks. Although infants in the Knobel 2005 and Trevisanuto 2010 studies had gestation < 29 completed weeks and Smith 2013 ≤ 29 completed weeks, we included these infants in the < 28 completed weeks subgroup for meta‐analysis. Four studies provided data for the subgroup ≥ 28 completed weeks, with a range of gestation from 28 to 33 weeks (Farhadi 2012; Rohana 2011; Talakoub 2015; Vohra 1999). The intervention consisted of plastic bags in 10 studies (Cardona Torres 2012; Chantaroj 2011; Farhadi 2012; Gathwala 2010; Knobel 2005; Leadford 2013; Talakoub 2015; Trevisanuto 2010; Vohra 1999; Vohra 2004), and three studies provided plastic wrap (or a bag cut similar to wrap) as the intervention (Reilly 2015; Rohana 2011; Smith 2013).
Outcome 1.1.1: Overall for infants at < 37 weeks' gestation, data show a statistically significant difference in core body temperature on admission to the NICU favouring the intervention group (plastic wrap or bag) compared with those who received routine care immediately after birth in the delivery room (mean difference (MD) 0.58°C, 95% confidence interval (CI) 0.50 to 0.66; 13 studies; N = 1633) (Analysis 1.1). However, the overall test for homogeneity and for each subgroup of infants failed, with an I² value ranging from 59% to 61% (moderate heterogeneity).
Outcome 1.1.2: For infants at < 28 weeks' gestation, data show a statistically significant difference in core body temperature on admission to the NICU favouring the intervention group (plastic wrap or bag) when compared with those who received routine care immediately after birth in the delivery room (MD 0.65°C, 95% CI 0.52 to 0.79; eight studies; N = 1171) (Analysis 1.1). However, the test for homogeneity failed, with an I² value of 61% (moderate heterogeneity).
Outcome 1.1.3: For infants at ≥ 28 weeks' gestation, data show a statistically significant difference in core body temperature on admission to the NICU favouring the intervention group (plastic wrap or bag) when compared with those who received routine care immediately after birth in the delivery room (MD 0.56°C, 95% CI 0.34 to 0.78; four studies, n = 200) (Analysis 1.1). However, the test for homogeneity failed, with an I² value of 60% (moderate heterogeneity).
Publication bias and investigation of heterogeneity
Owing to the substantial heterogeneity observed, we inspected a funnel plot comparison for plastic wrap or bag versus routine care for core body temperature (°C) on admission to the NICU or up to two hours after birth for possible publication bias (Figure 3). When we removed Vohra 2004 from the meta‐analysis of all studies (< 37 weeks' gestation), data show no change in the effect measure (MD 0.58°C, 95% CI 0.50 to 0.66; 12 studies; N = 1580). Heterogeneity remained moderate at 61%. Publication bias was potentially problematic for the subgroup of studies presenting data for infants at < 28 weeks' gestation, suggesting that non‐effect, smaller studies have not been published. To overcome this, we removed from the meta‐analysis the following studies with 95% confidence limits > 1, with an I² value of 0%: Rohana 2011; Vohra 1999; and Vohra 2004 (MD 0.57°C, 95% CI 0.42 to 0.71; five studies; N = 1063). For the study subgroup presenting data for infants at ≥ 28 weeks' gestation, upon removal of Farhadi 2012 (MD 0.49°C, 95% CI 0.26 to 0.72; three studies; N = 178), heterogeneity remained moderate, with an I² value of 55%.
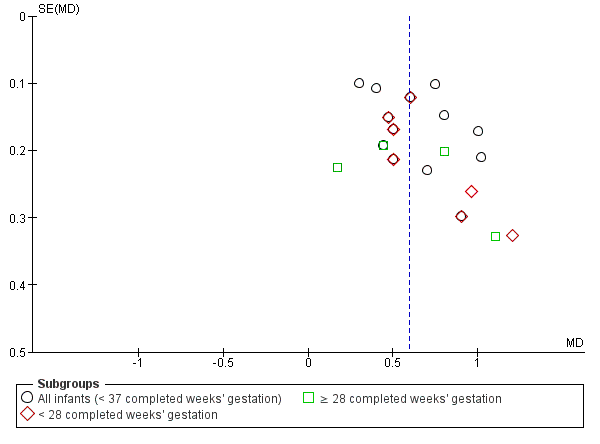
Funnel plot of comparison: 1 Plastic wrap or bag versus routine care, outcome: 1.1 Core body temperature (°C) on admission to NICU or up to 2 hours after birth.
Hypothermia on admission to the NICU (core body temperature < 36.5°C, or skin temperature < 36°C) (Outcome 1.2)
Ten studies comprising 1417 infants, in addition to reporting core body temperature on admission to the NICU as a continuous variable, provided data in a dichotomous format in terms of the incidence of hypothermia in intervention and control groups (plastic wrap or bag and routine care) (Cardona Torres 2012; Chantaroj 2011; Farhadi 2012; Knobel 2005; Leadford 2013; Reilly 2015; Rohana 2011; Trevisanuto 2010; Vohra 1999; Vohra 2004). Cardona Torres 2012 reported hypothermia throughout the study period of 120 minutes, and Leadford 2013 reported hypothermia one hour after birth. Most studies defined hypothermia as a core body temperature (rectal or axillary) < 36.5°C on admission to the NICU, and two studies defined hypothermia as a core body temperature (rectal or axillary) < 36.4°C on admission to the NICU (Knobel 2005; Trevisanuto 2010). Reilly 2015 reported hypothermia defined as core body temperature (axillary) < 36.5°C at baseline (after cardiorespiratory stabilisation upon direct admission to the NICU, or after arrival to the NICU if immediate resuscitation took place in the delivery room). Cardona Torres 2012 provided no clear definition. For Vohra 1999 and Vohra 2004, we derived data from a graph of core body temperatures on admission to the NICU versus birth weight for control and intervention groups; core body temperature (rectal) was defined as < 35.0°C, and no subgroup data were available.
Most individual studies showed a significant effect in favour of the intervention (plastic wrap or bag group), with the exception of Chantaroj 2011, which showed no differences in effect for infants at < 28 weeks' gestation; however the number of infants in this subgroup was very small. The small trials of Vohra 1999 and Cardona Torres 2012 showed borderline significant effects favouring the plastic wrap or bag group.
Outcome 1.2.1: Overall, for infants at < 37 weeks' gestation, plastic wrap or bag significantly reduced risk of hypothermia on admission to the NICU (typical RR 0.67, 95% CI 0.62 to 0.72; typical risk difference (RD) ‐0.25, 95% CI ‐0.29 to ‐0.20; 10 studies; N = 1417) (Analysis 1.2). Four infants would have to be wrapped in plastic to prevent one infant from becoming hypothermic (NNTB 4, 95% CI 4 to 5). The overall test for homogeneity failed, with an I² value of 65% (moderate heterogeneity) for RR and 70% (moderate heterogeneity) for RD, as well as for subgroup differences, with an I² value of 78.5% (high heterogeneity) for RR and 91.6% (high heterogeneity) for RD.
Outcome 1.2.2: For infants at < 28 weeks' gestation, plastic wrap or bag significantly reduced risk of hypothermia on admission to NICU (typical RR 0.70, 95% CI 0.65 to 0.77; typical RD ‐0.23, 95% CI ‐0.29 to ‐0.18; six studies; N = 1029) (Analysis 1.2).
This finding is consistent with those for outcome measure 1.1.2. Four infants would have to be wrapped in plastic to prevent one infant from becoming hypothermic (NNTB 4, 95% CI 4 to 6). The test for homogeneity passed with an I² value of 44% (low heterogeneity) for RR but with I² of 67% (moderate heterogeneity) for RD.
Outcome 1.2.3: For infants at ≥ 28 weeks' gestation, plastic wrap or bag significantly reduced risk of hypothermia on admission to the NICU (typical RR 0.17, 95% CI 0.07 to 0.43; typical RD ‐0.71, 95% CI ‐0.89 to ‐0.52; two studies; N = 55) (Analysis 1.2). This finding is consistent with those reported for outcome measure 1.1.3. One infant would have to be wrapped in plastic to prevent one infant from becoming hypothermic (NNTB 1 95% CI 1 to 2). The test for homogeneity passed with an I² value of 0% for both RR and RD.
Computational errors can occur when a zero count is seen in one or both arms of a study, as in Cardona Torres 2012 and Vohra 1999. RevMan software compensates by adding 0.5 to each cell.
Publication bias and investigation of heterogeneity
Owing to the substantial heterogeneity noted above, we inspected a funnel plot comparison (SE(log (RR)) vs RR) for plastic wrap or bag versus routine care for hypothermia on admission to the NICU for possible publication bias. Figure 4 shows that publication bias may be present, suggesting that non‐effect, smaller studies have not been published. Upon removal from the meta‐analysis of small studies showing a significant effect with SE(log (RR)) above 0.3 (Cardona Torres 2012; Chantaroj 2011; Farhadi 2012; Vohra 1999; Vohra 2004), the overall test for heterogeneity passed with an I² value of 0%, and the effect size remained highly significant (typical RR 0.72, 95% CI 0.67 to 0.78; five studies; N = 1167). For the subgroup of studies presenting data for infants at < 28 weeks' gestation, upon removal of two studies from the meta‐analysis (Farhadi 2012; Vohra 2004), the overall test for heterogeneity passed with I² of 0%, and the effect size remained highly significant (typical RR 0.73, 95% CI 0.67 to 0.79; four studies; N = 958).
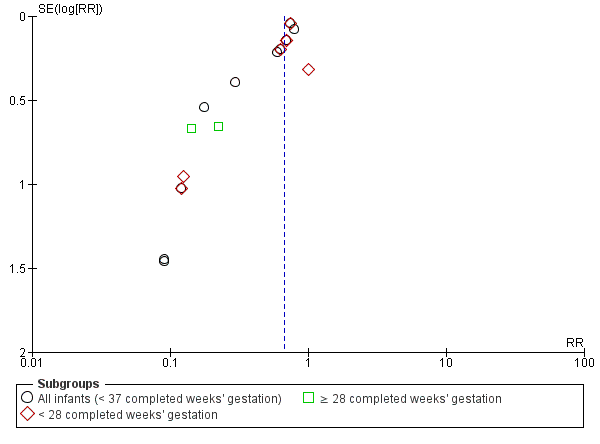
Funnel plot of comparison: 1 Plastic wrap or bag versus routine care, outcome: 1.2 Hypothermia on admission to NICU: core body temperature < 36.5°C or skin temperature < 36°C.
Outside normothermic range on admission to the NICU or up to two hours after birth (Outcome 1.3)
Five studies comprising 1048 infants reported this outcome, or it was derived from definitions of hypothermia and hyperthermia as the incidence of a core body temperature outside the normothermic range on admission to the NICU (Chantaroj 2011; Farhadi 2012; Leadford 2013; Reilly 2015; Trevisanuto 2010). Chantaroj 2011 and Farhadi 2012 defined normothermia as core body temperature (rectal or axillary) of 36.5°C to 37.5°C, Reilly 2015 as core body temperature (axillary) of 36.5°C to 37.4°C (baseline), Trevisanuto 2010 as core body temperature (axillary) of 36.4°C to 37.5°C, and Leadford 2013 as core body temperature (axillary) of 36.5°C to 37.5°C at one hour after birth. Most individual studies showed a significant effect favouring the intervention (plastic wrap or bag group), with the exception of Chantaroj 2011, which showed no difference in effect for infants at < 28 weeks' gestation; however, the number of infants in this subgroup was very small. Trevisanuto 2010 showed a borderline significant effect favouring the plastic wrap or bag group. This was not a prespecified outcome at the review protocol stage.
Outcome 1.3.1: Overall, for infants at < 37 weeks' gestation, plastic wrap or bag significantly reduced the risk of a core body temperature outside the normothermic range on admission to the NICU (typical RR 0.75, 95% CI 0.69 to 0.81; typical RD ‐0.20, 95% CI ‐0.26 to ‐0.15; five studies; N = 1048) (Analysis 1.3). Five infants would have to be wrapped in plastic to prevent one infant from having a core body temperature outside the normothermic range (NNTB 5, 95% CI 4 to 7). The overall test for homogeneity failed, with an I² value of 77% (high heterogeneity) for RR and 87% (high heterogeneity) for RD, and also for subgroup differences with an I² value of 77% (high heterogeneity) for RR and 92.5% (high heterogeneity) for RD.
Outcome 1.3.2: For infants at < 28 weeks' gestation, plastic wrap or bag significantly reduced the risk of being outside the normothermic range on admission to the NICU (typical RR 0.81, 95% CI 0.75 to 0.88; typical RD ‐0.15, 95% CI ‐0.21 to ‐0.10; three studies; N = 871) (Analysis 1.3). Seven infants would have to be wrapped in plastic to prevent one infant from having a core body temperature outside the normothermic range on admission to the NICU (NNTB 7, 95% CI 5 to 10). The test for homogeneity passed, with an I² value of 0% for RR and I² of 38% (low heterogeneity) for RD.
Outcome 1.3.3: For infants at ≥ 28 weeks' gestation, plastic wrap or bag significantly reduced the risk of being outside the normothermic range on admission to the NICU (RR 0.14, 95% CI 0.04 to 0.52; RD ‐0.76, 95% CI ‐0.98 to ‐0.53; one study; N = 33) (Analysis 1.3). One infant would have to be wrapped in plastic to prevent one infant from having a core body temperature outside the normothermic range on admission to the NICU (NNTB 1, 95% CI 1 to 2).
Core body temperature one hour after birth (Outcome 1.4)
One study reported this outcome in terms of core body temperature in °C (axillary) every 15 minutes until two hours after birth (Cardona Torres 2012). This was not a prespecified outcome at the review protocol stage.
Outcome 1.4.1: For infants at ≥ 28 and < 37 weeks' gestation and birth weight ≥ 1000 and ≤ 2499 grams, a statistically significant difference in core body temperature one hour after birth favoured the intervention (plastic wrap or bag) group when compared with the group that received routine care immediately after birth in the delivery room (MD 0.40°C, 95% CI 0.19 to 0.61; one study; N = 60) (Analysis 1.4).
Core body temperature 90 minutes after birth (Outcome 1.5)
One study reported this outcome in terms of core body temperature in °C (axillary) every 15 minutes until two hours after birth (Cardona Torres 2012). This was not a prespecified outcome at the review protocol stage.
Outcome 1.5.1: For infants at ≥ 28 and < 37 weeks' gestation and birth weight ≥ 1000 and ≤ 2499 grams, a statistically significant difference in core body temperature 90 minutes after birth favoured the intervention (plastic wrap or bag) group when compared with the group that received routine care immediately after birth in the delivery room (MD 0.40°C, 95% CI 0.18 to 0.62; one study; N = 60) (Analysis 1.5).
Core body temperature two hours after birth (Outcome 1.6)
One study reported this outcome in terms of core body temperature in °C (axillary) every 15 minutes until two hours after birth (Cardona Torres 2012). This was not a prespecified outcome at the review protocol stage.
Outcome 1.6.1: For infants at ≥ 28 and < 37 weeks' gestation and birth weight ≥ 1000 and ≤ 2499 grams, a statistically significant difference in core body temperature two hours after birth favoured the intervention (plastic wrap or bag) group when compared with the group that received routine care immediately after birth in the delivery room (MD 0.30°C, 95% CI 0.13 to 0.47; one study; N = 60) (Analysis 1.6).
Core body temperature post stabilisation (Outcome 1.7)
Two studies comprising 911 infants reported this outcome in terms of core body temperature in °C (axillary) post stabilisation in the NICU (Reilly 2015; Rohana 2011). Reilly 2015 defined post stabilisation as temperature taken after admission procedures were completed and the infant was left to rest in a stable thermoneutral environment. Rohana 2011 defined post stabilisation as temperature taken once respiratory support, peripheral lines, and cardiorespiratory monitor probes had been secured. This was not a prespecified outcome at the review protocol stage. Each individual study showed a significant effect in favour of the intervention (plastic wrap or bag) group for infants at < 28 weeks' gestation; however Rohana 2011 showed no (borderline) significant difference in effect for the subgroup of infants at ≥ 28 weeks' gestation.
Outcome 1.7.1: Overall, for infants at ≥ 24 and ≤ 33 weeks' gestation, a statistically significant difference in core body temperature post stabilisation favoured the intervention (plastic wrap or bag) group when compared with the group that received routine care immediately after birth in the delivery room (MD 0.43°C, 95% CI 0.22 to 0.64; two studies; N = 911) (Analysis 1.7). The overall test for homogeneity passed with an I² value of 0%.
Outcome 1.7.2: For infants at < 28 weeks' gestation, a statistically significant difference in core body temperature post stabilisation favoured the intervention (plastic wrap or bag) group when compared with the group that received routine care immediately after birth in the delivery room (MD 0.44°C, 95% CI 0.20 to 0.67; two studies; N = 838) (Analysis 1.7). The test for homogeneity passed with an I² value of 0%.
Outcome 1.7.3: For infants at ≥ 28 weeks' gestation, a borderline statistically significant difference in core body temperature post stabilisation favoured the intervention (plastic wrap or bag) group when compared with the group that received routine care immediately after birth in the delivery room (MD 0.40°C, 95% CI ‐0.00 to 0.80; one study; N = 73) (Analysis 1.7).
Hypothermia post stabilisation: core body temperature < 36.5°C, or skin temperature < 36°C (Outcome 1.8)
Two studies comprising 841 infants reported this outcome in terms of incidence of hypothermia in intervention and control groups (plastic wrap or bag and routine care) (Farhadi 2012; Reilly 2015). Hypothermia post stabilisation was defined as core body temperature (axillary) < 36.5°C. Reilly 2015 defined 'post stabilisation' as temperature taken after admission procedures were completed and the infant was left to rest in a stable thermoneutral environment; we utilised incidence of hypothermia one hour after admission to the NICU for Farhadi 2012. This was not a prespecified outcome at the review protocol stage. Each individual study showed a significant effect in favour of the intervention (plastic wrap or bag) group across gestations.
Overall
For infants at ≤ 32 weeks' gestation, plastic wrap or bag significantly reduced the risk of hypothermia post stabilisation (typical RR 0.76, 95% CI 0.65 to 0.88; typical RD ‐0.13, 95% CI ‐0.19 to ‐0.06; two studies; N = 841) (Analysis 1.8). Eight infants would have to be wrapped in plastic to prevent one infant from being hypothermic post stabilisation (NNTB 8, 95% CI 5 to 17). The overall test for homogeneity failed with an I² value of 76% (high heterogeneity) for RR and I² of 91% (high heterogeneity) for RD, and for subgroup differences with I² values of 74.7% (moderate heterogeneity) for RR and 90.7% (high heterogeneity) for RD.
Outcome 1.8.1: For infants at ≤ 32 weeks' gestation (when no subgroup data were available), plastic wrap or bag significantly reduced the risk of hypothermia post stabilisation (RR 0.05, 95% CI 0.00 to 0.76; RD ‐0.50, 95% CI ‐0.72 to ‐0.28; one study; N = 40) (Analysis 1.8). Two infants would have to be wrapped in plastic to prevent one infant from being hypothermic post stabilisation (NNTB 2, 95% CI 1 to 4).
Outcome 1.8.2: For infants at ≥ 24 and < 28 weeks' gestation, plastic wrap or bag significantly reduced the risk of hypothermia post stabilisation (RR 0.79, 95% CI 0.69 to 0.92; RD ‐0.11, 95% CI ‐0.18 to ‐0.04; one study; N = 801) (Analysis 1.8). Nine infants would have to be wrapped in plastic to prevent one infant from being hypothermic post stabilisation (NNTB 9, 95% CI 6 to 25).
Outside the normothermic range post stabilisation (Outcome 1.9)
Two studies comprising 841 infants reported this outcome, or it was derived from definitions of hypothermia and hyperthermia in terms of incidence outside the normothermic range post stabilisation in intervention and control groups (plastic wrap or bag and routine care) (Reilly 2015), as well as one hour after admission to the NICU (Farhadi 2012). Reilly 2015 defined normothermia as core body temperature (rectal or axillary) of 36.5°C to 37.4°C, and Farhadi 2012 as core body temperature (axillary) of 36.5°C to 37.5°C. This was not a prespecified outcome at the review protocol stage. Farhadi 2012 showed a significant effect favouring the intervention (plastic wrap or bag) group for infants at ≤ 32 weeks' gestation (when no subgroup data were available), and Reilly 2015 showed no significant difference in effect for the subgroup of infants at < 28 weeks' gestation.
Overall
For infants at ≤ 32 weeks' gestation, data show no significant difference (borderline) in the risk of having a core body temperature outside the normothermic range post stabilisation (typical RR 0.88, 95% CI 0.78 to 1.00; typical RD ‐0.07, 95% CI ‐0.13 to 0.00; two studies; N = 841) (Analysis 1.9). The overall test for homogeneity failed with an I² value of 80% (high heterogeneity) for RR and I² of 90% (high heterogeneity) for RD, and with I² values of 79.6% (high heterogeneity) for RR and 90.1% (high heterogeneity) for RD for subgroup differences.
Outcome 1.9.1: For infants at ≤ 32 weeks' gestation (when no subgroup data were available), plastic wrap or bag significantly reduced the risk of having a core body temperature outside the normothermic range one hour after admission to the NICU (RR 0.10, 95% CI 0.01 to 0.71; RD ‐0.45, 95% CI ‐0.69 to ‐0.21; one study; N = 40) (Analysis 1.9). Two infants would have to be wrapped in plastic to prevent one infant from being outside the normothermic range (NNTB 2, 95% CI 2 to 5).
Outcome 1.9.2: For infants at ≥ 24 and < 28 weeks' gestation, data show no significant difference in the risk of having a core body temperature outside the normothermic range post stabilisation (RR 0.92, 95% CI 0.81 to 1.04; RD ‐0.05, 95% CI ‐0.12 to 0.02; one study; N = 801) (Analysis 1.9).
Core body temperature 30 minutes after the initial NICU admission temperature was taken (Outcome 1.10)
One study reported this outcome in terms of core body temperature in °C (axillary) 30 minutes after the initial NICU admission temperature was taken (Smith 2013). This was not a prespecified outcome at the review protocol stage.
Outcome 1.10.1: For infants at ≤ 29 weeks' gestation, data show a statistically significant difference in core body temperature 30 minutes after the initial NICU temperature was taken favouring the intervention (plastic wrap or bag) group over the group that received routine care immediately after birth in the delivery room (MD 0.57°C, 95% CI 0.27 to 0.87; one study; N = 92) (Analysis 1.10).
Core body temperature one hour after the initial NICU admission temperature was taken (Outcome 1.11)
Six studies comprising 373 infants reported this outcome in terms of core body temperature in °C (rectal or axillary) one hour after the initial NICU admission temperature was taken (Farhadi 2012; Gathwala 2010; Smith 2013; Talakoub 2015; Trevisanuto 2010; Vohra 2004). This was not a prespecified outcome at the review protocol stage. The purpose for collection of this outcome measure was to ascertain whether the intervention (plastic wrap or bag) prevented rather than delayed the postnatal fall in body temperature immediately after birth. Most individual studies showed an effect favouring the plastic wrap or bag, with the exception of Gathwala 2010 for infants at ≤ 32 weeks' gestation and birth weight ≤ 1500 grams, Talakoub 2015 for infants at 28 to 32 weeks' gestation, and Vohra 2004 for infants at < 28 weeks' gestation, which tended towards favouring the plastic wrap or bag group.
Outcome 1.11.1: Overall, for infants at < 37 weeks' gestation, a statistically significant difference shown for core body temperature one hour after the initial NICU admission temperature was taken favours the intervention (plastic wrap or bag) group when compared with the group that received routine care immediately after birth in the delivery room (MD 0.36°C, 95% CI 0.25 to 0.47; six studies; N = 373) (Analysis 1.11). The overall test for homogeneity failed with an I² value of 80% (high heterogeneity) and I² of 74.6% (moderate heterogeneity) for subgroup differences.
Outcome 1.11.2: For infants at < 28 weeks' gestation, a statistically significant difference shown for core body temperature one hour after the initial NICU admission temperature was taken favoured the intervention (plastic wrap or bag) group when compared with the group that received routine care immediately after birth in the delivery room (MD 0.49°C, 95% CI 0.33 to 0.66; four studies; N = 227) (Analysis 1.11). The test for homogeneity passed with an I² value of 24%.
Outcome 1.11.3: For infants at ≥ 28 weeks' gestation, a statistically significant difference shown for core body temperature one hour after the initial NICU admission temperature was taken favoured the intervention (plastic wrap or bag) group when compared with the group that received routine care immediately after birth in the delivery room (MD 0.72°C, 95% CI 0.48 to 0.96; two studies; N = 86) (Analysis 1.11). The test for homogeneity passed with an I² value of 36% (low heterogeneity).
Core body temperature 90 minutes after the initial NICU admission temperature was taken (Outcome 1.12)
One study reported this outcome in terms of core body temperature in °C (axillary) 90 minutes after the initial NICU admission temperature was taken (Smith 2013). This was not a prespecified outcome at the review protocol stage.
Outcome 1.12.1: For infants at ≤ 29 weeks' gestation, a statistically significant difference shown for core body temperature 90 minutes after the initial NICU admission temperature was taken favoured the intervention (plastic wrap or bag) group when compared with the group that received routine care immediately after birth in the delivery room (MD 0.56°C, 95% CI 0.27 to 0.85; one study; N = 92) (Analysis 1.12).
Core body temperature two hours after the initial NICU admission temperature was taken (Outcome 1.13)
Two studies comprising 156 infants reported this outcome in terms of core body temperature in °C (axillary) two hours after the initial NICU admission temperature was taken (Smith 2013; Talakoub 2015). This was not a prespecified outcome at the review protocol stage. Each individual study showed a significant effect in favour of the intervention (plastic wrap or bag) group for infants across gestations.
Overall
Overall, for infants at ≤ 32 weeks' gestation, a statistically significant difference shown for core body temperature two hours after the initial NICU admission temperature was taken favoured the intervention (plastic wrap or bag) group when compared with the group that received routine care immediately after birth in the delivery room (MD 0.37°C, 95% CI 0.16 to 0.59; two studies; N = 156) (Analysis 1.13). The test for homogeneity failed with an I² value of 64% (moderate heterogeneity).
Outcome 1.13.1: For infants at ≤ 29 weeks' gestation, a statistically significant difference was shown for core body temperature two hours after the initial NICU admission temperature was taken favouring the intervention (plastic wrap or bag) group when compared with the group that received routine care immediately after birth in the delivery room (MD 0.28°C, 95% CI 0.04 to 0.52; one study; N = 92) (Analysis 1.13).
Outcome 1.13.2: For infants at 28 to 32 weeks' gestation, a statistically significant difference was shown for core body temperature two hours after the initial NICU admission temperature was taken favouring the intervention (plastic wrap or bag) group when compared with the group that received routine care immediately after birth in the delivery room (MD 0.74°C, 95% CI 0.26 to 1.22; one study; N = 64) (Analysis 1.13).
Secondary outcomes
Hyperthermia on admission to the NICU: core body temperature > 37.5°C (Outcome 1.14)
Twelve studies comprising 1523 infants reported this outcome in terms of incidence of hyperthermia in the intervention and control groups (plastic wrap or bag and routine care). Some investigators defined hyperthermia as core body temperature (rectal or axillary) > 37.5°C (Chantaroj 2011; Farhadi 2012; Smith 2013; Trevisanuto 2010; Vohra 2004), Reilly 2015 as core body temperature (axillary) ≥ 37.5°C, and Leadford 2013 as core body temperature (axillary) > 38°C; five studies did not provide a clear definition (Cardona Torres 2012; Gathwala 2010; Knobel 2005; Talakoub 2015; Vohra 1999). This was not the prespecified definition at the review protocol stage. For the purposes of this meta‐analysis, review authors interpreted 'no risk of hyperthermia' as reported in Talakoub 2015 as no hyperthermia in intervention or control groups (trial authors have been contacted).
Each individual study showed no significant difference in risk of hyperthermia across gestations, with the exception of a large multi‐centre study, which showed that plastic wrap significantly increased the risk of being hyperthermic on admission to the NICU for infants at < 28 weeks' gestation (Reilly 2015).
Outcome 1.14.1: Overall, for infants at < 37 weeks' gestation, plastic wrap or bag significantly increased the risk of being hyperthermic on admission to the NICU (typical RR 3.91, 95% CI 2.05 to 7.44; typical RD 0.04, 95% CI 0.02 to 0.06; twelve studies; N = 1523) (Analysis 1.14). Twenty‐five infants would have to be wrapped in plastic to have one infant hyperthermic on admission to the NICU (NNTH 25, 95% CI 17 to 50). The overall test for homogeneity passed with an I² value of 0% for RR and 19% for RD. For subgroup differences, homogeneity passed with an I² value of 0% for RR and 47.7% (low heterogeneity) for RD.
Note: RR was not estimable for five studies owing to zero events in both arms.
Outcome 1.14.2: For infants at < 28 weeks' gestation, plastic wrap or bag significantly increased the risk of being hyperthermic on admission to the NICU (typical RR 4.00, 95% CI 2.04 to 7.83; typical RD 0.05, 95% CI 0.03 to 0.08; seven studies; N = 1121) (Analysis 1.14). Twenty infants would have to be wrapped in plastic to have one infant hyperthermic on admission to the NICU (NNTH 20, 95% CI 13 to 33). The overall test for homogeneity passed with an I² value of 14% for RR and 0% for RD.
Outcome 1.14.3: For infants at ≥ 28 weeks' gestation, data show no statistically significant differences between the two interventions (plastic bag and routine care) for being hyperthermic on admission to the NICU (typical RR (not estimable); typical RD 0.00, 95% CI ‐0.05 to 0.05; three studies; N = 138) (Analysis 1.14). The overall test for homogeneity passed with an I² value of 0% for RD.
In addition, Rohana 2011 reported that two infants in the wrap group were hyperthermic (> 37.5°C) within the first 12 hours of life (for infants at ≥ 24 and ≤ 33 weeks' gestation).
Publication bias and investigation of heterogeneity
Data show no evidence of publication bias.
Hyperthermia post stabilisation: core body temperature > 37.5°C (Outcome 1.15)
One study reported this outcome in terms of incidence of hyperthermia in intervention and control groups (plastic wrap or bag and routine care) post stabilisation (Reilly 2015). Investigators defined hyperthermia as core body temperature (axillary) ≥ 37.5°C. Reilly 2015 defined post stabilisation as temperature taken after admission procedures were completed and the infant was left to rest in a stable thermoneutral environment. This was not our prespecified definition at the review protocol stage.
Outcome 1.15.1: For infants at ≥ 24 and < 28 weeks' gestation, plastic wrap or bag significantly increased risk of being hyperthermic post stabilisation (RR 2.35, 95% CI 1.38 to 4.00; RD 0.06, 95% CI 0.02 to 0.10; one study; N = 801) (Analysis 1.15). Seventeen infants would have to be wrapped in plastic to have one infant hyperthermic post stabilisation (NNTH 17, 95% CI 10 to 50).
Major brain injury
Major brain injury (defined as sonographic evidence of intraventricular haemorrhage (IVH) with ventricular dilatation, parenchymal haemorrhagic infarction, or periventricular leukomalacia) (Outcome 1.16)
One review author (HH) reviewed data definitions for brain injury (all grades) across all studies and allocated individual outcomes to an appropriate composite outcome for the purposes of meta‐analysis. This composite outcome was not prespecified at the review protocol stage. Five studies comprising 1100 infants reported this outcome (Knobel 2005; Reilly 2015; Rohana 2011; Smith 2013; Trevisanuto 2010). Knobel 2005 and Trevisanuto 2010 defined major brain injury as sonographic evidence of IVH with ventricular dilatation, parenchymal haemorrhagic infarction, or periventricular leukomalacia. Rohana 2011 provided data for severe IVH grade Ⅲ and Ⅳ. Reilly 2015 provided data separately for severe IVH grade Ⅲ and Ⅳ and for cystic periventricular leukomalacia. These were not mutually exclusive; therefore we used cystic periventricular leukomalacia in this meta‐analysis. Smith 2013 provided data for cystic periventricular leukomalacia. Each individual study showed no significant differences in effect across gestations.
Overall
For infants at ≤ 33 weeks' gestation, data show no significant difference in risk of major brain injury between infants who received plastic wrap or bag and those given routine care (typical RR 0.78, 95% CI 0.47 to 1.27; typical RD ‐0.01, 95% CI ‐0.04 to 0.01; five studies; N = 1100) (Analysis 1.16). The overall test for homogeneity passed with an I² value of 0% for both RR and RD and for subgroup differences.
Outcome 1.16.1: For infants at ≤ 33 weeks' gestation (when no subgroup data were available), data show no significant difference in risk of major brain injury between infants who received plastic wrap or bag and those given routine care (RR 0.30, 95% CI 0.03 to 2.60; RD ‐0.05, 95% CI ‐0.12 to 0.03; one study; N = 110) (Analysis 1.16).
Outcome 1.16.2: For infants at < 28 weeks' gestation, data show no significant difference in risk of major brain injury between infants who received plastic wrap or bag and those given routine care (typical RR 0.83, 95% CI 0.50 to 1.39; typical RD ‐0.01, 95% CI ‐0.04 to 0.02; four studies; n = 990) (Analysis 1.16). The test for homogeneity passed with an I² value of 0% for both RR and RD.
Brain injury (Outcome 1.17)
Three studies comprising 880 infants reported this outcome in terms of incidence of all grades of IVH (Ⅰ to Ⅳ) in intervention and control groups (plastic wrap or bag and routine care) (Farhadi 2012; Reilly 2015; Smith 2013). Each individual study showed no significant difference in effect for infants at < 28 weeks' gestation.
Outcome 1.17.1: For infants at < 28 weeks' gestation, data show no significant difference in risk of any grade IVH between infants who received plastic wrap or bag and those given routine care (typical RR 0.92, 95% CI 0.77 to 1.09; typical RD ‐0.03, 95% CI ‐0.09 to 0.03; three studies; N = 880) (Analysis 1.16). The test for homogeneity passed with an I² value of 0% for both RR and RD.
Intraventricular haemorrhage grades Ⅲ and Ⅳ (Outcome 1.18)
One study (for which data have not been meta‐analysed in outcome 1.16) reported this outcome in terms of incidence of severe IVH (grades Ⅲ and Ⅳ) in intervention and control groups (plastic wrap and routine care) (Reilly 2015).
Outcome 1.18.1: For infants at ≥ 24 and < 28 weeks' gestation, data show no significant difference in risk of major brain injury between infants who received plastic wrap and those given routine care (RR 0.99, 95% CI 0.67 to 1.46; RD ‐0.00, 95% CI ‐0.05 to 0.05; one study; N = 753) (Analysis 1.18).
Mortality (death before hospital discharge or at six months' corrected age) (Outcome 1.19)
Ten studies comprising 1447 infants reported this outcome in terms of incidence of death within hospital stay or at six months' corrected age if infants in hospital in intervention and control groups (plastic wrap or bag and routine care) remain in hospital (Chantaroj 2011; Farhadi 2012; Knobel 2005; Leadford 2013; Reilly 2015; Rohana 2011; Smith 2013; Trevisanuto 2010; Vohra 1999; Vohra 2004). Mortality figures for Vohra 2004 included two infants who died in the delivery room. The study with greatest weighting (64.6%) in the meta‐analysis was powered for all‐cause mortality (at discharge or at six months' corrected gestation, if the infant remains in hospital) as the primary outcome measure (Reilly 2015). Mortality was a secondary outcome measure in the remaining nine studies. Each individual study showed no significant difference in effect across gestations.
Outcome 1.19.1: Overall, for infants at < 37 weeks' gestation, results of the meta‐analysis generally favour the intervention group (plastic wrap or bag), with the exception of Leadford 2013. However, overall data show no significant differences in risk of death within hospital stay (or at six months' corrected age) between infants who received plastic wrap or bag and those given routine care (typical RR 0.91, 95% CI 0.73 to 1.15; typical RD ‐0.01, 95% CI ‐0.05 to 0.02; 10 studies; N = 1447) (Analysis 1.19). The overall test for homogeneity passed with an I² value of 0% for RR and 22% for RD and for subgroup differences an I² value of 0%.
Outcome 1.19.2: For infants at < 28 weeks' gestation, data show no significant difference in risk of death within hospital stay (or at six months' corrected age) between infants who received plastic wrap or bag and those given routine care (typical RR 0.92, 95% CI 0.72 to 1.18; typical RD ‐0.02, 95% CI ‐0.06 to 0.03; six studies; N = 1114) (Analysis 1.19). The test for homogeneity passed with an I² value of 0% for RR but an I² value of 56% (moderate heterogeneity) for RD.
Outcome 1.19.3: For infants at 28 to 31 weeks' gestation, data show no significant difference in risk of death within hospital stay (or at six months' corrected age) between infants who received plastic wrap or bag and those given routine care (RR not estimable; RD 0.00, 95% CI ‐0.09 to 0.09; one study; N = 41) (Analysis 1.19).
Publication bias and investigation of heterogeneity
We inspected a funnel plot comparison (SE(log (RR)) vs RR) of mortality for plastic wrap or bag versus routine care for core body temperature in °C for possible publication bias (Figure 5). Findings suggest possible publication bias, but it is unlikely that this would affect findings of the meta‐analysis. On removal of two studies (Smith 2013; Vohra 1999), the test for homogeneity passed with an overall I² value of 0% (typical RR 0.98, 95% CI 0.77 to 1.24; eight studies; N = 1298), as did the test for the subgroup differences at < 28 weeks' gestation (typical RR 1.0, 95% CI 0.77 to 1.28; four studies; N = 1006).

Funnel plot of comparison: 1 Plastic wrap or bag versus routine care, outcome: 1.19 Mortality (death within hospital stay or at 6 months' corrected gestation).
Other secondary outcomes
Arterial oxygen saturation (percentage) (Outcome 1.20)
One study reported this outcome in terms of percentage oxygen saturation on admission to the NICU (Farhadi 2012). This was not a prespecified outcome at the review protocol stage.
Outcome 1.20.1: For infants at ≤ 32 weeks' gestation, data show no statistically significant differences between the two interventions (plastic bag and routine care) for arterial oxygen saturation (MD ‐4.10%, 95% CI ‐16.00 to 7.80; one study; N = 40) (Analysis 1.20).
Bicarbonate (mmol/L) (Outcome 1.21)
Two studies comprising 117 infants reported this outcome in terms of bicarbonate (mmol/L) (Trevisanuto 2010; Vohra 2004). This was not a prespecified outcome at the review protocol stage. Each individual study showed no significant differences in effect for infants at < 28 weeks' gestation.
Outcome 1.21.1: For infants at < 28 weeks' gestation, data show no statistically significant differences between the two interventions (plastic bag and routine care) for bicarbonate (MD 0.31 mmol/L, 95% CI ‐0.72 to 1.35; two studies; N = 117) (Analysis 1.21). The test for homogeneity passed with an I² value of 0%.
First blood gas pH (Outcome 1.22)
Two studies comprising 117 infants reported this outcome in terms of first blood gas pH (Trevisanuto 2010; Vohra 2004). This was not a prespecified outcome at the review protocol stage. Each individual study showed no significant differences in effect for infants at < 28 weeks' gestation. However, Vohra 2004 is tending towards favouring routine care, and Trevisanuto 2010 is tending towards favouring plastic bag.
Outcome 1.22.1: For infants at < 28 weeks' gestation, data show no statistically significant differences between the two interventions (plastic bag and routine care) for first blood gas pH (MD 0.01, 95% CI ‐0.02 to 0.04; two studies; N = 117) (Analysis 1.22). The test for homogeneity failed with an I² value of 70% (moderate heterogeneity). Because pH is on a logarithmic scale, it would be more appropriate to measure this outcome as a median value and range or interquartile range (IQR) to avoid its use as a continuous variable such as that prespecified at the review protocol stage: severe metabolic acidosis defined as pH < 7.20 and/or base deficit > 10 mmol/L within the first three days of life.
First blood gas pH < 7.25 (Outcome 1.23)
One study reported this outcome in terms of incidence of a first blood gas pH < 7.25 in intervention and control groups (plastic wrap and routine care) (Smith 2013).
Outcome 1.23.1: For infants at ≤ 29 weeks' gestation, data show no significant differences in risk of first blood gas pH < 7.25 between infants who received plastic wrap or bag and those given routine care (RR 0.81, 95% CI 0.55 to 1.20; RD ‐0.11, 95% CI ‐0.33 to 0.10; one study; N = 84) (Analysis 1.23).
First blood glucose concentration (mmol/L) (Outcome 1.24)
Four studies comprising 195 infants reported this outcome in terms of first blood glucose concentration (mmol/L) (Chantaroj 2011; Farhadi 2012; Trevisanuto 2010; Vohra 2004). When data were presented as mg/dL (USA Standard), we converted these to mmol/L (UK Standard). This was not a prespecified outcome at the review protocol stage, although hypoglycaemia defined by a blood glucose level < 2 mmol/L within two hours of birth was prespecified at the review protocol stage. Each individual study showed no significant differences in effect across gestations. Trevisanuto 2010 tended towards favouring plastic bag for infants at < 28 weeks' gestation.
Overall
For infants at ≤ 32 weeks' gestation, data show no statistically significant differences between the two interventions (plastic bag and routine care) for first blood glucose concentration (MD ‐0.14 mmol/L, 95% CI ‐0.50 to 0.21; four studies; N = 195). Overall, the test for homogeneity passed with an I² value of 11% but failed for subgroup differences with an I² value of 51.4% (moderate heterogeneity).
Outcome 1.24.1: For infants at ≤ 32 weeks' gestation (for whom no subgroup data were available), data show no statistically significant differences between the two interventions (plastic bag and routine care) for first blood glucose concentration (MD ‐0.62 mmol/L, 95% CI ‐1.37 to 0.12; two studies; N = 78) (Analysis 1.24). The test for homogeneity passed with an I² value of 0%.
Outcome 1.24.2: For infants at < 28 weeks' gestation, data show no statistically significant differences between the two interventions (plastic bag and routine care) for first blood glucose concentration (MD ‐0.00 mmol/L, 95% CI ‐0.41 to 0.41; two studies; N = 117) (Analysis 1.24). The test for homogeneity passed with an I² value of 0%.
First blood glucose concentration < 2.6 mmol/L (Outcome 1.25)
One study reported this outcome in terms of incidence of a first blood glucose concentration < 2.6 mmol/L in intervention and control groups (plastic wrap and routine care) (Smith 2013). This was not a prespecified outcome at the review protocol stage.
Outcome 1.25.1: For infants at ≤ 29 weeks' gestation, data show no significant difference in risk of first blood glucose concentration < 2.6 mmol/L between infants who received plastic wrap and those given routine care (RR 0.66, 95% CI 0.31 to 1.43; RD ‐0.10, 95% CI ‐0.28 to 0.08; one study; N = 85) (Analysis 1.25).
First blood glucose concentration > 6.0 mmol/L (Outcome 1.26)
One study reported this outcome of blood glucose concentration > 6.0 mmol/L in intervention and control groups (plastic wrap and routine care) (Smith 2013). This was not a prespecified outcome at the review protocol stage.
Outcome 1.26.1: For infants at ≤ 29 weeks' gestation, data show no significant difference in risk of first blood glucose concentration > 6.0 mmol/L between infants who received plastic wrap and those given routine care (RR 1.07, 95% CI 0.23 to 5.02; RD 0.00, 95% CI ‐0.10 to 0.11; one study; N = 85) (Analysis 1.26).
Blood glucose concentration (mmol/L) 120 minutes after birth (Outcome 1.27)
One study reported this outcome as a median value and IQR (Cardona Torres 2012). This was not a prespecified outcome at the review protocol stage.
Outcome 1.27.1: For infants at < 37 weeks' gestation, median blood glucose concentration (mmol/L) at 120 minutes after birth was comparable in intervention (plastic wrap or bag) and control (routine care) groups (one study; N = 60; P > 0.05) (Analysis 1.27).
Bronchopulmonary dysplasia (BPD) (Outcome 1.28)
One study reported this outcome in terms of a collapsed category analysis (Reilly 2015). Investigators provided no clear definition. This was not a prespecified outcome at the review protocol stage.
Outcome 1.28.1: For infants at ≥ 24 and < 28 weeks' gestation, data show no significant difference in risk of BPD between infants who received plastic wrap or bag and those given routine care (RR 0.99, 95% CI 0.86 to 1.15; RD ‐0.00, 95% CI ‐0.08 to 0.07; one study; N = 702) (Analysis 1.28).
Bronchopulmonary dysplasia (BPD) steroids (outcome 1.29)
One study reported this outcome in terms of incidence of BPD steroids in intervention and control groups (plastic wrap or bag and routine care) (Reilly 2015). This was not a prespecified outcome at the review protocol stage.
Outcome 1.29.1: For infants at ≥ 24 and < 28 weeks' gestation, data show no significant difference in risk of BPD steroids between infants who received plastic wrap or bag and those given routine care (RR 0.94, 95% CI 0.71 to 1.25; RD ‐0.01, 95% CI ‐0.07 to 0.04; one study; N = 796) (Analysis 1.29).
Duration of hospitalisation (days) (Outcome 1.30)
Two studies comprising 88 infants reported this outcome in terms of duration of hospital stay in days (Chantaroj 2011; Knobel 2005). Each individual study showed no significant difference in effect across gestations.
Overall
For infants at ≤ 32 weeks' gestation, data show no statistically significant differences between the two interventions (plastic bag and routine care) for duration of hospitalisation (MD ‐6.35 days, 95% CI ‐17.27 to 4.56; two studies; N = 126) (Analysis 1.30). Overall, the test for homogeneity passed with an I² value of 0% overall and for subgroup differences.
Outcome 1.30.1: For infants at ≤ 32 weeks' gestation or birth weight < 1500 grams (when no subgroup data were available), data show no statistically significant differences between the two interventions (plastic bag and routine care) for duration of hospitalisation (MD ‐7.50 days, 95% CI ‐24.17 to 9.17; one study; N = 38) (Analysis 1.30).
Outcome 1.30.2: For infants at < 28 weeks' gestation, data show no statistically significant differences between the two interventions (plastic bag and routine care) for duration of hospitalisation (MD ‐5.49 days, 95% CI ‐19.93 to 8.95; one study; N = 88) (Analysis 1.30).
Duration of hospitalisation (days) (Outcome 1.31)
One study reported this outcome as a median value with IQR (Rohana 2011).
Outcome 1.31.1: For infants at 24 to 33 weeks' gestation, median duration of hospitalisation was comparable in the intervention (plastic wrap) and control groups (routine care) (one study; N = 110; P = 0.29) (Analysis 1.31).
Duration of continuous positive airway pressure (CPAP) (days) (Outcome 1.32)
One study reported this outcome as a median value with IQR (Rohana 2011). This was not a prespecified outcome at the review protocol stage.
Outcome 1.32.1: For infants at 24 to 33 weeks' gestation, median duration (days) of CPAP was comparable in the intervention (plastic wrap) and control (routine care) groups (one study; N = 110; P = 0.29) (Analysis 1.32).
Duration of oxygen therapy (days) (Outcome 1.33)
One study reported this outcome in terms of duration of oxygen therapy (days) (Knobel 2005). This was not a prespecified outcome at the review protocol stage.
Outcome 1.33.1: For infants at < 29 weeks' gestation, data show no statistically significant differences between the two interventions (plastic bag and routine care) for duration of oxygen therapy (MD ‐6.51 days, 95% CI ‐23.30 to 10.28; one study; N = 88) (Analysis 1.33).
Duration of ventilation (days) (Outcome 1.34)
One study reported this outcome as a median value with IQR (Rohana 2011).
Outcome 1.34.1: For infants at 24 to 33 weeks' gestation, median duration of ventilation (days) was comparable in the intervention (plastic wrap) and control (routine care) groups (one study; N = 110; P = 0.30) (Analysis 1.34).
Gastrointestinal perforation (Outcome 1.35)
One study reported this outcome in terms of incidence of gastrointestinal perforation in the intervention and control groups (plastic wrap and routine care) (Reilly 2015). This was not a prespecified outcome at the review protocol stage.
Outcome 1.35.1: For infants at ≥ 24 and < 28 weeks' gestation, data show no significant differences in risk of gastrointestinal perforation between infants who received plastic wrap and those given routine care (RR 1.25, 95% CI 0.68 to 2.28; RD 0.01, 95% CI ‐0.02 to 0.04; one study; N = 795) (Analysis 1.35).
Intubation in delivery room (Outcome 1.36)
One study reported this outcome in terms of incidence of intubation in the delivery room in intervention and control groups (plastic bag and routine care) (Trevisanuto 2010).
Outcome 1.36.1: For infants at < 29 weeks' gestation, data show no significant differences in risk of intubation in the delivery room between infants who received plastic bag and those given routine care (RR 1.00, 95% CI 0.63 to 1.58; RD 0.00, 95% CI ‐0.24 to 0.24; one study; N = 64) (Analysis 1.36).
Necrotising enterocolitis (NEC) (Outcome 1.37)
Two studies comprising 907 infants reported this outcome in terms of incidence of NEC In intervention and control groups (plastic wrap and routine care) (Reilly 2015; Rohana 2011). Each individual study showed no significant difference in effect across gestations.
Overall for infants at ≥ 24 and ≤ 33 weeks' gestation, data show no significant differences in risk of NEC between infants who received plastic wrap and those given routine care (typical RR 1.01, 95% CI 0.65 to 1.58; typical RD 0.00, 95% CI ‐0.03 to 0.04; two studies; N = 907) (Analysis 1.37). Overall, the test for homogeneity passed with an I² value of 29% (low heterogeneity) for RR and 35% (low heterogeneity) for RD, and for subgroup differences an I² value of 28.6% (low heterogeneity) for RR and 26.9% (low heterogeneity) for RD.
Outcome 1.37.1: For infants at ≥ 24 and ≤ 33 weeks' gestation (when no subgroup data were available), data show no significant differences in risk of NEC between infants who received plastic wrap and those given routine care (RR 5.98, 95% CI 0.29 to 121.75; RD 0.04, 95% CI ‐0.02 to 0.10; one study; N = 110) (Analysis 1.37).
Outcome 1.37.2: For infants at ≥ 24 and < 28 weeks' gestation, data show no significant differences in risk of NEC between infants who received plastic wrap and those given routine care (RR 0.95, 95% CI 0.60 to 1.49; RD 0.00, 95% CI ‐0.04 to 0.03; one study; N = 797) (Analysis 1.37).
Patent ductus arteriosus (PDA) (Outcome 1.38)
Two studies comprising 905 infants reported this outcome in terms of incidence of PDA in intervention and control groups (plastic wrap and routine care) (Reilly 2015; Rohana 2011). Each individual study showed no significant differences in effect across gestations.
Overall for infants at ≥ 24 and ≤ 33 weeks' gestation, data show no significant differences in risk for PDA between infants who received plastic wrap and those given routine care (typical RR 0.90, 95% CI 0.78 to 1.03; typical RD ‐0.05, 95% CI ‐0.12 to 0.01; two studies; N = 905) (Analysis 1.38). Overall, the test for homogeneity passed with an I² value of 0% for RR and for RD, and for subgroup differences.
Outcome 1.38.1: For infants at ≥ 24 and ≤ 33 weeks' gestation (when no subgroup data were available), data show no significant differences in risk of PDA between infants who received plastic wrap and those given routine care (RR 0.80, 95% CI 0.39 to 1.62; RD ‐0.05, 95% CI ‐0.21 to 0.11; one study; N = 110) (Analysis 1.38).
Outcome 1.38.2: For infants at ≥ 24 and < 28 weeks' gestation, data show no significant differences in risk of PDA between infants who received plastic wrap and those given routine care (RR 0.90, 95% CI 0.79 to 1.04; RD ‐0.05, 95% CI ‐0.12 to 0.02; one study; N = 795) (Analysis 1.38).
Pneumothorax (Outcome 1.39)
One study reported this outcome in terms of incidence of pneumothorax in the intervention and control groups (plastic wrap and routine care) (Reilly 2015). This was not a prespecified outcome at the review protocol stage.
Outcome 1.39.1: For infants at ≥ 24 and < 28 weeks' gestation, data show no significant differences in risk of pneumothorax between infants who received plastic wrap and those given routine care (RR 0.98, 95% CI 0.56 to 1.69; RD ‐0.00, 95% CI ‐0.03 to 0.03; one study; N = 796) (Analysis 1.39).
Pulmonary haemorrhage (Outcome 1.40)
One study reported this outcome in terms of incidence of pulmonary haemorrhage during hospital stay in intervention and control groups (plastic wrap and routine care) (Reilly 2015). This was not a prespecified outcome at the review protocol stage.
Outcome 1.40.1: For infants at ≥ 24 and < 28 weeks' gestation, plastic wrap significantly reduced risk of pulmonary haemorrhage during hospital stay (RR 0.60, 95% CI 0.38 to 0.95; RD ‐0.04, 95% CI ‐0.08 to ‐0.01; one study; N = 796) (Analysis 1.40). Twenty‐five infants would have to be wrapped in plastic to prevent one infant from having a pulmonary haemorrhage (NNTB 25, 95% CI 13 to 100).
Requirement for bubble continuous positive airway pressure (BCPAP) (Outcome 1.41)
One study reported this outcome in terms of incidence of requirement for BCPAP in the intervention and control groups (plastic wrap and routine care) (Smith 2013). This was not a prespecified outcome at the review protocol stage.
Outcome 1.41.1: For infants at ≤ 29 weeks' gestation, data show no significant difference in risk of requirement for BCPAP between infants who received plastic wrap and those given routine care (RR 0.97, 95% CI 0.81 to 1.18; RD ‐0.02, 95% CI ‐0.18 to 0.13; one study; N = 92) (Analysis 1.41).
Requirement for ventilation (Outcome 1.42)
One study reported this outcome in terms of incidence of requirement for ventilation in intervention and control groups (plastic wrap and routine care) (Smith 2013).
Outcome 1.42.1: For infants at ≤ 29 weeks' gestation, data show no significant differences in risk of requirement for ventilation between infants who received plastic wrap and those given routine care (RR 0.92, 95% CI 0.70 to 1.20; RD ‐0.06, 95% CI ‐0.25 to 0.13; one study; N = 92) (Analysis 1.42).
Respiratory distress syndrome (RDS) (Outcome 1.43)
Two studies comprising 910 infants reported this outcome in terms of incidence of RDS in intervention and control groups (plastic wrap and routine care) (Reilly 2015; Rohana 2011). Each individual study showed no significant differences in effect across gestations.
Overall for infants at ≥ 24 and ≤ 33 weeks' gestation, data show no significant differences in risk of RDS between infants who received plastic wrap and those given routine care (typical RR 1.01, 95% CI 0.97 to 1.06; typical RD 0.01, 95% CI ‐0.03 to 0.05; two studies; N = 910) (Analysis 1.43). Overall, the test for homogeneity passed with an I² value of 0% overall for RR and RD, and for subgroup differences.
Outcome 1.43.1: For infants at ≥ 24 and ≤ 33 weeks' gestation (when no subgroup data were available), data show no significant differences in risk of RDS between infants who received plastic wrap and those given routine care (RR 1.04, 95% CI 0.78 to 1.38; RD 0.02, 95% CI ‐0.16 to 0.20; one study; N = 110) (Analysis 1.43).
Outcome 1.43.2: For infants at ≥ 24 and < 28 weeks' gestation, data show no significant differences in risk of RDS between infants who received plastic wrap and those given routine care (RR 1.01, 95% CI 0.97 to 1.05; RD 0.01, 95% CI ‐0.03 to 0.04; one study; N = 800) (Analysis 1.43).
Retinopathy of prematurity (ROP) (Outcome 1.44)
One study reported this outcome in terms of incidence of ROP in intervention and control groups (plastic wrap and routine care) (Reilly 2015). This was not a prespecified outcome at the review protocol stage.
Outcome 1.44.1: For infants at ≥ 24 and < 28 weeks' gestation, data show no significant differences in risk of gastrointestinal perforation between infants who received plastic wrap and those given routine care (RR 1.00, 95% CI 0.72 to 1.40; RD 0.00, 95% CI ‐0.06 to 0.06; one study; N = 606) (Analysis 1.44).
Sepsis (late) (Outcome 1.45)
Two studies comprising 830 infants reported this outcome in terms of incidence of late sepsis in intervention and control groups (plastic wrap and routine care) (Reilly 2015; Smith 2013). This was not a prespecified outcome at the review protocol stage. Each individual study showed no significant differences in effect for infants at ≤ 29 weeks' gestation.
Outcome 1.45.1: For infants at ≤ 29 weeks' gestation, data show no significant differences in risk of late sepsis between infants who received plastic wrap and those given routine care (typical RR 0.88, 95% CI 0.70 to 1.10; typical RD ‐0.03, 95% CI ‐0.09 to 0.02; two studies; N = 830) (Analysis 1.45). The test for homogeneity passed with an I² value of 9% for RR and 0% for RD.
Sepsis (early) (Outcome 1.46)
Two studies comprising 883 infants reported this outcome in terms of incidence of early sepsis in intervention and control groups (plastic wrap and routine care) (Reilly 2015; Smith 2013). This was not a prespecified outcome at the review protocol stage. Each individual study showed no significant differences in effect for infants at ≤ 29 weeks' gestation.
Outcome 1.46.1: For infants at ≤ 29 weeks' gestation, data show no significant differences in risk of early sepsis between infants who received plastic wrap and those given routine care (typical RR 0.69, 95% CI 0.38 to 1.29; typical RD ‐0.02, 95% CI ‐0.04 to 0.01; two studies; N = 883) (Analysis 1.46). The test for homogeneity passed with an I² value of 0% for RR and RD.
Other secondary outcomes
Leadford 2013 reported no significant differences in mean temperature after 24 hours of admission or in length of stay among infants admitted to the NICU (14 in the intervention group; nine in the control group). In addition, investigators did not document hypotension, hypoglycaemia, seizures in first 24 hours after birth, BPD, pneumothorax, major brain injury, bowel perforation, or pulmonary haemorrhage in any of these infants.
Researchers did not report the following secondary outcome measures (as predefined at the review protocol stage) for any of the included studies in this comparison group: surfactant given at any time, severe metabolic acidosis, chronic lung disease, or acute renal failure.
Adverse occurrences due to the intervention
Cardona Torres 2012 reported that the wrap procedure was well accepted by neonatal staff and did not interfere with resuscitation, and that none of the infants for whom polyethylene bags were used developed skin lesions or infection. Chantaroj 2011 stated that researchers identified no adverse events including hyperthermia, skin maceration, and infection in the control or polyethylene bag groups. Similarly, Gathwala 2010 reported no hyperthermia in the vinyl bag or control group. Farhadi 2012 made no reference to any adverse occurrences due to the intervention, other than one reported case of hyperthermia in the Zipkif plastic bag group. Knobel 2005 reported that one participant in the intervention group was hyperthermic with a rectal admission temperature of 38.3°C; the delivery room environmental temperature was 26.7°C. These investigators also reported that the clear, pliable polyurethane bag did not interfere with assessment (visualisation, auscultation, palpation) nor with resuscitative interventions. Leadford 2013 reported that none of the infants in either group were hyperthermic, and no infants developed skin side effects attributable to plastic bags. Rohana 2011 reported no other complications associated with the polyethylene wrap apart from two cases of hyperthermia in the wrap group. Trevisanuto 2010 reported that two infants in the plastic wrap group had an axillary admission temperature > 37.5°C (37.6°C and 38°C, respectively). Staff in the Smith 2013 study experienced some problems with the plastic wrap with regard to placement of the saturation probe and umbilical lines and the fact that prolonged resuscitation tended to displace the wrap. Investigators in Vohra 1999 described no occurrences of adverse events attributable to the intervention (i.e. hyperthermia, infection, skin maceration, or interference with resuscitation) among infants in the intervention and control groups. Vohra 2004 reported that the wrap procedure was accepted by neonatal staff and did not interfere with resuscitation in the delivery room. These investigators indicated that two infants in the intervention group had a rectal temperature on admission above 37.5°C.
None of the included studies reported the following secondary outcome measures (adverse occurrences) (as predefined at the review protocol stage) for this comparison group: burns, antibiotics, or negative psychological outcomes.
Plastic wrap versus routine care interhospital neonatal transport (Comparison 2)
One study comprising 96 infants compared polyethylene wrap versus routine care for infants at < 37 weeks' gestation and birth weight ≤ 2500 grams who were born in maternity homes or hospitals and subsequently underwent interhospital transport to the NICU (Bhavsar 2015).
Primary outcomes
Core body temperature (°C) of the infant taken on admission to NICU or up to two hours after birth (Outcome 2.1)
One study reported this outcome in terms of core body temperature in °C (axillary) on admission to NICU before the infant was unwrapped (Bhavsar 2015).
Outcome 2.1.1: For infants at < 37 weeks' gestation with birth weight ≤ 2500 grams, data show a statistically significant difference for core body temperature on admission to the NICU favouring the intervention (plastic wrap) group when compared with the group that received routine care immediately after birth in the delivery room (MD 0.70°C, 95% CI 0.32 to 1.08; one study; N = 96) (Analysis 2.1).
Hypothermia on admission to NICU (core body temperature < 36.5°C or skin temperature < 36°C) (Outcome 2.2)
Bhavsar 2015, in addition to reporting core body temperature on admission to the NICU as a continuous variable, provided data in a dichotomous format in terms of the incidence of hypothermia among intervention and control groups (plastic wrap and routine care). Researchers defined hypothermia as core body temperature (axillary) < 35°C on admission to the NICU.
Outcome 2.2.1: For infants at < 37 weeks' gestation with birth weight ≤ 2500 grams, plastic wrap significantly reduced risk of hypothermia on admission to the NICU (RR 0.48, 95% CI 0.27 to 0.84; RD ‐0.27, 95% CI ‐0.45 to ‐0.08; one study; N = 96). Four infants would have to be wrapped in plastic to prevent one from becoming hypothermic (NNTB 4, 95% CI 2 to 13) (Analysis 2.2).
Decrease in core body temperature (°C) from baseline before transport to NICU admission (Outcome 2.3)
One study reported this outcome in terms of a decrease in core body temperature from baseline before transport to NICU admission (Bhavsar 2015). This was not a prespecified outcome at the review protocol stage.
Outcome 2.3.1: For infants at < 37 weeks' gestation with birth weight ≤ 2500 grams, data show a statistically significant difference in decreased temperature from baseline before transport favouring the intervention (plastic wrap) group when compared with the group that received routine care immediately after birth in the delivery room (MD ‐0.40°C, 95% CI ‐0.61 to ‐0.19; one study; N = 96) (Analysis 2.3).
Secondary outcomes
Hyperthermia on admission to NICU: core body temperature > 37.5°C (Outcome 2.4)
Bhavsar 2015, in addition to reporting core body temperature on admission to the NICU as a continuous variable, provided data in a dichotomous format in terms of incidence of hyperthermia in the intervention and control groups (plastic wrap and routine care). Study authors defined hyperthermia as a core body temperature (axillary) > 37.5°C on admission to the NICU.
Outcome 2.4.1: For infants at < 37 weeks' gestation with birth weight ≤ 2500 grams, data show no significant differences in risk of hyperthermia on admission to the NICU between infants who received plastic wrap and those given routine care (RR 2.88, 95% CI 0.12 to 68.98; RD 0.02, 95% CI ‐0.03 to 0.08; one study; N = 96) (Analysis 2.4).
Base excess (Outcome 2.5)
One study reported this outcome in terms of base excess (Bhavsar 2015). Trial authors did not clearly state the measurement time point. This was not a prespecified outcome at the review protocol stage.
Outcome 2.5.1: For infants at < 37 weeks' gestation with birth weight ≤ 2500 grams, data show no statistically significant differences between the two intervention groups (plastic wrap and routine care) for base excess (MD 0.60, 95% CI ‐0.49 to 1.69; one study; N = 96) (Analysis 2.5).
Blood gas pH (Outcome 2.6)
One study reported this outcome in terms of blood gas pH (Bhavsar 2015). Researchers did not clearly state the measurement time point. This was not a prespecified outcome at the review protocol stage.
Outcome 2.6.1: For infants at < 37 weeks' gestation with birth weight ≤ 2500 grams, data show no statistically significant differences between the two intervention groups (plastic wrap and routine care) in blood gas pH (MD 0.00, 95% CI ‐0.02 to 0.02; one study; N = 96) (Analysis 2.6).
Duration of oxygen therapy (days) (Outcome 2.7)
One study reported this outcome in terms of duration of oxygen therapy (days) (Bhavsar 2015). This was not a prespecified outcome at the review protocol stage.
Outcome 2.7.1: For infants at < 37 weeks' gestation with birth weight ≤ 2500 grams, data show no statistically significant differences between the two interventions (plastic wrap and routine care) for duration of oxygen therapy (days) (MD ‐2.39, 95% CI ‐8.27 to 3.49; one study; N = 96) (Analysis 2.7).
Blood glucose level (mg/dL) within two hours of birth (Outcome 2.8)
One study reported this outcome in terms of results of hemo glucose tests (mg/dL) (Bhavsar 2015). This was not a prespecified outcome at the review protocol stage.
Outcome 2.8.1: For infants at < 37 weeks' gestation with birth weight ≤ 2500 grams, data show no statistically significant differences between the two interventions (plastic wrap and routine care) for blood glucose level within two hours of birth (MD 7.20, 95% CI ‐2.03 to 16.43; one study; N = 96) (Analysis 2.8).
Hypoglycaemia (blood glucose < 40 mg/dL) within two hours after birth (Outcome 2.9)
One study reported this outcome in terms of incidence of blood glucose < 40 mg/dL (2.3 mmol/L) within two hours after birth in intervention and control groups (plastic wrap and routine care) (Bhavsar 2015). This was not the prespecified definition of hypoglycaemia at the review protocol stage.
Outcome 2.9.1: For infants at < 37 weeks' gestation and birth weight ≤ 2500 grams, plastic wrap significantly reduced risk of hypoglycaemia within two hours after birth (RR 0.55, 95% CI 0.31 to 0.98; RD ‐0.20, 95% CI ‐0.39 to ‐0.02; one study; N = 96). Five infants would have to be wrapped in plastic to prevent one from becoming hypoglycaemic (NNTB 5, 95% CI 3 to 50) (Analysis 2.9).
Severe metabolic acidosis (Outcome 2.10)
One study reported this outcome in terms of incidence of pH < 7.20 and/or base deficit > 10 mmol/L within the first three days of life among intervention and control groups (plastic wrap and routine care) (Bhavsar 2015).
Outcome 2.10.1: For infants at < 37 weeks' gestation with birth weight ≤ 2500 grams, data show no significant differences in risk of severe metabolic acidosis within the first three days after birth between infants who received plastic wrap and those given routine care (RR 1.15, 95% CI 0.38 to 3.52; RD 0.02, 95% CI ‐0.11 to 0.14; one study; N = 96) (Analysis 2.10).
Other secondary outcomes
None of the included studies reported the following secondary outcome measures (as predefined at the review protocol stage) for this comparison group: respiratory distress syndrome, surfactant given at any time, intubation in the delivery room, requirement for ventilation, duration of ventilation, length of stay, mortality, IVH, PDA, chronic lung disease, NEC, or acute renal failure for infants in intervention and control groups.
Adverse occurrences due to the intervention
None of the included studies in this comparison group reported the following secondary outcome measures (adverse occurrences) (as predefined at the review protocol stage): burns, maceration, infection, antibiotics, skin maceration, interference with resuscitation, fluid problems, or negative psychological outcomes for infants in intervention and control groups.
Plastic bag with previous drying versus routine care (Comparison 3)
One study comprising 60 infants compared polyethylene bag with previous drying versus routine care for infants at ≥ 28 and < 37 weeks' gestation and birth weight ≥ 1000 and ≤ 2499 grams (Cardona Torres 2012).
Primary outcomes
Core body temperature (°C) of the infant taken on admission to NICU or up to two hours after birth
One study reported this outcome in terms of time to achieve a mean core body temperature (axillary) of 36.5°C and core body temperature in °C (axillary) of the infant every 15 minutes until two hours after birth (Cardona Torres 2012). These were not prespecified outcomes at the review protocol stage. For the purposes of this review, we have reported core body temperature in °C (axillary) at 30 minutes, 1 hour, 90 minutes, and 2 hours after birth.
Core body temperature (°C) of the infant taken at 30 minutes after birth (Outcome 3.1)
One study reported this outcome in terms of core body temperature in °C (axillary) at 30 minutes after birth (Cardona Torres 2012). This was not a prespecified outcome at the review protocol stage.
Outcome 3.1.1: For infants at ≥ 28 and < 37 weeks' gestation and birth weight ≥ 1000 and ≤ 2499 grams, data show a statistically significant difference for core body temperature 30 minutes after birth favouring the intervention (plastic bag with previous drying) group when compared with the group that received routine care immediately after birth in the delivery room (MD 0.30°C, 95% CI 0.12 to 0.48; one study; N = 60) (Analysis 3.1).
Core body temperature (°C) of the infant taken at one hour after birth (Outcome 3.2)
One study reported this outcome in terms of core body temperature in °C (axillary) 60 minutes after birth (Cardona Torres 2012). This was not a prespecified outcome at the review protocol stage.
Outcome 3.2.1 For infants at ≥ 28 and < 37 weeks' gestation with birth weight ≥ 1000 and ≤ 2499 grams, data show a statistically significant difference for core body temperature 60 minutes after birth favouring the intervention (plastic bag with previous drying) group when compared with the group that received routine care immediately after birth in the delivery room (MD 0.30°C, 95% CI 0.11 to 0.49; one study; N = 60) (Analysis 3.2) (Cardona Torres 2012).
Core body temperature (°C) of the infant taken at 90 minutes after birth (Outcome 3.3)
One study reported this outcome in terms of core body temperature in °C (axillary) 90 minutes after birth (Cardona Torres 2012). This was not a prespecified outcome at the review protocol stage.
Outcome 3.3.1: For infants at ≥ 28 and < 37 weeks' gestation with birth weight ≥ 1000 and ≤ 2499 grams, data show a statistically significant difference for core body temperature 90 minutes after birth favouring the intervention (plastic bag with previous drying) group when compared with the group that received routine care immediately after birth in the delivery room (MD 0.30°C, 95% CI 0.12 to 0.48; one study' N = 60) (Analysis 3.3).
Core body temperature (°C) of the infant taken at two hours after birth (Outcome 3.4)
One study reported this outcome in terms of core body temperature in °C (axillary) 120 minutes after birth (Cardona Torres 2012). This was not a prespecified outcome at the review protocol stage.
Outcome 3.4.1: For infants at ≥ 28 and < 37 weeks' gestation with birth weight ≥ 1000 and ≤ 2499 grams, data show a statistically significant difference for core body temperature 120 minutes after birth favouring the intervention (plastic bag with previous drying) group when compared with the group that received routine care immediately after birth in the delivery room (MD 0.40°C, 95% CI 0.24 to 0.56; one study; N = 60) (Analysis 3.4).
Hypothermia on admission to the NICU (core body temperature < 36.5°C or skin temperature < 36°C) (Outcome 3.5)
One study reported this outcome in terms of incidence of hypothermia in the intervention and control groups (plastic bag with previous drying and routine care) (Cardona Torres 2012). However, investigators provided no clear definition of hypothermia.
Outcome 3.5.1: For infants at ≥ 28 and < 37 weeks' gestation with birth weight ≥ 1000 and ≤ 2499 grams, data show no significant difference in risk of hypothermia on admission to the NICU between infants who received plastic bag with previous drying and those given routine care (RR 0.09, 95% CI 0.01 to 1.57; RD ‐0.17, 95% CI ‐0.31 to ‐0.03; one study; N = 60) (Analysis 3.5).
Computational errors can occur one or both arms of a study have a zero count, as is the case in Cardona Torres 2012. RevMan software compensates by adding 0.5 to each cell.
Secondary outcomes
Blood glucose concentration (mmol/L) 120 minutes after birth (Outcome 3.6)
One study reported this outcome (Cardona Torres 2012). When data were presented as mg/dL (USA Standard), we converted these to mmol/L (UK Standard). This was not a prespecified outcome at the review protocol stage.
Outcome 3.6.1: One study reported this outcome as a median value with interquartile range (IQR) (Cardona Torres 2012). For infants at ≥ 28 and < 37 weeks' gestation with birth weight ≥ 1000 and ≤ 2499 grams, median glucose concentrations at 120 minutes after birth were comparable in the intervention (plastic bag with previous drying) and control (routine care) groups (one study; N = 60: P > 0.05) (Analysis 3.6).
Other secondary outcomes
Cardona Torres 2012 reported no differences between groups for heart rate, respiratory rate, or blood pressure levels (measured by the flushing technique with a sphygmomanometer at 15 minutes, 1 hour, and 2 hours after birth).
None of the included studies reported the following secondary outcome measures (as predefined at the review protocol stage) for this comparison group: hypoglycaemia, respiratory distress syndrome, surfactant given at any time, intubation in the delivery room, requirement for ventilation, duration of ventilation, length of stay, mortality, severe metabolic acidosis, IVH, PDA, chronic lung disease, NEC, or acute renal failure.
Adverse occurrences due to the intervention
None of the included studies reported the following secondary outcome measures (adverse occurrences) (as predefined at the review protocol stage) for this comparison group: hyperthermia, burns, maceration, antibiotics, fluid problems, or negative psychological outcomes.
Cardona Torres 2012 reported that none of the neonates in the plastic bag with previous drying group developed any skin lesion, infection, or hyperthermia (definition not reported), and that the wrap procedure was well accepted by neonatal staff and did not interfere with resuscitation.
Plastic cap versus routine care (no cap) (Comparison 4)
One study comprising 64 infants compared polyethylene caps versus routine care for infants at < 29 weeks' gestation (Trevisanuto 2010).
Primary outcomes
Core body temperature (°C) of the infant taken on admission to the NICU or up to two hours after birth (Outcome 4.1)
One study reported this outcome in terms of core body temperature in °C (axillary) on admission to the NICU (Trevisanuto 2010).
Outcome 4.1.1: For infants at < 29 weeks' gestation, data show a statistically significant difference for core body temperature on admission to the NICU favouring the intervention (plastic cap) group when compared with the group that received routine care immediately after birth in the delivery room (MD 0.80°C, 95% CI 0.41 to 1.19; one study; N = 64) (Analysis 4.1).
Hypothermia on admission to the NICU (core body temperature < 36.4°C) (Outcome 4.2)
Trevisanuto 2010 in addition to reporting core body temperature on admission to the NICU as a continuous variable, provided data in a dichotomous format in terms of incidence of hypothermia in the intervention and control groups (plastic cap and routine care). Investigators defined hypothermia as a core body temperature (axillary) < 36.4°C on admission to the NICU.
Outcome 4.2.1: For infants at < 29 weeks' gestation, plastic cap significantly reduced risk of hypothermia on admission to the NICU (RR 0.48, 95% CI 0.32 to 0.73; RD ‐0.47, 95% CI ‐0.67 to ‐0.27; one study; N = 64). This finding is consistent with those for Outcome measure 4.1.1. Two infants would have to wear a plastic cap to prevent one infant from becoming hypothermic (NNTB 2, 95% CI 2 to 4) (Analysis 4.2).
Outside the normothermic range on admission to the NICU or up to two hours after birth (Outcome 4.3)
We derived this outcome for one study in terms of incidence of core body temperature (axillary) outside the normothermic range in the intervention and control groups (plastic cap and routine care) (Trevisanuto 2010). Investigators defined normothermic range as core body temperature (axillary) within the range 36.4°C to 37.5°C on admission to the NICU. This was not a prespecified outcome at the review protocol stage.
Outcome 4.3.1: For infants at < 29 weeks' gestation, plastic cap significantly reduced the risk of having a core body temperature outside the normothermic range on admission to the NICU (RR 0.48, 95% CI 0.32 to 0.73; RD ‐0.47, 95% CI ‐0.67 to ‐0.27; one study; N = 64). Two infants would have to receive a plastic cap to prevent one infant from having a core body temperature outside the normothermic range on admission to the NICU (NNTB 2, 95% CI 2 to 4) (Analysis 4.3).
Core body temperature taken one hour after initial admission temperature to the NICU was taken (Outcome 4.4)
One study reported this outcome in terms of core body temperature in °C (axillary) taken one hour after the initial NICU admission was taken (Trevisanuto 2010). This was not a prespecified outcome at the review protocol stage.
Outcome 4.4.1: For infants at < 29 weeks' gestation, data show a statistically significant difference for core body temperature taken one hour after initial NICU admission temperature was taken favouring the intervention (plastic cap) group when compared with the group that received routine care immediately after birth in the delivery room (MD 0.80°C, 95% CI 0.46 to 1.14; one study; N = 64) (Analysis 4.4).
Secondary outcomes
Major brain injury (defined as sonographic evidence of IVH with ventricular dilatation, parenchymal haemorrhagic infarction, or periventricular leukomalacia) (Outcome 4.5)
One study reported this outcome in terms of incidence of major brain injury (defined as sonographic evidence of IVH with ventricular dilatation, parenchymal haemorrhagic infarction, or periventricular leukomalacia) in intervention and control groups (plastic cap and routine care) (Trevisanuto 2010). This was not a prespecified outcome at the review protocol stage.
Outcome 4.5.1: For infants at < 29 weeks' gestation, data show no significant difference in risk of major brain injury between infants who received plastic cap and those given routine care (RR 1.50, 95% CI 0.27 to 8.38; RD 0.03, 95% CI ‐0.10 to 0.16; one study; N = 64) (Analysis 4.5).
Mortality (death within hospital stay) (Outcome 4.6)
One study reported this outcome in terms of incidence of death within hospital stay in intervention and control groups (plastic cap and routine care) (Trevisanuto 2010).
Outcome 4.6.1: For infants at < 29 weeks' gestation, data show no significant differences in risk of death within hospital stay between infants who received plastic cap and those given routine care (RR 1.50, 95% CI 0.27 to 8.38; RD 0.03, 95% CI ‐0.10 to 0.16; one study; N = 64) (Analysis 4.6).
Bicarbonate (mmol/L) (Outcome 4.7)
One study reported this outcome (Trevisanuto 2010). This was not a prespecified outcome at the review protocol stage.
Outcome 4.7.1: For infants at < 29 weeks' gestation, data show no statistically significant differences between the two interventions (plastic cap and routine care) for bicarbonate (MD 1.00 mmol/L, 95% CI ‐0.25 to 2.25; one study; N = 64) (Analysis 4.7).
Blood gas pH (first) (Outcome 4.8)
One study reported this outcome in terms of first blood pH (Trevisanuto 2010). This was not a prespecified outcome at the review protocol stage.
Outcome 4.8.1: For infants at < 29 weeks' gestation, data show no statistically significant differences between the two interventions (plastic cap and routine care) for first blood gas pH (MD 0.01, 95% CI ‐0.03 to 0.05; one study; N = 64) (Analysis 4.8). Because pH is on a logarithmic scale, it would be more appropriate to measure this outcome as a median value and range or IQR, or to avoid its use as a continuous variable such as that prespecified at the review protocol stage: severe metabolic acidosis defined as pH < 7.20 and/or base deficit > 10 mmol/L within the first three days of life.
First serum glucose concentration (mmol/L) on admission to the NICU (Outcome 4.9)
One study reported this outcome in terms of first serum glucose concentration (mmol/L) on admission to the NICU (Trevisanuto 2010). This was not a prespecified outcome at the review protocol stage.
Outcome 4.9.1: For infants at < 29 weeks' gestation, data show no statistically significant differences between the two interventions (plastic cap and routine care) for first serum glucose concentration (MD 0.10 mmol/L, 95% CI ‐0.42 to 0.62; one study; N = 64 (Analysis 4.9).
Intubation at birth (Outcome 4.10)
One study reported this outcome in terms of incidence of intubation at birth in the intervention and control groups (plastic cap and routine care) (Trevisanuto 2010).
Outcome 4.10.1: For infants at < 29 weeks' gestation, data show no significant differences in risk of intubation at birth between infants who received plastic cap and those given routine care (RR 0.82, 95% CI 0.49 to 1.37; RD ‐0.09, 95% CI ‐0.34 to 0.15; one study; N = 64) (Analysis 4.10).
Other secondary outcomes
None of the included studies reported the following secondary outcome measures (as predefined at the review protocol stage) for this comparison group: hypoglycaemia, respiratory distress syndrome, surfactant given at any time, requirement for ventilation, duration of ventilation, severe metabolic acidosis, IVH, PDA, chronic lung disease, NEC, or acute renal failure.
Adverse occurrences due to the intervention
Trevisanuto 2010 reported that no infants had hyperthermia (axillary temperature on admission > 37.5°C) in the plastic cap group or among those receiving routine care immediately at birth. None of the included studies reported the following secondary outcome measures (adverse occurrences) (as predefined at the review protocol stage) for this comparison group: burns, infection, antibiotics, skin maceration, interference with resuscitation, or negative psychological outcomes for infants in either group.
Plastic bag and plastic cap versus routine care (Comparison 5)
Two studies comprising 122 infants compared plastic bag + plastic cap versus routine care for infants at ≥ 28 and ≤ 32 weeks' gestation (Talakoub 2015), nor for infants at ≥ 28 and ≤ 36 weeks' gestation (Tescon‐delos Santos 2012).
Primary outcomes
Core body temperature (°C) of the infant taken on admission to the NICU or up to two hours after birth (Outcome 5.1)
Two studies comprising 122 infants reported this outcome in terms of core body temperature in °C (axillary) at the 10th, 15th, 30th, and 60th minutes of life (Tescon‐delos Santos 2012), as well as upon admission to the NICU (Talakoub 2015; Tescon‐delos Santos 2012), and at one and two hours after the initial NICU admission temperature was taken (Tescon‐delos Santos 2012). Each individual study showed a significant effect ‐ as in Talakoub 2015 ‐ or provided data tending towards favouring the intervention (plastic wrap or bag) ‐ as in Tescon‐delos Santos 2012.
Outcome 5.1.1: For infants at ≥ 28 and ≤ 36 weeks' gestation, data show a statistically significant difference for core body temperature on admission to the NICU favouring the intervention (plastic bag + plastic cap) group when compared with the group that received routine care immediately after birth in the delivery room (MD 0.32°C, 95% CI 0.15 to 0.50; two studies; N = 122) (Analysis 5.1).
The test for homogeneity failed with an I² value of 90% (high heterogeneity). This heterogeneity could possibly be attributed to differences in included gestational ages at ≥ 28 and ≤ 32 weeks ‐ as in Talakoub 2015 ‐ and at ≥ 28 and ≤ 36 weeks ‐ as in Tescon‐delos Santos 2012.
Core body temperature (°C) of the infant taken at the 10th minute of life (Outcome 5.2)
One study reported this outcome in terms of core body temperature in °C (axillary) at the 10th minute of life (Tescon‐delos Santos 2012).
Outcome 5.2.1: For infants at ≥ 28 and ≤ 36 weeks' gestation, data show no statistically significant differences between the two interventions (plastic bag + plastic cap and routine care) for core body temperature at the 10th minute of life (MD ‐0.27°C, 95% CI ‐0.55 to 0.01; one study; N = 58) (Analysis 5.2).
Core body temperature (°C) of the infant taken at the 15th minute of life (Outcome 5.3)
One study reported this outcome in terms of core body temperature in °C (axillary) at the 15th minute of life (Tescon‐delos Santos 2012).
Outcome 5.3.1: For infants at ≥ 28 and ≤ 36 weeks' gestation, data show no statistically significant differences between the two interventions (plastic bag + plastic cap and routine care) for core body temperature at the 15th minute of life (MD ‐0.26°C, 95% CI ‐0.56 to 0.05; one study; N = 58) (Analysis 5.3).
Core body temperature (°C) of the infant taken at the 30th minute of life (Outcome 5.4)
One study reported this outcome in terms of core body temperature in °C (axillary) at the 30th minute of life (Tescon‐delos Santos 2012).
Outcome 5.4.1: For infants at ≥ 28 and ≤ 36 weeks' gestation, data show no statistically significant differences between the two interventions (plastic bag + plastic cap and routine care) for core body temperature (axillary °C) at the 30th minute of life (MD 0.06°C, 95% CI ‐0.23 to 0.35; one study; N = 58) (Analysis 5.4).
Core body temperature (°C) of the infant taken at one hour of life (Outcome 5.5)
One study reported this outcome in terms of core body temperature in °C (axillary) at one hour of life (Tescon‐delos Santos 2012).
Outcome 5.5.1: For infants at ≥ 28 and ≤ 36 weeks' gestation, data show no statistically significant differences between the two interventions (plastic bag + plastic cap and routine care) for core body temperature (axillary °C) at one hour of life (MD ‐0.02°C, 95% CI ‐0.32 to 0.27; one study; N = 58) (Analysis 5.5).
Core body temperature (°C) of the infant taken at one hour after the initial NICU admission temperature was taken (Outcome 5.6)
One study reported this outcome in terms of core body temperature in °C (axillary) one hour after the initial NICU temperature was taken (Talakoub 2015).
Outcome 5.6.1: For infants at ≥ 28 and ≤ 32 weeks' gestation, data show a statistically significant difference for core body temperature one hour after the initial NICU admission temperature was taken favouring the intervention (plastic bag + plastic cap) group when compared with the group that received routine care immediately after birth in the delivery room (MD 0.83°C, 95% CI 0.37 to 1.29; one study; N = 64) (Analysis 5.6).
Core body temperature (°C) of the infant taken at two hours after the initial NICU admission temperature was taken (Outcome 5.7)
One study reported this outcome in terms of core body temperature in °C (axillary) two hours after the initial NICU admission temperature was taken (Talakoub 2015).
Outcome 5.7.1: For infants at ≥ 28 and ≤ 32 weeks' gestation, data show a statistically significant difference for core body temperature two hours after the initial NICU admission temperature was taken favouring the intervention (plastic bag + plastic cap) group when compared with the group that received routine care immediately after birth in the delivery room (MD 1.11°C, 95% CI 0.65 to 1.57; one study; N = 64) (Analysis 5.7).
Secondary outcomes
Hyperthermia (core body temperature > 37.0°C on admission to the NICU (Outcome 5.8)
Two studies comprising 122 infants reported this outcome (Talakoub 2015; Tescon‐delos Santos 2012). Tescon‐delos Santos 2012, in addition to reporting core body temperature on admission to the NICU as a continuous variable, provided data in a dichotomous format in terms of incidence of hyperthermia in the intervention and control groups (plastic bag + plastic cap and routine care). Investigators defined hyperthermia as a core body temperature (axillary) > 37.0°C on admission to the NICU. Talakoub 2015 did not provide a clear definition for hyperthermia but reported no hyperthermia in either group.
Outcome 5.8.1: For infants at ≥ 28 and ≤ 36 weeks' gestation, data show no significant difference in risk of hyperthermia between infants who received plastic bag + plastic cap and those given routine care (typical RR 0.18, 95% CI 0.02 to 1.39; typical RD ‐0.08, 95% CI ‐0.16 to 0.00; one study; N = 122) (Analysis 5.8).
The test for homogeneity failed with an I² value of 87% (high heterogeneity) for RD. This heterogeneity could possibly be attributed to differences in included gestational ages at ≥ 28 and ≤ 32 weeks ‐ in Talakoub 2015 ‐ and at ≥ 28 and ≤ 36 weeks ‐ in Tescon‐delos Santos 2012.
Hyponatraemia (Outcome 5.9)
One study reported this outcome in terms of incidence of serum sodium concentration < 130 mmol/L in intervention and control groups (plastic bag + plastic cap and routine care) (Tescon‐delos Santos 2012).
Outcome 5.9.1: For infants at ≥ 28 and ≤ 36 weeks' gestation, data show no significant differences in risk of hyponatraemia between infants who received plastic bag + plastic cap and those given routine care (RR 1.43, 95% CI 0.35 to 5.83; RD 0.04, 95% CI ‐0.13 to 0.21; one study; N = 58) (Analysis 5.9).
Weight (grams) at fifth day of life (Outcome 5.10)
One study reported this outcome in terms of weight (grams) on the fifth day of life or the last day of life if death occurred before the fifth day (Tescon‐delos Santos 2012). This outcome measure was designed to assess whether an infant had greater than 20% body weight loss by the fifth day of life. This was not a prespecified outcome at the review protocol stage.
Outcome 5.10.1: For infants at ≥ 28 and ≤ 36 weeks' gestation, data show no statistically significant differences between the two interventions (plastic bag + plastic cap and routine care) for weight (grams) on the fifth day of life (MD ‐74.20 g, 95% CI ‐301.63 to 153.23; one study; N = 58) (Analysis 5.10).
Outcome 5.10.2: For infants at ≥ 28 and ≤ 36 weeks' gestation, data show no reported cases when the infant lost more than 20% body weight by the fifth day of life.
Other secondary outcomes
Tescon‐delos Santos 2012 reported no cases of skin infection in terms of inflammation of the skin caused by a pathogenic organism (bacteria, virus, or fungi) and no cases of systemic infection (culture‐positive sepsis) in both intervention (plastic bag + plastic cap) and control (routine care) groups.
Investigators did not report the following secondary outcome measures (as predefined at the review protocol stage) for any of the included studies in this comparison group: hypoglycaemia, respiratory distress syndrome, surfactant given at any time, intubation in the delivery room, requirement for ventilation, duration of ventilation, length of stay, severe metabolic acidosis, IVH, PDA, chronic lung disease, NEC, or acute renal failure.
Adverse occurrences due to the intervention
Tescon‐delos Santos 2012 reported no cases of skin burns or maceration in both intervention (plastic bag + plastic cap) and control (routine care) groups. None of the included studies reported the following secondary outcome measures (adverse occurrences) (as predefined at the review protocol stage) for this comparison group: antibiotics or negative psychological outcomes.
Plastic bag with previous drying versus plastic bag without previous drying (Comparison 6)
One study comprising 60 infants compared polyethylene bag with previous drying versus polyethylene bag without previous drying for infants at ≥ 28 and < 37 weeks' gestation with birth weight ≥ 1000 and ≤ 2499 grams (Cardona Torres 2012).
Primary outcomes
Core body temperature (°C) of the infant taken on admission to the NICU or up to two hours after birth
One study reported this outcome in terms of time to achieve a mean core body temperature (axillary) of 36.5°C and core body temperature in °C (axillary) of the infant every 15 minutes until two hours after birth (Cardona Torres 2012). These were not prespecified outcomes at the review protocol stage. For the purposes of this review, we have reported core body temperature in °C (axillary) at 30 minutes, 1 hour, 90 minutes, and 2 hours after birth
Core body temperature (°C) 30 minutes after birth (Outcome 6.1)
One study reported this outcome in terms of core body temperature in °C (axillary) 30 minutes after birth (Cardona Torres 2012). This was not a prespecified outcome at the review protocol stage.
Outcome 6.1.1: For infants at ≥ 28 and < 37 weeks' gestation with birth weight ≥ 1000 and ≤ 2499 grams, data show no statistically significant differences between the two interventions (plastic bag with previous drying vs plastic bag without previous drying) for core body temperature 30 minutes after birth (MD 0.0°C, 95% CI ‐0.17 to 0.17; one study; N = 60) (Analysis 6.1).
Core body temperature (°C) of the infant taken at one hour after birth (Outcome 6.2)
One study reported this outcome in terms of core body temperature in °C (axillary) 60 minutes after birth (Cardona Torres 2012). This was not a prespecified outcome at the review protocol stage.
Outcome 6.2.1: For infants at ≥ 28 and < 37 weeks' gestation with birth weight ≥ 1000 and ≤ 2499 grams, data show no statistically significant differences between the two interventions (plastic bag with previous drying vs plastic bag without previous drying) for core body temperature 60 minutes after birth (MD ‐0.10 °C, 95% CI ‐0.28 to 0.08; one study; N = 60) (Analysis 6.2).
Core body temperature (°C) of the infant taken at 90 minutes after birth (Outcome 6.3)
One study reported this outcome in terms of core body temperature in °C (axillary) 90 minutes after birth (Cardona Torres 2012). This was not a prespecified outcome at the review protocol stage.
Outcome 6.3.1: For infants at ≥ 28 and < 37 weeks' gestation with birth weight ≥ 1000 and ≤ 2499 grams, data show no statistically significant differences between the two interventions (plastic bag with previous drying vs plastic bag without previous drying) for core body temperature 90 minutes after birth (MD ‐0.10°C, 95% CI ‐0.29 to 0.09; one study; N = 60) (Analysis 6.3).
Core body temperature (°C) of the infant taken at two hours after birth (Outcome 6.4)
One study reported this outcome in terms of core body temperature in °C (axillary) 120 minutes after birth (Cardona Torres 2012). This was not a prespecified outcome at the review protocol stage.
Outcome 6.4.1: For infants at ≥ 28 and < 37 weeks' gestation with birth weight ≥ 1000 and ≤ 2499 grams, data show no statistically significant differences between the two interventions (plastic bag with previous drying vs plastic bag without previous drying) for core body temperature 120 minutes after birth (MD 0.10°C, 95% CI ‐0.04 to 0.24; one study; N = 60) (Analysis 6.4).
Secondary outcomes
Hyperthermia on admission to the NICU: core body temperature > 37.5°C (Outcome 6.5)
Cardona Torres 2012, in addition to reporting core body temperature on admission to the NICU as a continuous variable, provided data in a dichotomous format in terms of incidence of hyperthermia in the intervention and comparison groups (plastic bag with previous drying vs plastic bag without previous drying). Investigators did not provide a clear definition of hyperthermia. Data show one case of hyperthermia (definition not reported) in the plastic bag without previous drying group (37.7°C).
Outcome 6.5.1: For infants at ≥ 28 and < 37 weeks' gestation with birth weight ≥ 1000 and ≤ 2499 grams, data show no significant differences in risk of hyperthermia between infants who received plastic bag with previous drying and those given plastic bag without previous drying (RR 0.33, 95% CI 0.01 to 7.87; RD ‐0.03, 95% CI ‐0.12 to 0.05; one study; N = 60) (Analysis 6.5).
Blood glucose concentration (mmol/L) at 120 minutes after birth (Outcome 6.6)
One study reported this outcome as a median value with IQR (Cardona Torres 2012). Data were converted to the International System of Units (SI) mmol/L from mg/dL. This was not a prespecified outcome at the review protocol stage.
Outcome 6.6.1: For infants at ≥ 28 and < 37 weeks' gestation with birth weight ≥ 1000 and ≤ 2499 grams, median blood glucose concentrations at 120 minutes after birth were comparable in the intervention (plastic bag with drying) and active comparator groups (plastic bag without drying) (one study; N = 60; P > 0.05) (Analysis 6.6).
Other secondary outcomes
Cardona Torres 2012 reported no hypothermia (clear definition not provided) in the plastic bag with pr without previous drying groups.
None of the included studies reported the following secondary outcome measures (as predefined at the review protocol stage) for this comparison group: hypoglycaemia, respiratory distress syndrome, surfactant given at any time, intubation in the delivery room, requirement for ventilation, duration of ventilation, length of stay, mortality, severe metabolic acidosis, IVH, PDA, chronic lung disease, NEC, and acute renal failure.
Adverse occurrences due to the intervention
Cardona Torres 2012 reported that none of the neonates in the plastic bag with or without previous drying group developed lesions of the skin or infection. Cardona Torres 2012 also reported that the wrap procedure was well accepted by neonatal staff and did not interfere with resuscitation.
None of the included studies reported the following secondary outcome measures (adverse occurrences) (as predefined at the review protocol stage) for this comparison group: burns, maceration, antibiotics, fluid problems, or negative psychological outcomes.
Plastic cap versus plastic bag (no cap) (Comparison 7)
One study comprising 64 infants compared polyethylene caps versus polyethylene bags for infants at < 29 weeks' gestation (Trevisanuto 2010).
Primary outcomes
Core body temperature (°C) of the infant taken on admission to the NICU or up to two hours after birth (Outcome 7.1)
One study reported this outcome in terms of core body temperature in °C (axillary) on admission to the NICU (Trevisanuto 2010).
Outcome 7.1.1: For infants at < 29 weeks' gestation, data show no statistically significant differences between the two interventions (plastic cap and plastic bag) for core body temperature on admission to the NICU (MD 0.30°C, 95% CI ‐0.12 to 0.72; one study; N = 64) (Analysis 7.1).
Hypothermia on admission to the NICU (core body temperature < 36.4°C) (Outcome 7.2)
Trevisanuto 2010, in addition to reporting core body temperature on admission to the NICU as a continuous variable, provided data in a dichotomous format in terms of incidence of hypothermia in the intervention and comparison groups (plastic cap and plastic bag). Investigators defined hypothermia as a core body temperature (axillary) < 36.4°C on admission to the NICU.
Outcome 7.2.1: For infants at < 29 weeks' gestation, data show no significant differences in risk of hypothermia on admission to the NICU between infants who received plastic cap and those given plastic bag (RR 0.70, 95% CI 0.43 to 1.13; RD ‐0.19, 95% CI ‐0.43 to 0.05; one study; N = 64) (Analysis 7.2).
Outside normothermic range on admission to the NICU or up to two hours after birth (Outcome 7.3)
We derived this outcome for one study in terms of incidence of core body temperature (axillary) outside the normothermic range of 36.4°C to 37.5°C on admission to the NICU among intervention and comparison groups (plastic cap and plastic bag) (Trevisanuto 2010). This was not a prespecified outcome at the review protocol stage.
Outcome 7.3.1: For infants at < 29 weeks' gestation, data show no significant difference (borderline) in risk of having a core body temperature outside the normothermic range on admission to the NICU between infants who received plastic cap and those given plastic bag (RR 0.64, 95% CI 0.40 to 1.01; RD ‐0.25, 95% CI ‐0.49 to ‐0.01; one study; N = 64) (Analysis 7.3).
Core body temperature taken one hour after initial NICU admission temperature was taken (Outcome 7.4)
One study reported this outcome in terms of core body temperature in °C (axillary) (Trevisanuto 2010). This was not a prespecified outcome at the review protocol stage.
Outcome 7.4.1: For infants at < 29 weeks' gestation, data show a borderline statistically significant difference for core body temperature taken one hour after the initial NICU admission temperature was taken favouring the intervention (plastic cap) group when compared with the group that received plastic bag immediately after birth in the delivery room (MD 0.30°C, 95% CI 0.00 to 0.60; one study; N = 64) (Analysis 7.4).
Secondary outcomes
Hyperthermia on admission to the NICU: core body temperature > 37.5°C (Outcome 7.5)
Trevisanuto 2010, in addition to reporting core body temperature on admission to the NICU as a continuous variable, provided data in a dichotomous format in terms of incidence of hyperthermia among intervention and comparison groups (plastic cap and plastic bag). Investigators defined hyperthermia as a core body temperature (axillary) > 37.5°C on admission to the NICU.
Outcome 7.5.1: For infants at < 29 weeks' gestation, data show no significant difference in risk of hyperthermia on admission to the NICU between infants who received plastic cap and those given plastic bag (RR 0.20, 95% CI 0.01 to 4.01; RD ‐0.06, 95% CI ‐0.16 to 0.04; one study; N = 60) (Analysis 7.5).
Major brain injury (defined as sonographic evidence of IVH with ventricular dilatation, parenchymal haemorrhagic infarction, or periventricular leukomalacia) (Outcome 7.6)
One study reported this outcome in terms of incidence of major brain injury defined as sonographic evidence of IVH with ventricular dilatation, parenchymal haemorrhagic infarction, or periventricular leukomalacia in the intervention and comparison groups (plastic cap and plastic bag) (Trevisanuto 2010). This was not a prespecified outcome at the review protocol stage.
Outcome 7.6.1: For infants at < 29 weeks' gestation, data show no significant difference in risk of major brain injury between infants who received plastic cap and those given plastic bag (RR 1.50, 95% CI 0.27 to 8.38; RD 0.03, 95% CI ‐0.10 to 0.16; one study; N = 64) (Analysis 7.6).
Mortality (death within hospital stay) (Outcome 7.7)
One study reported this outcome in terms of incidence of death within hospital stay in the intervention and comparison groups (plastic cap and plastic bag) (Trevisanuto 2010).
Outcome 7.7.1: For infants at < 29 weeks' gestation, data show no significant difference in risk of death within hospital stay between infants who received plastic cap and those given plastic bag (RR 1.50, 95% CI 0.27 to 8.38; RD 0.03, 95% CI ‐0.10 to 0.16; one study; N = 64) (Analysis 7.7).
Bicarbonate concentration (mmol/L) (Outcome 7.8)
One study reported this outcome in terms of bicarbonate concentration (mmol/L) (Trevisanuto 2010). This was not a prespecified outcome at the review protocol stage.
Outcome 7.8.1: For infants at < 29 weeks' gestation, data show a borderline statistically significant difference for bicarbonate concentration favouring the intervention (plastic cap) group when compared with the group that received plastic bag immediately after birth in the delivery room (MD 1.00 mmol/L, 95% CI 0.02 to 1.98; one study; N = 64) (Analysis 7.8).
Blood gas pH (first) (Outcome 7.9)
One study reported this outcome in terms of first blood gas pH (Trevisanuto 2010). This was not a prespecified outcome at the review protocol stage. Because pH is on a logarithmic scale, it would be more appropriate to measure this outcome as a median value with range or IQR, or to avoid its use as a continuous variable such as those prespecified at the review protocol stage: severe metabolic acidosis as defined by pH < 7.20 and/or base deficit > 10 mmol/L within the first three days of life.
Outcome 7.9.1: For infants at < 29 weeks' gestation, data show no statistically significant differences between the two interventions (plastic cap and plastic bag) for first blood gas pH (MD ‐0.02, 95% CI ‐0.06 0.02; one study, n = 64) (Analysis 7.9).
First serum glucose concentration (mmol/L) (Outcome 7.10)
One study reported this outcome in terms of first serum glucose concentration (mmol/L) on admission to the NICU (Trevisanuto 2010).
Outcome 7.10.1: For infants at < 29 weeks' gestation, data show no statistically significant differences between the two interventions (plastic cap and plastic bag) for first serum glucose concentration on admission to the NICU (MD 0.00 mmol/L, 95% CI, ‐0.50 to 0.50; one study; N = 64) (Analysis 7.10).
Intubation at birth (Outcome 7.11)
One study reported this outcome in terms of incidence of intubation at birth in the intervention and comparison groups (plastic cap and plastic bag) (Trevisanuto 2010).
Outcome 7.11.1: For infants at < 29 weeks' gestation, data show no significant difference in risk of intubation at birth between infants who received plastic cap and those given plastic bag (RR 0.82, 95% CI 0.49 to 1.37; RD ‐0.09, 95% CI ‐0.34 to 0.15; one study; N = 64) (Analysis 7.11).
Other secondary outcomes
None of the included studies reported the following secondary outcome measures (as predefined at the review protocol stage) for this comparison group: hypoglycaemia, respiratory distress syndrome, surfactant given at any time, requirement for ventilation, duration of ventilation, severe metabolic acidosis, IVH, PDA, chronic lung disease, NEC, or acute renal failure.
Adverse occurrences due to the intervention
Trevisanuto 2010 reported that use of an oximetry indicates opening of the bag during placement of the sensor, which reduces the temperature protective effect.
None of the included studies reported the following secondary outcome measures (adverse occurrences) (as predefined at the review protocol stage) for this comparison group: burns, infection, antibiotics, skin maceration, interference with resuscitation, or negative psychological outcomes for infants in the intervention and control groups.
Plastic bag versus plastic wrap (Comparison 8)
One study comprising 59 infants compared vinyl bag versus polyethylene wrap for infants at ≤ 32 weeks' gestation (Caglar 2014).
Primary outcomes
Core body temperature (°C) of the infant taken on admission to the NICU or up to two hours after birth
One study reported this outcome in terms of core body temperature in °C (axillary) at 20, 40, and 60 minutes after birth and decrease in core body temperature during the first hour after birth (Caglar 2014).
Core body temperature (°C) of the infant taken at 20 minutes after birth (Outcome 8.1)
Outcome 8.1.1: For infants at ≤ 32 weeks' gestation, data show a statistically significant difference for core body temperature taken at 20 minutes after birth favouring the intervention (plastic bag) group when compared with the group that received plastic wrap immediately after birth in the delivery room (MD 0.14°C, 95% CI 0.08 to 0.20; one study; N = 59) (Analysis 8.1).
Core body temperature (°C) of the infant taken at 40 minutes after birth (Outcome 8.2)
Outcome 8.2.1: For infants at ≤ 32 weeks' gestation, data show a statistically significant difference for core body temperature taken at 40 minutes after birth favouring the intervention (plastic bag) group when compared with the group that received plastic wrap immediately after birth in the delivery room (MD 0.30°C, 95% CI 0.24 to 0.36; one study; N = 59) (Analysis 8.2).
Core body temperature (°C) of the infant taken at one hour after birth (Outcome 8.3)
Outcome 8.3.1: For infants at ≤ 32 weeks' gestation, data show a statistically significant difference for core body temperature taken at one hour after birth favouring the intervention (plastic bag) group when compared with the group that received plastic wrap immediately after birth in the delivery room (MD 0.35°C, 95% CI 0.29 to 0.41; one study; N = 59) (Analysis 8.3).
Decrease in core body temperature (°C) of the infant during one hour after birth (Outcome 8.4)
Outcome 8.4.1: For infants at ≤ 32 weeks' gestation, data show a statistically significant difference for decrease in core body temperature during the first hour after birth favouring the intervention (plastic bag) group when compared with the group that received plastic wrap immediately after birth in the delivery room (MD ‐1.34°C, 95% CI ‐2.22 to ‐0.46; one study; N = 59) (Analysis 8.4).
Hypothermia within one hour after birth (core body temperature < 36.5°C or skin temperature < 36°C) (Outcome 8.5)
Caglar 2014, in addition to reporting core body temperature on admission to NICU as a continuous variable, provided data in a dichotomous format in terms of incidence of hypothermia in the intervention and comparison groups (plastic bag and plastic wrap). Investigators defined hypothermia as core body temperature (axillary) < 36.4°C; cold stress as 36°C to 36.4°C; moderate hypothermia as 32°C to 35.9°C; and severe hypothermia as < 32°C.
Outcome 8.5.1: For infants at ≤ 32 weeks' gestation, data show no significant difference in risk of hypothermia within one hour after birth between infants who received plastic bags and those given plastic wrap (RR 0.84, 95% CI 0.63 to 1.12; RD ‐0.14, 95% CI ‐0.35 to 0.08; one study; N = 59) (Analysis 8.5).
Moderate hypothermia within one hour after birth (core body temperature 32°C to 35.9°C, or skin temperature 31.5°C to 35.4°C) (Outcome 8.6)
One study reported this outcome in terms of incidence of hypothermia in the intervention and comparison groups (plastic bag and plastic wrap) (Caglar 2014). Investigators defined moderate hypothermia as core body temperature within the range 32°C to 35.9°C.
Outcome 8.6.1: For infants at ≤ 32 weeks' gestation, data show no significant difference (borderline) in risk of hypothermia within one hour after birth between infants who received plastic bag and those given plastic wrap (RR 0.56, 95% CI 0.31 to 1.02; RD ‐0.29, 95% CI ‐0.54 to ‐ 0.03; one study; N = 59) (Analysis 8.6).
Outside normothermic range on admission to the NICU or up to two hours after birth (Outcome 8.7)
One study reported this outcome in terms of incidence of core body temperature (axillary) outside the normothermic range in intervention and comparison groups (plastic bag and plastic wrap) (Caglar 2014). Investigators defined the range of normothermia as core body temperature (axillary) within the range 36.5°C to 37.5°C within one hour after birth. This was not a prespecified outcome at the review protocol stage.
Outcome 8.7.1: For infants at ≤ 32 weeks' gestation, data show no significant difference in risk of having a core body temperature outside the normothermic range within one hour after birth between infants who received plastic bag and those given plastic wrap (RR 0.84, 95% CI 0.63 to 1.12; RD ‐0.14, 95% CI ‐0.35 to 0.08; one study; N = 59) (Analysis 8.7).
Other secondary outcomes
Data show no reported severe hypothermia in the intervention (plastic bag) and control (plastic wrap) groups. Studies provided mortality figures as baseline characteristics. with three reported deaths in the plastic bag group and one reported death in the plastic wrap group. The time frame for mortality is unclear. Included studies did not report the following secondary outcome measures (as predefined at the review protocol stage) for this comparison group: hypoglycaemia, respiratory distress syndrome, surfactant given at any time, requirement for ventilation, duration of ventilation, length of stay, mortality, severe metabolic acidosis, IVH, PDA, chronic lung disease, NEC, or acute renal failure for infants in the intervention and control groups. However, trial authors reported type of ventilatory support, surfactant intake, Apgar score @ 5 minutes and 11 minutes, cord gas pH, blood sugar at delivery, and mortality as baseline characteristics of infants.
Adverse occurrences due to the intervention
Data show no reported hyperthermia in the intervention (plastic bag) and control (plastic wrap) groups (deduced from hypothermia and normothermia data). Researchers did not report the following secondary outcome measures (adverse occurrences) (as predefined at the review protocol stage) for any of the included studies in this comparison group: burns, maceration, infection, antibiotics, skin maceration, interference with resuscitation, fluid problems, or negative psychological outcomes for infants in the intervention and control groups.
Plastic total body wrap (body + head) versus plastic body wrap (head uncovered) (Comparison 9)
One study comprising 100 infants compared total body wrap (polyethylene bags covering body and head, face exposed) versus body wrap (polyethylene bags up to shoulders, head uncovered) for infants at < 29 weeks' gestation (Doglioni 2014).
Primary outcomes
Core body temperature (°C) of the infant taken on admission to the NICU or up to two hours after birth (Outcome 9.1)
One study reported this outcome in terms of core body temperature in °C (axillary) on admission to the NICU (Doglioni 2014).
Outcome 9.1.1: For infants at < 29 weeks' gestation, data show no statistically significant differences between the two interventions (plastic total body wrap and plastic wrap, head uncovered) for core body temperature on admission to the NICU (MD 0.10°C, 95% CI ‐0.18 to 0.38; one study; N = 100) (Analysis 9.1).
Hypothermia on admission to the NICU (core body temperature < 36.5°C or skin temperature < 36°C) (Outcome 9.2)
Doglioni 2014, in addition to reporting core body temperature on admission to the NICU as a continuous variable, provided data in a dichotomous format in terms of incidence of hypothermia in the intervention and comparison groups (plastic total body wrap and plastic wrap, head uncovered). Investigators defined hypothermia as a core body temperature (axillary) < 36.5°C; mild hypothermia as 36°C to 36.4°C; and moderate hypothermia as 32°C to 35.9°C on admission to the NICU.
Outcome 9.2.1: For infants at < 29 weeks' gestation, data show no significant difference in risk of hypothermia on admission to the NICU between infants who received plastic total body wrap and those given plastic wrap (head uncovered) (RR 0.87, 95% CI 0.55 to 1.37; RD ‐0.06, 95% CI ‐0.25 to 0.13; one study; N = 100) (Analysis 9.2).
Mild hypothermia on admission to the NICU (core body temperature 32ºC to 35.9ºC) (Outcome 9.3)
Outcome 9.3.1: For infants at < 29 weeks' gestation, data show no significant difference in risk of mild hypothermia on admission to the NICU between infants who received plastic total body wrap and those given plastic wrap (head uncovered) (RR 1.08, 95% CI 0.56 to 2.05; RD 0.02, 95% CI ‐0.15 to 0.19; one study; N = 100) (Analysis 9.3).
Moderate hypothermia on admission to the NICU (core body temperature 32ºC to 35.9ºC) (Outcome 9.4)
Outcome 9.4.1: For infants at < 29 weeks' gestation, data show no significant difference in risk of moderate hypothermia on admission to the NICU between infants who received plastic total body wrap and those given plastic wrap (head uncovered) (RR 0.60, 95% CI 0.24 to 1.53; RD ‐0.08, 95% CI ‐0.22 to 0.06; one study; N = 100) (Analysis 9.4).
Outside the normothermic range on admission to the NICU or within two hours after birth (Outcome 9.5)
We derived this outcome from one study in terms of incidence of core body temperature (axillary) outside the normothermic range of 36.5°C to 37.5°C on admission to the NICU in the intervention and comparison groups (plastic total body wrap and plastic wrap, head uncovered) (Doglioni 2014 ). This was not a prespecified outcome at the review protocol stage.
Outcome 9.5.1: For infants at < 29 weeks' gestation, data show no significant difference in risk of having a core body temperature outside the normothermic range on admission to the NICU between infants who received plastic total body wrap and those given plastic wrap (head uncovered) (RR 0.88, 95% CI 0.59 to 1.32; RD ‐0.06, 95% CI ‐0.26 to 0.14; one study; N = 100) (Analysis 9.5).
Core body temperature (°C) of the infant taken one hour after admission to the NICU (Outcome 9.6)
One study reported this outcome in terms of core body temperature in °C (axillary) one hour after admission to the NICU (Doglioni 2014).
Outcome 9.6.1: For infants at < 29 weeks' gestation, data show no statistically significant difference between the two interventions (plastic total body wrap and plastic wrap, head uncovered) for core body temperature one hour after admission to the NICU (MD ‐0.10°C, 95% CI ‐0.47 to 0.27; one study; N = 100) (Analysis 9.6).
Secondary outcomes
Hyperthermia on admission to the NICU (core body temperature > 37.5°C) (Outcome 9.7)
Doglioni 2014, in addition to reporting core body temperature on admission to the NICU as a continuous variable, provided data in a dichotomous format in terms of incidence of hyperthermia in the intervention and comparison groups (plastic total body wrap and plastic wrap, head uncovered). Investigators defined hyperthermia as core body temperature (axillary) > 37.5°C.
Outcome 9.7.1: For infants at < 29 weeks' gestation, data show no significant difference in risk of hyperthermia on admission to the NICU after birth between infants who received plastic total body wrap and those given plastic wrap (head uncovered) (RR 1.00, 95% CI 0.21 to 4.72; RD 0.00, 95% CI ‐0.09 to 0.09; one study; N = 100) (Analysis 9.7). One infant in the wrap group had an axillary temperature > 38°C.
Major brain injury
One study reported this outcome in terms of incidence of major brain injury in the intervention and comparison groups (plastic total body wrap and plastic wrap, head uncovered), as defined by sonographic evidence of IVH with ventricular dilatation, parenchymal haemorrhagic infarction, or periventricular leukomalacia (Doglioni 2014).
Major brain injury: intraventricular haemorrhage (IVH) (Outcome 9.8)
One study reported this outcome in terms of incidence of severe IVH in the intervention and comparison groups (plastic total body wrap and plastic wrap, head uncovered) (Doglioni 2014).
Outcome 9.8.1: For infants at < 29 weeks' gestation, data show no significant difference in risk of severe IVH between infants who received plastic total body wrap and those given plastic wrap (head uncovered) (RR 0.80, 95% CI 0.34 to 1.86; RD ‐0.04, 95% CI ‐0.19 to 0.11; one study; N = 100) (Analysis 9.8).
Major brain injury: periventricular leukomalacia (PVL) (Outcome 9.9)
One study reported this outcome in terms of incidence of severe PVL in intervention and comparison groups (plastic total body wrap and plastic wrap, head uncovered) (Doglioni 2014).
Outcome 9.9.1: For infants at < 29 weeks' gestation, data show no significant difference in risk of PVL between infants who received plastic total body wrap and those given plastic wrap (head uncovered) (RR 1.00, 95% CI 0.06 to 15.55; RD 0.00, 95% CI ‐0.05 to 0.05; one study; N = 100) (Analysis 9.9).
Mortality (death within hospital stay or at six months' corrected gestation) (Outcome 9.10)
One study reported this outcome in terms of incidence of death before discharge from hospital or at six months' corrected gestation in the intervention and comparison groups (plastic total body wrap and plastic wrap, head uncovered) (Doglioni 2014).
Outcome 9.10.1: For infants at < 29 weeks' gestation, data show no significant difference in risk of death between infants who received plastic total body wrap and those given plastic wrap (head uncovered) (RR 0.29, 95% CI 0.06 to 1.31; RD ‐ 0.10, 95% CI ‐0.21 to 0.01; one study; N = 100) (Analysis 9.10).
Bronchopulmonary dysplasia (BPD) (Outcome 9.11)
One study reported this outcome in terms of incidence of oxygen dependency at 36 postconceptional weeks in the intervention and comparison groups (plastic total body wrap and plastic wrap, head uncovered) (Doglioni 2014 ). Investigators defined BPD as chronic lung disease at the review protocol stage.
Outcome 9.11.1: For infants at < 29 weeks' gestation, data show no significant difference in risk of BPD between infants who received plastic total body wrap and those given plastic wrap (head uncovered) (RR 1.00, 95% CI 0.59 to 1.69; RD 0.00, 95% CI ‐0.19 to 0.19; one study; N = 100) (Analysis 9.11).
Necrotising enterocolitis (NEC) (Outcome 9.12)
One study reported this outcome in terms of incidence of NEC in the intervention and comparison groups (plastic total body wrap and plastic wrap, head uncovered) (Doglioni 2014).
Outcome 9.12.1: For infants at < 29 weeks' gestation, data show no significant difference in the risk of NEC between infants who received plastic total body wrap and those given plastic wrap (head uncovered) (RR 1.00, 95% CI 0.41 to 2.46; RD 0.00, 95% CI ‐0.14 to 0.14; one study; N = 100) (Analysis 9.12).
Other secondary outcomes
None of the included studies reported the following secondary outcome measures (as predefined at the review protocol stage) for this comparison group: hypoglycaemia, respiratory distress syndrome, surfactant given at any time, requirement for ventilation, duration of ventilation, length of stay, severe metabolic acidosis, PDA, or acute renal failure for infants in the intervention and control groups.
Adverse occurrences due to the intervention
Doglioni 2014 reported that the wrapping procedure was similar in both groups and was well accepted by neonatal teams.
None of the included studies reported the following secondary outcome measures (adverse occurrences) (as predefined at the review protocol stage) for this comparison group: burns, maceration, infection, antibiotics, skin maceration, interference with resuscitation, fluid problems, or negative psychological outcomes for infants in the intervention and control groups.
Plastic bag and plastic hat versus plastic bag (body only) and cotton hat (Comparison 10)
One study comprising 64 infants compared polyethylene bag + polyethylene hat versus polyethylene bag + cotton hat for infants at ≥ 28 and ≤ 32 weeks' gestation (Talakoub 2015).
Primary outcomes
Core body temperature (°C) of the infant taken on admission to the NICU or up to two hours after birth (Outcome 10.1)
One study reported this outcome in terms of core body temperature in °C (axillary) on admission to the NICU (Talakoub 2015).
Outcome 10.1.1: For infants at ≥ 28 and ≤ 32 weeks' gestation, data show a statistically significant difference in core body temperature on admission to the NICU favouring the intervention (plastic bag + plastic hat) group when compared with the group given plastic bag + cotton hat immediately after birth in the delivery room (MD 0.32°C, 95% CI 0.02 to 0.62; one study; N = 64) (Analysis 10.1).
Core body temperature (°C) of the infant taken one hour after admission (Outcome 10.2)
One study reported this outcome in terms of core body temperature in °C (axillary) one hour after admission to the NICU (Talakoub 2015).
Outcome 10.2.1: For infants at ≥ 28 and ≤ 32 weeks' gestation, data show a statistically significant difference in core body temperature one hour after admission to the NICU favouring the intervention (plastic bag + plastic hat) group when compared with the group that received plastic bag + cotton hat immediately after birth in the delivery room (MD 0.37°C, 95% CI 0.03 to 0.71; one study; N = 64) (Analysis 10.2).
Core body temperature (°C) of the infant taken two hours after admission (Outcome 10.3)
One study reported this outcome in terms of core body temperature in °C (axillary) two hours after admission to the NICU (Talakoub 2015).
Outcome 10.3.1: For infants at ≥ 28 and ≤ 32 weeks' gestation, data show a statistically significant difference in core body temperature two hours after admission to the NICU favouring the intervention (plastic bag + plastic hat) group when compared with the group that received plastic bag + cotton hat immediately after birth in the delivery room (MD 0.37°C, 95% CI 0.11 to 0.63; one study; N = 64) (Analysis 10.3).
Other secondary outcomes
None of the included studies reported the following secondary outcome measures (as predefined at the review protocol stage) for this comparison group: hypothermia, hypoglycaemia, respiratory distress syndrome, surfactant given at any time, intubation in the delivery room, requirement for ventilation, duration of ventilation, length of stay, mortality, severe metabolic acidosis, IVH, PDA, chronic lung disease, NEC, or acute renal failure for infants in the intervention and control groups.
Adverse occurrences due to the intervention
Talakoub 2015 reported no hyperthermic infants in the 'plastic bag and plastic hat' and 'plastic bag + cotton hat' groups. Investigators provided no definition of hyperthermia. None of the included studies reported the following secondary outcome measures (adverse occurrences) (as predefined at the review protocol stage) for this comparison group: burns, maceration, infection, antibiotics, skin maceration, interference with resuscitation, fluid problems, or negative psychological outcomes for infants in the intervention and control groups.
Stockinet cap versus routine care (no cap) (Comparison 11)
One study comprising 40 infants compared stockinette cap versus routine care (Roberts 1981). This study reported figures for all infants at ≥ 32 and ≤ 36 weeks' gestation, and also for the subgroup of infants < 2000 grams birth weight. We have tried to disaggregate the data using the information available to obtain data for the subgroup of infants of birth weight ≥ 2000 grams. These subgroup analyses by birth weight were not prespecified in the protocol for this review.
Primary outcomes
Core body temperature (°C) on admission to the NICU or up to two hours after birth (Outcome 11.1)
One study reported this outcome in terms of core body temperature in °C (axillary) on admission to the NICU (Roberts 1981).
Outcome 11.1.1: Overall, for infants at ≥ 32 and ≤ 36 weeks' gestation (birth weight range 1360 to 2965 grams), data show no statistically significant difference between the two interventions (stockinette cap and routine care) for core body temperature on admission to the NICU (MD 0.10°C, 95% CI ‐0.21 to 0.41; one study; N = 40) (Analysis 11.1).
Outcome 11.1.2: For infants of birth weight < 2000 grams, data show a borderline statistically significant difference in core body temperature on admission to the NICU favouring the intervention (stockinette cap) group when compared with the group that received routine care immediately after birth in the delivery room (MD 0.70°C, 95% CI ‐0.01 to 1.41; one study; N = 10) (Analysis 11.1).
Outcome 11.1.3: For infants of birth weight ≥ 2000 grams, data show no statistically significant difference between the two interventions (stockinette cap and routine care) for core body temperature on admission to the NICU (MD 0.00°C, 95% CI ‐0.37 to 0.37; one study; N = 30) (Analysis 11.1).
The test for homogeneity passed with an I² value of 32.7% (low heterogeneity) for subgroup differences.
Hypothermia on admission to the NICU (core body temperature < 36.5°C, or skin temperature < 36°C) (Outcome 11.2)
Roberts 1981, in addition to reporting core body temperature on admission to the NICU as a continuous variable, provided data in a dichotomous format in terms of incidence of hypothermia in the intervention and control groups (stockinette cap and routine care). Investigators defined hypothermia as a core body temperature (axillary) < 36°C on admission to the NICU.
Outcome 11.2.1: For infants at ≥ 32 and ≤ 36 weeks' gestation (birth weight range 1360 to 2965 grams), data show no significant difference in risk of hypothermia between infants who received stockinette cap and those given routine care (RR 0.90, 95% CI 0.48 to 1.71; RD ‐0.05, 95% CI ‐0.36 to 0.26; one study; N = 40) (Analysis 11.2).
Secondary outcomes
No included studies reported the following secondary outcome measures (as predefined at the review protocol stage) for this comparison group: hypoglycaemia, respiratory distress syndrome, surfactant given at any time, intubation in the delivery room, requirement for ventilation, duration of ventilation, length of stay, mortality, severe metabolic acidosis, IVH, PDA, chronic lung disease, NEC, and acute renal failure.
Adverse occurrences due to the intervention
No included studies reported the following secondary outcome measures (adverse occurrences) (as predefined at the review protocol stage) for this comparison group: hyperthermia, burns, maceration, skin or systemic infection, antibiotics, interference with resuscitation and other practices, fluid problems, or negative psychological outcomes.
External heat sources category
Skin‐to‐skin care versus routine care (Comparison 12)
One study comprising 31 infants compared skin‐to‐skin care versus routine (conventional incubator) care for infants of birth weight ≥ 1200 and ≤ 2199 grams (Bergman 2004).
Primary outcomes
Hypothermia (skin temperature < 35.5°C for two consecutive recordings) (Outcome 12.1)
One study reported this outcome in terms of incidence of skin temperature remaining below 35.5°C for two consecutive readings (five‐minute intervals for the first hour, thereafter 15‐minute intervals during the six‐hour observation period) in the intervention and control groups (skin‐to‐skin care and routine care) (Bergman 2004). This was not a prespecified outcome at the review protocol stage.
Outcome 12.1.1: For infants of birth weight ≥ 1200 and ≤ 2199 grams, skin‐to‐skin contact significantly reduced risk of hypothermia within six hours of birth (RR 0.09, 95% CI 0.01 to 0.64; RD ‐0.56, 95% CI ‐0.84 to ‐0.27; one study; N = 31). Two infants would have to receive skin‐to‐skin contact to prevent one infant from becoming hypothermic (NNTB 2, 95% CI 1 to 4) (Analysis 12.1).
Secondary outcomes
Hypoglycaemia (blood glucose < 2.6 mmol/L) (Outcome 12.2)
One study reported this outcome in terms of incidence of confirmed laboratory estimation of blood glucose < 2.6 mmol/L within the six‐hour observation period (when blood glucose was measured by heel prick at one, three, and six hours) in the intervention and control groups (skin‐to‐skin care and routine care) (Bergman 2004). This was not the prespecified definition of hypoglycaemia at the review protocol stage.
Outcome 12.2.1: For infants of birth weight ≥ 1200 and ≤ 2199 grams, data show no significant difference in risk of hypoglycaemia between infants who received skin‐to‐skin contact and those given conventional incubator care (RR 0.24, 95% CI 0.03 to 2.06; RD ‐0.18, 95% CI ‐0.43 to 0.08; one study; N = 31) (Analysis 12.2).
Other secondary outcomes
This study reported the following additional outcome measures: heart rate < 100 or > 180 per minute for two consecutive recordings, apnoea longer than 20 seconds, oxygen saturation below 87% for two consecutive recordings despite supplementation with nasal prong oxygen, fraction of inspired oxygen (FiO₂) up to 0.60, and CPAP up to 5 cm water, and overall data (transfers to NICU, exceeded parameters, mean SCRIP score within first six hours and number of perfect scores, mean SCRIP score in the sixth hour, and number of perfect scores).
None of the included studies reported the following secondary outcome measures (as predefined at the review protocol stage) for this comparison group: respiratory distress syndrome, surfactant given at any time, intubation in the delivery room, requirement for ventilation, duration of ventilation, length of stay, mortality, severe metabolic acidosis, IVH, PDA, chronic lung disease, NEC, or acute renal failure.
Adverse occurrences due to the intervention
Bergman 2004 reported that "there were no adverse events related to the intervention".
Thermal mattress versus routine care (Comparison 13)
Two studies comprising 126 infants compared thermal mattress versus routine care (Brennan 1996; Chawla 2011). Brennan 1996 compared the transwarmer infant transport mattress versus routine care for infants ≤ 1500 grams, and Chawla 2011 compared the transwarmer mattress versus routine care for infants at < 32 weeks' gestation. Although infants in the Chawla 2011 study were at < 32 weeks' gestation, these infants were included in the birth weight ≤ 1500 grams subgroup for meta‐analysis and are referred to as such in the text. Chawla 2011 used additional thermal care measures (plastic bag without drying below the neck) for infants at < 28 weeks' gestation, which was considered to be part of routine thermal care practices. Brennan 1996, the earlier study, did not employ such additional thermal care measures. Chawla 2011 reported that 40 neonates received both plastic bag and the transwarmer mattress, and 35 received plastic bag without the transwarmer mattress. In total, 43 infants were included in the < 28 weeks' gestation subgroup. Because all infants did not receive a plastic bag, we chose to include the data from Chawla 2011 in this comparison group rather than in comparison group 15 (plastic bag and thermal mattress vs plastic bag only).
Primary outcomes
Core body temperature (°C) of the infant taken on admission to the NICU or up to two hours after birth (Outcome 13.1)
Two studies comprising 126 infants reported core body temperature in °C (axillary) on admission to the NICU (Brennan 1996; Chawla 2011). Each individual study showed a significant effect in favour of the intervention (thermal mattress) group for infants with birth weight ≤ 1500 grams.
Outcome 13.1.1: For infants of birth weight ≤ 1500 grams, data show a statistically significant difference in core body temperature on admission to the NICU favouring the intervention (thermal mattress) group when compared with the group that received routine care immediately after birth in the delivery room (MD 0.65°C, 95% CI 0.36 to 0.94; two studies; N = 126) (Analysis 13.1).
However, the test for homogeneity failed with an I² value of 85% (high heterogeneity). We note that this failure most likely is due to differences in methods between the two studies.
Hypothermia on admission to the NICU (core body temperature < 36.5°C, or skin temperature < 36°C) (Outcome 13.2)
Brennan 1996 and Chawla 2011, in addition to reporting core body temperature on admission to the NICU as a continuous variable, provided data in a dichotomous format in terms of incidence of hypothermia in the intervention and control groups (thermal mattress and routine care). Brennan 1996 defined hypothermia as core body temperature (axillary) < 36.5°C on admission to the NICU, and Chawla 2011 as core body temperature (axillary) < 36°C on admission to the NICU. Data for these outcome measures are presented separately.
Outcome 13.2.1: For infants of birth weight ≤ 1500 grams, the thermal mattress significantly reduced risk of hypothermia on admission to the NICU (RR 0.30, 95% CI 0.11 to 0.83; RD ‐0.58, 95% CI ‐0.91 to ‐0.26; one study; N = 24) (Analysis 13.2). Two infants would have to receive a thermal mattress to prevent one infant from becoming hypothermic (NNTB 2, 95% CI 1 to 4).
Hypothermia on admission to the NICU (core body temperature < 36.0°C) (Outcome 13.3)
Chawla 2011 also reported hypothermia as a core body temperature (axillary) < 36°C on admission to the NICU. Brennan 1996 presented individual core body temperatures as continuous outcomes so data were derived for moderate hypothermia as defined in the Chawla 2011 study. Therefore, two studies comprising 126 infants reported hypothermia as core body temperature (axillary) < 36°C on admission to the NICU (Brennan 1996; Chawla 2011). Each individual study showed a significant effect in favour of the intervention (thermal mattress) group for infants with birth weight ≤ 1500 grams.
Outcome 13.3.1: For infants of birth weight ≤ 1500 grams, a thermal mattress significantly reduced risk of hypothermia (core body temperature (axillary) < 36°C) on admission to the NICU (typical RR 0.49, 95% CI 0.32 to 0.76; typical RD ‐0.30, 95% CI ‐0.46 to ‐0.14; two studies; N = 126) (Analysis 13.3). Three infants would have to receive a thermal mattress to prevent one infant from becoming hypothermic (NNTB 3, 95% CI 2 to 7).
However, the test for homogeneity failed with an I² value of 62% (moderate heterogeneity) for RR, and 73% (moderate heterogeneity) for RD . We note that this failure is most likely due to differences in methods between the two studies. Chawla 2011 used additional thermal care measures (plastic bag without drying below the neck) for infants at < 28 weeks' gestation, which was considered to be part of routine thermal care practices. Brennan 1996, the earlier study, did not employ such additional thermal care measures.
Hypothermia on admission to the NICU (core body temperature < 35.0°C) (Outcome 13.4)
Chawla 2011 also reported hypothermia as a core body temperature (axillary) < 35°C on admission to the NICU. Brennan 1996 presented individual core body temperatures as continuous outcomes; therefore we derived data for moderate hypothermia as defined by Chawla 2011. Two studies comprising 126 infants reported hypothermia as core body temperature (axillary) < 35°C on admission to the NICU (Brennan 1996; Chawla 2011). Each individual study showed no significant difference in effect for thermal mattress and routine care for infants of birth weight ≤ 1500 grams.
Outcome 13.4.1: For infants of birth weight ≤ 1500 grams, a thermal mattress significantly reduced risk of hypothermia (core body temperature (axillary ) < 35°C) on admission to the NICU (typical RR 0.18, 95% CI 0.05 to 0.65; typical RD ‐0.18, 95% CI ‐0.29 to ‐0.07; two studies; N = 126) (Analysis 13.4). Six infants would have to receive a thermal mattress to prevent one infant from becoming hypothermic (NNTB 6, 95% CI 4 to 14).
However, the test for homogeneity failed with an I² value of 0% for RR but 84% for RD (high heterogeneity). We note that this failure most likely is due to differences in methods between the two studies. Chawla 2011 used additional thermal care measures (plastic bag without drying below the neck) for infants at < 28 weeks' gestation, which was considered to be part of routine thermal care practices. Brennan 1996, the earlier study, did not employ such additional thermal care measures.
Outside the normothermic range on admission to the NICU or up to two hours after birth (Outcome 13.5)
We derived this outcome for one study in terms of incidence of core body temperature (axillary) outside the normothermic range in intervention and control groups (thermal mattress and routine care) on admission to the NICU (Brennan 1996). Investigators defined normothermia as core body temperature (axillary) within the range 36.5°C to 37.5°C. We were unable to derive this information from Chawla 2011 because investigators defined hypothermia as core body temperature (axillary) < 36°C on admission to the NICU. The was not a prespecified outcome at the review protocol stage.
Outcome 13.5.1: For infants of birth weight ≤ 1500 grams, a thermal mattress significantly reduced risk of being outside the normothermic range (core body temperature (axillary) 36.5°C to 37.5°C) on admission to the NICU (RR 0.30, 95% CI 0.11 to 0.83; RD ‐0.58, 95% CI ‐0.91 to ‐0.26; one study; N = 24) (Analysis 13.5). Two infants would have to receive a thermal mattress to prevent one infant from being outside the normothermic range (NNTB 2, 95% CI 1 to 4).
Secondary outcomes
Hyperthermia on admission to the NICU (core body temperature > 37.5°C) (Outcome 13.6)
Two studies comprising 126 infants reported this outcome in terms of incidence of hyperthermia in intervention and control groups (thermal mattress and routine care) (Brennan 1996; Chawla 2011). Chawla 2011 defined hyperthermia as core body temperature (axillary) > 37.5°C on admission to the NICU. Brennan 1996 presented individual core body temperatures as continuous outcomes, so we derived data for hyperthermia as defined by Chawla 2011. Individual data from Brennan 1996 show no infants in the thermal mattress group or in the routine care group had a core body temperature (axillary) > 37.5°C on admission to the NICU. Each individual study showed no significant difference in effect for thermal mattress and routine care among infants with birth weight ≤ 1500 grams.
Outcome 13.6.1: For infants of birth weight ≤ 1500 grams, data show no statistically significant difference in risk of hyperthermia (core body temperature (axillary) > 37.5°C) on admission to the NICU between infants who received a thermal mattress and those given routine care (RR 4.63, 95% CI 0.23 to 94.10; RD 0.03, 95% CI ‐0.03 to 0.09; two studies; N = 126) (Analysis 13.6).
The test for homogeneity passed with an I² value of 0% for RD.
Mortality (Outcome 13.7)
One study reported this outcome in terms of incidence of mortality in the intervention and control groups (thermal mattress and routine care) (Chawla 2011). Investigators did not provide a clear definition of the time frame for this outcome measure.
Outcome 13.7.1: For infants at < 32 weeks' gestation, data show no statistically significant difference in risk of mortality between infants who received a thermal mattress and those given routine care (RR 0.31, 95% CI 0.01 to 7.40; RD ‐0.02, 95% CI ‐0.07 to 0.03; one study; N = 102) (Analysis 13.7).
Major brain injury (intraventricular haemorrhage (IVH)) (Outcome 13.8)
One study reported this outcome in terms of incidence of IVH (grade Ⅲ or Ⅳ) and of cystic periventricular leukomalacia on head ultrasonography in intervention and control groups (thermal mattress and routine care) (Chawla 2011). These data are presented as two separate outcomes.
Outcome 13.8.1: For infants at < 32 weeks' gestation, data show no statistically significant difference in risk of IVH (grade Ⅲ or Ⅳ) between infants who received a thermal mattress and those given routine care (RR 4.62, 95% CI 0.56 to 38.19; RD 0.07, 95% CI ‐0.01 to 0.16; one study; N = 102) (Analysis 13.8).
Major brain injury (cystic periventricular leukomalacia) (Outcome 13.9)
One study reported this outcome in terms of the incidence of IVH (grade Ⅲ or Ⅳ) and as cystic periventricular leukomalacia on head ultrasonography in intervention and control groups (thermal mattress and routine care) (Chawla 2011). These data are presented as two separate outcomes.
Outcome 13.9.1: For infants at < 32 weeks' gestation, data show no statistically significant difference in risk of cystic periventricular leukomalacia between infants who received a thermal mattress and those given routine care (RR 1.39, 95% CI 0.24 to 7.95; RD 0.02, 95% CI ‐0.07 to 0.10; one study; N = 102) (Analysis 13.9).
Bronchopulmonary dysplasia (BPD) (Outcome 13.10)
One study reported this outcome in terms of incidence of the requirement for oxygen supplementation at 36 weeks' postmenstrual age in intervention and control groups (thermal mattress and routine care) (Chawla 2011). The was not a prespecified outcome at the review protocol stage.
Outcome 13.10.1: For infants at < 32 weeks' gestation, data show no statistically significant difference in risk of BPD between infants who received a thermal mattress and those given routine care (RR 1.34, 95% CI 0.69 to 2.61; RD 0.08, 95% CI ‐0.09 to 0.25; one study; N = 102) (Analysis 13.10).
Duration of hospital stay (days) (Outcome 13.11)
One study reported this outcome in terms of duration of hospital stay (Chawla 2011).
Outcome 13.11.1: For infants at < 32 weeks' gestation, data show no statistically significant differences between interventions (thermal mattress vs routine care) for duration of stay in hospital (MD ‐5.00 days, 95% CI ‐17.27 to 7.27; one study; N = 102) (Analysis 13.11).
Duration of ventilation (days) (Outcome 13.12)
One study reported this outcome in terms of duration of ventilation (Chawla 2011).
Outcome 13.12.1: For infants at < 32 weeks' gestation, data show no statistically significant differences between interventions (thermal mattress vs routine care) for duration of ventilation (MD ‐4.00 days, 95% CI ‐12.67 to 4.67; one study; N = 102) (Analysis 13.12).
Duration of oxygen requirement (days) (Outcome 13.13)
One study reported this outcome in terms of duration of oxygen requirement (Chawla 2011). This was not a prespecified outcome at the review protocol stage.
Outcome 13.13.1: For infants at < 32 weeks' gestation, data show no statistically significant differences between interventions (thermal mattress vs routine care) for duration of oxygen requirement (MD ‐7.00 days, 95% CI ‐19.66 to 5.66; one study; N = 102) (Analysis 13.13).
Hypoglycaemia (initial blood glucose < 40 mg/dL or < 2.2 mmol/L) (Outcome 13.14)
One study reported this outcome in terms of incidence of initial blood glucose < 40 mg/dL or < 2.2 mmol/L in intervention and control groups (thermal mattress and routine care) (Chawla 2011). This was not the prespecified definition of hypoglycaemia at the review protocol stage.
Outcome 13.14.1: For infants at < 32 weeks' gestation, data show no statistically significant differences in risk of hypoglycaemia between infants who received a thermal mattress and those given routine care (RR 1.02, 95% CI 0.47 to 2.18; RD 0.00, 95% CI ‐0.15 to 0.16; one study; N = 102) (Analysis 13.14).
Metabolic acidosis (Outcome 13.15)
One study reported this outcome in terms of incidence of pH < 7.15 with base excess ≥ 10 mmol/L on initial blood gas in intervention and control groups (thermal mattress and routine care) (Chawla 2011).
Outcome 13.15.1: For infants at < 32 weeks' gestation, data show no statistically significant differences in risk of metabolic acidosis between infants who received a thermal mattress and those given routine care (RR 0.31, 95% CI 0.03 to 2.86; RD ‐0.04, 95% CI ‐0.12 to 0.03; one study; n = 102) (Analysis 13.15).
Necrotising enterocolitis (NEC) (Outcome 13.16)
One study reported this outcome in terms of incidence of NEC > stage 2 as defined by Bell's staging in intervention and control groups (thermal mattress and routine care) (Bell 1978; Chawla 2011).
Outcome 13.16.1: For infants at < 32 weeks' gestation, data show no statistically significant differences in risk of NEC > stage 2 between infants who received a thermal mattress and those given routine care (RR 0.64, 95% CI 0.33 to 1.23; RD ‐0.12, 95% CI ‐0.29 to 0.05; one study; N = 102) (Analysis 13.16).
Sepsis (Outcome 13.17)
One study reported this outcome in terms of incidence of positive culture from sterile site such as blood or spinal fluid and intention to treat with antibiotics for seven days or longer in the intervention and control groups (thermal mattress and routine care) (Chawla 2011). This was not a prespecified outcome at the review protocol stage.
Outcome 13.17.1: For infants at < 32 weeks' gestation, data show no statistically significant differences in risk of sepsis between infants who received a thermal mattress and those given routine care (RR 0.92, 95% CI 0.48 to 1.79; RD ‐0.02, 95% CI ‐0.19 to 0.15; one study; N = 102) (Analysis 13.17).
Other secondary outcomes
No included studies reported the following secondary outcome measures (as predefined at the review protocol stage) for this comparison group: respiratory distress syndrome, surfactant given at any time, intubation in the delivery room, requirement for ventilation, PDA, chronic lung disease, or acute renal failure.
Adverse occurrences due to the intervention
Brennan 1996 reported that the intervention did not at any time interfere with care of the infants. Chawla 2011 reported that no infants had any local skin reaction, and that use of the thermal mattress was well received by delivery room personnel, with no respondent noting any interference with resuscitation.
No included studies reported the following secondary outcome measures (adverse occurrences) (as predefined at the review protocol stage) for this comparison group: burns, maceration, antibiotics, fluid problems, or negative psychological outcomes.
Combinations of interventions category
Thermal mattress versus plastic wrap or bag (Comparison 14)
Two studies comprising 77 infants compared thermal mattress versus plastic wrap or bag. Mathew 2012 compared the Transwarmer mattress versus polyvinyl bag for infants at ≤ 28 weeks' gestation. Simon 2011 compared the Infatherm mattress versus polyethylene wrap (Neowrap) for infants at ≥ 24 and ≤ 28 weeks' gestation and birth weight ≤ 1250 grams. These infants were grouped together in the gestational age of ≤ 28 weeks subgroup for meta‐analysis and are referred to as such in the text.
Primary outcomes
Core body temperature (°C) of the infant taken on admission to the NICU or up to two hours after birth (Outcome 14.1)
Two studies comprising 77 infants reported this outcome in terms of core body temperature in °C (axillary) on admission to the NICU (Mathew 2012; Simon 2011). Each individual study showed no significant difference in effect for the thermal mattress versus plastic wrap or bag for infants at ≤ 28 weeks' gestation. However, Mathew 2012 is tending towards favouring plastic bag, and Simon 2011 is showing borderline significance favouring thermal mattress.
Outcome 14.1.1. For infants at ≤ 28 weeks' gestation, data show no statistically significant differences between interventions (thermal mattress and plastic bag or wrap) for core body temperature in °C on admission to the NICU (MD 0.18°C, 95% CI ‐0.18 to 0.54; two studies; N = 77) (Analysis 14.1).
The test for homogeneity failed with an I² value of 68% (moderate heterogeneity). The most plausible reason for this heterogeneity may be variability of use between practitioners when the intervention was polyethylene wrap as opposed to thermal mattress, as in Simon 2011; in some cases, displacement of the wrap could have resulted in heat loss, meaning that performance bias cannot be ruled out.
Hypothermia on admission to the NICU (core body temperature < 36.5°C, or skin temperature < 36°C) (Outcome 14.2)
Simon 2011, in addition to reporting core body temperature on admission to the NICU as a continuous variable, provided data in a dichotomous format in terms of incidence of hypothermia in intervention and comparison groups (thermal mattress and plastic wrap or bag). Investigators defined hypothermia as a core body temperature (axillary) < 36.5°C on admission to the NICU.
Outcome 14.2.1: For infants at ≥ 24 and ≤ 28 weeks' gestation with birth weight ≤ 1250 grams, data show no significant differences in risk of hypothermia between infants who received thermal mattress and those given plastic wrap (RR 0.60, 95% CI 0.32 to 1.15; RD ‐0.27, 95% CI ‐0.59 to 0.04; one study; N = 36) (Analysis 14.2).
Outside the normothermic range on admission to the NICU or up to two hours after birth (Outcome 14.3)
We were able to derive data for the normothermic range from the definitions of hypothermia (core body temperature (axillary) < 36.5°C) and hyperthermia (core body temperature (axillary) > 37.5°C) on admission to the NICU provided in Simon 2011. Investigators defined normothermic range as core body temperature (axillary) 36.5°C to 37.5°C on admission to the NICU. They reported this outcome as the incidence of core body temperature outside the normothermic range on admission to the NICU in both intervention and comparison groups (thermal mattress and plastic wrap). This was not a prespecified outcome at the review protocol stage.
Outcome 14.3.1: For infants at ≥ 24 and ≤ 28 weeks' gestation with birth weight ≤ 1250 grams, data show no significant differences in risk of being outside the normothermic range (core body temperature (axillary) 36.5°C to 37.5°C) on admission to the NICU between infants who received thermal mattress and those given plastic wrap (RR 0.69, 95% CI 0.38 to 1.24; RD ‐0.21, 95% CI ‐0.53 to 0.10; one study; N = 36) (Analysis 14.3).
Secondary outcomes
Hyperthermia on admission to the NICU (core body temperature > 37.5°C) (Outcome 14.4)
Simon 2011, in addition to reporting core body temperature on admission to the NICU as a continuous variable, provided data in a dichotomous format in terms of incidence of hyperthermia in intervention and comparison groups (thermal mattress and plastic wrap). Investigators defined hyperthermia as a core body temperature (axillary) > 37.5°C on admission to the NICU.
Outcome 14.4.1: For infants at ≥ 24 and ≤ 28 weeks' gestation with birth weight ≤ 1250 grams, data show no significant differences in risk of hyperthermia between infants who received thermal mattress and those given plastic wrap (RR 3.33, 95% CI 0.14 to 76.75; RD 0.06, 95% CI ‐0.09 to 0.20; one study; N = 36) (Analysis 14.4).
Brain injury
Two studies comprising 77 infants reported this outcome in terms of incidence of grade I or II IVH ‐ in Simon 2011 ‐ and grade Ⅲ or Ⅳ IVH ‐ in Mathew 2012 and Simon 2011 ‐ among intervention and comparison groups (thermal mattress and plastic wrap or bag). These data are presented separately. For the outcome incidence of grade III or IV IVH, each individual study showed no significant differences in effect for thermal mattress versus plastic wrap or bag for infants at ≤ 28 weeks' gestation.
Brain injury (IVH grade Ⅰ or Ⅱ) (Outcome 14.5)
Outcome 14.5.1: For infants at ≥ 24 and ≤ 28 weeks' gestation with birth weight ≤ 1250 grams, data show no significant differences in risk of IVH (grade Ⅰ or Ⅱ) between infants who received thermal mattress and those given plastic wrap (RR 0.45, 95% CI 0.10 to 2.01; RD ‐0.15, 95% CI ‐0.40 to 0.10; one study; n = 36) (Analysis 14.5).
Major brain injury (IVH grade Ⅲ or Ⅳ) (Outcome 14.6)
Outcome 14.6.1: For infants at ≤ 28 weeks' gestation, data show no significant differences in risk of IVH (grade Ⅲ or Ⅳ) between infants who received thermal mattress and those given plastic wrap or bag (typical RR 0.91, 95% CI 0.31 to 2.71; typical RD ‐0.01, 95% CI ‐0.17 to 0.14; two studies; N = 77) (Analysis 14.6). The test for homogeneity passed with an I² value of 20% for RR and 19% for RD.
Mortality (death before discharge) (Outcome 14.7)
Two studies comprising 77 infants reported this outcome in terms of incidence of death before hospital discharge among intervention and comparison groups (thermal mattress and plastic wrap or bag) (Mathew 2012; Simon 2011). Each individual study showed no significant differences in effect for thermal mattress versus plastic wrap or bag for infants at ≤ 28 weeks' gestation.
Outcome 14.7.1: For infants at ≤ 28 weeks' gestation, data show no significant differences in risk of death before discharge between infants who received thermal mattress and those given plastic wrap or bag (typical RR 1.10, 95% CI 0.39 to 3.17; typical RD 0.01, 95% CI ‐0.14 to 0.16; two studies; N = 77) (Analysis 14.7). The test for homogeneity passed with an I² value of 0% for RR and RD.
Bronchopulmonary dysplasia (BPD) (Outcome 14.8)
One study reported this outcome in terms of incidence of BPD among intervention and comparison groups (thermal mattress and plastic wrap) (Simon 2011). Investigators did not provide a clear definition of BPD. This was not a prespecified outcome at the review protocol stage.
Outcome 14.8.1: For infants at ≥ 24 and ≤ 28 weeks' gestation with birth weight ≤ 1250 grams, data show no significant differences in risk of BPD before discharge between infants who received thermal mattress and those given plastic wrap (RR 0.75, 95% CI 0.40 to 1.37; RD ‐0.16, 95% CI ‐0.48 to 0.16; one study; N = 36) (Analysis 14.8).
Hypotension (Outcome 14.9)
One study reported this outcome in terms of mean blood pressure less than gestational age in weeks during the first 24 hours of life and received treatment with fluid bolus, pressors, or both in intervention and active comparison groups (thermal mattress and plastic bag) (Mathew 2012).
Outcome 14.9.1: For infants at ≤ 28 weeks' gestation, data show no significant differences in risk of hypotension in the first 24 hours of life between infants who received thermal mattress and those given plastic bag (RR 1.50, 95% CI 0.71 to 3.17; RD 0.17, 95% CI ‐0.13 to 0.46; one study; N = 41) (Analysis 14.9).
Necrotising enterocolitis (NEC) (Outcome 14.10)
Two studies comprising 77 infants reported this outcome in terms of incidence of NEC among intervention and comparison groups (thermal mattress and plastic wrap or bag) (Mathew 2012; Simon 2011). Investigators provided no clear definitions. Each individual study showed no significant differences in effect for thermal mattress and plastic wrap or bag.
Outcome 14.10.1: For infants at ≤ 28 weeks' gestation, data show no significant differences in risk of NEC between infants who received thermal mattress and those given plastic wrap or bag (typical RR 1.92, 95% CI 0.61 to 5.97; typical RD 0.09, 95% CI ‐0.06 to 0.25; two studies; N = 77) (Analysis 14.10). The test for homogeneity passed with an I² value of 0% for RR and RD.
Patent ductus arteriosus
One study reported this outcome in terms of overall incidence of PDA among those treated with medication only and those treated with ligation in the intervention and comparison groups (thermal mattress and plastic wrap) (Simon 2011).
Overall patent ductus arteriosus (PDA) (Outcome 14.11)
Outcome 14.11.1: For infants at ≥ 24 and ≤ 28 weeks' gestation with birth weight ≤ 1250 grams, data show no significant differences in risk of PDA between infants who received thermal mattress and those given plastic wrap (RR 1.76, 95% CI 0.88 to 3.49; RD 0.28, 95% CI ‐0.04 to 0.59; one study; N = 36) (Analysis 14.11).
Patent ductus arteriosus (PDA) treated with medication only (Outcome 14.12)
Outcome 14.12.1: For infants at ≥ 24 and ≤ 28 weeks' gestation with birth weight ≤ 1250 grams, data show no significant differences in risk of PDA treated with medication only between infants who received thermal mattress and those given plastic wrap (RR 1.44, 95% CI 0.69 to 3.01; RD 0.16, 95% CI ‐0.16 to 0.48; one study; N = 36) (Analysis 14.12).
Patent ductus arteriosus (PDA) treated with ligation (Outcome 14.13)
Outcome 14.13.1: For infants at ≥ 24 and ≤ 28 weeks' gestation with birth weight ≤ 1250 grams, data show no significant differences in risk of PDA with ligation treatment between infants who received thermal mattress and those given plastic wrap (RR 5.56, 95% CI 0.29 to 108.16; RD 0.12, 95% CI ‐0.06 to 0.29; one study; N = 36) (Analysis 14.13).
Retinopathy of prematurity (ROP)
Simon 2011 reported this outcome in terms of overall incidence of ROP (all grades); Mathew 2012 reported incidence of ROP with laser therapy among intervention and comparison groups (thermal mattress and plastic wrap or bag). This was not a prespecified outcome at the review protocol stage.
Retinopathy of prematurity (ROP) all grades (Outcome 14.14)
Outcome 14.14.1: For infants at ≥ 24 and ≤ 28 weeks' gestation with birth weight ≤ 1250 grams, data show no significant differences in risk of ROP (all grades) between infants who received thermal mattress and those given plastic wrap (RR 0.48, 95% CI 0.15 to 1.56; RD ‐0.19, 95% CI ‐0.47 to 0.09; one study; N = 36) (Analysis 14.14).
Retinopathy of prematurity (ROP) treated with laser therapy (Outcome 14.15)
Outcome 14.15.1: For infants at ≤ 28 weeks' gestation, data show no significant differences in risk of ROP with laser therapy between infants who received thermal mattress and those given plastic bag (RR 0.53, 95% CI 0.05 to 5.35; RD ‐0.05, 95% CI ‐0.20 to 0.11; one study; N = 41) (Analysis 14.15).
Spontaneous intestinal perforation (SIP) (Outcome 14.16)
One study reported this outcome in terms of incidence of SIP among intervention and comparison groups (thermal mattress and plastic bag) (Mathew 2012). Investigators provided no clear definition. This was not a prespecified outcome at the review protocol stage.
Outcome 14.16.1: For infants at ≤ 28 weeks' gestation, data show no significant differences in risk of SIP between infants who received thermal mattress and those given plastic bag (RR 0.53, 95% CI 0.11 to 2.56; RD ‐0.09, 95% CI ‐0.30 to 0.12; one study; N = 41) (Analysis 14.16).
Worst base deficit in first 24 hours of life (Outcome 14.17)
One study reported this outcome in terms of lowest pH and highest base deficit in the first 24 hours after birth (Mathew 2012).
Outcome 14.17.1: For infants at ≤ 28 weeks' gestation, data show no statistically significant differences between interventions (thermal mattress and plastic bag) for worst base deficit in the first 24 hours after birth (MD ‐1.70 mEq/L, 95% CI ‐3.99 to 0.59; one study; N = 41) (Analysis 14.17).
Worst pH in first 24 hours of life (Outcome 14.18)
One study reported this outcome in terms of worst pH in the first 24 hours after birth (Mathew 2012). This was not a prespecified outcome at the review protocol stage.
Outcome 14.18.1: For infants at ≤ 28 weeks' gestation, data show a statistically significant difference in worst pH in the first 24 hours after birth favouring the thermal mattress group when compared with the plastic bag group with intervention provided immediately after birth in the delivery room (MD ‐0.09, 95% CI ‐0.13 to ‐0.05; one study; N = 41) (Analysis 14.18).
Other secondary outcomes
None of the included studies reported the following secondary outcome measures (as prespecified at the review protocol stage) for this comparison group: hypoglycaemia, respiratory distress syndrome, surfactant given at any time, intubation in the delivery room, requirement for ventilation, duration of ventilation, length of stay, chronic lung disease, or acute renal failure.
Adverse occurrences due to the intervention
Simon 2011 concluded that mattresses were easier to use than polyethylene wrap; however, economic factors may influence the decision to use one or the other, depending on financial circumstances. The polyethylene sheets used were almost seven times cheaper than the transwarming mattresses ($2.36 vs $14.52 each). Staff experienced minor difficulties with the polyethylene wrap during resuscitation, which resulted in displacement and possible loss of heat. Infatherm mattresses did not interfere with resuscitation even in difficult cases.
Mathew 2012 reported that no instances occurred in which the infant received accidental burns as a result of being in contact with the thermal mattress; however, investigators expressed concerns with respect to access to the infant for monitoring and intervention in the vinyl bag group, making the thermal mattress more practical, particularly for probe placement for monitoring pulse oximetry.
None of the included studies reported the following secondary outcome measures (adverse occurrences) (as predefined at the review protocol stage) for this comparison group: events due to the intervention (e.g. maceration, skin or systemic infection, antibiotics, fluid problems, negative psychological outcomes).
Plastic bag and thermal mattress versus plastic bag only (Comparison 15)
Two studies comprising 119 infants compared plastic bag + thermal mattress versus plastic bag (Leslie 2007; McCarthy 2013). Although Leslie 2007 reported outcomes for infants at < 29 weeks' gestation, these findings were grouped with those of the subgroup of infants at < 28 weeks' gestation group for meta‐analysis and are referred to as such in the text.
Primary outcomes
Core body temperature (°C) of the infant taken on admission to the NICU or up to two hours after birth (Outcome 15.1)
Two studies comprising 119 infants reported this outcome in terms of core body temperature in °C on admission to the NICU in intervention and active comparator groups (plastic bag + thermal mattress and plastic bag only) (Leslie 2007; McCarthy 2013). Data show core body temperature in °C rectal ‐ for McCarthy 2013 ‐ and axillary ‐ for Leslie 2007. Overall, Leslie 2007 showed no significant differences in effect for plastic bag + thermal mattress and plastic bag only for infants at < 29 weeks' gestation, whereas McCarthy 2013 showed a significant effect in favour of the plastic bag + mattress intervention for infants at < 31 weeks' gestation and for the subgroup at < 28 weeks' gestation.
Outcome 15.1.1: Overall, for infants at < 31 weeks' gestation, data show a statistically significant difference for core body temperature on admission to the NICU favouring the plastic bag + thermal mattress intervention when compared with plastic bag only immediately after birth in the delivery room (MD 0.37°C, 95% CI 0.09 to 0.66; two studies; N = 119) (Analysis 15.1).
The overall test for homogeneity passed with an I² value of 0% and for subgroup differences with an I² value of 19.3%.
Outcome 15.1.2: For infants at < 28 weeks' gestation, data show a statistically significant difference for core body temperature on admission to the NICU favouring the plastic bag + thermal mattress intervention when compared with plastic bag only immediately after birth in the delivery room (MD 0.57°C, 95% CI 0.20 to 0.94; two studies; N = 76) (Analysis 15.1). The test for homogeneity passed with an I² value of 43% (low heterogeneity).
Outcome 15.1.3: For infants at 28 to 30 weeks' gestation, data show no statistically significant differences between interventions (plastic bag + thermal mattress and plastic bag only) for core body temperature on admission to the NICU (MD 0.10°C, 95% CI ‐0.36 to 0.56; one study; N = 43) (Analysis 15.1).
Hypothermia on admission to the NICU (core body temperature < 36.5°C, or skin temperature < 36°C) (Outcome 15.2)
Leslie 2007 and McCarthy 2013, in addition to reporting core body temperature on admission to the NICU as a continuous variable, provided data in a dichotomous format in terms of incidence of hypothermia seen as core body temperature (rectal) < 36.5°C ‐ in McCarthy 2013 ‐ and hypothermia seen as core body temperature (axillary) < 36.5°C ‐ in Leslie 2007 ‐ in the intervention and comparison groups (plastic bag + thermal mattress and plastic bag only). Each individual study showed no significant differences in effect for plastic bag + thermal mattress and plastic bag only.
Outcome 15.2.1: Overall, for infants at < 31 weeks' gestation, data show no significant differences in risk of hypothermia between infants who received plastic bag + thermal mattress and those given plastic bag only (typical RR 0.93, 95% CI 0.45 to 1.90; typical RD ‐0.01, 95% CI ‐0.15 to 0.12; two studies; N = 119) (Analysis 15.2). The overall test for homogeneity failed with an I² value of 55% (moderate heterogeneity) for RR and 65% (moderate heterogeneity) for RD, but passed for subgroup differences with an I² value of 16.8% for RR and 37% (low heterogeneity) for RD.
Outcome 15.2.2: For infants at < 28 weeks' gestation, data show no significant differences in risk of hypothermia between infants who received plastic bag + thermal mattress and those given plastic bag only (typical RR 0.66, 95% CI 0.29 to 1.46; typical RD ‐0.10, 95% CI ‐0.28 to 0.08; two studies; N = 76) (Analysis 15.2). The overall test for homogeneity passed with an I² value of 0% for RR and 14% for RD.
Outcome 15.2.3: For infants at 28 to 30 weeks' gestation, data show no significant differences in risk of hypothermia between infants who received plastic bag + thermal mattress and those given plastic bag only (RR 3.82, 95% CI 0.46 to 31.43; RD 0.13, 95% CI ‐0.05 to 0.32; one study; N = 43) (Analysis 15.2).
Outside the normothermic range on admission to the NICU or up to two hours after birth (Outcome 15.3)
McCarthy 2013, in addition to reporting core body temperature on admission to the NICU as a continuous variable, provided data in a dichotomous format in terms of incidence of normothermia (core body temperature (rectal) 36.5°C to 37.5°C) in intervention and comparison groups (plastic bag + thermal mattress and plastic bag only). Leslie 2007 provided data for incidence of hypothermia and hyperthermia; therefore for the purposes of meta‐analysis, we defined normothermia as core body temperature (axillary) 36.5°C to 38°C. We meta‐analysed the incidence of core body temperature outside the defined normothermic range. Overall, Leslie 2007 showed no significant differences in effect for plastic bag + thermal mattress and plastic bag only among infants at < 29 weeks' gestation, whereas McCarthy 2013 showed a significant effect in favour of the comparator (plastic bag only) for infants at < 31 weeks' gestation, and for the subgroup at < 28 weeks' gestation. This was not a prespecified outcome at the review protocol stage.
Outcome 15.3.1: Overall, for infants at < 31 weeks' gestation, data show no significant differences in the risk of being outside the normothermic range between those who received plastic bag + thermal mattress and those given plastic bag only (typical RR 1.46, 95% CI 0.94 to 2.27; typical RD 0.16, 95% CI ‐0.00 to 0.33; two studies; N = 119) (Analysis 15.3). The overall test for homogeneity failed with an I² value of 87% (high heterogeneity) for RR and 88% (high heterogeneity) for RD, but passed for subgroup differences with an I² value of 0% for RR and for RD.
Outcome 15.3.2: For infants at < 28 weeks' gestation, data show no significant differences in the risk of being outside the normothermic range between infants who received plastic bag + thermal mattress and those given plastic bag only (typical RR 1.23, 95% CI 0.69 to 2.18; typical RD 0.08, 95% CI ‐0.12 to 0.29; two studies; N = 76) (Analysis 15.4). The test for homogeneity failed with an I² value of 83% (high heterogeneity) for RR and 89% (high heterogeneity) for RD.
Outcome 15.3.3: For infants at 28 to 30 weeks' gestation, data show no significant differences (borderline) in risk of being outside the normothermic range between infants who received plastic bag + thermal mattress and those given plastic bag only (RR 1.91, 95% CI 0.96 to 3.78; RD 0.30, 95% CI 0.02 to 0.59; one study; N = 43) (Analysis 15.3).
Hyperthermia on admission to the NICU (core body temperature > 37.5°C) (Outcome 15.4)
Leslie 2007 and McCarthy 2013, in addition to reporting core body temperature on admission to the NICU as a continuous variable, provided data in a dichotomous format in terms of incidence of hyperthermia defined as core body temperature (rectal) > 37.5°C by McCarthy 2013, and as core body temperature (axillary) > 38°C by Leslie 2007, among intervention and comparison groups (plastic bag + thermal mattress and plastic bag only). Overall, Leslie 2007 showed no significant differences in effect for plastic bag + thermal mattress and plastic bag only among infants at < 29 weeks' gestation, whereas McCarthy 2013 showed a significant effect in favour of the comparator (plastic bag only) for infants at < 31 weeks' gestation.
Outcome 15.4.1: Overall, for infants at < 31 weeks' gestation, plastic bag + thermal mattress significantly increased risk of hyperthermia on admission to the NICU when compared with plastic bag only (typical RR 2.15, 95% CI 1.07 to 4.32; typical RD 0.18, 95% CI 0.03 to 0.32; two studies; N = 119) (Analysis 15.4). For every six infants receiving plastic bag and thermal mattress, one infant would be hyperthermic on admission to the NICU (NNTH 6, 95% CI 3 to 33). The overall test for homogeneity passed for RR with an I² value of 16%, and for subgroup differences with an I² value of 0% for both RR and RD, but failed for RD with an I² value of 76% (moderate heterogeneity). This may be attributable to differences in the definition of hyperthermia, which requires a higher temperature in Leslie 2007 (> 38°C).
Outcome 15.4.2: For infants at < 28 weeks' gestation, data show no significant differences in risk of hyperthermia between infants who received plastic bag + thermal mattress and those given plastic bag only (typical RR 2.99, 95% CI 0.93 to 9.65; typical RD 0.18, 95% CI 0.02 to 0.34; two studies; N = 76) (Analysis 15.4). The test for homogeneity failed for RR with an I² value of 68% (moderate heterogeneity), and for RD with an I² value of 87% (high heterogeneity).
Note: Computational errors can occur when one or both arms of a study have a zero count. RevMan software compensates by adding 0.5 to each cell in a two‐by‐two table.
Outcome 15.4.3: For infants at 28 to 30 weeks' gestation, data show no significant differences in risk of hyperthermia between infants who received plastic bag + thermal mattress and those given plastic bag only (RR 1.59, 95% CI 0.70 to 3.60; RD 0.17, 95% CI ‐0.12 to 0.45; one study; N = 43) (Analysis 15.4).
Major brain injury: abnormal cranial ultrasonography (Outcome 15.5)
One study reported this outcome in terms of incidence of abnormal cranial ultrasonography (IVH ≥ grade Ⅲ, periventricular leukomalacia, or post‐haemorrhagic hydrocephalus) in the intervention and comparison groups (plastic bag + thermal mattress and plastic bag only) (McCarthy 2013). This was not a prespecified outcome at the review protocol stage.
Outcome 15.5.1: For infants at < 31 weeks' gestation, data show no significant differences in risk of abnormal cranial ultrasonography between infants who received plastic bag + thermal mattress and those given plastic bag only (RR 0.32, 95% CI 0.03 to 2.89; RD ‐0.06, 95% CI ‐0.17 to 0.05; one study; N = 72).
Mortality (death within hospital stay) (Outcome 15.6)
Two studies comprising 119 infants reported this outcome in terms of incidence of death before hospital discharge in intervention and comparison groups (plastic bag + thermal mattress and plastic bag only) (Leslie 2007; McCarthy 2013). Each individual study showed no significant differences in effect for plastic bag + thermal mattress and plastic bag only among infants at < 31 weeks' gestation.
Outcome 15.6.1: For infants at < 31 weeks' gestation, data show no significant differences in risk of death before hospital discharge between infants who received plastic bag + thermal mattress and those given plastic bag only (RR 0.73, 95% CI 0.32 to 1.66; RD ‐0.05, 95% CI ‐0.18 to 0.08; two studies; N = 119). The test for homogeneity passed with an I² value of 0% for RR and RD.
Chronic lung disease (Outcome 15.7)
One study reported this outcome in terms of the incidence of requirement for oxygen supplementation on the date of 36 weeks' adjusted gestation in intervention and comparison groups (plastic bag + thermal mattress and plastic bag only) (McCarthy 2013).
Outcome 15.7.1: For infants at < 31 weeks' gestation, data show no significant differences in risk of chronic lung disease between infants who received plastic bag + thermal mattress and those given plastic bag only (RR 1.73, 95% CI 0.72 to 4.18; RD 0.13, 95% CI ‐0.07 to 0.32; one study; N = 72).
Coagulation support (Outcome 15.8)
One study reported this outcome in terms of incidence of the use of platelets or fresh frozen plasma or cryoprecipitate in intervention and comparison groups (plastic bag + thermal mattress and plastic bag only) (Leslie 2007). This was not a prespecified outcome at the review protocol stage.
Outcome 15.8.1: For infants at < 29 weeks' gestation, data show no significant differences in risk of coagulation support between infants who received plastic bag + thermal mattress and those given plastic bag only (RR 1.04, 95% CI 0.30 to 3.69; RD 0.01, 95% CI ‐0.21 to 0.22; one study; N = 47).
Inotrope use (Outcome 15.9)
Two studies comprising 119 infants reported this outcome in terms of incidence of inotrope use (dopamine or dobutamine or hydrocortisone) in intervention and comparison groups (plastic bag + thermal mattress and plastic bag only) (Leslie 2007; McCarthy 2013). This was not a prespecified outcome at the review protocol stage. Each individual study showed no significant difference in effect for the plastic bag + thermal mattress and plastic bag only among infants at < 31 weeks' gestation.
Outcome 15.9.1: For infants at < 31 weeks' gestation, data show no significant differences in risk of Inotrope use between infants who received plastic bag + thermal mattress and those given plastic bag only (RR 1.14, 95% CI 0.61 to 2.11; RD 0.03, 95% CI ‐0.12 to 0.19; two studies; N = 119). The test for homogeneity passed with an I² value of 0% for RR and RD.
Intubated during admission (Outcome 15.10)
One study reported this outcome in terms of incidence of intubation during admission in the intervention and comparison groups (plastic bag + thermal mattress and plastic bag only) (McCarthy 2013). This was not a prespecified outcome at the review protocol stage.
Outcome 15.10.1: For infants at < 31 weeks' gestation, data show no significant differences in risk of intubation during admission between infants who received plastic bag + thermal mattress and those given plastic bag only (RR 0.98, 95% CI 0.73 to 1.32; RD ‐0.01, 95% CI ‐0.22 to 0.20; one study; N = 72).
Greater than or equal to one dose of surfactant during admission (Outcome 15.11)
One study reported this outcome in terms of incidence of requirement for one or more doses of surfactant during admission in intervention and comparison groups (plastic bag + thermal mattress and plastic bag only) (McCarthy 2013). This was not a prespecified outcome at the review protocol stage.
Outcome 15.11.1: For infants at < 31 weeks' gestation, data show no significant differences in risk of receiving one or more doses of surfactant during admission between infants who received plastic bag + thermal mattress and those given plastic bag only (RR 0.99, 95% CI 0.70 to 1.38; RD ‐0.01, 95% CI ‐0.23 to 0.21; one study; N = 72).
Other secondary outcomes
None of the included studies reported the following secondary outcome measures (as predefined at the review protocol stage) for this comparison group: hypoglycaemia, respiratory distress syndrome, surfactant given at any time, intubation in the delivery room, requirement for ventilation, duration of ventilation, length of stay, severe metabolic acidosis, PDA, NEC, or acute renal failure.
Adverse occurrences due to the intervention
McCarthy 2013 reported that wrapping in plastic bags did not present many problems for the neonatal team, and that once infants were placed in plastic bags and the bags were sealed, they remained sealed until arrival to the neonatal unit. Pulse oximeters were used in all cases, and the infant's heart rate was auscultated through the bag with no difficulty.
None of the included studies reported the following secondary outcome measures (adverse occurrences) (as predefined at the review protocol stage) for this comparison group: burns, maceration, antibiotics, fluid problems, or negative psychological outcomes.
Discussion
Hypothermia (body temperature below normal) on admission to neonatal units continues to be a persistent problem worldwide across all climates. "A naked newborn exposed to an environmental temperature of 23°C suffers the same heat loss as a naked adult at 0°C" (WHO 1997), and this is negatively correlated with gestation and birth weight. Therefore, early intervention in the delivery room is crucial for minimisation of heat loss during resuscitation, stabilisation, and transport to the neonatal intensive care unit (NICU), particularly for the least mature, smallest, and sickest infants. National and international agencies responsible for development of neonatal resuscitation guidelines face a challenging role while research evidence is emerging/not yet conclusive, but long‐term safety data are not yet available. In 2006, the ILCOR 2006 consensus statement first recommended that plastic bags or plastic wrapping under radiant heat should be considered as a standard technique to maintain temperature. Since that time, recommendations have continued to evolve as research evidence has become available, and these thermal care practices have been adopted to varying degrees (El‐Naggar 2012; Godhamgaonkar 2011; Smith 2016). Consequently, for this review update, we have expanded our inclusion criteria to reflect these changes in clinical practice. We remain focussed on interventions to prevent hypothermia applied immediately at birth apart from 'routine' care (as defined in our original protocol) but have also included randomised and quasi‐randomised trials comparing any other single/combination of intervention(s) designed for prevention of hypothermia in preterm and/or low birth weight infants and applied within 10 minutes after birth in the delivery room that otherwise would have been excluded.
Summary of main results
Twenty‐five studies across 15 comparison groups met the inclusion criteria (2481 randomly assigned participants; 2433 participants completing the studies). Interventions were categorised into three main groups: barriers to heat loss (18 studies ‐ 11 comparison groups), external heat sources (three studies ‐ two comparison groups), and combinations of interventions (four studies ‐ two comparison groups). We judged the quality of evidence for the main comparison group (plastic wraps or bags vs routine care) to be moderate across key clinical outcomes. For the remaining comparison groups, we derived evidence from one or two studies with small sample sizes, thereby limiting our ability to draw firm conclusions.
Barriers to heat loss category
Core body temperature (°C) on admission to the NICU or up to two hours after birth (plastic wraps or bags vs routine care): Thirteen studies comprising 1633 infants reported core body temperature in °C (rectal or axillary) on admission to the NICU or up to two hours after birth (Cardona Torres 2012; Chantaroj 2011; Farhadi 2012; Gathwala 2010; Knobel 2005; Leadford 2013; Reilly 2015; Rohana 2011; Smith 2013; Talakoub 2015; Trevisanuto 2010; Vohra 1999; Vohra 2004). Overall, plastic wraps or bags were effective in reducing heat loss for infants at < 37 weeks' gestation when compared with infants who received routine care immediately after birth in the delivery room. Each individual study showed a significant effect in favour of the intervention for core body temperature on admission to the NICU or up to two hours after birth across gestations, with the exception of a small study that showed no significant effect for the subgroup of infants at ≥ 28 and ≤ 31 weeks' gestation (Vohra 1999). Findings indicate that the effect is greater among the most immature infants. Data show a substantial level of heterogeneity within each subgroup of infants. Possible causes may lie within variations in methods used across studies, particularly with respect to "routine care", or in baseline hypothermia rates, as previously discussed. Heat loss prevention observed, despite these variations in how the standard of care was implemented between sites, demonstrates that findings are robust and generalisable across centres. A funnel plot analysis for core body temperature on admission to the NICU suggests possible publication bias with respect to smaller non‐effect studies that have not been published. Plastic wraps or bags seem to prevent rather than delay the postnatal fall in temperature with significant effects in favour of plastic wraps and bags at 1 hour, 90 minutes, and 2 hours after birth; at post stabilisation; and at 30 minutes, 1 hour, 90 minutes, and 2 hours after the initial NICU admission temperature was taken.
Hypothermia on admission to NICU or up to two hours after birth (plastic wraps or bags vs routine care): Ten studies comprising 1417 infants reported the incidence of hypothermia in intervention and control groups (plastic wrap or bag and routine care) (Cardona Torres 2012; Chantaroj 2011; Farhadi 2012; Knobel 2005; Leadford 2013; Reilly 2015; Rohana 2011; Trevisanuto 2010; Vohra 1999; Vohra 2004). Overall, plastic wraps or bags were effective in reducing risk of hypothermia for all infants at < 37 weeks' gestation when compared with those given routine care immediately after birth in the delivery room. Four infants would have to be wrapped in plastic to prevent one infant from becoming hypothermic on admission to the NICU. Most individual studies showed a significant effect in favour of the intervention (plastic wrap or bag), with the exception of Chantaroj 2011, which reported no differences in effect among infants at < 28 weeks' gestation; however few infants were included in this subgroup. The small Vohra 1999 and Cardona Torres 2012 studies showed borderline significant effect in favour of the plastic wrap or bag group. Reductions in risk of hypothermia varied across gestational age groups, with 33% overall, 30% for infants at < 28 weeks' gestation, and 83% for infants at 28 to 32 weeks' gestation.
Hyperthermia on admission to NICU or up to two hours after birth (plastic wraps or bags vs routine care): Twelve studies comprising 1523 infants reported the incidence of hyperthermia in intervention and control groups (plastic wrap or bag and routine care) (Cardona Torres 2012; Chantaroj 2011; Farhadi 2012; Gathwala 2010; Knobel 2005; Leadford 2013; Reilly 2015; Smith 2013; Talakoub 2015; Trevisanuto 2010; Vohra 2004; Vohra 1999). Each individual study showed no significant differences in risk of hyperthermia, with the exception of the large pragmatic 'real‐world' multi‐centre study, which showed that plastic wrap significantly increased the risk of being hyperthermic (core body temperature ≥ 37.5° C) on admission to the NICU and at post stabilisation for infants at ≥ 24 and < 28 weeks' gestation (Reilly 2015). Overall, plastic wraps or bags significantly increased the risk of hyperthermia on admission to the NICU for infants at < 37 weeks' gestation when compared with those given routine care, with highest risk seen among infants at < 28 weeks' gestation. Twenty‐five infants would have to be wrapped in plastic to have one infant hyperthermic on admission to the NICU. Five studies (Chantaroj 2011; Gathwala 2010; Leadford 2013; Talakoub 2015; Vohra 1999) included in the meta‐analysis reported no occurrence of hyperthermia in either group, and one further study reported that two infants in the wrap group were hyperthermic within the first 12 hours of life (Rohana 2011). Reilly 2015 reported that the risk of hyperthermia did not appear to be related to delivery room temperature.
Core body temperature outside the normothermic range on admission to the NICU or up to two hours after birth (plastic wraps or bags vs routine care): To balance reduced risk of hypothermia with increased risk of hyperthermia, we meta‐analysed data for the outcome measure 'incidence of core body temperature outside normothermic range on admission to NICU or up to two hours after birth'. This outcome was reported by or was derived from definitions of hypothermia and hyperthermia provided by five studies comprising 1048 infants (Chantaroj 2011; Farhadi 2012; Leadford 2013; Reilly 2015; Trevisanuto 2010). Investigators defined normothermia as core body temperature (rectal or axillary) 36.5°C to 37.5°C (Chantaroj 2011; Farhadi 2012); core body temperature (axillary) 36.5°C to 37.4°C (baseline) (Reilly 2015); core body temperature (axillary) 36.4°C to 37.5°C (Trevisanuto 2010); and core body temperature (axillary) 36.5°C to 37.5°C at one hour after birth (Leadford 2013). Most individual studies showed a significant effect in favour of the intervention (plastic wrap or bag group), with the exception of Chantaroj 2011, which showed no differences in effect among infants at < 28 weeks' gestation; however the number of infants in this subgroup was very small. Trevisanuto 2010 showed a borderline significant effect in favour of the plastic wrap or bag group for infants at < 29 weeks' gestation. Overall, for infants at < 37 weeks' gestation, plastic wraps or bags significantly reduced the risk of having a core body temperature outside the normothermic range on admission to the NICU. Overall, five infants would have to be wrapped in plastic to prevent one infant from having a core body temperature outside the normothermic range, increasing to seven for infants at < 28 weeks' gestation.
Mortality ‐ death within hospital stay or at six months' corrected gestation (plastic wraps or bags vs routine care): Ten studies comprising 1447 infants provided insufficient evidence to suggest that plastic wraps or bags significantly reduce risk of death during hospital stay (or at six months' corrected age) for all gestations.
Morbidity (plastic wraps or bags vs routine care): For infants at ≥ 24 and < 28 weeks' gestation, plastic wraps or bags significantly reduced the risk of pulmonary haemorrhage during hospital stay. Data show no evidence of a significant difference for any of the following reported secondary outcomes: incidence of: brain injury (major brain injury), bronchopulmonary dysplasia (BPD), gastrointestinal perforation, intubation in the delivery room, steroids for BPD, necrotising enterocolitis (NEC), patent ductus arteriosus (PDA), pneumothorax, requirement for bubble continuous positive airway pressure (CPAP) or ventilation, respiratory distress syndrome, ROP, and sepsis (late or early), nor for arterial oxygen saturation, bicarbonate, first blood gas pH, blood glucose concentration, median or mean duration of hospitalisation, median duration of CPAP, mean duration of oxygen therapy, and median duration of ventilation.
Emerging evidence based on two or fewer studies (plastic wraps or bags or caps vs routine care): Plastic wraps were also effective in reducing heat losses (without an increase in risk of hyperthermia) on admission to the NICU for infants at < 37 weeks' gestation with birth weight ≤ 2500 grams undergoing interhospital transport from multiple maternity homes and hospitals to a tertiary care regional referral NICU when compared with those given routine care (one study comprising 96 infants; Bhavsar 2015). Four infants would have to be wrapped in plastic to prevent one from becoming hypothermic. Plastic wraps were also effective in reducing the risk of hypoglycaemia within two hours of birth when compared with routine care (Bhavsar 2015). Data show no significant differences in the following reported secondary outcomes: base excess, blood gas pH, mean duration of oxygen therapy, blood glucose level, and severe metabolic acidosis.
One study comprising 60 infants compared plastic bag with previous drying versus routine care as opposed to most of the studies in Comparison 1 (plastic wrap or bag vs routine care), in which infants were placed in plastic wraps or bags while still wet (Cardona Torres 2012). For infants at ≥ 28 and < 37 weeks' gestation with birth weight ≥ 1000 and ≤ 2499 grams, data show significant effects favouring the plastic wrap or bag with previous drying at 30 minutes, 1 hour, 90 minutes, and 2 hours after birth. No infants were hyperthermic in the plastic wrap or bag with previous drying groups nor among those receiving routine care. Data show no significant differences in any of the reported secondary outcomes: median glucose concentration at 120 minutes after birth, heart rate, respiratory rate, or blood pressure.
Plastic caps were also effective in reducing heat losses for the younger group of infants at < 29 weeks' gestation compared with routine care (one study comprising 64 infants; Trevisanuto 2010). Infants in the routine care group were placed in prewarmed towels after drying (no head covering). Two infants would have to wear a plastic cap to prevent one infant from becoming hypothermic, and to prevent one infant from having a core body temperature outside the normothermic range (core body temperature 36.4°C to 37.5°C) on admission to the NICU. No infants had hyperthermia in the plastic cap group nor among those receiving routine care. Data show no significant differences in reported secondary outcomes: major brain injury, mortality, bicarbonate, blood gas pH, first serum glucose concentration, and intubation in the delivery room.
Two studies comprising 122 infants‐Talakoub 2015; Tescon‐delos Santos 2012 ‐ compared plastic bags + plastic caps versus routine care for infants at ≥ 28 and ≤ 32 weeks' gestation (Talakoub 2015), nor for infants at ≥ 28 and ≤ 36 weeks' gestation (Tescon‐delos Santos 2012). Overall, the combination of plastic bags + plastic caps was effective in reducing heat losses on admission to the NICU compared with routine care. Heterogeneity was high owing to differences in gestational age across studies. The combination of plastic bags + plastic caps was not effective in reducing heat losses for more mature infants at ≥ 28 and ≤ 36 weeks' gestation up to one hour after the initial NICU admission temperature was taken (Tescon‐delos Santos 2012), but this combination was effective for less mature infants at one and two hours after the initial NICU admission temperature was taken (Talakoub 2015). Data show no significant differences in risk of hyperthermia for infants at ≥ 28 and ≤ 36 weeks' gestation on admission to the NICU (Tescon‐delos Santos 2012). Researchers provided limited reporting of prespecified secondary outcomes for this comparison group and no evidence of a significant difference for any of the reported secondary outcome measures ‐ hyponatraemia or weight (grams) on the fifth day of life ‐ nor for adverse occurrences.
Emerging evidence based on two or fewer studies (stockinette cap vs routine care): When the barrier to heat loss was a stockinette cap (one study comprising 40 infants; Roberts 1981), data show a borderline statistically significant difference in temperature on admission to the NICU in favour of the intervention group for infants at ≥ 32 and ≤ 36 weeks' gestation with a birth weight < 2000 grams, but no difference for infants at ≥ 2000 grams. This finding is consistent with those reported by Greer 1988, which compared various head coverings under radiant warmers for infants > 2500 grams. When head coverings were applied within one minute of birth, infants wearing stockinettes had lower mean core body temperature at 5, 15, and 30 minutes after delivery as compared with the hatless group or the group wearing an insulated fabric bonnet. As a result, researchers did not recommend stockinettes for use in conjunction with a radiant warmer (Greer 1988).
Emerging evidence based on two or fewer studies (barrier vs barrier): Plastic bags with previous drying were shown to be comparable to plastic bags without previous drying for infants at ≥ 28 and < 37 weeks' gestation with birth weight ≥ 1000 and ≤ 2499 grams (one study comprising 60 infants; Cardona Torres 2012). Data show no evidence of a significant difference for any of the reported secondary outcomes of hyperthermia or glucose concentration at 120 minutes of life, heart rate, respiratory rate, or blood pressure.
When plastic caps were compared with plastic wraps (no cap) for infants at < 29 weeks' gestation (one study comprising 64 infants; Trevisanuto 2010), data show no significant differences between the two interventions for core body temperature on admission to the NICU and a borderline significant difference at one hour after the initial admission temperature was taken. However, use of oximetry signified opening of the bag during placement of the sensor, which could have reduced the temperature protective effect. Data show no significant differences for reported secondary outcomes: hyperthermia on admission to the NICU, major brain injury, mortality, bicarbonate concentration, blood gas pH, first serum glucose concentration, and intubation at birth.
Caglar 2014 (one study comprising 59 infants) demonstrated that plastic bags were more effective in reducing heat losses than plastic wraps at 20 minutes, 40 minutes, and 1 hour after birth among infants at ≤ 32 weeks' gestation. However, data show no significant differences between the two interventions in risk of hypothermia within one hour after birth. Investigators reported no additional secondary outcomes.
Doglioni 2014 (one study comprising 100 infants) compared plastic total body wraps (body + head) versus plastic body wraps (head uncovered) for infants at < 29 weeks' gestation. Data show no significant differences between the two interventions for core body temperature on admission to the NICU and at one hour after admission. Investigators reported no significant differences in reported secondary outcomes: hyperthermia, mortality (death before discharge), major brain injury, BPD, and NEC.
For infants at ≥ 28 and ≤ 32 weeks' gestation, the combination of plastic bags + plastic hats was shown to be more effective in reducing heat losses on admission to the NICU and at one and two hours after admission when compared with plastic wraps + cotton hats (one study comprising 64 infants; Talakoub 2015). No hyperthermic infants were included in either group. Investigators reported no additional secondary outcomes. A recent randomised controlled trial (RCT) conducted in Malaysia compared the polyethylene cap 'NeoCap' versus a cotton cap as an adjunct to polyethylene occlusive body wrap (without drying) for 80 infants at 24 to 34 weeks' gestation (Shafie 2017). This study reported no significant differences in mean NICU admission (axillary) temperatures (35.3°C vs 35.1°C; P = 0.36); however, mean poststabilisation temperature (after respiratory support, peripheral lines, and cardiorespiratory monitor probes had been secured) was significantly higher in the NeoCap group (36.0°C vs 35.5°C; P = 0.01). Rates of admission hypothermia were high in both groups (axillary temperature < 36.5°C) at 92.5% (NeoCap group) versus 100% (control group). The mean ambient delivery room temperature was 23.3°C throughout this study and may have been a contributing factor.
External heat sources category
Emerging evidence based on two or fewer studies (skin‐to‐skin care (SSC) vs routine care): SSC was shown to be effective in reducing risk of hypothermia when compared with conventional incubator care for infants with birth weight ≥ 1200 and ≤ 2199 grams (one study comprising 126 infants; Bergman 2004). Two infants would have to receive SSC to prevent one infant from becoming hypothermic (skin temperature < 35.5°C). No evidence showed a significant difference for the reported secondary outcome hypoglycaemia.
Emerging evidence based on two or fewer studies (thermal mattress vs routine care): Two studies comprising 126 infants compared thermal mattress versus routine care (Brennan 1996; Chawla 2011). Thermal (transwarmer) mattress significantly kept infants ≤ 1500 grams warmer and reduced the incidence of hypothermia on admission to the NICU with no significant difference in risk of hyperthermia. Three infants would have to receive a thermal mattress to prevent one infant from being hypothermic (core body temperature < 36°C) on admission to the NICU. Thermal (transwarmer) mattress also significantly reduced risk of a core body temperature outside the normothermic range (36.5°C to 37.5°C) on admission to the NICU. Two infants would have to receive a thermal mattress to prevent one infant from having a temperature outside the normothermic range. Data show a high level of heterogeneity between studies in this comparison group; the most likely reason for this is that the two studies used different methods. Chawla 2011 used additional thermal care measures (plastic bag without drying below the neck) for infants at < 28 weeks' gestation; this was considered to be part of routine thermal care practices. However, Brennan 1996 ‐ the earlier study ‐ did not employ such additional thermal care measures. Data show no evidence of a significant difference for any of the reported secondary outcomes: mortality, major brain injury, BPD, mean duration of: hospital stay, ventilation or oxygen requirement, incidence of hypoglycaemia, metabolic acidosis, NEC, or sepsis.
Combination of interventions category
Emerging evidence based on two or fewer studies (thermal mattress vs plastic wraps or bags): Two studies comprising 77 infants compared thermal mattresses versus plastic wraps or bags for infants at ≤ 28 weeks' gestation. Each individual study showed no significant difference in effect for core body temperature, incidence of hypothermia, hyperthermia, and core body temperature outside the normothermic range on admission to the NICU. Mathew 2012 tended towards favouring plastic bags, whereas Simon 2011 showed borderline significance favouring thermal mattresses for core body temperature on admission to the NICU. The most plausible reason for the observed moderate heterogeneity lies with Simon 2011, in which variability of use between practitioners when the intervention was polyethylene wrap and, in some cases, displacement of the wrap could have resulted in heat loss. Data show no significant differences for reported secondary outcomes: brain injury, major brain injury, mortality, BPD, hypotension, NEC, PDA, ROP, spontaneous intestinal perforation, worst base deficit, and worst pH in the first 24 hours of life.
Emerging evidence based on two or fewer studies (plastic bags and thermal mattresses vs plastic bags): Two studies comprising 119 infants compared plastic bag + thermal mattress versus plastic bag (Leslie 2007; McCarthy 2013). Investigators reported that plastic bags in combination with thermal mattresses were shown to keep infants warmer on admission to the NICU when compared with plastic bags alone for infants at < 31 weeks' gestation (Leslie 2007; McCarthy 2013), and greater effect size was seen for infants at < 28 weeks' gestation. However, overall, data show no significant difference in risk of hypothermia (core body temperature < 36.5°C) but an overall significant increased risk of hyperthermia associated with the simultaneous combination of plastic bag and thermal mattress. For every six infants receiving plastic bag + thermal mattress, one infant would be hyperthermic on admission to the NICU for infants at < 31 weeks' gestation. Researchers found no significant difference in risk of having a core body temperature outside the normothermic range on admission to the NICU nor for reported secondary outcomes: major brain injury, mortality, chronic lung disease, coagulation support, inotrope use, intubation during admission, and one or more doses of surfactant during admission.
Overall for all included interventions designed to prevent heat loss at birth
Despite variation in interventions applied; definitions of 'routine care' and definitions of hypothermia, hyperthermia, and normothermia; and groups of infants included, a similar pattern emerged across all studies, with infants in the intervention group significantly warmer (or showing a non‐significant trend in that direction) than infants receiving 'routine care'. Evidence of moderate quality shows that plastic wraps or bags keep preterm infants warmer and lead to higher temperatures on admission to neonatal units with less hypothermia and temperatures outside the range of normothermia. Extremely preterm infants (< 28 weeks' gestation) appeared to benefit the most. Other interventions such as thermal mattresses, skin‐to‐skin care, and plastic caps also reduce hypothermia risk when compared with routine care, but these findings are based on two or fewer studies with small sample sizes. One small study found that stockinette caps were not more effective when compared with routine care in infants at 32 to 36 weeks' gestation.
Hyperthermia in the newborn may be caused by intrapartum maternal fever or, as our evidence suggests, by use of interventions to reduce hypothermia in the delivery room. Animal and human studies suggest that hyperthermia is harmful to the newborn brain. In infants at ≤ 6 hours' postnatal age and at ≥ 36 weeks’ gestation with moderate or severe hypoxic‐ischaemic encephalopathy, elevated temperatures were associated with increased odds of death or moderate/severe disability at 18 to 22 months on secondary data analysis of the NICHD whole body cooling trial (Laptook 2008a). Lyu 2015, in a retrospective observational study of 9833 preterm infants at < 33 weeks’ gestation in the Canadian Neonatal Network, demonstrated a U‐shaped relationship between admission temperature and poor clinical outcome. The lowest rates of adverse outcomes were associated with temperatures between 36.5°C and 37.2°C. Hyperthermia has also been shown to worsen ventilator‐induced lung injury and inflammation in preterm lambs (Ball 2010). Therefore, iatrogenic hyperthermia should be avoided, particularly in infants at risk of neurological injury. Caution must be taken to avert iatrogenic hyperthermia, particularly when multiple interventions are used simultaneously immediately after birth in the delivery room (e.g. plastic bags + thermal mattresses).
Many observational studies (as discussed in the Background section) have demonstrated increased mortality among preterm hypothermic infants compared with those who maintain normothermia, yet evidence is insufficient to suggest that interventions to prevent hypothermia reduce risk of in‐hospital mortality across all comparison groups included in this review. In addition, researchers have provided limited evidence of benefit and no evidence of harm for most short‐term morbidity outcomes known to be associated with being hypothermic, including major brain injury, BPD, ROP, NEC, and nosocomial infection. Limitations include lack of power to detect effects of these interventions on morbidity and mortality across most comparison groups. Data show significant differences for only two morbidity outcomes. For infants at ≥ 24 and < 28 weeks' gestation, plastic wraps or bags significantly reduced risk of pulmonary haemorrhage during hospital stay when compared with routine care (moderate‐quality evidence). Plastic wraps were also more effective in reducing risk of hypoglycaemia within two hours of birth when compared with routine care for infants at < 37 weeks' gestation with birth weight ≤ 2500 grams undergoing interhospital transport in one small study. Further investigation is needed to explore the pathways from admission hypothermia to mortality, and to ascertain whether hypothermia is a step in the causal pathway (Laptook 2008), possibly via late sepsis (Laptook 2007); alternatively, hypothermia may be a marker for illness and poorer outcome by association rather than for causality.
No reported adverse events across all studies, such as skin maceration or infection, were attributable to the intervention, nor did plastic bags, plastic caps, skin‐to‐skin care, or thermal mattresses interfere with resuscitation practices. However, mixed reports have discussed plastic wraps with regard to interference with resuscitation and placing of umbilical lines and probes. Problems appear to be related to displacement of plastic wraps.
Although the interventions studied in this review offer some short‐term benefit regarding heat loss prevention in vulnerable preterm and/or low birth weight infants, their effect on morbidity and their long‐term safety remain largely unknown; however, the harmful effects of hypothermia are well documented, and the findings of this review demonstrate that hypothermia can be prevented. Further information on effects of plastic wraps on long‐term neurodevelopmental outcomes will become available upon full publication of follow‐up data from the Heat Loss Prevention (HeLP) study (Reilly 2015). Therefore, monitoring (for both benefits and risks of potential adverse events) should continue in neonatal units where such interventions are adopted as routine practice, because wide variation in clinical practice has been reported. In addition, clarification of 'normal' temperatures for these populations of infants is essential, as are better data correlating axillary versus rectal versus other temperature‐taking sites. The multi‐centre HeLP study will yield important prospective data on 'normal' temperatures in this population, including correlation of axillary and rectal temperatures.
The 2015 neonatal resuscitation guidance provided by the American Heart Association (AHA), the European Resuscitation Council (ERC), and the International Liaison Committee on Resuscitation (ILCOR) states that for all gestational ages, admission temperature of newly born, non‐asphyxiated infants is a strong predictor of mortality and morbidity and should be recorded as an outcome predictor and as a key quality indicator (Perlman 2015). Fastman 2014 conducted a small qualitative study in the USA to explore clinicians' perspectives on barriers to management of hypothermia among low birth weight infants in the delivery room, during transport, and upon arrival to the NICU. A multi‐disciplinary team approach to neonatal resuscitation, thermal care, and overall delivery room management, coupled with integration of temperature monitoring into quality and safety programmes, was considered an important step in addressing this long‐standing problem. Paradoxically, hypothermia is a greater problem in lower‐income countries, where climates are generally warmer. Four studies were conducted in lower‐middle‐income countries: India (Bhavsar 2015; Gathwala 2010), Zambia (Leadford 2013), and the Phillippines (Tescon‐delos Santos 2012); and seven in upper‐middle‐income countries: South Africa (Bergman 2004), Mexico (Cardona Torres 2012), Thailand (Chantaroj 2011), Turkey (Caglar 2014), Iran (Farhadi 2012; Talakoub 2015), and Malaysia (Rohana 2011). Plastic wraps (food grade polyethylene, clean but not sterile) used in the HeLP study cost approximately CAD 157 for 5000 wraps, which, when calculated per infant, equates to approximately (USD) 3 cents each (Reilly 2015). Therefore, these may be an affordable option for preterm infants in low‐resource settings. Another low‐cost option would be skin‐to‐skin care; however, only one study fulfilled our inclusion criteria, because in most studies, participants were term infants, or skin‐to‐skin care was not initiated immediately at birth (Bergman 2004).
Overall completeness and applicability of evidence
All included studies fulfilled our strict PICO (population, intervention, control, and outcomes) criteria. The primary outcome in one included trial was all‐cause mortality; all other studies were powered for our primary outcome of temperature on admission to the NICU or for hypothermia. Investigators applied all interventions immediately after birth in the delivery room. Participants were categorised by gestation (all preterm) in 17 studies, by birth weight (all low birth weight) in two studies, and by both gestation and birth weight inclusion criteria in six studies. Four studies were conducted in lower‐middle‐income countries and seven in upper‐middle‐income countries; all other studies took place in high‐income countries. Available information showed that all studies used a combination of external heat sources (radiant warmer/drop light, warmer table, transport incubator) and caps as part of routine thermal care (control group and/or intervention group). In two studies, researchers attempted to keep ambient delivery room temperature at 26°C for preterm births. Ranges of routine delivery room ambient temperatures included a cool 20°C to 21°C to a warm 26°C to 28°C. Four studies reported the main outcome measure (temperature on admission to the NICU or up to two hours after birth) as a continuous variable, one study as a dichotomous variable (derived from skin temperature °C), and the remaining studies as both a continuous and a dichotomous variable. Overall, 18 studies reported core body temperature as axillary °C, four studies as rectal °C, and two studies as both axillary and rectal °C; one study reported skin temperature. Definitions of hypothermia were not consistent across studies. Researchers provided limited reporting of prespecified secondary outcomes in earlier studies, but more recent studies reported important secondary outcomes such as mortality, major brain injury, bronchopulmonary dysplasia (BPD), necrotising enterocolitis (NEC), retinopathy of prematurity (ROP), sepsis, and adverse events, particularly hyperthermia on admission to the NICU. Definitions of morbidity outcomes were also variable across studies. Future studies would benefit from using standardised definitions. This would reduce heterogeneity and risk of reporting bias, thereby facilitating meta‐analyses (Webbe 2017). Core outcomes in Neonatology (COIN) are currently under development as part of the Core Outcome Measures in Effectiveness Trials initiative (COMET) (Webbe 2017).
In summary, the literature included in our review was clearly applicable to our primary review objective ‐ "To assess the efficacy and safety of interventions, designed for prevention of hypothermia in preterm and/or low birth weight infants, and applied within 10 minutes after birth in the delivery room, compared with routine thermal care or any other single/combination of intervention(s) also designed for prevention of hypothermia in preterm and/or low birth weight infants, and applied within 10 minutes after birth in the delivery room". However, reporting of secondary outcomes was limited across studies, with many outcomes reported for just one study within comparison groups; therefore imprecision is a major concern. In addition, these studies were not powered for all secondary outcomes. We addressed publication bias for each outcome when we were able to include more than 10 studies in the meta‐analysis.
Quality of the evidence
Overall, for all included studies, across both domains for selection bias, we considered 12 studies (48%) to be at low risk (i.e. adequate sequence generation and allocation concealment). For 92% of included studies, we noted no attempt to blind participants and healthcare personnel to the intervention (unclear but unlikely in two studies). Outcomes were objective and so were less likely to be biased than subjective outcome measures. In addition, secondary outcome data for key morbidities were assessed throughout the neonatal stay, when personnel were less likely to be aware of the original allocation group. Only three studies reported any attempt to blind outcome assessors or the data analysis team to the intervention; therefore, potential detection biases cannot be ruled out. However, for our primary outcome measure ‐ core body or skin temperature ‐ we conducted a simple linear regression analysis using the temperature time series (birth to 120 minutes) for one intervention and control group reported in Cardona Torres 2012. We found a significant linear trend (P < 0.029) and widening of the mean temperature difference between control and intervention groups (polyethylene bag without previous drying). This pattern of results suggests that detection bias was unlikely. No studies reported incomplete outcome data ≥ 20%. Therefore risk of attrition bias was low. All infants randomised in most (64%) studies completed the trial. We did not have access to study protocols for 16 of our included studies; therefore our assessment of the potential risk of reporting bias was limited. In all, 14 studies (56%) appeared to be free from any additional sources of bias, and one had unclear risk of bias (McCarthy 2013).
Two studies reported issues with displacement of plastic wrap, which may have resulted in heat loss (Simon 2011; Smith 2013). This may have influenced the findings for comparison group 14 (plastic wrap or bag vs thermal mattress), which showed no significant differences in effect between the two interventions (Simon 2011). This bias is unlikely to change the conclusions for comparison group 1 (plastic wrap or bag vs routine care), which already demonstrated a highly significant difference in effect favouring plastic bag or wrap (Smith 2013). Some reported differences in infant characteristics (birth weight or gestation) could have influenced the effect size in favour of the intervention (Bhavsar 2015; Vohra 1999), or in favour of the control (Cardona Torres 2012). One study reported a higher incidence of swaddling in the control group but showed a statistically significant difference in effect for the comparison group plastic wrap and plastic cap versus routine care in favour of the intervention (Tescon‐delos Santos 2012). For skin‐to‐skin versus routine care (comparison group 12), Bergman 2004 found a risk of selection bias in that many preterm infants were born without the nurse researcher present. Further issues included higher delivery room temperatures in the intervention group for stockinette cap versus routine care (comparison group 11); despite this, data show no evidence of effect. Knobel 2005 attempted to maintain delivery room temperature at 26°C but reported a wide range of temperatures. Post hoc analyses controlling for delivery room temperature showed that mean admission temperatures in the intervention group (plastic wrap or bag) were 0.6°C higher than in the routine care group. Leslie 2007 compared plastic bag + thermal mattress versus plastic bag only (comparison 15) and found no differences between the two interventions; however, this study was underpowered and risk of bias cannot be ruled out, leading to unreliable findings. In addition, Reilly 2015 reported several protocol violations among treatment groups, including delayed application of the wrap, wrap opening during the study period, and early removal of the wrap. Despite these violations, investigators reported significantly higher mean baseline and poststabilisation temperatures for the wrap group. Further violations included use of adjunct heat sources in small numbers of infants in both wrap and non‐wrap groups, which was unlikely to affect findings.
We used the Grading of Recommendations Assessment, Development and Evaluation (GRADE) approach, as outlined in the GRADE Handbook (Schünemann 2013), to assess the quality of evidence for the following (clinically relevant) outcomes for our main comparison group: core body temperature on admission to the NICU or up to two hours after birth; hypothermia on admission to the NICU ‐ core body temperature < 36.5°C or skin temperature < 36°C; core body temperature (°C) one hour after the initial NICU admission temperature was taken; hyperthermia on admission to the NICU ‐ core body temperature > 37.5°C; major brain injury during hospital stay; pulmonary haemorrhage during hospital stay; and mortality (death within hospital stay or at six months' corrected gestation). For all outcomes presented, we assessed the quality of the evidence as moderate: "We are moderately confident in the effect estimate: The true effect is likely to be close to the estimate of the effect, but there is a possibility that it is substantially different." We chose to not downgrade any of our outcome measures for performance or detection bias, as discussed above. We addressed issues of publication bias and heterogeneity by funnel plot inspection and sensitivity analysis when we included 10 or more studies in the meta‐analysis.
-
Moderate‐quality evidence shows that plastic wraps or bags applied immediately at birth in the delivery room significantly reduced heat losses (13 studies; 1633 infants) and reduced hypothermia (10 studies; 1417 infants) on admission to the NICU and at one hour after the initial NICU temperature was taken (six studies; 373 infants) for infants at < 37 weeks' gestation when compared with those given routine care; as defined by any of the following routine practices: providing a warm delivery room at a minimum of 25°C, drying the infant immediately after birth, removing any wet blankets and wrapping in a prewarmed blanket, prewarming any contact surfaces, avoiding draughts, and, in developed countries (The World Bank 2016), using radiant warmers or incubators. We downgraded this evidence by one level for publication bias (core body temperature/hypothermia on admission to NICU) and for inconsistency (core body temperature one hour after the initial NICU temperature was taken).
-
Moderate‐quality evidence shows that plastic wraps or bags applied immediately at birth in the delivery room significantly increased risk of hyperthermia on admission to the NICU (12 studies; 1523) for infants at < 37 weeks' gestation when compared with those given routine care. We downgraded this evidence by one level for imprecision because conclusions were based on 50 incidences of hyperthermia in total. These data were sufficient to show significance but with wide 95% confidence intervals (CIs).
-
Moderate‐quality evidence reveals no evidence of effect on major brain injury during hospital stay for plastic wraps or bags applied immediately at birth in the delivery room for infants at < 37 weeks' gestation when compared with those given routine care. No studies in this comparison group were powered for this outcome. We downgraded this evidence by one level for imprecision, as total numbers of episodes (or events) were below optimal information size according to guidance.
-
Moderate‐quality evidence reveals no evidence of effect on mortality (death during hospital stay or at six months' corrected gestation if still in hospital) (10 studies; 1447 infants) for plastic wraps or bags applied immediately at birth in the delivery room for infants at < 37 weeks' gestation when compared with those given routine care. We downgraded this evidence by one level for publication bias. Nine out of ten studies were not powered for secondary outcomes. Reilly 2015 was powered for all‐cause mortality as the primary outcome. The 2015 AHA, ERC, and ILCOR neonatal resuscitation guidance reported evidence from 36 observational studies showing increased risk of mortality associated with hypothermia at admission to the NICU (Perlman 2015). We upgraded this low‐quality evidence to moderate quality owing to effect size, dose‐effect relationship, and single direction of evidence, according to the GRADE approach. Perlman 2015 meta‐analysed data from Reilly 2015,Vohra 1999, and Vohra 2004 and assessed the evidence as low quality, downgraded for indirectness and imprecision. However, we did not downgrade our meta‐analyses of 10 RCTs for imprecision, although numbers were below Office of Information Services (OIS) guidance, with 95% CIs for RRs attaining just ± 25% of best estimate.
-
Moderate‐quality evidence shows that plastic wraps or bags applied immediately at birth in the delivery room significantly reduced risk of pulmonary haemorrhage during hospital stay for infants at < 28 weeks' gestation compared with those given routine care. We downgraded this evidence by one level for imprecision because the evidence came from only one study (Reilly 2015).
The remaining comparison groups comprised a single study (groups 2, 3, 4, 6, 7, 8, 9, 10, 11, and 12) and a maximum of two studies across outcomes (group 5, 13, 14, and 15), which limits our ability to draw firm conclusions.
Potential biases in the review process
The strength of this review lies in the fact that review authors undertook a comprehensive literature search for both published and unpublished studies (up to 2013), although thereafter, publication bias cannot be ruled out. We also searched clinical trials registries to identify ongoing trials. We contacted trial authors for clarification pertaining to methodological and subgroup data. In addition, we agreed on strict inclusion criteria for PICO to ensure that the review was focused on interventions provided to prevent hypothermia for preterm and/or low birth weight infants applied within 10 minutes of birth rather than those given to term infants or over a longer period. We made every effort to minimise bias at all stages of the review process, in line with Cochrane methods.
Agreements and disagreements with other studies or reviews
Plastic barriers to heat loss
Two recent systematic reviews assessed the efficacy and safety of plastic coverings for reducing heat loss, mortality, and morbidity in preterm infants (Li 2016; Oatley 2016). Oatley 2016 also included full‐term neonates. Literature search end dates were August 2015 for Li 2016 and January 2015 for Oatley 2016, and the systematic reviews included RCTs and quasi‐RCTs (11 studies; N = 1601) (Li 2016), as well as both observational studies and RCTs (22 studies) (Oatley 2016). Li 2016 included findings of the multi‐centre HeLP study (Reilly 2015), but for Oatley 2016, this information fell outside the search parameters. Both reviews are in agreement with our findings and provide similar evidence in support of the effectiveness of plastic coverings in reducing heat losses and preventing hypothermia compared with routine thermal care across a range of gestational ages. Reductions in risk of hypothermia of 21% to 46% provided in Oatley 2016 and of 21% to 71% as reported in Li 2016 are slightly below the range of our pooled data of 33% overall (< 37 weeks' gestation), 30% for infants at < 28 weeks' gestation, and 83% for infants at ≥ 28 weeks' gestation (upper‐middle‐income settings). Data show no significant reductions in neonatal mortality or morbidity. Li 2016 reported a significantly higher incidence of hyperthermia in the plastic wrap group compared with the control group (typical RR 2.55, 95% CI 1.56 to 4.15; eight studies; N = 1438), which was readily resolved within one to two hours after unwrapping. However, based on the results of eight RCTs, Oatley 2016 suggested that risk of hyperthermia is low (< 5%), that no evidence suggested increased risk with concurrent use of an incubator, and that in all reported cases neonates returned to normothermia when wrapping was removed. As mentioned previously, we did not include data from Reilly 2015. Our findings are consistent with those of Li 2016 but show greater risk with respect to hyperthermia (RR 3.91, 95% CI 2.05 to 7.44; 12 studies, N = 1523). For Reilly 2015, we meta‐analysed data for baseline temperature rather than for poststabilisation temperature (RR 2.55, 95% CI 1.56 to 4.15 vs RR 2.35, 95% CI 1.38 to 4.00). Implications for research included the need for further study to assess the role of plastic coverings outside the hospital setting and inclusion of longer follow‐up periods to assess the impact of this intervention on mortality and neurodevelopmental outcomes. Further studies to assess effectiveness of plastic wrap compared with skin‐to‐skin care (SSC) immediately after birth would inform practice in low‐resource settings. No studies for this comparison group fulfilled our inclusion criteria. The World Health Organization addressed the question "Should these plastic wraps/caps be used instead of kangaroo mother care immediately after birth in a subgroup of preterm infants?" (WHO 2015). Evidence presented in Oatley 2016 (no study compared plastic wraps vs kangaroo mother care (KMC)) led WHO to conclude that evidence on the effectiveness of plastic bags/wraps in providing thermal care for preterm newborns immediately at birth was insufficient. However, during stabilisation and transfer of these infants to specialised neonatal wards, wrapping in plastic bags/wraps may be considered an alternative method of preventing hypothermia.
External heat sources
Only one small RCT comparing SSC versus routine care fulfilled the inclusion criteria for this review and showed that SSC was effective in reducing the risk of hypothermia when compared with conventional incubator care for infants with birth weight between 1200 and 2199 grams (Bergman 2004). Conde‐Agudelo 2016, recently conducted a Cochrane Review (literature search end date June 2016) to determine whether evidence is available to support use of KMC in low birth weight infants as an alternative to conventional neonatal care before or after the initial period of stabilisation; similarly only one study evaluated KMC before stabilisation (Worku 2005). We excluded this study from our review because the intervention was not applied immediately at birth, within 10 minutes, in the delivery room, and the mean age of participants at enrolment was approximately 10 hours. The review authors were unable to draw any conclusions regarding the effectiveness of KMC in non‐stabilised low birth weight infants and highlighted the need for rigorous trials to assess the effectiveness of early‐onset continuous KMC for non‐stabilised or relatively stabilised low birth weight infants in low‐income countries. Clearly, studies to date have primarily focussed on healthy term infants or poststabilisation preterm and/or low birth weight infants. Of 86 studies included in a recent systematic review (RCTs and observational studies) documenting initiation time of SSC, only seven (8%) were initiated immediately after birth, and 41 (48%) had stability criteria for initiation (Boundy 2016). A recent prospective cohort of 90 moderately preterm infants of 32 to 34 weeks' gestation in Norway assessed the feasibility and safety of early SSC in the delivery room after vaginal birth compared with immediate transfer to the NICU in a conventional incubator (Kristoffersen 2016). Data show no statistically significant temperature differences between the two groups at 30 minutes after birth. However, this study was at risk of bias owing to differences in measurement sites for temperature (SSC (rectal) and incubator (axillary)), and the study was underpowered. Nevertheless, investigators implemented SSC immediately after birth with no additional resources, and this approach appeared to be both feasible and safe for this group of infants.
Study flow diagram: review update.
Risk of bias summary: review authors' judgements about each risk of bias item for each included study.
Funnel plot of comparison: 1 Plastic wrap or bag versus routine care, outcome: 1.1 Core body temperature (°C) on admission to NICU or up to 2 hours after birth.
Funnel plot of comparison: 1 Plastic wrap or bag versus routine care, outcome: 1.2 Hypothermia on admission to NICU: core body temperature < 36.5°C or skin temperature < 36°C.
Funnel plot of comparison: 1 Plastic wrap or bag versus routine care, outcome: 1.19 Mortality (death within hospital stay or at 6 months' corrected gestation).

Comparison 1 Plastic wrap or bag versus routine care, Outcome 1 Core body temperature (°C) on admission to NICU or up to 2 hours after birth.

Comparison 1 Plastic wrap or bag versus routine care, Outcome 2 Hypothermia on admission to NICU: core body temperature < 36.5°C or skin temperature < 36°C.

Comparison 1 Plastic wrap or bag versus routine care, Outcome 3 Outside normothermic range on admission to NICU or up to 2 hours after birth.
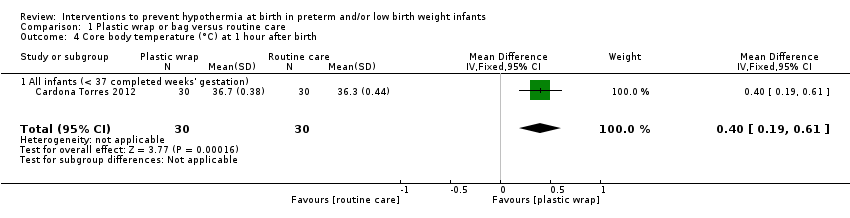
Comparison 1 Plastic wrap or bag versus routine care, Outcome 4 Core body temperature (°C) at 1 hour after birth.

Comparison 1 Plastic wrap or bag versus routine care, Outcome 5 Core body temperature (°C) at 90 minutes after birth.

Comparison 1 Plastic wrap or bag versus routine care, Outcome 6 Core body temperature (°C) at 2 hours after birth.

Comparison 1 Plastic wrap or bag versus routine care, Outcome 7 Core body temperature (°C) post stabilisation.

Comparison 1 Plastic wrap or bag versus routine care, Outcome 8 Hypothermia post stabilisation: core body temperature < 36.5°C or skin temperature < 36°C.

Comparison 1 Plastic wrap or bag versus routine care, Outcome 9 Outside normothermic range post stabilisation.

Comparison 1 Plastic wrap or bag versus routine care, Outcome 10 Core body temperature (°C) 30 minutes after initial NICU admission temperature was taken.
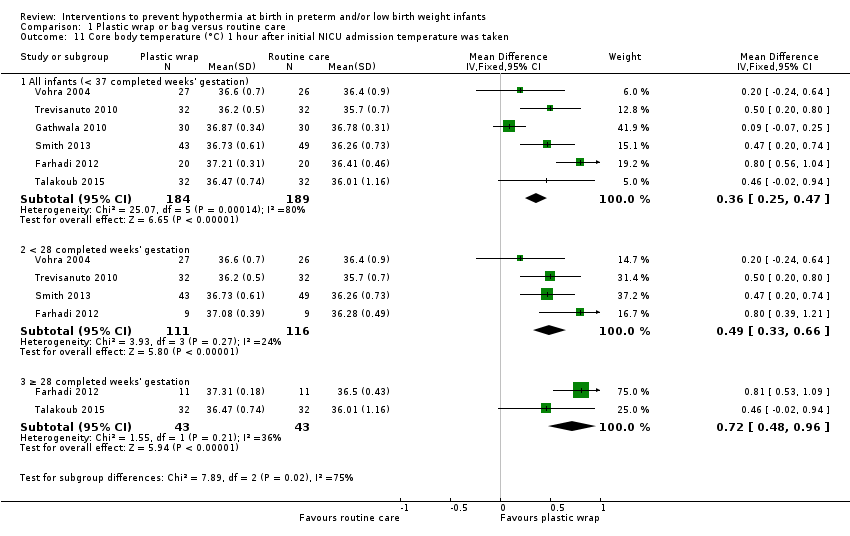
Comparison 1 Plastic wrap or bag versus routine care, Outcome 11 Core body temperature (°C) 1 hour after initial NICU admission temperature was taken.

Comparison 1 Plastic wrap or bag versus routine care, Outcome 12 Core body temperature (°C) 90 minutes after initial NICU admission temperature was taken.

Comparison 1 Plastic wrap or bag versus routine care, Outcome 13 Core body temperature (°C) 2 hours after initial NICU admission temperature was taken.

Comparison 1 Plastic wrap or bag versus routine care, Outcome 14 Hyperthermia on admission to NICU: core body temperature > 37.5°C.
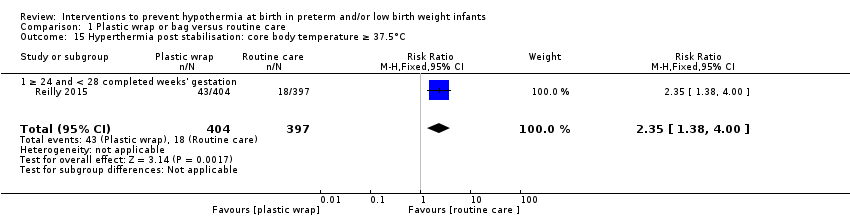
Comparison 1 Plastic wrap or bag versus routine care, Outcome 15 Hyperthermia post stabilisation: core body temperature ≥ 37.5°C.

Comparison 1 Plastic wrap or bag versus routine care, Outcome 16 Major brain injury.

Comparison 1 Plastic wrap or bag versus routine care, Outcome 17 Intraventicular haemorrhage (all grades).
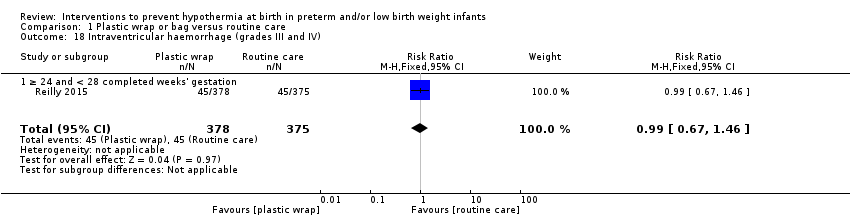
Comparison 1 Plastic wrap or bag versus routine care, Outcome 18 Intraventricular haemorrhage (grades III and IV).

Comparison 1 Plastic wrap or bag versus routine care, Outcome 19 Mortality (death within hospital stay or at 6 months' corrected gestation).

Comparison 1 Plastic wrap or bag versus routine care, Outcome 20 Arterial oxygen saturation (percentage).

Comparison 1 Plastic wrap or bag versus routine care, Outcome 21 Bicarbonate (mmol/L).

Comparison 1 Plastic wrap or bag versus routine care, Outcome 22 Blood gas pH (first).

Comparison 1 Plastic wrap or bag versus routine care, Outcome 23 Blood gas pH < 7.25.

Comparison 1 Plastic wrap or bag versus routine care, Outcome 24 Blood glucose concentration (mmol/L) (first).

Comparison 1 Plastic wrap or bag versus routine care, Outcome 25 Blood glucose < 2.6 mmol/L.

Comparison 1 Plastic wrap or bag versus routine care, Outcome 26 Blood glucose > 6 mmol/L.
| Study | Group | N | Median | Interquartile range | P value |
| All infants (< 37 completed weeks' gestation) | |||||
| Cardona Torres 2012 | Plastic bag without drying | 30 | 5.4 | 3.2 ‐ 8.8 | p > 0.05 |
| Cardona Torres 2012 | Routine care | 30 | 3.6 | 2.7 ‐ 4.4 | |
Comparison 1 Plastic wrap or bag versus routine care, Outcome 27 Blood glucose concentration mmol/L at 120 minutes after birth.
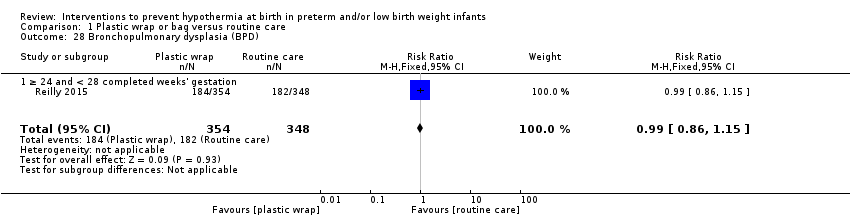
Comparison 1 Plastic wrap or bag versus routine care, Outcome 28 Bronchopulmonary dysplasia (BPD).
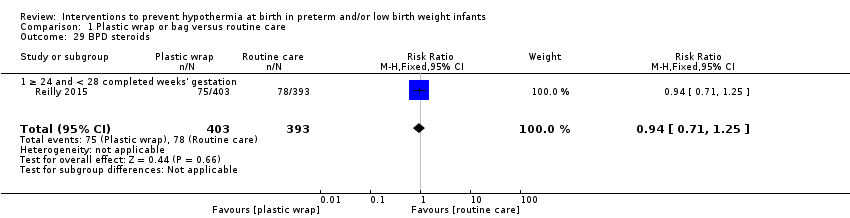
Comparison 1 Plastic wrap or bag versus routine care, Outcome 29 BPD steroids.

Comparison 1 Plastic wrap or bag versus routine care, Outcome 30 Duration of hospitalisation (days).
| Study | Group | N | Median | IQR | P‐value |
| Rohana 2011 | Intervention (polyethylene wrap) | 50 | 37 | 16.0 to 61.5 | 0.29 |
| Rohana 2011 | Control (routine care) | 60 | 30 | 15.2 to 46.0 | |
Comparison 1 Plastic wrap or bag versus routine care, Outcome 31 Duration of hospitalisation (days).
| Study | Group | N | Median | IQR | P‐value |
| Rohana 2011 | Intervention (polyethylene wrap) | 50 | 27.0 | 3.5 to 43.8 | 0.29 |
| Rohana 2011 | Control (routine care) | 60 | 15.0 | 1 to 41.2 | |
Comparison 1 Plastic wrap or bag versus routine care, Outcome 32 Duration of continuous positive airway pressure (CPAP) (days).
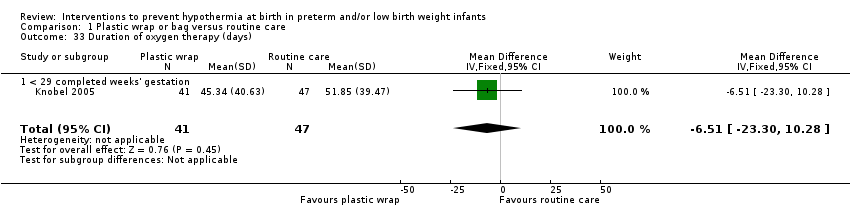
Comparison 1 Plastic wrap or bag versus routine care, Outcome 33 Duration of oxygen therapy (days).
| Study | Group | N | Median | IQR | P‐value |
| Rohana 2011 | Intervention (polyethylene wrap) | 50 | 3.0 | 0 to 3 | 0.30 |
| Rohana 2011 | Control (routine care) | 60 | 2.6 | 0 to 2 | |
Comparison 1 Plastic wrap or bag versus routine care, Outcome 34 Duration of ventilation (days).
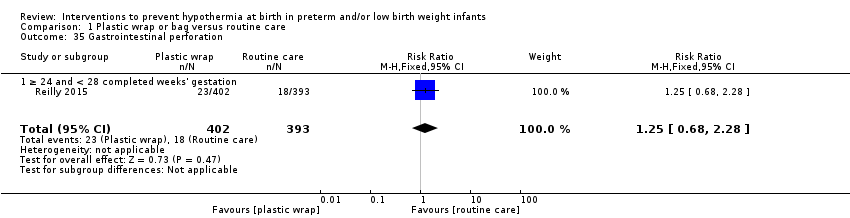
Comparison 1 Plastic wrap or bag versus routine care, Outcome 35 Gastrointestinal perforation.

Comparison 1 Plastic wrap or bag versus routine care, Outcome 36 Intubation in delivery room.
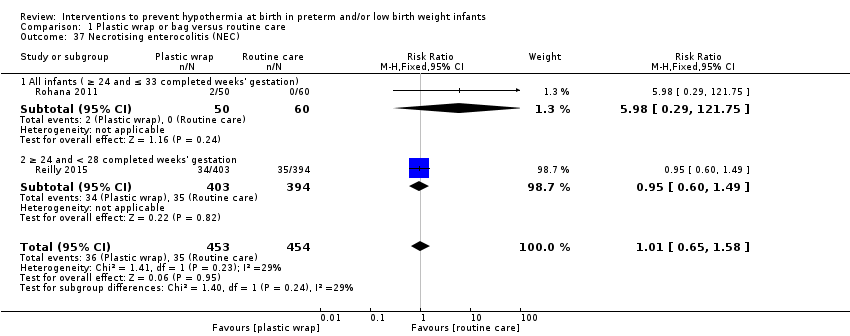
Comparison 1 Plastic wrap or bag versus routine care, Outcome 37 Necrotising enterocolitis (NEC).

Comparison 1 Plastic wrap or bag versus routine care, Outcome 38 Patent ductus arteriosus (PDA).

Comparison 1 Plastic wrap or bag versus routine care, Outcome 39 Pneumothorax.

Comparison 1 Plastic wrap or bag versus routine care, Outcome 40 Pulmonary haemorrhage.

Comparison 1 Plastic wrap or bag versus routine care, Outcome 41 Requirement for bubble continuous positive airway pressure (BCPAP).

Comparison 1 Plastic wrap or bag versus routine care, Outcome 42 Requirement for ventilation.

Comparison 1 Plastic wrap or bag versus routine care, Outcome 43 Respiratory distress syndrome (RDS).

Comparison 1 Plastic wrap or bag versus routine care, Outcome 44 Retinopathy of prematurity (ROP).

Comparison 1 Plastic wrap or bag versus routine care, Outcome 45 Sepsis (late).

Comparison 1 Plastic wrap or bag versus routine care, Outcome 46 Sepsis (early).

Comparison 2 Plastic wrap versus routine care (interhospital neonatal transport), Outcome 1 Core body temperature (°C) on admission to NICU or up to 2 hours after birth.

Comparison 2 Plastic wrap versus routine care (interhospital neonatal transport), Outcome 2 Hypothermia on admission to NICU: core body temperature < 36.5°C or skin temperature < 36°C.

Comparison 2 Plastic wrap versus routine care (interhospital neonatal transport), Outcome 3 Decrease in temperature (axillary °C) from baseline before transport to NICU admission.
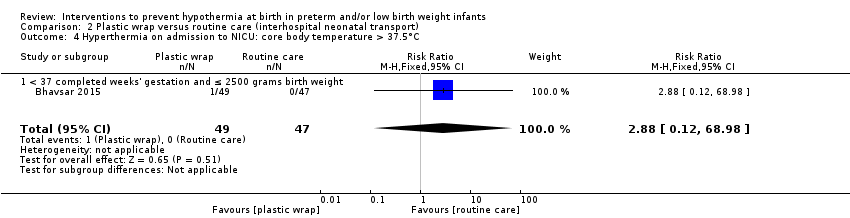
Comparison 2 Plastic wrap versus routine care (interhospital neonatal transport), Outcome 4 Hyperthermia on admission to NICU: core body temperature > 37.5°C.

Comparison 2 Plastic wrap versus routine care (interhospital neonatal transport), Outcome 5 Base excess.
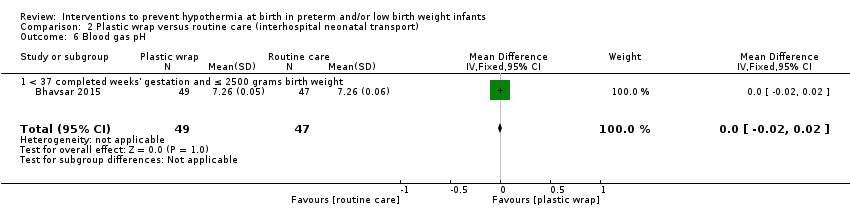
Comparison 2 Plastic wrap versus routine care (interhospital neonatal transport), Outcome 6 Blood gas pH.
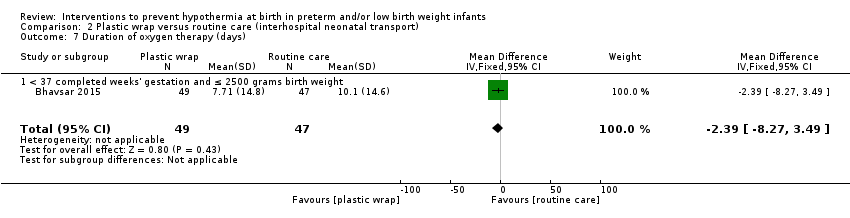
Comparison 2 Plastic wrap versus routine care (interhospital neonatal transport), Outcome 7 Duration of oxygen therapy (days).
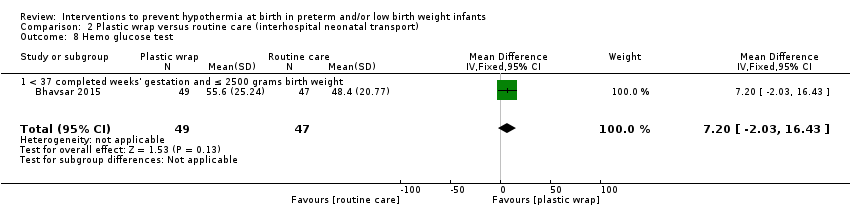
Comparison 2 Plastic wrap versus routine care (interhospital neonatal transport), Outcome 8 Hemo glucose test.

Comparison 2 Plastic wrap versus routine care (interhospital neonatal transport), Outcome 9 Hypoglycaemia (blood glucose level < 40 mg/dL within 2 hours of birth).

Comparison 2 Plastic wrap versus routine care (interhospital neonatal transport), Outcome 10 Severe metabolic acidosis.

Comparison 3 Plastic bag with previous drying versus routine care, Outcome 1 Core body temperature (°C) 30 minutes after birth.
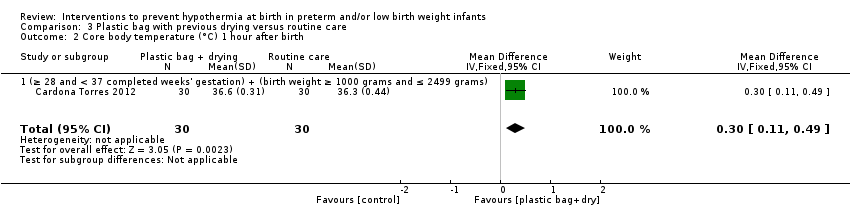
Comparison 3 Plastic bag with previous drying versus routine care, Outcome 2 Core body temperature (°C) 1 hour after birth.

Comparison 3 Plastic bag with previous drying versus routine care, Outcome 3 Core body temperature (°C) 90 minutes after birth.

Comparison 3 Plastic bag with previous drying versus routine care, Outcome 4 Core body temperature (°C) 2 hours after birth.
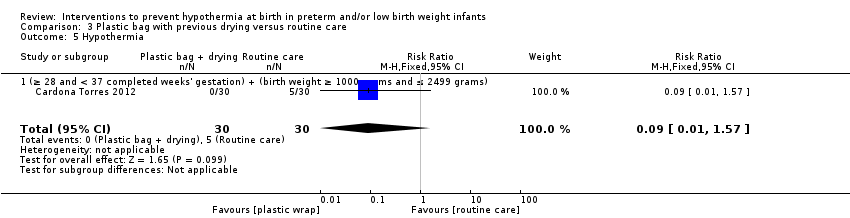
Comparison 3 Plastic bag with previous drying versus routine care, Outcome 5 Hypothermia.
| Study | Group | N | Median | Interquartile range | P value |
| (≥ 28 and < 37 completed weeks' gestation) + (birth weight ≥ 1000 grams and ≤ 2499 grams) | |||||
| Cardona Torres 2012 | Plastic bag with drying | 30 | 3.75 | 2.6 ‐ 5.5 | p > o.o5 |
| Cardona Torres 2012 | Control | 30 | 3.56 | 2.7 ‐ 4.4 | |
Comparison 3 Plastic bag with previous drying versus routine care, Outcome 6 Glucose concentration (mmol/L) at 120 minutes after birth.

Comparison 4 Plastic cap versus routine care (no cap), Outcome 1 Core body temperature (°C) on admission to NICU or up to 2 hours after birth.

Comparison 4 Plastic cap versus routine care (no cap), Outcome 2 Hypothermia on admission to NICU: core body temperature < 36.4°C.

Comparison 4 Plastic cap versus routine care (no cap), Outcome 3 Outside normothermic range on admission to NICU or up to 2 hours after birth.

Comparison 4 Plastic cap versus routine care (no cap), Outcome 4 Core body temperature (°C) 1 hour after initial NICU admission temperature was taken.
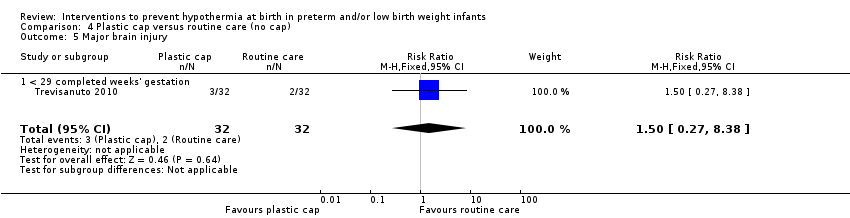
Comparison 4 Plastic cap versus routine care (no cap), Outcome 5 Major brain injury.

Comparison 4 Plastic cap versus routine care (no cap), Outcome 6 Mortality (death within hospital stay).

Comparison 4 Plastic cap versus routine care (no cap), Outcome 7 Bicarbonate (mmol/L).

Comparison 4 Plastic cap versus routine care (no cap), Outcome 8 Blood gas pH (first).

Comparison 4 Plastic cap versus routine care (no cap), Outcome 9 First serum glucose concentration (mmol/L) on admission to NICU.

Comparison 4 Plastic cap versus routine care (no cap), Outcome 10 Intubation at birth.

Comparison 5 Plastic bag and plastic cap versus routine care, Outcome 1 Core body temperature (°C) on admission to NICU or up to 2 hours after birth.
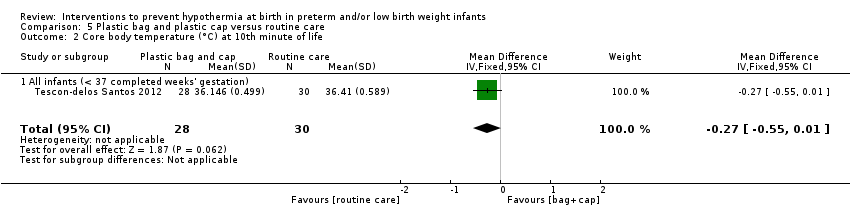
Comparison 5 Plastic bag and plastic cap versus routine care, Outcome 2 Core body temperature (°C) at 10th minute of life.

Comparison 5 Plastic bag and plastic cap versus routine care, Outcome 3 Core body temperature (°C) at 15th minute of life.

Comparison 5 Plastic bag and plastic cap versus routine care, Outcome 4 Core body temperature (°C) at 30th minute of life.

Comparison 5 Plastic bag and plastic cap versus routine care, Outcome 5 Core body temperature (°C) at 1 hour of life.
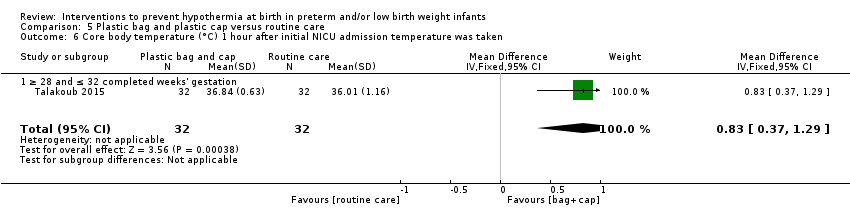
Comparison 5 Plastic bag and plastic cap versus routine care, Outcome 6 Core body temperature (°C) 1 hour after initial NICU admission temperature was taken.

Comparison 5 Plastic bag and plastic cap versus routine care, Outcome 7 Core body temperature (°C) 2 hours after initial NICU admission temperature was taken.

Comparison 5 Plastic bag and plastic cap versus routine care, Outcome 8 Hyperthermia: core body temperature > 37.0°C.

Comparison 5 Plastic bag and plastic cap versus routine care, Outcome 9 Hyponatraemia (serum sodium concentration < 130 mmol/L).

Comparison 5 Plastic bag and plastic cap versus routine care, Outcome 10 Weight (grams) at fifth day of life.

Comparison 6 Plastic bag with previous drying versus plastic bag without previous drying, Outcome 1 Core body temperature (°C) 30 minutes after birth.

Comparison 6 Plastic bag with previous drying versus plastic bag without previous drying, Outcome 2 Core body temperature (°C) 1 hour after birth.

Comparison 6 Plastic bag with previous drying versus plastic bag without previous drying, Outcome 3 Core body temperature (°C) 90 minutes after birth.
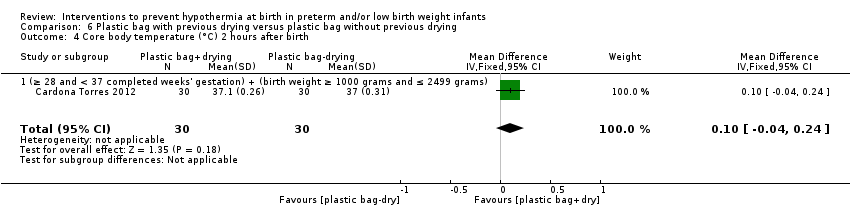
Comparison 6 Plastic bag with previous drying versus plastic bag without previous drying, Outcome 4 Core body temperature (°C) 2 hours after birth.

Comparison 6 Plastic bag with previous drying versus plastic bag without previous drying, Outcome 5 Hyperthermia.
| Study | Group | N | Median | Interquartile range | P value |
| (≥ 28 and < 37 completed weeks' gestation) + (birth weight ≥ 1000 grams and ≤ 2499 grams) | |||||
| Cardona Torres 2012 | Plastic bag with drying | 30 | 3.8 | 2.6 ‐ 5.5 | P > 0.05 |
| Cardona Torres 2012 | Plasic bag without drying | 30 | 5.4 | 3.2 ‐ 8.8 | |
Comparison 6 Plastic bag with previous drying versus plastic bag without previous drying, Outcome 6 Glucose concentration (mmol/L) at 2 hours after birth.

Comparison 7 Plastic cap versus plastic bag, Outcome 1 Core body temperature (°C) on admission to NICU or up to 2 hours after birth.

Comparison 7 Plastic cap versus plastic bag, Outcome 2 Hypothermia on admission to NICU: core body temperature < 36.4°C.

Comparison 7 Plastic cap versus plastic bag, Outcome 3 Outside normothermic range on admission to NICU or up to 2 hours after birth.

Comparison 7 Plastic cap versus plastic bag, Outcome 4 Core body temperature (°C) 1 hour after initial temperature on admission to NICU taken.

Comparison 7 Plastic cap versus plastic bag, Outcome 5 Hyperthermia on admission to NICU: core body temperature > 37.5°C.

Comparison 7 Plastic cap versus plastic bag, Outcome 6 Major brain injury.
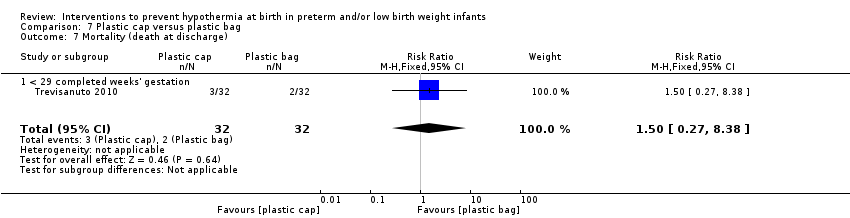
Comparison 7 Plastic cap versus plastic bag, Outcome 7 Mortality (death at discharge).

Comparison 7 Plastic cap versus plastic bag, Outcome 8 Bicarbonate concentration (mmol/L).

Comparison 7 Plastic cap versus plastic bag, Outcome 9 Blood gas pH.

Comparison 7 Plastic cap versus plastic bag, Outcome 10 First serum glucose concentration (mmol/L) on admission to NICU.

Comparison 7 Plastic cap versus plastic bag, Outcome 11 Intubation at birth.

Comparison 8 Plastic bag versus plastic wrap, Outcome 1 Core body temperature (°C) 20 minutes after birth.

Comparison 8 Plastic bag versus plastic wrap, Outcome 2 Core body temperature (°C) 40 minutes after birth.

Comparison 8 Plastic bag versus plastic wrap, Outcome 3 Core body temperature (°C) 1 hour after birth.

Comparison 8 Plastic bag versus plastic wrap, Outcome 4 Decrease in core body temperature (°C) during 1 hour after birth.

Comparison 8 Plastic bag versus plastic wrap, Outcome 5 Hypothermia within 1 hour after birth: core body temperature < 36.5°C or skin temperature < 36°C.

Comparison 8 Plastic bag versus plastic wrap, Outcome 6 Moderate hypothermia within 1 hour after birth: core body temperature 32°C to 35.9°C.
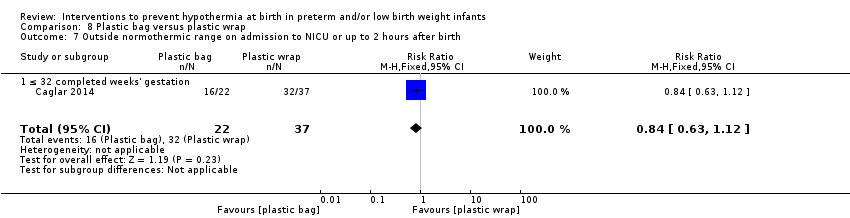
Comparison 8 Plastic bag versus plastic wrap, Outcome 7 Outside normothermic range on admission to NICU or up to 2 hours after birth.

Comparison 9 Plastic total body wrap (body + head) versus plastic body wrap (head uncovered), Outcome 1 Core body temperature (°C) on admission to NICU.

Comparison 9 Plastic total body wrap (body + head) versus plastic body wrap (head uncovered), Outcome 2 Hypothermia on admission to NICU: core body temperature < 36.5°C.

Comparison 9 Plastic total body wrap (body + head) versus plastic body wrap (head uncovered), Outcome 3 Mild hypothermia on admission to NICU: core body temperature 36°C to 36.4°C.

Comparison 9 Plastic total body wrap (body + head) versus plastic body wrap (head uncovered), Outcome 4 Moderate hypothermia on admission to NICU: core body temperature < 32.0°C to 35.9°C.

Comparison 9 Plastic total body wrap (body + head) versus plastic body wrap (head uncovered), Outcome 5 Outside normothermic range on admission to NICU or within 2 hours after birth.

Comparison 9 Plastic total body wrap (body + head) versus plastic body wrap (head uncovered), Outcome 6 Core body temperature (°C) 1 hour after admission to NICU.

Comparison 9 Plastic total body wrap (body + head) versus plastic body wrap (head uncovered), Outcome 7 Hyperthermia on admission to NICU: core body temperature > 37.5°C.

Comparison 9 Plastic total body wrap (body + head) versus plastic body wrap (head uncovered), Outcome 8 Intraventricular haemorrhage.

Comparison 9 Plastic total body wrap (body + head) versus plastic body wrap (head uncovered), Outcome 9 Periventricular leukomalacia.

Comparison 9 Plastic total body wrap (body + head) versus plastic body wrap (head uncovered), Outcome 10 Mortality.

Comparison 9 Plastic total body wrap (body + head) versus plastic body wrap (head uncovered), Outcome 11 Bronchopulmonary dysplasia (BPD).

Comparison 9 Plastic total body wrap (body + head) versus plastic body wrap (head uncovered), Outcome 12 Necrotising enterocolitis.

Comparison 10 Plastic bag and plastic hat versus plastic bag and cotton hat, Outcome 1 Core body temperature (°C) on admission to NICU or up to 2 hours after birth.

Comparison 10 Plastic bag and plastic hat versus plastic bag and cotton hat, Outcome 2 Core body temperature (°C) 1 hour after admission to NICU.
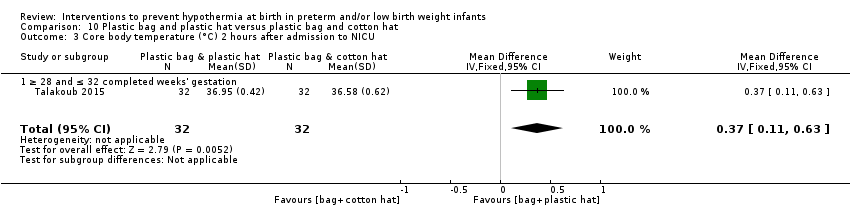
Comparison 10 Plastic bag and plastic hat versus plastic bag and cotton hat, Outcome 3 Core body temperature (°C) 2 hours after admission to NICU.

Comparison 11 Stockinette cap versus routine care (no cap), Outcome 1 Core body temperature (°C) on admission to NICU or up to 2 hours after birth.

Comparison 11 Stockinette cap versus routine care (no cap), Outcome 2 Hypothermia on admission to NICU: core body temperature < 36.5°C or skin temperature < 36°C.
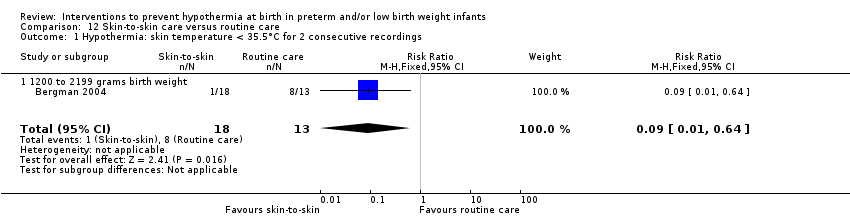
Comparison 12 Skin‐to‐skin care versus routine care, Outcome 1 Hypothermia: skin temperature < 35.5°C for 2 consecutive recordings.
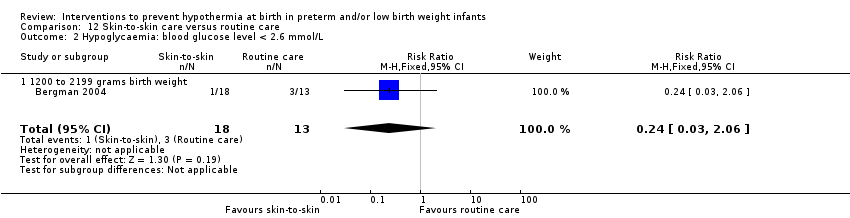
Comparison 12 Skin‐to‐skin care versus routine care, Outcome 2 Hypoglycaemia: blood glucose level < 2.6 mmol/L.

Comparison 13 Thermal mattress versus routine care, Outcome 1 Core body temperature (°C) on admission to NICU or up to 2 hours after birth.
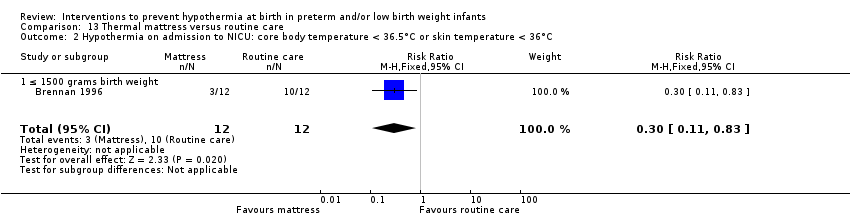
Comparison 13 Thermal mattress versus routine care, Outcome 2 Hypothermia on admission to NICU: core body temperature < 36.5°C or skin temperature < 36°C.

Comparison 13 Thermal mattress versus routine care, Outcome 3 Moderate hypothermia on admission to NICU: core body temperature < 36°C.
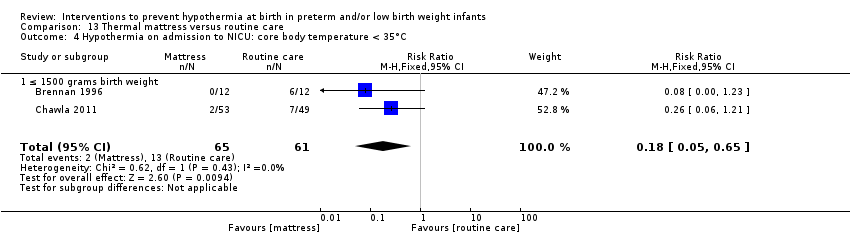
Comparison 13 Thermal mattress versus routine care, Outcome 4 Hypothermia on admission to NICU: core body temperature < 35°C.

Comparison 13 Thermal mattress versus routine care, Outcome 5 Outside normothermic range on admission to NICU or up to 2 hours after birth.

Comparison 13 Thermal mattress versus routine care, Outcome 6 Hyperthermia on admission to NICU: core body temperature > 37.5°C.

Comparison 13 Thermal mattress versus routine care, Outcome 7 Mortality.

Comparison 13 Thermal mattress versus routine care, Outcome 8 Major brain injury ‐ IVH (grade Ⅲ or Ⅳ).

Comparison 13 Thermal mattress versus routine care, Outcome 9 Major brain injury ‐ cystic periventricular leukomalacia.

Comparison 13 Thermal mattress versus routine care, Outcome 10 Bronchopulmonary dysplasia (BPD).
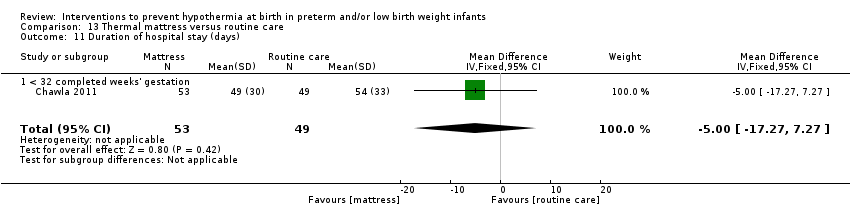
Comparison 13 Thermal mattress versus routine care, Outcome 11 Duration of hospital stay (days).

Comparison 13 Thermal mattress versus routine care, Outcome 12 Duration of ventilation (days).

Comparison 13 Thermal mattress versus routine care, Outcome 13 Duration of oxygen requirements (days).
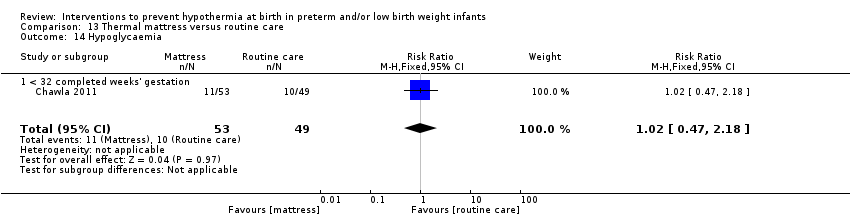
Comparison 13 Thermal mattress versus routine care, Outcome 14 Hypoglycaemia.
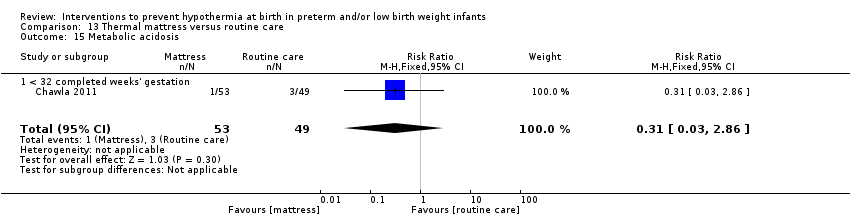
Comparison 13 Thermal mattress versus routine care, Outcome 15 Metabolic acidosis.

Comparison 13 Thermal mattress versus routine care, Outcome 16 Necrotising enterocolitis (NEC).

Comparison 13 Thermal mattress versus routine care, Outcome 17 Sepsis.

Comparison 14 Thermal mattress versus plastic wrap or bag, Outcome 1 Core body temperature (°C) on admission to NICU or up to 2 hours after birth.
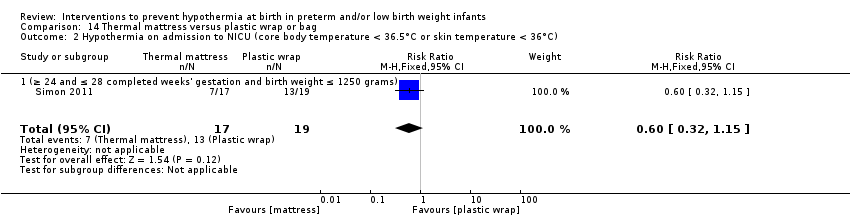
Comparison 14 Thermal mattress versus plastic wrap or bag, Outcome 2 Hypothermia on admission to NICU (core body temperature < 36.5°C or skin temperature < 36°C).

Comparison 14 Thermal mattress versus plastic wrap or bag, Outcome 3 Outside normothermic range on admission to NICU or up to 2 hours after birth.

Comparison 14 Thermal mattress versus plastic wrap or bag, Outcome 4 Hyperthermia on admission to NICU: core body temperature > 37.5°C.
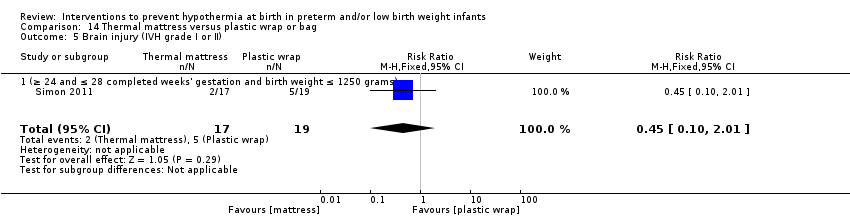
Comparison 14 Thermal mattress versus plastic wrap or bag, Outcome 5 Brain injury (IVH grade Ⅰ or Ⅱ).

Comparison 14 Thermal mattress versus plastic wrap or bag, Outcome 6 Major brain injury (IVH grade Ⅲ or Ⅳ).

Comparison 14 Thermal mattress versus plastic wrap or bag, Outcome 7 Mortality (death before discharge).

Comparison 14 Thermal mattress versus plastic wrap or bag, Outcome 8 Bronchopulmonary dysplasia (BPD).

Comparison 14 Thermal mattress versus plastic wrap or bag, Outcome 9 Hypotension during first 24 hours of life.

Comparison 14 Thermal mattress versus plastic wrap or bag, Outcome 10 Necrotising enterocolitis (NEC).
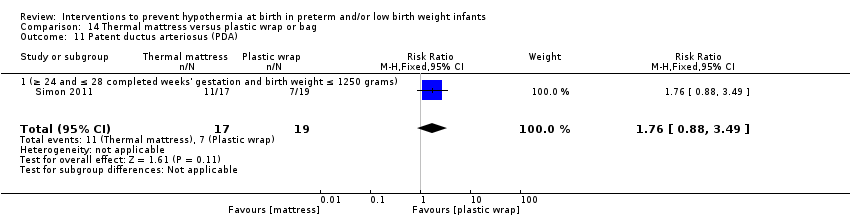
Comparison 14 Thermal mattress versus plastic wrap or bag, Outcome 11 Patent ductus arteriosus (PDA).

Comparison 14 Thermal mattress versus plastic wrap or bag, Outcome 12 PDA ‐ medication only.
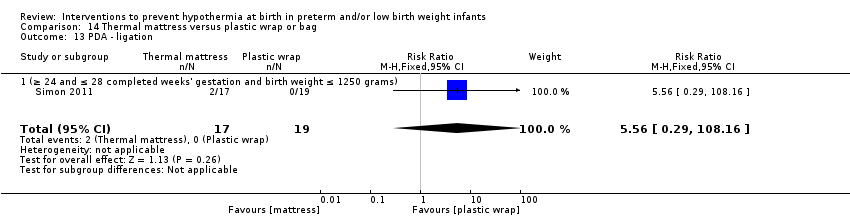
Comparison 14 Thermal mattress versus plastic wrap or bag, Outcome 13 PDA ‐ ligation.
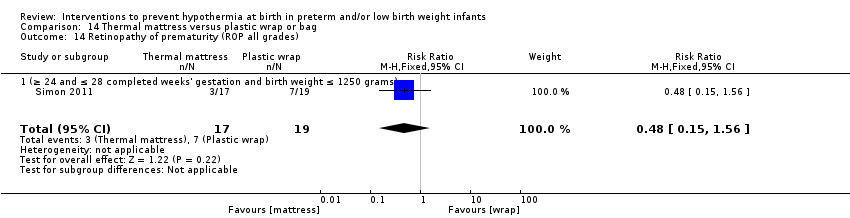
Comparison 14 Thermal mattress versus plastic wrap or bag, Outcome 14 Retinopathy of prematurity (ROP all grades).

Comparison 14 Thermal mattress versus plastic wrap or bag, Outcome 15 Retinopathy of prematurity (ROP laser therapy).

Comparison 14 Thermal mattress versus plastic wrap or bag, Outcome 16 Spontaneous intestinal perforation (SIP).

Comparison 14 Thermal mattress versus plastic wrap or bag, Outcome 17 Worst base deficit in first 24 hours of life.

Comparison 14 Thermal mattress versus plastic wrap or bag, Outcome 18 Worst pH in first 24 hours of life.
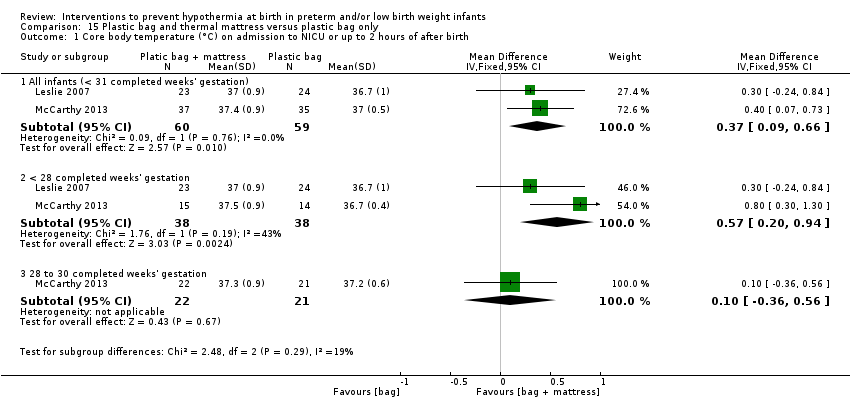
Comparison 15 Plastic bag and thermal mattress versus plastic bag only, Outcome 1 Core body temperature (°C) on admission to NICU or up to 2 hours of after birth.
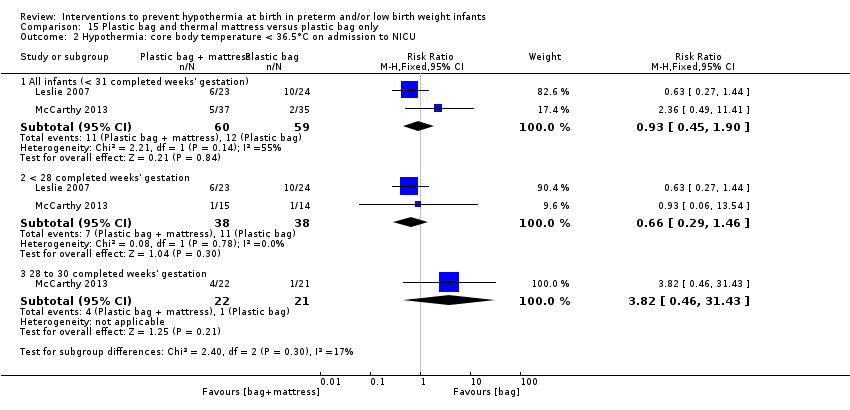
Comparison 15 Plastic bag and thermal mattress versus plastic bag only, Outcome 2 Hypothermia: core body temperature < 36.5°C on admission to NICU.

Comparison 15 Plastic bag and thermal mattress versus plastic bag only, Outcome 3 Outside normothermic range on admission to NICU or up to 2 hours after birth.

Comparison 15 Plastic bag and thermal mattress versus plastic bag only, Outcome 4 Hyperthermia on admission to NICU: core body temperature > 37.5°C.

Comparison 15 Plastic bag and thermal mattress versus plastic bag only, Outcome 5 Major brain injury.

Comparison 15 Plastic bag and thermal mattress versus plastic bag only, Outcome 6 Mortality (death before hospital discharge).
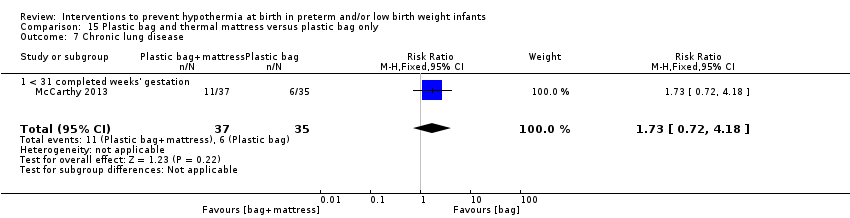
Comparison 15 Plastic bag and thermal mattress versus plastic bag only, Outcome 7 Chronic lung disease.

Comparison 15 Plastic bag and thermal mattress versus plastic bag only, Outcome 8 Coagulation support.

Comparison 15 Plastic bag and thermal mattress versus plastic bag only, Outcome 9 Inotrope use.

Comparison 15 Plastic bag and thermal mattress versus plastic bag only, Outcome 10 Intubated during admission.

Comparison 15 Plastic bag and thermal mattress versus plastic bag only, Outcome 11 ≥ 1 dose surfactant during admission.
| Plastic wrap or bag compared with routine care in preterm and/or low birth weight infants | ||||||
| Patient or population: preterm and/or low birth weight infants | ||||||
| Outcomes | Anticipated absolute effects* (95% CI) | Relative effect | No. of participants | Quality of the evidence | Comments | |
| Risk with routine care | Risk with plastic wrap or bag | |||||
| Core body temperature (°C) on admission to NICU or up to 2 hours after birth | Mean core body temperature (°C) on admission to NICU or up to 2 hours after birth ranged from 34.80 to 36.2. | MD 0.58 higher | ‐ | 1633 | ⊕⊕⊕⊝ | Publication bias was attributed to non‐significant smaller trials. We removed smaller trials with statistical significance, leading to a balanced funnel plot. Conclusions were similar. |
| Hypothermia on admission to NICU: core body temperature < 36.5°C or skin temperature < 36°C | Study population | RR 0.67 | 1417 | ⊕⊕⊕⊝ | Publication bias was attributed to non‐significant smaller trials. We removed smaller trials with statistical significance, leading to a balanced funnel plot. Conclusions were similar. | |
| 738 per 1000 | 495 per 1000 | |||||
| Core body temperature (°C) 1 hour after initial NICU admission temperature was taken | Mean core body temperature (°C) 1 hour after initial NICU admission temperature was taken ranged from 35.70 to 36.78. | MD 0.36 higher | ‐ | 373 | ⊕⊕⊕⊝ | Although heterogeneity was high for subgroup differences, overall effect remained highly significant. |
| Hyperthermia on admission to NICU: core body temperature > 37.5°C | Study population | RR 3.91 | 1523 | ⊕⊕⊕⊝ | ||
| 12 per 1000 | 46 per 1000 | |||||
| Major brain injury (within hospital stay) | Study population | RR 0.78 | 1100 | ⊕⊕⊕⊝ | ||
| 62 per 1000 | 49 per 1000 | |||||
| Pulmonary haemorrhage (within hospital stay) | Study population | RR 0.60 | 796 | ⊕⊕⊕⊝ | ||
| 112 per 1000 | 67 per 1000 | |||||
| Mortality (death within hospital stay or at 6 months' corrected gestation) | Study population | RR 0.91 | 1447 | ⊕⊕⊕⊝ | Publication bias was unlikely to have affected findings of the meta‐analysis. | |
| 168 per 1000 | 153 per 1000 | |||||
| *The risk in the intervention group (and its 95% confidence interval) is based on the assumed risk in the comparison group and the relative effect of the intervention (and its 95% CI). | ||||||
| GRADE Working Group grades of evidence. | ||||||
| aNot downgraded for risk of bias owing to lack of blinding of outcome assessors. We examined one study that had taken measurements over time. The differential between wrap and routine care groups appeared to increase with time, which is not what would be expected if the difference was due to knowledge of assignment groups. bNot downgraded for inconsistency because on removal of smaller studies, the remainder were characteristically very consistent and the effect size remained largely unchanged. cDowngraded one level for publication bias. dDowngraded one level for inconsistency (considerable differences in effect size across studies). eDowngraded one level for imprecision (conclusions were based on 50 incidences of hyperthermia in total ‐ these were sufficient to show significance but with wide 95% CIs). fDowngraded one level for imprecision (numbers of incidences were below OIS guidance). gDowngraded one level for imprecision (evidence came from only one study). hNot downgraded for imprecision (numbers were below OIS guidance, but 95% CIs for RR just attained ± 25% of best estimate). | ||||||
| Outcome or subgroup title | No. of studies | No. of participants | Statistical method | Effect size |
| 1 Core body temperature (°C) on admission to NICU or up to 2 hours after birth Show forest plot | 13 | Mean Difference (IV, Fixed, 95% CI) | Subtotals only | |
| 1.1 All infants (< 37 completed weeks' gestation) | 13 | 1633 | Mean Difference (IV, Fixed, 95% CI) | 0.58 [0.50, 0.66] |
| 1.2 < 28 completed weeks' gestation | 8 | 1171 | Mean Difference (IV, Fixed, 95% CI) | 0.65 [0.52, 0.79] |
| 1.3 ≥ 28 completed weeks' gestation | 4 | 200 | Mean Difference (IV, Fixed, 95% CI) | 0.56 [0.34, 0.78] |
| 2 Hypothermia on admission to NICU: core body temperature < 36.5°C or skin temperature < 36°C Show forest plot | 10 | Risk Ratio (M‐H, Fixed, 95% CI) | Subtotals only | |
| 2.1 All infants (< 37 completed weeks' gestation) | 10 | 1417 | Risk Ratio (M‐H, Fixed, 95% CI) | 0.67 [0.62, 0.72] |
| 2.2 < 28 completed weeks' gestation | 6 | 1029 | Risk Ratio (M‐H, Fixed, 95% CI) | 0.70 [0.65, 0.77] |
| 2.3 ≥ 28 completed weeks' gestation | 2 | 55 | Risk Ratio (M‐H, Fixed, 95% CI) | 0.17 [0.07, 0.43] |
| 3 Outside normothermic range on admission to NICU or up to 2 hours after birth Show forest plot | 5 | Risk Ratio (M‐H, Fixed, 95% CI) | Subtotals only | |
| 3.1 All infants (< 37 completed weeks' gestation) | 5 | 1048 | Risk Ratio (M‐H, Fixed, 95% CI) | 0.75 [0.69, 0.81] |
| 3.2 < 28 completed weeks' gestation | 3 | 871 | Risk Ratio (M‐H, Fixed, 95% CI) | 0.81 [0.75, 0.88] |
| 3.3 ≥ 28 completed weeks' gestation | 1 | 33 | Risk Ratio (M‐H, Fixed, 95% CI) | 0.14 [0.04, 0.52] |
| 4 Core body temperature (°C) at 1 hour after birth Show forest plot | 1 | 60 | Mean Difference (IV, Fixed, 95% CI) | 0.40 [0.19, 0.61] |
| 4.1 All infants (< 37 completed weeks' gestation) | 1 | 60 | Mean Difference (IV, Fixed, 95% CI) | 0.40 [0.19, 0.61] |
| 5 Core body temperature (°C) at 90 minutes after birth Show forest plot | 1 | 60 | Mean Difference (IV, Fixed, 95% CI) | 0.40 [0.18, 0.62] |
| 5.1 All infants (< 37 completed weeks' gestation) | 1 | 60 | Mean Difference (IV, Fixed, 95% CI) | 0.40 [0.18, 0.62] |
| 6 Core body temperature (°C) at 2 hours after birth Show forest plot | 1 | 60 | Mean Difference (IV, Fixed, 95% CI) | 0.30 [0.13, 0.47] |
| 6.1 All infants (< 37 completed weeks' gestation) | 1 | 60 | Mean Difference (IV, Fixed, 95% CI) | 0.30 [0.13, 0.47] |
| 7 Core body temperature (°C) post stabilisation Show forest plot | 2 | Mean Difference (IV, Fixed, 95% CI) | Subtotals only | |
| 7.1 All infants (< 37 completed weeks' gestation) | 2 | 911 | Mean Difference (IV, Fixed, 95% CI) | 0.43 [0.22, 0.64] |
| 7.2 < 28 completed weeks' gestation | 2 | 838 | Mean Difference (IV, Fixed, 95% CI) | 0.44 [0.20, 0.67] |
| 7.3 ≥ 28 completed weeks' gestation | 1 | 73 | Mean Difference (IV, Fixed, 95% CI) | 0.40 [‐0.00, 0.80] |
| 8 Hypothermia post stabilisation: core body temperature < 36.5°C or skin temperature < 36°C Show forest plot | 2 | 841 | Risk Ratio (M‐H, Fixed, 95% CI) | 0.76 [0.65, 0.88] |
| 8.1 All infants (≤ 32 completed weeks' gestation) | 1 | 40 | Risk Ratio (M‐H, Fixed, 95% CI) | 0.05 [0.00, 0.76] |
| 8.2 < 28 completed weeks' gestation | 1 | 801 | Risk Ratio (M‐H, Fixed, 95% CI) | 0.79 [0.69, 0.92] |
| 9 Outside normothermic range post stabilisation Show forest plot | 2 | 841 | Risk Ratio (M‐H, Fixed, 95% CI) | 0.88 [0.78, 1.00] |
| 9.1 All infants (≤ 32 completed weeks' gestation) | 1 | 40 | Risk Ratio (M‐H, Fixed, 95% CI) | 0.1 [0.01, 0.71] |
| 9.2 < 28 completed weeks' gestation | 1 | 801 | Risk Ratio (M‐H, Fixed, 95% CI) | 0.92 [0.81, 1.04] |
| 10 Core body temperature (°C) 30 minutes after initial NICU admission temperature was taken Show forest plot | 1 | 92 | Mean Difference (IV, Fixed, 95% CI) | 0.57 [0.27, 0.87] |
| 10.1 ≤ 29 completed weeks' gestation | 1 | 92 | Mean Difference (IV, Fixed, 95% CI) | 0.57 [0.27, 0.87] |
| 11 Core body temperature (°C) 1 hour after initial NICU admission temperature was taken Show forest plot | 6 | Mean Difference (IV, Fixed, 95% CI) | Subtotals only | |
| 11.1 All infants (< 37 completed weeks' gestation) | 6 | 373 | Mean Difference (IV, Fixed, 95% CI) | 0.36 [0.25, 0.47] |
| 11.2 < 28 completed weeks' gestation | 4 | 227 | Mean Difference (IV, Fixed, 95% CI) | 0.49 [0.33, 0.66] |
| 11.3 ≥ 28 completed weeks' gestation | 2 | 86 | Mean Difference (IV, Fixed, 95% CI) | 0.72 [0.48, 0.96] |
| 12 Core body temperature (°C) 90 minutes after initial NICU admission temperature was taken Show forest plot | 1 | 92 | Mean Difference (IV, Fixed, 95% CI) | 0.56 [0.27, 0.85] |
| 12.1 ≤ 29 completed weeks' gestation | 1 | 92 | Mean Difference (IV, Fixed, 95% CI) | 0.56 [0.27, 0.85] |
| 13 Core body temperature (°C) 2 hours after initial NICU admission temperature was taken Show forest plot | 2 | 156 | Mean Difference (IV, Fixed, 95% CI) | 0.37 [0.16, 0.59] |
| 13.1 < 28 completed weeks' gestation | 1 | 92 | Mean Difference (IV, Fixed, 95% CI) | 0.28 [0.04, 0.52] |
| 13.2 ≥ 28 completed weeks' gestation | 1 | 64 | Mean Difference (IV, Fixed, 95% CI) | 0.74 [0.26, 1.22] |
| 14 Hyperthermia on admission to NICU: core body temperature > 37.5°C Show forest plot | 12 | Risk Ratio (M‐H, Fixed, 95% CI) | Subtotals only | |
| 14.1 All infants (< 37 completed weeks' gestation) | 12 | 1523 | Risk Ratio (M‐H, Fixed, 95% CI) | 3.91 [2.05, 7.44] |
| 14.2 < 28 completed weeks' gestation | 7 | 1121 | Risk Ratio (M‐H, Fixed, 95% CI) | 4.00 [2.04, 7.83] |
| 14.3 ≥ 28 completed weeks' gestation | 3 | 138 | Risk Ratio (M‐H, Fixed, 95% CI) | 0.0 [0.0, 0.0] |
| 15 Hyperthermia post stabilisation: core body temperature ≥ 37.5°C Show forest plot | 1 | 801 | Risk Ratio (M‐H, Fixed, 95% CI) | 2.35 [1.38, 4.00] |
| 15.1 ≥ 24 and < 28 completed weeks' gestation | 1 | 801 | Risk Ratio (M‐H, Fixed, 95% CI) | 2.35 [1.38, 4.00] |
| 16 Major brain injury Show forest plot | 5 | 1100 | Risk Ratio (M‐H, Fixed, 95% CI) | 0.78 [0.47, 1.27] |
| 16.1 All infants (≤ 33 completed weeks' gestation) | 1 | 110 | Risk Ratio (M‐H, Fixed, 95% CI) | 0.3 [0.03, 2.60] |
| 16.2 < 28 completed weeks' gestation | 4 | 990 | Risk Ratio (M‐H, Fixed, 95% CI) | 0.83 [0.50, 1.39] |
| 17 Intraventicular haemorrhage (all grades) Show forest plot | 3 | 880 | Risk Ratio (M‐H, Fixed, 95% CI) | 0.92 [0.77, 1.09] |
| 17.1 < 28 completed weeks' gestation | 3 | 880 | Risk Ratio (M‐H, Fixed, 95% CI) | 0.92 [0.77, 1.09] |
| 18 Intraventricular haemorrhage (grades III and IV) Show forest plot | 1 | 753 | Risk Ratio (M‐H, Fixed, 95% CI) | 0.99 [0.67, 1.46] |
| 18.1 ≥ 24 and < 28 completed weeks' gestation | 1 | 753 | Risk Ratio (M‐H, Fixed, 95% CI) | 0.99 [0.67, 1.46] |
| 19 Mortality (death within hospital stay or at 6 months' corrected gestation) Show forest plot | 10 | Risk Ratio (M‐H, Fixed, 95% CI) | Subtotals only | |
| 19.1 All infants (< 37 weeks' gestation) | 10 | 1447 | Risk Ratio (M‐H, Fixed, 95% CI) | 0.91 [0.73, 1.15] |
| 19.2 < 28 completed weeks' gestation | 6 | 1114 | Risk Ratio (M‐H, Fixed, 95% CI) | 0.92 [0.72, 1.18] |
| 19.3 ≥ 28 completed weeks' gestation | 1 | 41 | Risk Ratio (M‐H, Fixed, 95% CI) | 0.0 [0.0, 0.0] |
| 20 Arterial oxygen saturation (percentage) Show forest plot | 1 | 40 | Mean Difference (IV, Fixed, 95% CI) | ‐4.10 [‐14.00, 7.80] |
| 20.1 ≤ 32 completed weeks' gestation | 1 | 40 | Mean Difference (IV, Fixed, 95% CI) | ‐4.10 [‐14.00, 7.80] |
| 21 Bicarbonate (mmol/L) Show forest plot | 2 | 117 | Mean Difference (IV, Fixed, 95% CI) | 0.31 [‐0.72, 1.35] |
| 21.1 < 28 completed weeks' gestation | 2 | 117 | Mean Difference (IV, Fixed, 95% CI) | 0.31 [‐0.72, 1.35] |
| 22 Blood gas pH (first) Show forest plot | 2 | 117 | Mean Difference (IV, Fixed, 95% CI) | 0.01 [‐0.02, 0.04] |
| 22.1 < 28 completed weeks' gestation | 2 | 117 | Mean Difference (IV, Fixed, 95% CI) | 0.01 [‐0.02, 0.04] |
| 23 Blood gas pH < 7.25 Show forest plot | 1 | 84 | Risk Ratio (M‐H, Fixed, 95% CI) | 0.81 [0.55, 1.20] |
| 23.1 ≤ 29 completed weeks' gestation | 1 | 84 | Risk Ratio (M‐H, Fixed, 95% CI) | 0.81 [0.55, 1.20] |
| 24 Blood glucose concentration (mmol/L) (first) Show forest plot | 4 | 195 | Mean Difference (IV, Fixed, 95% CI) | ‐0.14 [‐0.50, 0.21] |
| 24.1 All infants (≤ 32 completed weeks' gestation) | 2 | 78 | Mean Difference (IV, Fixed, 95% CI) | ‐0.62 [‐1.37, 0.12] |
| 24.2 < 28 completed weeks' gestation | 2 | 117 | Mean Difference (IV, Fixed, 95% CI) | ‐0.00 [‐0.41, 0.41] |
| 25 Blood glucose < 2.6 mmol/L Show forest plot | 1 | 85 | Risk Ratio (M‐H, Fixed, 95% CI) | 0.66 [0.31, 1.43] |
| 25.1 ≤ 29 completed weeks' gestation | 1 | 85 | Risk Ratio (M‐H, Fixed, 95% CI) | 0.66 [0.31, 1.43] |
| 26 Blood glucose > 6 mmol/L Show forest plot | 1 | 85 | Risk Ratio (M‐H, Fixed, 95% CI) | 1.07 [0.23, 5.02] |
| 26.1 ≤ 29 completed weeks' gestation | 1 | 85 | Risk Ratio (M‐H, Fixed, 95% CI) | 1.07 [0.23, 5.02] |
| 27 Blood glucose concentration mmol/L at 120 minutes after birth Show forest plot | Other data | No numeric data | ||
| 27.1 All infants (< 37 completed weeks' gestation) | Other data | No numeric data | ||
| 28 Bronchopulmonary dysplasia (BPD) Show forest plot | 1 | 702 | Risk Ratio (M‐H, Fixed, 95% CI) | 0.99 [0.86, 1.15] |
| 28.1 ≥ 24 and < 28 completed weeks' gestation | 1 | 702 | Risk Ratio (M‐H, Fixed, 95% CI) | 0.99 [0.86, 1.15] |
| 29 BPD steroids Show forest plot | 1 | 796 | Risk Ratio (M‐H, Fixed, 95% CI) | 0.94 [0.71, 1.25] |
| 29.1 ≥ 24 and < 28 completed weeks' gestation | 1 | 796 | Risk Ratio (M‐H, Fixed, 95% CI) | 0.94 [0.71, 1.25] |
| 30 Duration of hospitalisation (days) Show forest plot | 2 | 126 | Mean Difference (IV, Fixed, 95% CI) | ‐6.35 [‐17.27, 4.56] |
| 30.1 All infants (≤ 32 completed weeks' gestation) | 1 | 38 | Mean Difference (IV, Fixed, 95% CI) | ‐7.50 [‐24.17, 9.17] |
| 30.2 < 28 completed weeks' gestation | 1 | 88 | Mean Difference (IV, Fixed, 95% CI) | ‐5.49 [‐19.93, 8.95] |
| 31 Duration of hospitalisation (days) Show forest plot | Other data | No numeric data | ||
| 32 Duration of continuous positive airway pressure (CPAP) (days) Show forest plot | Other data | No numeric data | ||
| 33 Duration of oxygen therapy (days) Show forest plot | 1 | 88 | Mean Difference (IV, Fixed, 95% CI) | ‐6.51 [‐23.30, 10.28] |
| 33.1 < 29 completed weeks' gestation | 1 | 88 | Mean Difference (IV, Fixed, 95% CI) | ‐6.51 [‐23.30, 10.28] |
| 34 Duration of ventilation (days) Show forest plot | Other data | No numeric data | ||
| 35 Gastrointestinal perforation Show forest plot | 1 | 795 | Risk Ratio (M‐H, Fixed, 95% CI) | 1.25 [0.68, 2.28] |
| 35.1 ≥ 24 and < 28 completed weeks' gestation | 1 | 795 | Risk Ratio (M‐H, Fixed, 95% CI) | 1.25 [0.68, 2.28] |
| 36 Intubation in delivery room Show forest plot | 1 | 64 | Risk Ratio (M‐H, Fixed, 95% CI) | 1.0 [0.63, 1.58] |
| 36.1 < 29 completed weeks' gestation | 1 | 64 | Risk Ratio (M‐H, Fixed, 95% CI) | 1.0 [0.63, 1.58] |
| 37 Necrotising enterocolitis (NEC) Show forest plot | 2 | 907 | Risk Ratio (M‐H, Fixed, 95% CI) | 1.01 [0.65, 1.58] |
| 37.1 All infants ( ≥ 24 and ≤ 33 completed weeks' gestation) | 1 | 110 | Risk Ratio (M‐H, Fixed, 95% CI) | 5.98 [0.29, 121.75] |
| 37.2 ≥ 24 and < 28 completed weeks' gestation | 1 | 797 | Risk Ratio (M‐H, Fixed, 95% CI) | 0.95 [0.60, 1.49] |
| 38 Patent ductus arteriosus (PDA) Show forest plot | 2 | 905 | Risk Ratio (M‐H, Fixed, 95% CI) | 0.90 [0.78, 1.03] |
| 38.1 All infants (≥ 24 and ≤ 33 completed weeks' gestation) | 1 | 110 | Risk Ratio (M‐H, Fixed, 95% CI) | 0.8 [0.39, 1.62] |
| 38.2 ≥ 24 and < 28 completed weeks' gestation | 1 | 795 | Risk Ratio (M‐H, Fixed, 95% CI) | 0.90 [0.79, 1.04] |
| 39 Pneumothorax Show forest plot | 1 | 796 | Risk Ratio (M‐H, Fixed, 95% CI) | 0.98 [0.56, 1.69] |
| 39.1 ≥ 24 and < 28 completed weeks' gestation | 1 | 796 | Risk Ratio (M‐H, Fixed, 95% CI) | 0.98 [0.56, 1.69] |
| 40 Pulmonary haemorrhage Show forest plot | 1 | 796 | Risk Ratio (M‐H, Fixed, 95% CI) | 0.60 [0.38, 0.95] |
| 40.1 ≥ 24 and < 28 completed weeks' gestation | 1 | 796 | Risk Ratio (M‐H, Fixed, 95% CI) | 0.60 [0.38, 0.95] |
| 41 Requirement for bubble continuous positive airway pressure (BCPAP) Show forest plot | 1 | 92 | Risk Ratio (M‐H, Fixed, 95% CI) | 0.97 [0.81, 1.18] |
| 41.1 ≤ 29 completed weeks' gestation | 1 | 92 | Risk Ratio (M‐H, Fixed, 95% CI) | 0.97 [0.81, 1.18] |
| 42 Requirement for ventilation Show forest plot | 1 | 92 | Risk Ratio (M‐H, Fixed, 95% CI) | 0.92 [0.70, 1.20] |
| 42.1 ≤ 29 completed weeks' gestation | 1 | 92 | Risk Ratio (M‐H, Fixed, 95% CI) | 0.92 [0.70, 1.20] |
| 43 Respiratory distress syndrome (RDS) Show forest plot | 2 | 910 | Risk Ratio (M‐H, Fixed, 95% CI) | 1.01 [0.97, 1.06] |
| 43.1 All infants (≥ 24 and ≤ 33 completed weeks' gestation) | 1 | 110 | Risk Ratio (M‐H, Fixed, 95% CI) | 1.04 [0.78, 1.38] |
| 43.2 ≥ 24 and < 28 completed weeks' gestation | 1 | 800 | Risk Ratio (M‐H, Fixed, 95% CI) | 1.01 [0.97, 1.05] |
| 44 Retinopathy of prematurity (ROP) Show forest plot | 1 | 606 | Risk Ratio (M‐H, Fixed, 95% CI) | 1.00 [0.72, 1.40] |
| 44.1 ≥ 24 and < 28 completed weeks' gestation | 1 | 606 | Risk Ratio (M‐H, Fixed, 95% CI) | 1.00 [0.72, 1.40] |
| 45 Sepsis (late) Show forest plot | 2 | 830 | Risk Ratio (M‐H, Fixed, 95% CI) | 0.88 [0.70, 1.10] |
| 45.1 ≤ 29 completed weeks' gestation | 2 | 830 | Risk Ratio (M‐H, Fixed, 95% CI) | 0.88 [0.70, 1.10] |
| 46 Sepsis (early) Show forest plot | 2 | 883 | Risk Ratio (M‐H, Fixed, 95% CI) | 0.69 [0.38, 1.29] |
| 46.1 ≤ 29 completed weeks' gestation | 2 | 883 | Risk Ratio (M‐H, Fixed, 95% CI) | 0.69 [0.38, 1.29] |
| Outcome or subgroup title | No. of studies | No. of participants | Statistical method | Effect size |
| 1 Core body temperature (°C) on admission to NICU or up to 2 hours after birth Show forest plot | 1 | 96 | Mean Difference (IV, Fixed, 95% CI) | 0.70 [0.32, 1.08] |
| 1.1 < 37 completed weeks' gestation and ≤ 2500 grams birth weight | 1 | 96 | Mean Difference (IV, Fixed, 95% CI) | 0.70 [0.32, 1.08] |
| 2 Hypothermia on admission to NICU: core body temperature < 36.5°C or skin temperature < 36°C Show forest plot | 1 | 96 | Risk Ratio (M‐H, Fixed, 95% CI) | 0.48 [0.27, 0.84] |
| 2.1 < 37 completed weeks' gestation and ≤ 2500 grams birth weight | 1 | 96 | Risk Ratio (M‐H, Fixed, 95% CI) | 0.48 [0.27, 0.84] |
| 3 Decrease in temperature (axillary °C) from baseline before transport to NICU admission Show forest plot | 1 | 96 | Mean Difference (IV, Fixed, 95% CI) | ‐0.40 [‐0.61, ‐0.19] |
| 3.1 < 37 completed weeks' gestation and ≤ 2500 grams birth weight | 1 | 96 | Mean Difference (IV, Fixed, 95% CI) | ‐0.40 [‐0.61, ‐0.19] |
| 4 Hyperthermia on admission to NICU: core body temperature > 37.5°C Show forest plot | 1 | 96 | Risk Ratio (M‐H, Fixed, 95% CI) | 2.88 [0.12, 68.98] |
| 4.1 < 37 completed weeks' gestation and ≤ 2500 grams birth weight | 1 | 96 | Risk Ratio (M‐H, Fixed, 95% CI) | 2.88 [0.12, 68.98] |
| 5 Base excess Show forest plot | 1 | 96 | Mean Difference (IV, Fixed, 95% CI) | 0.60 [‐0.49, 1.69] |
| 5.1 < 37 completed weeks' gestation and ≤ 2500 grams birth weight | 1 | 96 | Mean Difference (IV, Fixed, 95% CI) | 0.60 [‐0.49, 1.69] |
| 6 Blood gas pH Show forest plot | 1 | 96 | Mean Difference (IV, Fixed, 95% CI) | 0.0 [‐0.02, 0.02] |
| 6.1 < 37 completed weeks' gestation and ≤ 2500 grams birth weight | 1 | 96 | Mean Difference (IV, Fixed, 95% CI) | 0.0 [‐0.02, 0.02] |
| 7 Duration of oxygen therapy (days) Show forest plot | 1 | 96 | Mean Difference (IV, Fixed, 95% CI) | ‐2.39 [‐8.27, 3.49] |
| 7.1 < 37 completed weeks' gestation and ≤ 2500 grams birth weight | 1 | 96 | Mean Difference (IV, Fixed, 95% CI) | ‐2.39 [‐8.27, 3.49] |
| 8 Hemo glucose test Show forest plot | 1 | 96 | Mean Difference (IV, Fixed, 95% CI) | 7.20 [‐2.03, 16.43] |
| 8.1 < 37 completed weeks' gestation and ≤ 2500 grams birth weight | 1 | 96 | Mean Difference (IV, Fixed, 95% CI) | 7.20 [‐2.03, 16.43] |
| 9 Hypoglycaemia (blood glucose level < 40 mg/dL within 2 hours of birth) Show forest plot | 1 | 96 | Risk Ratio (M‐H, Fixed, 95% CI) | 0.55 [0.31, 0.98] |
| 9.1 < 37 completed weeks' gestation and ≤ 2500 grams birth weight | 1 | 96 | Risk Ratio (M‐H, Fixed, 95% CI) | 0.55 [0.31, 0.98] |
| 10 Severe metabolic acidosis Show forest plot | 1 | 96 | Risk Ratio (M‐H, Fixed, 95% CI) | 1.15 [0.38, 3.52] |
| 10.1 < 37 completed weeks' gestation and ≤ 2500 grams birth weight | 1 | 96 | Risk Ratio (M‐H, Fixed, 95% CI) | 1.15 [0.38, 3.52] |
| Outcome or subgroup title | No. of studies | No. of participants | Statistical method | Effect size |
| 1 Core body temperature (°C) 30 minutes after birth Show forest plot | 1 | 60 | Mean Difference (IV, Fixed, 95% CI) | 0.30 [0.12, 0.48] |
| 1.1 (≥ 28 and < 37 completed weeks' gestation) + (birth weight ≥ 1000 grams and ≤ 2499 grams) | 1 | 60 | Mean Difference (IV, Fixed, 95% CI) | 0.30 [0.12, 0.48] |
| 2 Core body temperature (°C) 1 hour after birth Show forest plot | 1 | 60 | Mean Difference (IV, Fixed, 95% CI) | 0.30 [0.11, 0.49] |
| 2.1 (≥ 28 and < 37 completed weeks' gestation) + (birth weight ≥ 1000 grams and ≤ 2499 grams) | 1 | 60 | Mean Difference (IV, Fixed, 95% CI) | 0.30 [0.11, 0.49] |
| 3 Core body temperature (°C) 90 minutes after birth Show forest plot | 1 | 60 | Mean Difference (IV, Fixed, 95% CI) | 0.30 [0.12, 0.48] |
| 3.1 (≥ 28 and < 37 completed weeks' gestation) + (birth weight ≥ 1000 grams and ≤ 2499 grams) | 1 | 60 | Mean Difference (IV, Fixed, 95% CI) | 0.30 [0.12, 0.48] |
| 4 Core body temperature (°C) 2 hours after birth Show forest plot | 1 | 60 | Mean Difference (IV, Fixed, 95% CI) | 0.40 [0.24, 0.56] |
| 4.1 (≥ 28 and < 37 completed weeks' gestation) + (birth weight ≥ 1000 grams and ≤ 2499 grams) | 1 | 60 | Mean Difference (IV, Fixed, 95% CI) | 0.40 [0.24, 0.56] |
| 5 Hypothermia Show forest plot | 1 | 60 | Risk Ratio (M‐H, Fixed, 95% CI) | 0.09 [0.01, 1.57] |
| 5.1 (≥ 28 and < 37 completed weeks' gestation) + (birth weight ≥ 1000 grams and ≤ 2499 grams) | 1 | 60 | Risk Ratio (M‐H, Fixed, 95% CI) | 0.09 [0.01, 1.57] |
| 6 Glucose concentration (mmol/L) at 120 minutes after birth Show forest plot | Other data | No numeric data | ||
| 6.1 (≥ 28 and < 37 completed weeks' gestation) + (birth weight ≥ 1000 grams and ≤ 2499 grams) | Other data | No numeric data | ||
| Outcome or subgroup title | No. of studies | No. of participants | Statistical method | Effect size |
| 1 Core body temperature (°C) on admission to NICU or up to 2 hours after birth Show forest plot | 1 | 64 | Mean Difference (IV, Fixed, 95% CI) | 0.80 [0.41, 1.19] |
| 1.1 < 29 completed weeks' gestation | 1 | 64 | Mean Difference (IV, Fixed, 95% CI) | 0.80 [0.41, 1.19] |
| 2 Hypothermia on admission to NICU: core body temperature < 36.4°C Show forest plot | 1 | 64 | Risk Ratio (M‐H, Fixed, 95% CI) | 0.48 [0.32, 0.73] |
| 2.1 < 29 completed weeks' gestation | 1 | 64 | Risk Ratio (M‐H, Fixed, 95% CI) | 0.48 [0.32, 0.73] |
| 3 Outside normothermic range on admission to NICU or up to 2 hours after birth Show forest plot | 1 | 64 | Risk Ratio (M‐H, Fixed, 95% CI) | 0.48 [0.32, 0.73] |
| 3.1 < 29 completed weeks' gestation | 1 | 64 | Risk Ratio (M‐H, Fixed, 95% CI) | 0.48 [0.32, 0.73] |
| 4 Core body temperature (°C) 1 hour after initial NICU admission temperature was taken Show forest plot | 1 | 64 | Mean Difference (IV, Fixed, 95% CI) | 0.80 [0.46, 1.14] |
| 4.1 < 29 completed weeks' gestation | 1 | 64 | Mean Difference (IV, Fixed, 95% CI) | 0.80 [0.46, 1.14] |
| 5 Major brain injury Show forest plot | 1 | 64 | Risk Ratio (M‐H, Fixed, 95% CI) | 1.5 [0.27, 8.38] |
| 5.1 < 29 completed weeks' gestation | 1 | 64 | Risk Ratio (M‐H, Fixed, 95% CI) | 1.5 [0.27, 8.38] |
| 6 Mortality (death within hospital stay) Show forest plot | 1 | 64 | Risk Ratio (M‐H, Fixed, 95% CI) | 1.5 [0.27, 8.38] |
| 6.1 < 29 completed weeks' gestation | 1 | 64 | Risk Ratio (M‐H, Fixed, 95% CI) | 1.5 [0.27, 8.38] |
| 7 Bicarbonate (mmol/L) Show forest plot | 1 | 64 | Mean Difference (IV, Fixed, 95% CI) | 1.0 [‐0.25, 2.25] |
| 7.1 < 29 completed weeks' gestation | 1 | 64 | Mean Difference (IV, Fixed, 95% CI) | 1.0 [‐0.25, 2.25] |
| 8 Blood gas pH (first) Show forest plot | 1 | 64 | Mean Difference (IV, Fixed, 95% CI) | 0.01 [‐0.03, 0.05] |
| 8.1 < 29 completed weeks' gestation | 1 | 64 | Mean Difference (IV, Fixed, 95% CI) | 0.01 [‐0.03, 0.05] |
| 9 First serum glucose concentration (mmol/L) on admission to NICU Show forest plot | 1 | 64 | Mean Difference (IV, Fixed, 95% CI) | 0.10 [‐0.42, 0.62] |
| 9.1 < 29 completed weeks' gestation | 1 | 64 | Mean Difference (IV, Fixed, 95% CI) | 0.10 [‐0.42, 0.62] |
| 10 Intubation at birth Show forest plot | 1 | 64 | Risk Ratio (M‐H, Fixed, 95% CI) | 0.82 [0.49, 1.37] |
| 10.1 < 29 completed weeks' gestation | 1 | 64 | Risk Ratio (M‐H, Fixed, 95% CI) | 0.82 [0.49, 1.37] |
| Outcome or subgroup title | No. of studies | No. of participants | Statistical method | Effect size |
| 1 Core body temperature (°C) on admission to NICU or up to 2 hours after birth Show forest plot | 2 | 122 | Mean Difference (IV, Fixed, 95% CI) | 0.32 [0.15, 0.50] |
| 1.1 All infants (< 37 completed weeks' gestation) | 2 | 122 | Mean Difference (IV, Fixed, 95% CI) | 0.32 [0.15, 0.50] |
| 2 Core body temperature (°C) at 10th minute of life Show forest plot | 1 | 58 | Mean Difference (IV, Fixed, 95% CI) | ‐0.27 [‐0.55, 0.01] |
| 2.1 All infants (< 37 completed weeks' gestation) | 1 | 58 | Mean Difference (IV, Fixed, 95% CI) | ‐0.27 [‐0.55, 0.01] |
| 3 Core body temperature (°C) at 15th minute of life Show forest plot | 1 | 58 | Mean Difference (IV, Fixed, 95% CI) | ‐0.26 [‐0.56, 0.05] |
| 3.1 All infants (< 37 completed weeks' gestation) | 1 | 58 | Mean Difference (IV, Fixed, 95% CI) | ‐0.26 [‐0.56, 0.05] |
| 4 Core body temperature (°C) at 30th minute of life Show forest plot | 1 | 58 | Mean Difference (IV, Fixed, 95% CI) | 0.06 [‐0.23, 0.35] |
| 4.1 All infants (< 37 completed weeks' gestation) | 1 | 58 | Mean Difference (IV, Fixed, 95% CI) | 0.06 [‐0.23, 0.35] |
| 5 Core body temperature (°C) at 1 hour of life Show forest plot | 1 | 58 | Mean Difference (IV, Fixed, 95% CI) | ‐0.02 [‐0.32, 0.27] |
| 5.1 All infants (< 37 completed weeks' gestation) | 1 | 58 | Mean Difference (IV, Fixed, 95% CI) | ‐0.02 [‐0.32, 0.27] |
| 6 Core body temperature (°C) 1 hour after initial NICU admission temperature was taken Show forest plot | 1 | 64 | Mean Difference (IV, Fixed, 95% CI) | 0.83 [0.37, 1.29] |
| 6.1 ≥ 28 and ≤ 32 completed weeks' gestation | 1 | 64 | Mean Difference (IV, Fixed, 95% CI) | 0.83 [0.37, 1.29] |
| 7 Core body temperature (°C) 2 hours after initial NICU admission temperature was taken Show forest plot | 1 | 64 | Mean Difference (IV, Fixed, 95% CI) | 1.11 [0.65, 1.57] |
| 7.1 ≥ 28 and ≤ 32 completed weeks' gestation | 1 | 64 | Mean Difference (IV, Fixed, 95% CI) | 1.11 [0.65, 1.57] |
| 8 Hyperthermia: core body temperature > 37.0°C Show forest plot | 2 | 122 | Risk Ratio (M‐H, Fixed, 95% CI) | 0.18 [0.02, 1.39] |
| 8.1 All infants (< 37 completed weeks' gestation) | 2 | 122 | Risk Ratio (M‐H, Fixed, 95% CI) | 0.18 [0.02, 1.39] |
| 9 Hyponatraemia (serum sodium concentration < 130 mmol/L) Show forest plot | 1 | 58 | Risk Ratio (M‐H, Fixed, 95% CI) | 1.43 [0.35, 5.83] |
| 9.1 All infants (< 37 completed weeks' gestation) | 1 | 58 | Risk Ratio (M‐H, Fixed, 95% CI) | 1.43 [0.35, 5.83] |
| 10 Weight (grams) at fifth day of life Show forest plot | 1 | 58 | Mean Difference (IV, Fixed, 95% CI) | ‐74.20 [‐301.63, 153.23] |
| 10.1 All infants (< 37 completed weeks' gestation) | 1 | 58 | Mean Difference (IV, Fixed, 95% CI) | ‐74.20 [‐301.63, 153.23] |
| Outcome or subgroup title | No. of studies | No. of participants | Statistical method | Effect size |
| 1 Core body temperature (°C) 30 minutes after birth Show forest plot | 1 | 60 | Mean Difference (IV, Fixed, 95% CI) | 0.0 [‐0.17, 0.17] |
| 1.1 (≥ 28 and < 37 completed weeks' gestation) + (birth weight ≥ 1000 grams and ≤ 2499 grams) | 1 | 60 | Mean Difference (IV, Fixed, 95% CI) | 0.0 [‐0.17, 0.17] |
| 2 Core body temperature (°C) 1 hour after birth Show forest plot | 1 | 60 | Mean Difference (IV, Fixed, 95% CI) | ‐0.10 [‐0.28, 0.08] |
| 2.1 (≥ 28 and < 37 completed weeks' gestation) + (birth weight ≥ 1000 grams and ≤ 2499 grams) | 1 | 60 | Mean Difference (IV, Fixed, 95% CI) | ‐0.10 [‐0.28, 0.08] |
| 3 Core body temperature (°C) 90 minutes after birth Show forest plot | 1 | 60 | Mean Difference (IV, Fixed, 95% CI) | ‐0.10 [‐0.29, 0.09] |
| 3.1 (≥ 28 and < 37 completed weeks' gestation) + (birth weight ≥ 1000 grams and ≤ 2499 grams) | 1 | 60 | Mean Difference (IV, Fixed, 95% CI) | ‐0.10 [‐0.29, 0.09] |
| 4 Core body temperature (°C) 2 hours after birth Show forest plot | 1 | 60 | Mean Difference (IV, Fixed, 95% CI) | 0.10 [‐0.04, 0.24] |
| 4.1 (≥ 28 and < 37 completed weeks' gestation) + (birth weight ≥ 1000 grams and ≤ 2499 grams) | 1 | 60 | Mean Difference (IV, Fixed, 95% CI) | 0.10 [‐0.04, 0.24] |
| 5 Hyperthermia Show forest plot | 1 | 60 | Risk Ratio (M‐H, Fixed, 95% CI) | 0.33 [0.01, 7.87] |
| 5.1 (≥ 28 and < 37 completed weeks' gestation) + (birth weight ≥ 1000 grams and ≤ 2499 grams) | 1 | 60 | Risk Ratio (M‐H, Fixed, 95% CI) | 0.33 [0.01, 7.87] |
| 6 Glucose concentration (mmol/L) at 2 hours after birth Show forest plot | Other data | No numeric data | ||
| 6.1 (≥ 28 and < 37 completed weeks' gestation) + (birth weight ≥ 1000 grams and ≤ 2499 grams) | Other data | No numeric data | ||
| Outcome or subgroup title | No. of studies | No. of participants | Statistical method | Effect size |
| 1 Core body temperature (°C) on admission to NICU or up to 2 hours after birth Show forest plot | 1 | 64 | Mean Difference (IV, Fixed, 95% CI) | 0.30 [‐0.12, 0.72] |
| 1.1 < 29 completed weeks' gestation | 1 | 64 | Mean Difference (IV, Fixed, 95% CI) | 0.30 [‐0.12, 0.72] |
| 2 Hypothermia on admission to NICU: core body temperature < 36.4°C Show forest plot | 1 | 64 | Risk Ratio (M‐H, Fixed, 95% CI) | 0.7 [0.43, 1.13] |
| 2.1 < 29 completed weeks' gestation | 1 | 64 | Risk Ratio (M‐H, Fixed, 95% CI) | 0.7 [0.43, 1.13] |
| 3 Outside normothermic range on admission to NICU or up to 2 hours after birth Show forest plot | 1 | 64 | Risk Ratio (M‐H, Fixed, 95% CI) | 0.64 [0.40, 1.01] |
| 3.1 < 29 completed weeks' gestation | 1 | 64 | Risk Ratio (M‐H, Fixed, 95% CI) | 0.64 [0.40, 1.01] |
| 4 Core body temperature (°C) 1 hour after initial temperature on admission to NICU taken Show forest plot | 1 | 64 | Mean Difference (IV, Fixed, 95% CI) | 0.30 [0.00, 0.60] |
| 4.1 < 29 completed weeks' gestation | 1 | 64 | Mean Difference (IV, Fixed, 95% CI) | 0.30 [0.00, 0.60] |
| 5 Hyperthermia on admission to NICU: core body temperature > 37.5°C Show forest plot | 1 | 64 | Risk Ratio (M‐H, Fixed, 95% CI) | 0.2 [0.01, 4.01] |
| 5.1 < 29 completed weeks' gestation | 1 | 64 | Risk Ratio (M‐H, Fixed, 95% CI) | 0.2 [0.01, 4.01] |
| 6 Major brain injury Show forest plot | 1 | 64 | Risk Ratio (M‐H, Fixed, 95% CI) | 1.5 [0.27, 8.38] |
| 6.1 < 29 completed weeks' gestation | 1 | 64 | Risk Ratio (M‐H, Fixed, 95% CI) | 1.5 [0.27, 8.38] |
| 7 Mortality (death at discharge) Show forest plot | 1 | 64 | Risk Ratio (M‐H, Fixed, 95% CI) | 1.5 [0.27, 8.38] |
| 7.1 < 29 completed weeks' gestation | 1 | 64 | Risk Ratio (M‐H, Fixed, 95% CI) | 1.5 [0.27, 8.38] |
| 8 Bicarbonate concentration (mmol/L) Show forest plot | 1 | 64 | Mean Difference (IV, Fixed, 95% CI) | 1.0 [0.02, 1.98] |
| 8.1 < 29 completed weeks' gestation | 1 | 64 | Mean Difference (IV, Fixed, 95% CI) | 1.0 [0.02, 1.98] |
| 9 Blood gas pH Show forest plot | 1 | 64 | Mean Difference (IV, Fixed, 95% CI) | ‐0.02 [‐0.06, 0.02] |
| 9.1 < 29 completed weeks' gestation | 1 | 64 | Mean Difference (IV, Fixed, 95% CI) | ‐0.02 [‐0.06, 0.02] |
| 10 First serum glucose concentration (mmol/L) on admission to NICU Show forest plot | 1 | 64 | Mean Difference (IV, Fixed, 95% CI) | 0.0 [‐0.50, 0.50] |
| 10.1 < 29 completed weeks' gestation | 1 | 64 | Mean Difference (IV, Fixed, 95% CI) | 0.0 [‐0.50, 0.50] |
| 11 Intubation at birth Show forest plot | 1 | 64 | Risk Ratio (M‐H, Fixed, 95% CI) | 0.82 [0.49, 1.37] |
| 11.1 < 29 completed weeks' gestation | 1 | 64 | Risk Ratio (M‐H, Fixed, 95% CI) | 0.82 [0.49, 1.37] |
| Outcome or subgroup title | No. of studies | No. of participants | Statistical method | Effect size |
| 1 Core body temperature (°C) 20 minutes after birth Show forest plot | 1 | 59 | Mean Difference (IV, Fixed, 95% CI) | 0.14 [0.08, 0.20] |
| 1.1 ≤ 32 completed weeks' gestation | 1 | 59 | Mean Difference (IV, Fixed, 95% CI) | 0.14 [0.08, 0.20] |
| 2 Core body temperature (°C) 40 minutes after birth Show forest plot | 1 | 59 | Mean Difference (IV, Fixed, 95% CI) | 0.30 [0.24, 0.36] |
| 2.1 ≤ 32 completed weeks' gestation | 1 | 59 | Mean Difference (IV, Fixed, 95% CI) | 0.30 [0.24, 0.36] |
| 3 Core body temperature (°C) 1 hour after birth Show forest plot | 1 | 59 | Mean Difference (IV, Fixed, 95% CI) | 0.35 [0.29, 0.41] |
| 3.1 ≤ 32 completed weeks' gestation | 1 | 59 | Mean Difference (IV, Fixed, 95% CI) | 0.35 [0.29, 0.41] |
| 4 Decrease in core body temperature (°C) during 1 hour after birth Show forest plot | 1 | 59 | Mean Difference (IV, Fixed, 95% CI) | ‐1.34 [‐2.22, ‐0.46] |
| 4.1 ≤ 32 completed weeks' gestation | 1 | 59 | Mean Difference (IV, Fixed, 95% CI) | ‐1.34 [‐2.22, ‐0.46] |
| 5 Hypothermia within 1 hour after birth: core body temperature < 36.5°C or skin temperature < 36°C Show forest plot | 1 | 59 | Risk Ratio (M‐H, Fixed, 95% CI) | 0.84 [0.63, 1.12] |
| 5.1 ≤ 32 completed weeks' gestation | 1 | 59 | Risk Ratio (M‐H, Fixed, 95% CI) | 0.84 [0.63, 1.12] |
| 6 Moderate hypothermia within 1 hour after birth: core body temperature 32°C to 35.9°C Show forest plot | 1 | 59 | Risk Ratio (M‐H, Fixed, 95% CI) | 0.56 [0.31, 1.02] |
| 6.1 ≤ 32 completed weeks' gestation | 1 | 59 | Risk Ratio (M‐H, Fixed, 95% CI) | 0.56 [0.31, 1.02] |
| 7 Outside normothermic range on admission to NICU or up to 2 hours after birth Show forest plot | 1 | 59 | Risk Ratio (M‐H, Fixed, 95% CI) | 0.84 [0.63, 1.12] |
| 7.1 ≤ 32 completed weeks' gestation | 1 | 59 | Risk Ratio (M‐H, Fixed, 95% CI) | 0.84 [0.63, 1.12] |
| Outcome or subgroup title | No. of studies | No. of participants | Statistical method | Effect size |
| 1 Core body temperature (°C) on admission to NICU Show forest plot | 1 | 100 | Mean Difference (IV, Fixed, 95% CI) | 0.10 [‐0.18, 0.38] |
| 1.1 < 29 completed weeks' gestation | 1 | 100 | Mean Difference (IV, Fixed, 95% CI) | 0.10 [‐0.18, 0.38] |
| 2 Hypothermia on admission to NICU: core body temperature < 36.5°C Show forest plot | 1 | 100 | Risk Ratio (M‐H, Fixed, 95% CI) | 0.87 [0.55, 1.37] |
| 2.1 < 29 completed weeks' gestation | 1 | 100 | Risk Ratio (M‐H, Fixed, 95% CI) | 0.87 [0.55, 1.37] |
| 3 Mild hypothermia on admission to NICU: core body temperature 36°C to 36.4°C Show forest plot | 1 | 100 | Risk Ratio (M‐H, Fixed, 95% CI) | 1.08 [0.56, 2.05] |
| 3.1 < 29 completed weeks' gestation | 1 | 100 | Risk Ratio (M‐H, Fixed, 95% CI) | 1.08 [0.56, 2.05] |
| 4 Moderate hypothermia on admission to NICU: core body temperature < 32.0°C to 35.9°C Show forest plot | 1 | 100 | Risk Ratio (M‐H, Fixed, 95% CI) | 0.6 [0.24, 1.53] |
| 4.1 < 29 completed weeks' gestation | 1 | 100 | Risk Ratio (M‐H, Fixed, 95% CI) | 0.6 [0.24, 1.53] |
| 5 Outside normothermic range on admission to NICU or within 2 hours after birth Show forest plot | 1 | 100 | Risk Ratio (M‐H, Fixed, 95% CI) | 0.88 [0.59, 1.32] |
| 5.1 < 29 completed weeks' gestation | 1 | 100 | Risk Ratio (M‐H, Fixed, 95% CI) | 0.88 [0.59, 1.32] |
| 6 Core body temperature (°C) 1 hour after admission to NICU Show forest plot | 1 | 100 | Mean Difference (IV, Fixed, 95% CI) | ‐0.10 [‐0.47, 0.27] |
| 6.1 < 29 completed weeks' gestation | 1 | 100 | Mean Difference (IV, Fixed, 95% CI) | ‐0.10 [‐0.47, 0.27] |
| 7 Hyperthermia on admission to NICU: core body temperature > 37.5°C Show forest plot | 1 | 100 | Risk Ratio (M‐H, Fixed, 95% CI) | 1.0 [0.21, 4.72] |
| 7.1 < 29 completed weeks' gestation | 1 | 100 | Risk Ratio (M‐H, Fixed, 95% CI) | 1.0 [0.21, 4.72] |
| 8 Intraventricular haemorrhage Show forest plot | 1 | 100 | Risk Ratio (M‐H, Fixed, 95% CI) | 0.8 [0.34, 1.86] |
| 8.1 < 29 completed weeks' gestation | 1 | 100 | Risk Ratio (M‐H, Fixed, 95% CI) | 0.8 [0.34, 1.86] |
| 9 Periventricular leukomalacia Show forest plot | 1 | 100 | Risk Ratio (M‐H, Fixed, 95% CI) | 1.0 [0.06, 15.55] |
| 9.1 < 29 completed weeks' gestation | 1 | 100 | Risk Ratio (M‐H, Fixed, 95% CI) | 1.0 [0.06, 15.55] |
| 10 Mortality Show forest plot | 1 | 100 | Risk Ratio (M‐H, Fixed, 95% CI) | 0.29 [0.06, 1.31] |
| 10.1 < 29 completed weeks' gestation | 1 | 100 | Risk Ratio (M‐H, Fixed, 95% CI) | 0.29 [0.06, 1.31] |
| 11 Bronchopulmonary dysplasia (BPD) Show forest plot | 1 | 100 | Risk Ratio (M‐H, Fixed, 95% CI) | 1.0 [0.59, 1.69] |
| 11.1 < 29 completed weeks' gestation | 1 | 100 | Risk Ratio (M‐H, Fixed, 95% CI) | 1.0 [0.59, 1.69] |
| 12 Necrotising enterocolitis Show forest plot | 1 | 100 | Risk Ratio (M‐H, Fixed, 95% CI) | 1.0 [0.41, 2.46] |
| 12.1 < 29 completed weeks' gestation | 1 | 100 | Risk Ratio (M‐H, Fixed, 95% CI) | 1.0 [0.41, 2.46] |
| Outcome or subgroup title | No. of studies | No. of participants | Statistical method | Effect size |
| 1 Core body temperature (°C) on admission to NICU or up to 2 hours after birth Show forest plot | 1 | 64 | Mean Difference (IV, Fixed, 95% CI) | 0.32 [0.02, 0.62] |
| 1.1 ≥ 28 and ≤ 32 completed weeks' gestation | 1 | 64 | Mean Difference (IV, Fixed, 95% CI) | 0.32 [0.02, 0.62] |
| 2 Core body temperature (°C) 1 hour after admission to NICU Show forest plot | 1 | 64 | Mean Difference (IV, Fixed, 95% CI) | 0.37 [0.03, 0.71] |
| 2.1 ≥ 28 and ≤ 32 completed weeks' gestation | 1 | 64 | Mean Difference (IV, Fixed, 95% CI) | 0.37 [0.03, 0.71] |
| 3 Core body temperature (°C) 2 hours after admission to NICU Show forest plot | 1 | 64 | Mean Difference (IV, Fixed, 95% CI) | 0.37 [0.11, 0.63] |
| 3.1 ≥ 28 and ≤ 32 completed weeks' gestation | 1 | 64 | Mean Difference (IV, Fixed, 95% CI) | 0.37 [0.11, 0.63] |
| Outcome or subgroup title | No. of studies | No. of participants | Statistical method | Effect size |
| 1 Core body temperature (°C) on admission to NICU or up to 2 hours after birth Show forest plot | 1 | Mean Difference (IV, Fixed, 95% CI) | Subtotals only | |
| 1.1 All infants (32 to 36 completed weeks' gestation) | 1 | 40 | Mean Difference (IV, Fixed, 95% CI) | 0.10 [‐0.21, 0.41] |
| 1.2 < 2000 grams birth weight | 1 | 10 | Mean Difference (IV, Fixed, 95% CI) | 0.70 [‐0.01, 1.41] |
| 1.3 ≥ 2000 grams birth weight | 1 | 30 | Mean Difference (IV, Fixed, 95% CI) | 0.0 [‐0.37, 0.37] |
| 2 Hypothermia on admission to NICU: core body temperature < 36.5°C or skin temperature < 36°C Show forest plot | 1 | 40 | Risk Ratio (M‐H, Fixed, 95% CI) | 0.90 [0.48, 1.71] |
| 2.1 32 to 36 completed weeks' gestation | 1 | 40 | Risk Ratio (M‐H, Fixed, 95% CI) | 0.90 [0.48, 1.71] |
| Outcome or subgroup title | No. of studies | No. of participants | Statistical method | Effect size |
| 1 Hypothermia: skin temperature < 35.5°C for 2 consecutive recordings Show forest plot | 1 | 31 | Risk Ratio (M‐H, Fixed, 95% CI) | 0.09 [0.01, 0.64] |
| 1.1 1200 to 2199 grams birth weight | 1 | 31 | Risk Ratio (M‐H, Fixed, 95% CI) | 0.09 [0.01, 0.64] |
| 2 Hypoglycaemia: blood glucose level < 2.6 mmol/L Show forest plot | 1 | 31 | Risk Ratio (M‐H, Fixed, 95% CI) | 0.24 [0.03, 2.06] |
| 2.1 1200 to 2199 grams birth weight | 1 | 31 | Risk Ratio (M‐H, Fixed, 95% CI) | 0.24 [0.03, 2.06] |
| Outcome or subgroup title | No. of studies | No. of participants | Statistical method | Effect size |
| 1 Core body temperature (°C) on admission to NICU or up to 2 hours after birth Show forest plot | 2 | 126 | Mean Difference (IV, Fixed, 95% CI) | 0.65 [0.36, 0.94] |
| 1.1 ≤ 1500 grams birth weight | 2 | 126 | Mean Difference (IV, Fixed, 95% CI) | 0.65 [0.36, 0.94] |
| 2 Hypothermia on admission to NICU: core body temperature < 36.5°C or skin temperature < 36°C Show forest plot | 1 | 24 | Risk Ratio (M‐H, Fixed, 95% CI) | 0.3 [0.11, 0.83] |
| 2.1 ≤ 1500 grams birth weight | 1 | 24 | Risk Ratio (M‐H, Fixed, 95% CI) | 0.3 [0.11, 0.83] |
| 3 Moderate hypothermia on admission to NICU: core body temperature < 36°C Show forest plot | 2 | 126 | Risk Ratio (M‐H, Fixed, 95% CI) | 0.49 [0.32, 0.76] |
| 3.1 ≤ 1500 grams birth weight | 2 | 126 | Risk Ratio (M‐H, Fixed, 95% CI) | 0.49 [0.32, 0.76] |
| 4 Hypothermia on admission to NICU: core body temperature < 35°C Show forest plot | 2 | 126 | Risk Ratio (M‐H, Fixed, 95% CI) | 0.18 [0.05, 0.65] |
| 4.1 ≤ 1500 grams birth weight | 2 | 126 | Risk Ratio (M‐H, Fixed, 95% CI) | 0.18 [0.05, 0.65] |
| 5 Outside normothermic range on admission to NICU or up to 2 hours after birth Show forest plot | 1 | 24 | Risk Ratio (M‐H, Fixed, 95% CI) | 0.3 [0.11, 0.83] |
| 5.1 ≤ 1500 grams birth weight | 1 | 24 | Risk Ratio (M‐H, Fixed, 95% CI) | 0.3 [0.11, 0.83] |
| 6 Hyperthermia on admission to NICU: core body temperature > 37.5°C Show forest plot | 2 | 126 | Risk Ratio (M‐H, Fixed, 95% CI) | 4.63 [0.23, 94.10] |
| 6.1 < 32 completed weeks' gestation | 2 | 126 | Risk Ratio (M‐H, Fixed, 95% CI) | 4.63 [0.23, 94.10] |
| 7 Mortality Show forest plot | 1 | 102 | Risk Ratio (M‐H, Fixed, 95% CI) | 0.31 [0.01, 7.40] |
| 7.1 < 32 completed weeks' gestation | 1 | 102 | Risk Ratio (M‐H, Fixed, 95% CI) | 0.31 [0.01, 7.40] |
| 8 Major brain injury ‐ IVH (grade Ⅲ or Ⅳ) Show forest plot | 1 | 102 | Risk Ratio (M‐H, Fixed, 95% CI) | 4.62 [0.56, 38.19] |
| 8.1 < 32 completed weeks' gestation | 1 | 102 | Risk Ratio (M‐H, Fixed, 95% CI) | 4.62 [0.56, 38.19] |
| 9 Major brain injury ‐ cystic periventricular leukomalacia Show forest plot | 1 | 102 | Risk Ratio (M‐H, Fixed, 95% CI) | 1.39 [0.24, 7.95] |
| 9.1 < 32 completed weeks' gestation | 1 | 102 | Risk Ratio (M‐H, Fixed, 95% CI) | 1.39 [0.24, 7.95] |
| 10 Bronchopulmonary dysplasia (BPD) Show forest plot | 1 | 102 | Risk Ratio (M‐H, Fixed, 95% CI) | 1.34 [0.69, 2.61] |
| 10.1 < 32 completed weeks' gestation | 1 | 102 | Risk Ratio (M‐H, Fixed, 95% CI) | 1.34 [0.69, 2.61] |
| 11 Duration of hospital stay (days) Show forest plot | 1 | 102 | Mean Difference (IV, Fixed, 95% CI) | ‐5.0 [‐17.27, 7.27] |
| 11.1 < 32 completed weeks' gestation | 1 | 102 | Mean Difference (IV, Fixed, 95% CI) | ‐5.0 [‐17.27, 7.27] |
| 12 Duration of ventilation (days) Show forest plot | 1 | 102 | Mean Difference (IV, Fixed, 95% CI) | ‐4.0 [‐12.67, 4.67] |
| 12.1 < 32 completed weeks' gestation | 1 | 102 | Mean Difference (IV, Fixed, 95% CI) | ‐4.0 [‐12.67, 4.67] |
| 13 Duration of oxygen requirements (days) Show forest plot | 1 | 102 | Mean Difference (IV, Fixed, 95% CI) | ‐7.0 [‐19.66, 5.66] |
| 13.1 < 32 completed weeks' gestation | 1 | 102 | Mean Difference (IV, Fixed, 95% CI) | ‐7.0 [‐19.66, 5.66] |
| 14 Hypoglycaemia Show forest plot | 1 | 102 | Risk Ratio (M‐H, Fixed, 95% CI) | 1.02 [0.47, 2.18] |
| 14.1 < 32 completed weeks' gestation | 1 | 102 | Risk Ratio (M‐H, Fixed, 95% CI) | 1.02 [0.47, 2.18] |
| 15 Metabolic acidosis Show forest plot | 1 | 102 | Risk Ratio (M‐H, Fixed, 95% CI) | 0.31 [0.03, 2.86] |
| 15.1 < 32 completed weeks' gestation | 1 | 102 | Risk Ratio (M‐H, Fixed, 95% CI) | 0.31 [0.03, 2.86] |
| 16 Necrotising enterocolitis (NEC) Show forest plot | 1 | 102 | Risk Ratio (M‐H, Fixed, 95% CI) | 0.64 [0.33, 1.23] |
| 16.1 < 32 completed weeks' gestation | 1 | 102 | Risk Ratio (M‐H, Fixed, 95% CI) | 0.64 [0.33, 1.23] |
| 17 Sepsis Show forest plot | 1 | 102 | Risk Ratio (M‐H, Fixed, 95% CI) | 0.92 [0.48, 1.79] |
| 17.1 < 32 completed weeks' gestation | 1 | 102 | Risk Ratio (M‐H, Fixed, 95% CI) | 0.92 [0.48, 1.79] |
| Outcome or subgroup title | No. of studies | No. of participants | Statistical method | Effect size |
| 1 Core body temperature (°C) on admission to NICU or up to 2 hours after birth Show forest plot | 2 | 77 | Mean Difference (IV, Fixed, 95% CI) | 0.18 [‐0.18, 0.54] |
| 1.1 ≤ 28 completed weeks' gestation | 2 | 77 | Mean Difference (IV, Fixed, 95% CI) | 0.18 [‐0.18, 0.54] |
| 2 Hypothermia on admission to NICU (core body temperature < 36.5°C or skin temperature < 36°C) Show forest plot | 1 | 36 | Risk Ratio (M‐H, Fixed, 95% CI) | 0.60 [0.32, 1.15] |
| 2.1 (≥ 24 and ≤ 28 completed weeks' gestation and birth weight ≤ 1250 grams) | 1 | 36 | Risk Ratio (M‐H, Fixed, 95% CI) | 0.60 [0.32, 1.15] |
| 3 Outside normothermic range on admission to NICU or up to 2 hours after birth Show forest plot | 1 | 36 | Risk Ratio (M‐H, Fixed, 95% CI) | 0.69 [0.38, 1.24] |
| 3.1 (≥ 24 and ≤ 28 completed weeks' gestation and birth weight ≤ 1250 grams) | 1 | 36 | Risk Ratio (M‐H, Fixed, 95% CI) | 0.69 [0.38, 1.24] |
| 4 Hyperthermia on admission to NICU: core body temperature > 37.5°C Show forest plot | 1 | 36 | Risk Ratio (M‐H, Fixed, 95% CI) | 3.33 [0.14, 76.75] |
| 4.1 (≥ 24 and ≤ 28 completed weeks' gestation and birth weight ≤ 1250 grams) | 1 | 36 | Risk Ratio (M‐H, Fixed, 95% CI) | 3.33 [0.14, 76.75] |
| 5 Brain injury (IVH grade Ⅰ or Ⅱ) Show forest plot | 1 | 36 | Risk Ratio (M‐H, Fixed, 95% CI) | 0.45 [0.10, 2.01] |
| 5.1 (≥ 24 and ≤ 28 completed weeks' gestation and birth weight ≤ 1250 grams) | 1 | 36 | Risk Ratio (M‐H, Fixed, 95% CI) | 0.45 [0.10, 2.01] |
| 6 Major brain injury (IVH grade Ⅲ or Ⅳ) Show forest plot | 2 | 77 | Risk Ratio (M‐H, Fixed, 95% CI) | 0.91 [0.31, 2.71] |
| 6.1 ≤ 28 completed weeks' gestation | 2 | 77 | Risk Ratio (M‐H, Fixed, 95% CI) | 0.91 [0.31, 2.71] |
| 7 Mortality (death before discharge) Show forest plot | 2 | 77 | Risk Ratio (M‐H, Fixed, 95% CI) | 1.10 [0.39, 3.17] |
| 7.1 ≤ 28 completed weeks' gestation | 2 | 77 | Risk Ratio (M‐H, Fixed, 95% CI) | 1.10 [0.39, 3.17] |
| 8 Bronchopulmonary dysplasia (BPD) Show forest plot | 1 | 36 | Risk Ratio (M‐H, Fixed, 95% CI) | 0.75 [0.40, 1.37] |
| 8.1 (≥ 24 and ≤ 28 completed weeks' gestation and birth weight ≤ 1250 grams) | 1 | 36 | Risk Ratio (M‐H, Fixed, 95% CI) | 0.75 [0.40, 1.37] |
| 9 Hypotension during first 24 hours of life Show forest plot | 1 | 41 | Risk Ratio (M‐H, Fixed, 95% CI) | 1.5 [0.71, 3.17] |
| 9.1 ≤ 28 completed weeks' gestation | 1 | 41 | Risk Ratio (M‐H, Fixed, 95% CI) | 1.5 [0.71, 3.17] |
| 10 Necrotising enterocolitis (NEC) Show forest plot | 2 | 77 | Risk Ratio (M‐H, Fixed, 95% CI) | 1.92 [0.61, 5.97] |
| 10.1 ≤ 28 completed weeks' gestation | 2 | 77 | Risk Ratio (M‐H, Fixed, 95% CI) | 1.92 [0.61, 5.97] |
| 11 Patent ductus arteriosus (PDA) Show forest plot | 1 | 36 | Risk Ratio (M‐H, Fixed, 95% CI) | 1.76 [0.88, 3.49] |
| 11.1 (≥ 24 and ≤ 28 completed weeks' gestation and birth weight ≤ 1250 grams) | 1 | 36 | Risk Ratio (M‐H, Fixed, 95% CI) | 1.76 [0.88, 3.49] |
| 12 PDA ‐ medication only Show forest plot | 1 | 36 | Risk Ratio (M‐H, Fixed, 95% CI) | 1.44 [0.69, 3.01] |
| 12.1 (≥ 24 and ≤ 28 completed weeks' gestation and birth weight ≤ 1250 grams) | 1 | 36 | Risk Ratio (M‐H, Fixed, 95% CI) | 1.44 [0.69, 3.01] |
| 13 PDA ‐ ligation Show forest plot | 1 | 36 | Risk Ratio (M‐H, Fixed, 95% CI) | 5.56 [0.29, 108.16] |
| 13.1 (≥ 24 and ≤ 28 completed weeks' gestation and birth weight ≤ 1250 grams) | 1 | 36 | Risk Ratio (M‐H, Fixed, 95% CI) | 5.56 [0.29, 108.16] |
| 14 Retinopathy of prematurity (ROP all grades) Show forest plot | 1 | 36 | Risk Ratio (M‐H, Fixed, 95% CI) | 0.48 [0.15, 1.56] |
| 14.1 (≥ 24 and ≤ 28 completed weeks' gestation and birth weight ≤ 1250 grams) | 1 | 36 | Risk Ratio (M‐H, Fixed, 95% CI) | 0.48 [0.15, 1.56] |
| 15 Retinopathy of prematurity (ROP laser therapy) Show forest plot | 1 | 41 | Risk Ratio (M‐H, Fixed, 95% CI) | 0.53 [0.05, 5.35] |
| 15.1 ≤ 28 completed weeks' gestation | 1 | 41 | Risk Ratio (M‐H, Fixed, 95% CI) | 0.53 [0.05, 5.35] |
| 16 Spontaneous intestinal perforation (SIP) Show forest plot | 1 | 41 | Risk Ratio (M‐H, Fixed, 95% CI) | 0.53 [0.11, 2.56] |
| 16.1 ≤ 28 completed weeks' gestation | 1 | 41 | Risk Ratio (M‐H, Fixed, 95% CI) | 0.53 [0.11, 2.56] |
| 17 Worst base deficit in first 24 hours of life Show forest plot | 1 | 41 | Mean Difference (IV, Fixed, 95% CI) | ‐1.70 [‐3.99, 0.59] |
| 17.1 ≤ 28 completed weeks' gestation | 1 | 41 | Mean Difference (IV, Fixed, 95% CI) | ‐1.70 [‐3.99, 0.59] |
| 18 Worst pH in first 24 hours of life Show forest plot | 1 | 41 | Mean Difference (IV, Fixed, 95% CI) | ‐0.09 [‐0.13, ‐0.05] |
| 18.1 ≤ 28 completed weeks' gestation | 1 | 41 | Mean Difference (IV, Fixed, 95% CI) | ‐0.09 [‐0.13, ‐0.05] |
| Outcome or subgroup title | No. of studies | No. of participants | Statistical method | Effect size |
| 1 Core body temperature (°C) on admission to NICU or up to 2 hours of after birth Show forest plot | 2 | Mean Difference (IV, Fixed, 95% CI) | Subtotals only | |
| 1.1 All infants (< 31 completed weeks' gestation) | 2 | 119 | Mean Difference (IV, Fixed, 95% CI) | 0.37 [0.09, 0.66] |
| 1.2 < 28 completed weeks' gestation | 2 | 76 | Mean Difference (IV, Fixed, 95% CI) | 0.57 [0.20, 0.94] |
| 1.3 28 to 30 completed weeks' gestation | 1 | 43 | Mean Difference (IV, Fixed, 95% CI) | 0.10 [‐0.36, 0.56] |
| 2 Hypothermia: core body temperature < 36.5°C on admission to NICU Show forest plot | 2 | Risk Ratio (M‐H, Fixed, 95% CI) | Subtotals only | |
| 2.1 All infants (< 31 completed weeks' gestation) | 2 | 119 | Risk Ratio (M‐H, Fixed, 95% CI) | 0.93 [0.45, 1.90] |
| 2.2 < 28 completed weeks' gestation | 2 | 76 | Risk Ratio (M‐H, Fixed, 95% CI) | 0.66 [0.29, 1.46] |
| 2.3 28 to 30 completed weeks' gestation | 1 | 43 | Risk Ratio (M‐H, Fixed, 95% CI) | 3.82 [0.46, 31.43] |
| 3 Outside normothermic range on admission to NICU or up to 2 hours after birth Show forest plot | 2 | Risk Ratio (M‐H, Fixed, 95% CI) | Subtotals only | |
| 3.1 All infants (< 31 completed weeks' gestation) | 2 | 119 | Risk Ratio (M‐H, Fixed, 95% CI) | 1.46 [0.94, 2.27] |
| 3.2 < 28 completed weeks' gestation | 2 | 76 | Risk Ratio (M‐H, Fixed, 95% CI) | 1.23 [0.69, 2.18] |
| 3.3 28 to 30 weeks' gestation | 1 | 43 | Risk Ratio (M‐H, Fixed, 95% CI) | 1.91 [0.96, 3.78] |
| 4 Hyperthermia on admission to NICU: core body temperature > 37.5°C Show forest plot | 2 | Risk Ratio (M‐H, Fixed, 95% CI) | Subtotals only | |
| 4.1 All infants (< 31 completed weeks' gestation) | 2 | 119 | Risk Ratio (M‐H, Fixed, 95% CI) | 2.15 [1.07, 4.32] |
| 4.2 < 28 completed weeks' gestation | 2 | 76 | Risk Ratio (M‐H, Fixed, 95% CI) | 2.99 [0.93, 9.65] |
| 4.3 28 to 30 completed weeks' gestation | 1 | 43 | Risk Ratio (M‐H, Fixed, 95% CI) | 1.59 [0.70, 3.60] |
| 5 Major brain injury Show forest plot | 1 | 72 | Risk Ratio (M‐H, Fixed, 95% CI) | 0.32 [0.03, 2.89] |
| 5.1 < 31 completed weeks' gestation | 1 | 72 | Risk Ratio (M‐H, Fixed, 95% CI) | 0.32 [0.03, 2.89] |
| 6 Mortality (death before hospital discharge) Show forest plot | 2 | 119 | Risk Ratio (M‐H, Fixed, 95% CI) | 0.73 [0.32, 1.66] |
| 6.1 < 31 completed weeks' gestation | 2 | 119 | Risk Ratio (M‐H, Fixed, 95% CI) | 0.73 [0.32, 1.66] |
| 7 Chronic lung disease Show forest plot | 1 | 72 | Risk Ratio (M‐H, Fixed, 95% CI) | 1.73 [0.72, 4.18] |
| 7.1 < 31 completed weeks' gestation | 1 | 72 | Risk Ratio (M‐H, Fixed, 95% CI) | 1.73 [0.72, 4.18] |
| 8 Coagulation support Show forest plot | 1 | 47 | Risk Ratio (M‐H, Fixed, 95% CI) | 1.04 [0.30, 3.69] |
| 8.1 < 29 completed weeks' gestation | 1 | 47 | Risk Ratio (M‐H, Fixed, 95% CI) | 1.04 [0.30, 3.69] |
| 9 Inotrope use Show forest plot | 2 | 119 | Risk Ratio (M‐H, Fixed, 95% CI) | 1.14 [0.61, 2.11] |
| 9.1 < 31 completed weeks' gestation | 2 | 119 | Risk Ratio (M‐H, Fixed, 95% CI) | 1.14 [0.61, 2.11] |
| 10 Intubated during admission Show forest plot | 1 | 72 | Risk Ratio (M‐H, Fixed, 95% CI) | 0.98 [0.73, 1.32] |
| 10.1 < 31 completed weeks' gestation | 1 | 72 | Risk Ratio (M‐H, Fixed, 95% CI) | 0.98 [0.73, 1.32] |
| 11 ≥ 1 dose surfactant during admission Show forest plot | 1 | 72 | Risk Ratio (M‐H, Fixed, 95% CI) | 0.99 [0.70, 1.38] |
| 11.1 < 31 completed weeks' gestation | 1 | 72 | Risk Ratio (M‐H, Fixed, 95% CI) | 0.99 [0.70, 1.38] |