Estrategias con antibióticos para erradicar la Pseudomonas aeruginosa en pacientes con fibrosis quística
Information
- DOI:
- https://doi.org/10.1002/14651858.CD004197.pub5Copy DOI

- Database:
-
- Cochrane Database of Systematic Reviews
- Version published:
-
- 25 April 2017see what's new
- Type:
-
- Intervention
- Stage:
-
- Review
- Cochrane Editorial Group:
-
Cochrane Cystic Fibrosis and Genetic Disorders Group
- Copyright:
-
- Copyright © 2020 The Cochrane Collaboration. Published by John Wiley & Sons, Ltd.
Article metrics
Altmetric:
Cited by:
Authors
Contributions of authors
Damian Wood wrote the first draft of the review and both Damian Wood and Alan Smyth edited it to produce the final original review version. Both Damian Wood and Alan Smyth have worked on updated versions of the review up until 2007. As from Issue 2, 2009 the new lead author is Simon Langton Hewer. The most recent version of the review was jointly written by Simon Langton Hewer and Alan Smyth.
Simon Langton Hewer acts as guarantor of the review.
Sources of support
Internal sources
-
No sources of support supplied
External sources
-
National Institute for Health Research, UK.
This systematic review was supported by the National Institute for Health Research, via Cochrane Infrastructure funding to the Cochrane Cystic Fibrosis and Genetic Disorders Group.
Declarations of interest
Dr Langton Hewer is the lead investigator on the ongoing trial Torpedo‐CF: Trial of Optimal Therapy for Pseudomonas Eradication in Cystic Fibrosis.
Prof Smyth declares relevant activities of membership of a Raptor steering committee, consultancies for Raptor, Gilead, Vertex, Roche and PTC. Actavis provide support for CF team educational activities.
Clarification statement added from Kevin Southern, Cystic Fibrosis Editor on 27 February 2020: This review was found by the Cochrane Funding Arbiters, post‐publication, to be noncompliant with theCochrane conflict of interest policy, which includes the relevant parts of theCochrane Commercial Sponsorship Policy. The review will be updated by February 2021; the update will have a majority of authors and lead author free of conflicts.
Current version (post‐publication): Dr Langton Hewer is the lead investigator on the ongoing trial Torpedo‐CF: Trial of Optimal Therapy for Pseudomonas Eradication in Cystic Fibrosis, he has no financial conflicts of interest.
Prof Smyth declares relevant activities of membership of a Raptor steering committee, consultancies for Raptor, Gilead, Vertex, Roche and PTC. Actavis provide support for CF team educational activities.
Acknowledgements
Hazel Bunn assisted in formulation of the review protocol. We would also like to thank Dr Damian Wood for his input into the original version of this review and subsequent updates until November 2007.
This project was supported by the National Institute for Health Research, via Cochrane Infrastructure funding to the Cochrane Cystic Fibrosis and Genetic Disorders Group. The views and opinions expressed therein are those of the authors and do not necessarily reflect those of the Systematic Reviews Programme, NIHR, NHS or the Department of Health.
Version history
| Published | Title | Stage | Authors | Version |
| 2023 Jun 02 | Antibiotic strategies for eradicating Pseudomonas aeruginosa in people with cystic fibrosis | Review | Simon C Langton Hewer, Sherie Smith, Nicola J Rowbotham, Alexander Yule, Alan R Smyth | |
| 2017 Apr 25 | Antibiotic strategies for eradicating Pseudomonas aeruginosa in people with cystic fibrosis | Review | Simon C Langton Hewer, Alan R Smyth | |
| 2014 Nov 10 | Antibiotic strategies for eradicating Pseudomonas aeruginosa in people with cystic fibrosis | Review | Simon C Langton Hewer, Alan R Smyth | |
| 2009 Oct 07 | Antibiotic strategies for eradicating Pseudomonas aeruginosa in people with cystic fibrosis | Review | Simon C Langton Hewer, Alan R Smyth | |
| 2009 Jul 08 | Antibiotic strategies for eradicating Pseudomonas aeruginosa in people with cystic fibrosis | Review | Damian M Wood, Alan R Smyth | |
| 2003 Apr 22 | Antibiotic strategies for eradicating Pseudomonas aeruginosa in people with cystic fibrosis | Protocol | Damian M Wood, Alan R Smyth | |
Differences between protocol and review
2014
The inclusion criteria have been changed to include participants who have received study treatment within six months of the first isolation of P aeruginosa (previously not more than two months). This is to reflect differences in clinical practice between Europe and North America and to allow trials from earlier decades (where early treatment of P aeruginosa was not established clinical practice) to be included. A large trial (306 participants), published in 2011, is therefore now eligible for inclusion (Treggiari 2011). However, it is possible that, where infection has been present for as long as six months, it may have become more difficult to eradicate.
In recent years 28 days of inhaled tobramycin has been recommended as 'standard of care' for eradication of P aeruginosa in guidelines (Döring 2012). This has been reflected in trial design, where investigators have designed their trials to ensure that all participants receive an initial 28‐day course of inhaled tobramycin before randomisation to the next stage of therapy. We have therefore altered our eligibility criteria to allow trials where all participants receive some eradication therapy before randomisation (Treggiari 2011).
We have added cost as an outcome measure, as cost‐effectiveness has become increasingly important in CF care. None of the trials included to date have reported this outcome but future trials may do so.
2009
After the new lead reviewer re‐assessed the review, the section 'Objectives' was expanded to include the sentence:
'To investigate whether there is evidence of superiority or improved cost‐effectiveness between antibiotic strategies.'
Currently, we have included both P aeruginosa‐free and P aeruginosa‐naive individuals according to the definition by Lee (Lee 2003). At the update in 2009 we have added plans to analyse these subgroups separately if sufficient data become available from included studies in the future.
2005
Two clinically relevant additional outcomes were added at review stage to the ones we had originally listed:
-
Time to chronic infection (defined as the presence of P aeruginosa in each monthly sputum sample for six consecutive months or the presence of precipitating antibodies to P aeruginosa or both)
-
Clinical and radiological scores
Keywords
MeSH
Medical Subject Headings (MeSH) Keywords
- Administration, Inhalation;
- Administration, Oral;
- Anti-Bacterial Agents [administration & dosage, *therapeutic use];
- Ciprofloxacin [administration & dosage, therapeutic use];
- Colistin [administration & dosage, therapeutic use];
- Cystic Fibrosis [*complications, microbiology];
- *Pseudomonas aeruginosa;
- Pseudomonas Infections [*drug therapy];
- Randomized Controlled Trials as Topic;
- Respiratory System [microbiology];
- Tobramycin [administration & dosage, therapeutic use];
Medical Subject Headings Check Words
Adult; Child; Humans;
PICOs

Risk of bias summary: review authors' judgements about each risk of bias item for each included study.

Comparison 1 Inhaled tobramycin versus placebo, Outcome 1 Positive respiratory culture for P aeruginosa (300 mg 2x daily).
Comparison 1 Inhaled tobramycin versus placebo, Outcome 2 Positive respiratory culture for P aeruginosa (80 mg 2x daily).
Comparison 1 Inhaled tobramycin versus placebo, Outcome 3 Positive respiratory culture for P aeruginosa (combined available case analysis).
Comparison 1 Inhaled tobramycin versus placebo, Outcome 4 Positive respiratory culture for P aeruginosa (combined) ‐ best case.

Comparison 1 Inhaled tobramycin versus placebo, Outcome 5 Positive respiratory culture for P aeruginosa (combined) ‐ worst case.

Comparison 1 Inhaled tobramycin versus placebo, Outcome 6 Weight (kg) ‐ change from baseline.

Comparison 1 Inhaled tobramycin versus placebo, Outcome 7 Adverse events.

Comparison 1 Inhaled tobramycin versus placebo, Outcome 8 Modified Shwachmann score ‐ change from baseline.
Comparison 2 Oral ciprofloxacin and inhaled colistin versus no treatment, Outcome 1 Proportion colonised with P aeruginosa.
Comparison 3 Oral ciprofloxacin and inhaled colistin versus inhaled tobramycin, Outcome 1 Positive respiratory culture for P aeruginosa.

Comparison 3 Oral ciprofloxacin and inhaled colistin versus inhaled tobramycin, Outcome 2 Adverse events.

Comparison 4 Nebulised tobramycin 28 days versus 56 days, Outcome 1 Time to next isolation of P aeruginosa from BAL, sputum or oropharyngeal cultures.
Comparison 4 Nebulised tobramycin 28 days versus 56 days, Outcome 2 Number of respiratory exacerbations.

Comparison 4 Nebulised tobramycin 28 days versus 56 days, Outcome 3 Adverse events (up to 3 months).
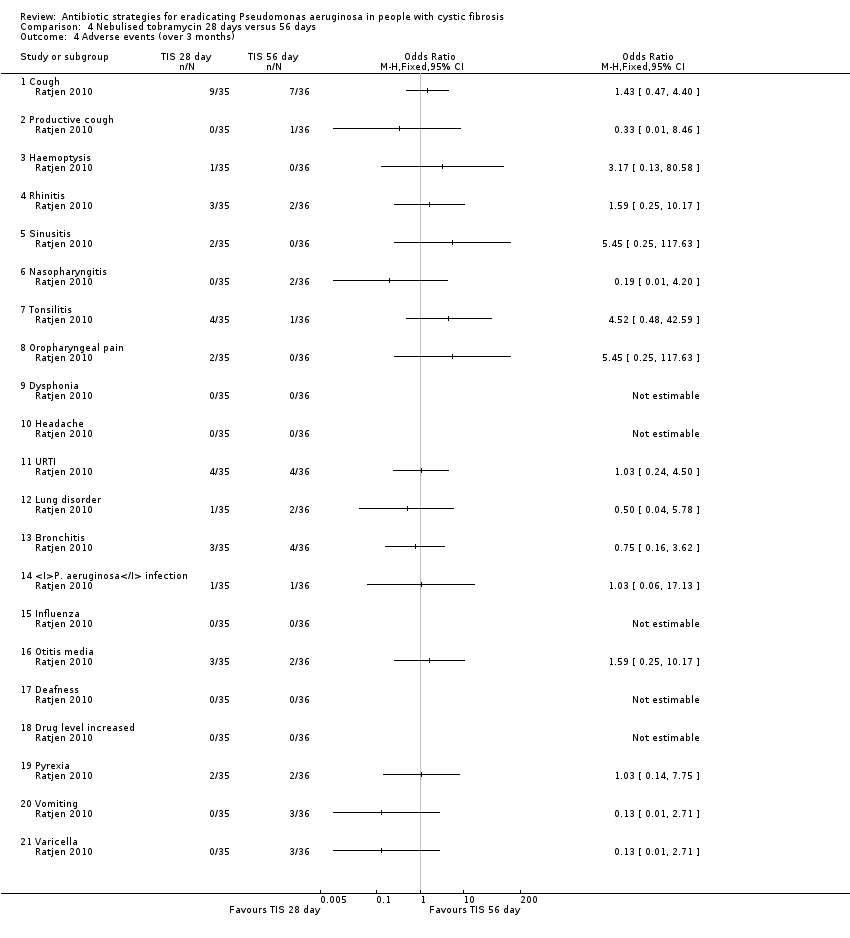
Comparison 4 Nebulised tobramycin 28 days versus 56 days, Outcome 4 Adverse events (over 3 months).

Comparison 5 Inhaled colistin/oral ciprofloxacin versus inhaled tobramycin/oral ciprofloxacin, Outcome 1 Positive respiratory culture for P aeruginosa.

Comparison 5 Inhaled colistin/oral ciprofloxacin versus inhaled tobramycin/oral ciprofloxacin, Outcome 2 FEV₁ % predicted (relative change from baseline).

Comparison 5 Inhaled colistin/oral ciprofloxacin versus inhaled tobramycin/oral ciprofloxacin, Outcome 3 Microbiology status (post‐trial).

Comparison 5 Inhaled colistin/oral ciprofloxacin versus inhaled tobramycin/oral ciprofloxacin, Outcome 4 Adverse events leading to trial discontinuation.
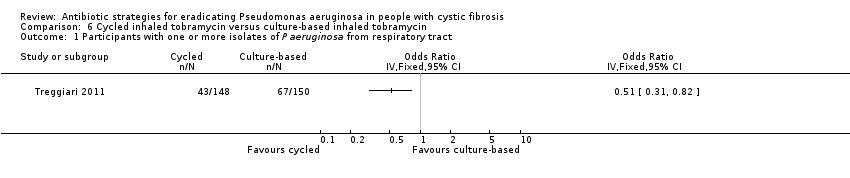
Comparison 6 Cycled inhaled tobramycin versus culture‐based inhaled tobramycin, Outcome 1 Participants with one or more isolates of P aeruginosa from respiratory tract.

Comparison 6 Cycled inhaled tobramycin versus culture‐based inhaled tobramycin, Outcome 2 FEV₁ % predicted ‐ change from baseline.

Comparison 6 Cycled inhaled tobramycin versus culture‐based inhaled tobramycin, Outcome 3 Weight (kg) ‐ change from baseline.

Comparison 6 Cycled inhaled tobramycin versus culture‐based inhaled tobramycin, Outcome 4 Height (cm) ‐ change from baseline.
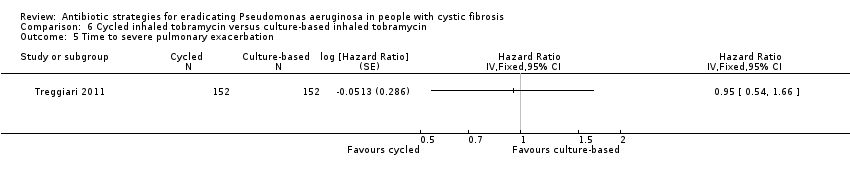
Comparison 6 Cycled inhaled tobramycin versus culture‐based inhaled tobramycin, Outcome 5 Time to severe pulmonary exacerbation.

Comparison 6 Cycled inhaled tobramycin versus culture‐based inhaled tobramycin, Outcome 6 Participants with one or more severe pulmonary exacerbations.
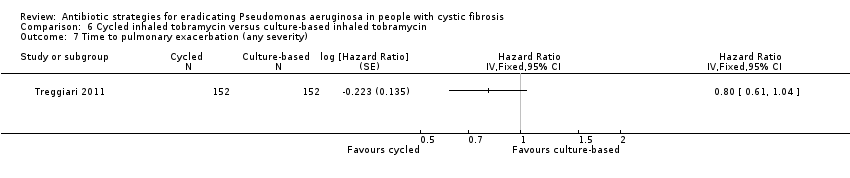
Comparison 6 Cycled inhaled tobramycin versus culture‐based inhaled tobramycin, Outcome 7 Time to pulmonary exacerbation (any severity).

Comparison 6 Cycled inhaled tobramycin versus culture‐based inhaled tobramycin, Outcome 8 Participants with one or more pulmonary exacerbations (any severity).

Comparison 6 Cycled inhaled tobramycin versus culture‐based inhaled tobramycin, Outcome 9 Participants with new isolates of Stenotrophomonas maltophilia.

Comparison 6 Cycled inhaled tobramycin versus culture‐based inhaled tobramycin, Outcome 10 Participants with one or more serious adverse event.

Comparison 7 Ciprofloxacin versus placebo added to cycled and culture‐based inhaled tobramycin, Outcome 1 Participants with one or more isolates of P aeruginosa from respiratory tract.

Comparison 7 Ciprofloxacin versus placebo added to cycled and culture‐based inhaled tobramycin, Outcome 2 FEV₁ % predicted ‐ change from baseline.

Comparison 7 Ciprofloxacin versus placebo added to cycled and culture‐based inhaled tobramycin, Outcome 3 Weight (kg) ‐ change from baseline.
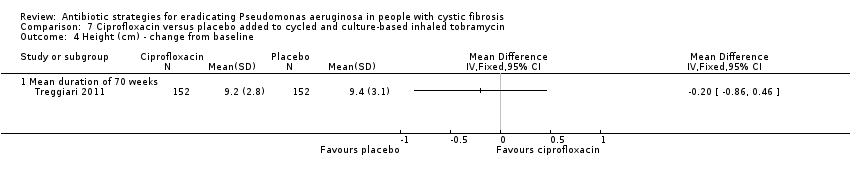
Comparison 7 Ciprofloxacin versus placebo added to cycled and culture‐based inhaled tobramycin, Outcome 4 Height (cm) ‐ change from baseline.
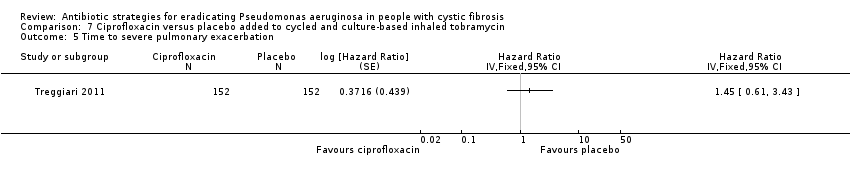
Comparison 7 Ciprofloxacin versus placebo added to cycled and culture‐based inhaled tobramycin, Outcome 5 Time to severe pulmonary exacerbation.

Comparison 7 Ciprofloxacin versus placebo added to cycled and culture‐based inhaled tobramycin, Outcome 6 Participants with one or more severe pulmonary exacerbations.

Comparison 7 Ciprofloxacin versus placebo added to cycled and culture‐based inhaled tobramycin, Outcome 7 Time to pulmonary exacerbation (any severity).
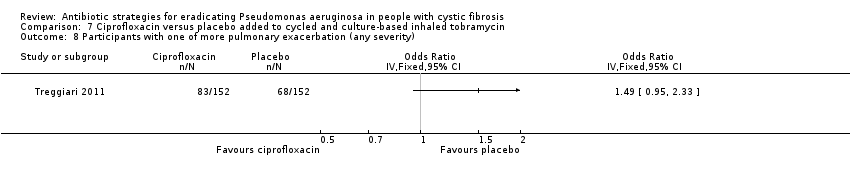
Comparison 7 Ciprofloxacin versus placebo added to cycled and culture‐based inhaled tobramycin, Outcome 8 Participants with one of more pulmonary exacerbation (any severity).

Comparison 7 Ciprofloxacin versus placebo added to cycled and culture‐based inhaled tobramycin, Outcome 9 Participants with new isolates of Stenotrophomonas maltophilia.

Comparison 7 Ciprofloxacin versus placebo added to cycled and culture‐based inhaled tobramycin, Outcome 10 Participants with one or more serious adverse event.
| Inhaled tobramycin compared with placebo for eradicating Pseudomonas aeruginosa in people with cystic fibrosis | ||||||
| Patient or population: adults and children with cystic fibrosis and a positive microbiological isolate of Pseudomonas aeruginosa from a respiratory tract specimen Settings: outpatients Intervention: inhaled tobramycin Comparison: placebo | ||||||
| Outcomes | Illustrative comparative risks* (95% CI) | Relative effect | No of Participants | Quality of the evidence | Comments | |
| Assumed risk | Corresponding risk | |||||
| Placebo | Inhaled tobramycin | |||||
| Eradication of P aeruginosa from the respiratory tract: Proportion with positive respiratory culture for P aeruginosa Follow‐up: 2 months (further results reported up to 2 years) | 682 per 1000 | 102 per 1000 (20 to 443 per 1000) | OR 0.15 (95% CI 0.03 to 0.65) | 38 | ⊕⊝⊝⊝ | The two studies gave very different doses of inhaled tobramycin (80 mg or 300 mg 2x daily). Results across different time points and sensitivity analyses to account for missing data in one trial were variable, showing no consistently significant advantage to inhaled tobramycin over placebo. |
| FEV₁ Follow‐up: up to 2 years | There were no changes in spirometric pulmonary function during or after the treatment period. | NR | up to 224 | ⊕⊝⊝⊝ | No numerical data were reported. | |
| FVC Follow‐up: up to 2 years | There were no changes in spirometric pulmonary function during or after the treatment period. | NR | up to 224 | ⊕⊝⊝⊝ | No numerical data were reported. | |
| Growth and nutritional status: change in weight (kg) from baseline Follow‐up: up to 2 months | The mean change in weight from baseline was 0.3 kg in the placebo group. | The mean change in weight from baseline was 0.1 kg higher (0.38 kg lower to 0.58 kg higher) in the inhaled tobramycin group. | NA | 21 | ⊕⊕⊝⊝ | There was also no difference in the mean change in weight from baseline between groups at 1 month MD 0.20 kg (95% CI ‐0.28 to 0.68). |
| Frequency of infective pulmonary exacerbations: number of exacerbations per patient year Follow‐up: NA | Outcome not reported. | NA | NA | NA | ||
| Isolation of other micro‐organisms from the respiratory tract: number of positive cultures per patient year Follow‐up: up to 2 months | There were no changes in the prevalence of other micro‐organisms, including multi‐resistant organisms, cultured from respiratory secretions. | NR | 21 | ⊕⊝⊝⊝ | No numerical data were reported. | |
| Adverse effects to antibiotics: cough Follow‐up: up to 2 months | 923 per 1000 | 535 per 1000 (28 to 1000 per 1000) | OR 0.58 (95% CI 0.03 to 10.86) | 21 | ⊕⊝⊝⊝ | No other specific adverse events were reported. The other included study in this comparison stated that there was no evidence of a difference in serum creatinine levels or auditory threshold between the groups. |
| *The basis for the assumed risk (e.g. the median control group risk across studies) is provided in footnotes. The corresponding risk (and its 95% confidence interval) is based on the assumed risk in the comparison group and the relative effect of the intervention (and its 95% CI). | ||||||
| GRADE Working Group grades of evidence | ||||||
| 1. Downgraded once due to risk of bias; methodological information was limited and unclear in the included studies and there were concerns regarding incomplete outcome data, selective reporting and other biases due to the early termination of one study. 2. Downgraded once due to imprecision: wide confidence intervals around the pooled effect and variable results shown at different time points. 3. Downgraded once due to applicability: the included studies recruited only children; results are not applicable to adults. 4. In the included trial, 22 participants were randomised but it is not clear if all participants contributed to this outcome. 5. Downgraded once due to imprecision: no numerical results available. 6. Downgraded once due to imprecision: very wide confidence intervals around the effect size. | ||||||
| Oral ciprofloxacin and inhaled colistin compared with no treatment for eradicating Pseudomonas aeruginosa in people with cystic fibrosis | ||||||
| Patient or population: adults and children with cystic fibrosis and a positive microbiological isolate of P. aeruginosa from a respiratory tract specimen Settings: outpatients Intervention: oral ciprofloxacin and inhaled colistin Comparison: no treatment | ||||||
| Outcomes | Illustrative comparative risks* (95% CI) | Relative effect | No of Participants | Quality of the evidence | Comments | |
| Assumed risk | Corresponding risk | |||||
| No treatment | Oral ciprofloxacin and inhaled colistin | |||||
| Eradication of P aeruginosa from the respiratory tract Follow‐up: NA | Outcome not reported | NA | NA | NA | ||
| FEV₁ Follow‐up: NA | Outcome not reported | NA | NA | NA | ||
| FVC Follow‐up: NA | Outcome not reported | NA | NA | NA | ||
| Growth and nutritional status Follow‐up: NA | Outcome not reported | NA | NA | NA | ||
| Frequency of infective pulmonary exacerbations: number of exacerbations per patient year Follow‐up: NA | Outcome not reported | NA | NA | NA | ||
| Isolation of other micro‐organisms from the respiratory tract: number of positive cultures per patient year Follow‐up: NA | Outcome not reported | NA | NA | NA | ||
| Adverse effects to antibiotics Follow‐up: 27 months | No adverse effects were reported in either group | NR | 26 (1 RCT) | ⊕⊝⊝⊝ | No numerical data were reported. | |
| *The basis for the assumed risk (e.g. the median control group risk across studies) is provided in footnotes. The corresponding risk (and its 95% confidence interval) is based on the assumed risk in the comparison group and the relative effect of the intervention (and its 95% CI). | ||||||
| GRADE Working Group grades of evidence | ||||||
| 1. Downgraded once due to risk of bias; methodological information was limited and unclear in the included study and there was a high risk of bias due to lack of blinding. 2. Downgraded once due to applicability: the included study recruited only children; results are not applicable to adults. 3. Downgraded once due to imprecision: no numerical results available. | ||||||
| Oral ciprofloxacin and inhaled colistin compared to inhaled tobramycin for eradicating Pseudomonas aeruginosa in people with cystic fibrosis | ||||||
| Patient or population: adults and children with cystic fibrosis and a positive microbiological isolate of P aeruginosa from a respiratory tract specimen Settings: outpatients Intervention: oral ciprofloxacin and inhaled colistin Comparison: inhaled tobramycin | ||||||
| Outcomes | Illustrative comparative risks* (95% CI) | Relative effect | No of Participants | Quality of the evidence | Comments | |
| Assumed risk | Corresponding risk | |||||
| Inhaled tobramycin | Oral ciprofloxacin and inhaled colistin | |||||
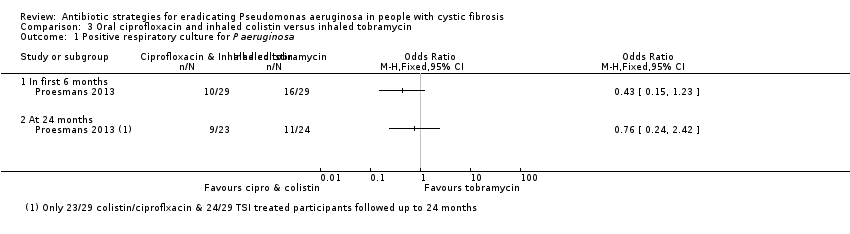
| Eradication of P aeruginosa from the respiratory tract: Proportion with positive respiratory culture for P aeruginosa Follow‐up: up to 24 months | 458 per 1000 | 348 per 1000 (110 to 1000 per 1000) | OR 0.76 (95% CI 0.24 to 2.42) | up to 581 | ⊕⊝⊝⊝ | There was also no significant difference between treatment groups within the first 6 months, OR 0.43 (95% CI 0.15 to 1.23). |
| FEV₁: change from baseline (% predicted) Follow‐up: up to 24 months | Median change from baseline in FEV₁ (% predicted) for all the participants was ‐1%. | NR | up to 581 | ⊕⊝⊝⊝ | Changes in FEV₁ are not reported separately for each treatment arm. | |
| FVC Follow‐up: NA | Outcome not reported. | NA | NA | NA | ||
| Growth and nutritional status: BMI and weight z score Follow‐up: up to 24 months | Both BMI z score and weight z score were reported not to have changed significantly for trial participants as a whole. | NR | up to 581 | ⊕⊝⊝⊝ | Numerical data were not reported for comparative results across the treatment groups. | |
| Frequency of infective pulmonary exacerbations: number of exacerbations per patient year Follow‐up: up to 24 months | During the first six months of follow up, there was no difference between the two treatment arms in number of oral antibiotic treatment days. | NR | up to 581 | ⊕⊝⊝⊝ | These oral antibiotics were given for symptoms and not because of failed eradication. No numerical data were reported | |
| Isolation of other micro‐organisms from the respiratory tract: number of positive cultures per patient year Follow‐up: NA | Outcome not reported. | NA | NA | NA | ||
| Adverse effects to antibiotics: severe cough Follow‐up: up to 24 months | 34 per 1000 | 11 per 1000 (0 to 280 per 1000) | OR 0.32 (95% CI 0.01 to 8.24) | up to 581 | ⊕⊝⊝⊝ | No other specific adverse events were reported. |
| *The basis for the assumed risk (e.g. the median control group risk across studies) is provided in footnotes. The corresponding risk (and its 95% confidence interval) is based on the assumed risk in the comparison group and the relative effect of the intervention (and its 95% CI). | ||||||
| GRADE Working Group grades of evidence | ||||||
| 1. In the included trial, 58 participants were randomised but not all participants contributed to all outcomes (unclear how many participants contributed to some outcomes). 2. Downgraded once due to risk of bias; methodological information was limited and unclear in the included study and there were concerns of bias due to selective reporting of results. 3. Downgraded once due to applicability: the included studies recruited only children; results are not applicable to adults. 4. Downgraded once due to imprecision: very wide confidence intervals around the effect size. 5. Downgraded once due to imprecision: no numerical comparative results available. | ||||||
| Inhaled tobramycin (28 days) compared with inhaled tobramycin (56 days) for eradicating Pseudomonas aeruginosa in people with cystic fibrosis | ||||||
| Patient or population: adults and children with cystic fibrosis and a positive microbiological isolate of P aeruginosa from a respiratory tract specimen Settings: outpatients Intervention: inhaled tobramycin (28 days) Comparison: inhaled tobramycin (56 days) | ||||||
| Outcomes | Illustrative comparative risks* (95% CI) | Relative effect | No of Participants | Quality of the evidence | Comments | |
| Assumed risk | Corresponding risk | |||||
| Inhaled tobramycin (56 days) | Inhaled tobramycin (28 days) | |||||
| Eradication of P aeruginosa from the respiratory tract: time to next isolation of P aeruginosa from BAL, sputum or oropharyngeal cultures Follow‐up: 27 months | By 26.12 months, 50% of people in the 56 day group can expect to have experienced a recurrence of P aeruginosa. | By 25.18 months, 50% of people in the 28 day group can expect to have experienced a recurrence of P aeruginosa. | HR 0.81 (95% CI 0.37 to 1.76) | 651 (1 RCT) | ⊕⊕⊝⊝ | |
| FEV₁: % predicted Follow‐up: 27 months | There were no major short‐ or long‐term changes in spirometric parameters were observed during the study period. | NR | up to 881 | ⊕⊝⊝⊝ | Changes in lung function were not reported separately for each treatment arm. | |
| FVC: % predicted Follow‐up: 27 months | There were no major short‐ or long‐term changes in spirometric parameters were observed during the study period. | NR | up to 881 | ⊕⊝⊝⊝ | Changes in lung function were not reported separately for each treatment arm. | |
| Growth and nutritional status: weight, height and BMI Follow‐up: 27 months | No significant differences in weight, height or body mass index were reported. | NR | up to 881 | ⊕⊝⊝⊝ | Numerical data were not reported or comparative results across the treatment groups. | |
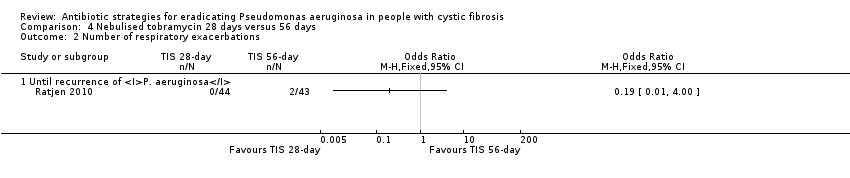
| Frequency of infective pulmonary exacerbations: number of exacerbations per patient year Follow‐up: 27 months | 47 per 1000 | 9 per 1000 (0 to 188 per 1000) | OR 0.19 (95% CI 0.01 to 4.00) | 771 | ⊕⊝⊝⊝ | |
| Isolation of other micro‐organisms from the respiratory tract: number of positive cultures per patient year Follow‐up: 27 months | There were no consistent trends reported in the isolation of non‐P aeruginosa organisms (one isolate only of Stenotrophomonas maltophilia which was seen in the 28‐day arm). | NR | up to 881 | ⊕⊝⊝⊝ | Numerical data were not reported or comparative results across the treatment groups. | |
| Adverse effects to antibiotics Follow‐up: up to 27 months | There were no significant differences between treatment groups in terms of any reported adverse events at any time point. | NA | up to 771 | ⊕⊝⊝⊝ | ||
| *The basis for the assumed risk (e.g. the median control group risk across studies) is provided in footnotes. The corresponding risk (and its 95% confidence interval) is based on the assumed risk in the comparison group and the relative effect of the intervention (and its 95% CI). | ||||||
| GRADE Working Group grades of evidence | ||||||
| 1. In the included trial, 88 participants were randomised but not all participants contributed to all outcomes (unclear how many participants contributed to some outcomes). 2. Downgraded once due to risk of bias; methodological information was limited and unclear in the included study and there were concerns of bias due to selective reporting of results and lack of blinding. 3. Downgraded once due to applicability: the included studies recruited only children; results are not applicable to adults. 4. Downgraded once due to imprecision: no numerical comparative results available. 5. Downgraded once due to imprecision: very wide confidence intervals around the effect size 6. Downgraded once due to imprecision: some wide confidence intervals around effects sizes (small event rates) and a lot of adverse events analysed increasing the statistical chance of a spurious finding. | ||||||
| Inhaled colistin plus oral ciprofloxacin compared to inhaled tobramycin plus oral ciprofloxacin for eradicating Pseudomonas aeruginosa in people with cystic fibrosis | ||||||
| Patient or population: adults and children with cystic fibrosis and a positive microbiological isolate of P aeruginosa from a respiratory tract specimen Settings: outpatients Intervention: inhaled colistin plus oral ciprofloxacin Comparison: inhaled tobramycin plus oral ciprofloxacin | ||||||
| Outcomes | Illustrative comparative risks* (95% CI) | Relative effect | No of Participants | Quality of the evidence | Comments | |
| Assumed risk | Corresponding risk | |||||
| Inhaled tobramycin plus oral ciprofloxacin | Inhaled colistin plus oral ciprofloxacin | |||||
| Eradication of P aeruginosa from the respiratory tract: proportion with positive respiratory culture for P aeruginosa Follow‐up: median 16 months | 315 per 1000 | 403 per 1000 (227 to 721 per 1000) | OR 1.28 (95% CI 0.72 to 2.29) | up to 2231 | ⊕⊕⊝⊝ | There was also no significant difference between treatment groups within the first 6 months, OR 1.11 (95% CI 0.64 to 1.92). |
| FEV₁: relative change in % predicted FEV1 from baseline Follow‐up: mean 54 days | The mean relative change in % predicted FEV₁ from baseline was 4.55% in the inhaled tobramycin plus oral ciprofloxacin group. | The mean relative change in % predicted FEV₁ from baseline was 2.4% lower (5.89% lower to 1.09% higher) in the inhaled colistin plus oral ciprofloxacin group. | NA | 1281 (1 RCT) | ⊕⊕⊝⊝ | |
| FVC Follow‐up: NA | Outcome not reported. | NA | NA | NA | ||
| Growth and nutritional status Follow‐up: NA | Outcome not reported. | NA | NA | NA | ||
| Frequency of infective pulmonary exacerbations: number of exacerbations per patient year Follow‐up: NA | Outcome not reported. | NA | NA | NA | ||
| Isolation of other micro‐organisms from the respiratory tract: number of positive cultures per patient year Follow‐up: median 16 months | There were no differences during follow up between the two groups for isolation of: Stenotrophomonas maltophilia, Achromobacter xylosoxidans or Aspergillus species. | NA | 2051 | ⊕⊕⊕⊝ | ||
| Adverse effects to antibiotics: leading to trial discontinuation Follow‐up: median 16 months | 21 out of 118 (18%) participants discontinued the trial early due to adverse events in the inhaled tobramycin plus oral ciprofloxacin group. | 17 out of 105 (16%) participants discontinued the trial early due to adverse events in the inhaled colistin plus oral ciprofloxacin group. | NA | 223 | ⊕⊕⊕⊝ | Reasons for discontinuations included vomiting, photosensitivity, wheeze and pulmonary exacerbation. |
| *The basis for the assumed risk (e.g. the median control group risk across studies) is provided in footnotes. The corresponding risk (and its 95% confidence interval) is based on the assumed risk in the comparison group and the relative effect of the intervention (and its 95% CI). | ||||||
| GRADE Working Group grades of evidence | ||||||
| 1. In the included trial, 223 participants were randomised but not all participants contributed to all outcomes (unclear how many participants contributed to some outcomes, spirometry not performed in very young children). 2. Downgraded once due to risk of bias; methodological information was limited and unclear in the included study and there were potential concerns of bias due to selective reporting of results and lack of blinding. 3. Downgraded once due to imprecision: wide confidence intervals around the effect size. 4. Downgraded once due to applicability: a large proportion of the randomised participants (95 out of 223, 42%) did not contribute to this outcome. | ||||||
| Cycled inhaled tobramycin compared to culture‐based inhaled tobramycin for eradicating Pseudomonas aeruginosa in people with cystic fibrosis | ||||||
| Patient or population: adults and children with cystic fibrosis and a positive microbiological isolate of P aeruginosa from a respiratory tract specimen Settings: outpatients Intervention: cycled inhaled tobramycin Comparison: culture‐based inhaled tobramycin | ||||||
| Outcomes | Illustrative comparative risks* (95% CI) | Relative effect | No of Participants | Quality of the evidence | Comments | |
| Assumed risk | Corresponding risk | |||||
| Culture‐based inhaled tobramycin | Cycled inhaled tobramycin | |||||
| Eradication of P aeruginosa from the respiratory tract: proportion of participants with one or more isolates of P aeruginosa from the respiratory tract Follow‐up: 18 months | 467 per 1000 | 228 per 1000 (145 to 383 per 1000) | OR 0.51 (95% CI 0.31 to 0.82) | 2981 | ⊕⊕⊕⊝ | The original trial report published age group–adjusted ORs which are slightly different to the results of this review. |
| FEV₁: mean 70‐week % change in FEV₁ (% predicted) Follow‐up: 70 weeks | The mean 70‐week % change in FEV₁ (% predicted) was ‐1.61% in the culture‐based inhaled tobramycin group. | The mean 70‐week % change in FEV₁ (% predicted) was 2.38% higher (2% lower to 6.76% higher) in the cycle‐based inhaled tobramycin group. | NA | 1431 | ⊕⊕⊝⊝ | |
| FVC Follow‐up: NA | Outcome not reported. | NA | NA | NA | ||
| Growth and nutritional status: mean 70‐week change from baseline in weight (kg) and height (cm) Follow‐up: 70 weeks | There were no significant differences between treatment groups in mean 70‐week change from baseline in weight (kg) or height (cm). | NA | 3041 | ⊕⊕⊕⊝ | ||
| Frequency of infective pulmonary exacerbations: proportion of participants with one or more pulmonary exacerbations (any severity) Follow‐up: 18 months | 533 per 1000 | 400 per 1000 (256 to 624 per 1000) | OR 0.75 (95% 0.48 to 1.17) | 3041 | ⊕⊕⊕⊝ | There was also no significant difference between groups in terms of proportion of participants with one or more severe pulmonary exacerbation or in terms of time to pulmonary exacerbation (severe or any severity). |
| Isolation of other micro‐organisms from the respiratory tract: proportion of participants with new isolates of Stenotrophomonas maltophilia Follow‐up: 18 months | 184 per 1000 | 217 per 1000 (118 to 390 per 1000) | OR 1.18 (95% CI 0.65 to 2.12) | 2791 | ⊕⊕⊕⊝ | |
| Adverse effects to antibiotics: proportion of participants with one or more serious adverse events Follow‐up: 18 months | 289 per 1000 | 246 per 1000 (147 to 405 per 1000) | OR 0.85 (95% 0.51 to 1.40) | 3041 | ⊕⊕⊕⊝ | |
| *The basis for the assumed risk (e.g. the median control group risk across studies) is provided in footnotes. The corresponding risk (and its 95% confidence interval) is based on the assumed risk in the comparison group and the relative effect of the intervention (and its 95% CI). | ||||||
| GRADE Working Group grades of evidence | ||||||
| 1. In the included trial, 306 participants were randomised, 304 received treatment but not all participants contributed to all outcomes (unclear how many participants contributed to some outcomes, spirometry not performed in very young children (less than 4 years of age)). 2. Downgraded once due to applicability: the included studies recruited only children; results are not applicable to adults. Also the included trial required patients to have been free of P aeruginosa for at least two years so results may not be applicable to a wider population. 3. Downgraded once due to applicability: a large proportion of the randomised and treated participants (161 out of 304, 53%) did not contribute to this outcome. | ||||||
| Ciprofloxacin compared to placebo added to cycled and culture‐based inhaled tobramycin therapy for eradicating Pseudomonas aeruginosa in people with cystic fibrosis | ||||||
| Patient or population: adults and children with cystic fibrosis and a positive microbiological isolate of P aeruginosa from a respiratory tract specimen Settings: outpatients Intervention: ciprofloxacin added to cycled and culture‐based inhaled tobramycin therapy Comparison: placebo added to cycled and culture‐based inhaled tobramycin therapy | ||||||
| Outcomes | Illustrative comparative risks* (95% CI) | Relative effect | No of Participants | Quality of the evidence | Comments | |
| Assumed risk | Corresponding risk | |||||
| Placebo added to cycled and culture‐based inhaled tobramycin therapy | Ciprofloxacin added to cycled and culture‐based inhaled tobramycin therapy | |||||
| Eradication of P aeruginosa from the respiratory tract: proportion of participants with one or more isolates of P aeruginosa from the respiratory tract Follow‐up: 18 months | 362 per 1000 | 322 per 1000 (199 to 521 per 1000) | OR 0.89 (95% CI 0.55 to 1.44) | 2981 | ⊕⊕⊕⊝ | The original trial report published age group–adjusted ORs which are slightly different to the results of this review. |
| FEV₁: mean 70‐week % change in FEV₁ (% predicted) Follow‐up: 70 weeks | The mean 70‐week % change in FEV₁ (% predicted) was ‐1.85% in the placebo added to cycled and culture‐based inhaled tobramycin therapy group. | The mean 70‐week % change in FEV₁ (% predicted) was 3.02% higher (1.33% lower to 7.37% higher) in the ciprofloxacin added to cycled and culture‐based inhaled tobramycin therapy group. | NA | 1431 | ⊕⊕⊝⊝ | |
| FVC Follow‐up: NA | Outcome not reported. | NA | NA | NA | ||
| Growth and nutritional status: mean 70‐week change from baseline in weight (kg) and height (cm) Follow‐up: 70 weeks | There were no significant differences between treatment groups in mean 70‐week change from baseline in weight (kg) or height (cm). | NA | 3041 | ⊕⊕⊕⊝ | ||
| Frequency of infective pulmonary exacerbations: proportion of participants with one or more pulmonary exacerbations (any severity) Follow‐up: 18 months | 447 per 1000 | 666 per 1000 (425 to 1000) | OR 1.49 (95% CI 0.95 to 2.33) | 3041 | ⊕⊕⊕⊝ | There was also no significant difference between groups in terms of proportion of participants with one or more severe pulmonary exacerbation or in terms of time to pulmonary exacerbation (severe or any severity). |
| Isolation of other micro‐organisms from the respiratory tract: proportion of participants with new isolates of Stenotrophomonas maltophilia Follow‐up: 18 months | 183 per 1000 | 220 per 1000 (121 to 395 per 1000) | OR 1.20 (95% CI 0.66 to 2.16) | 2791 | ⊕⊕⊕⊝ | |
| Adverse effects to antibiotics: proportion of participants with one or more serious adverse event Follow‐up: 18 months | 230 per 1000 | 354 per 1000 (214 to 591 per 1000) | OR 1.54 (95% CI 0.93 to 2.57) | 3041 | ⊕⊕⊕⊝ | |
| *The basis for the assumed risk (e.g. the median control group risk across studies) is provided in footnotes. The corresponding risk (and its 95% confidence interval) is based on the assumed risk in the comparison group and the relative effect of the intervention (and its 95% CI). | ||||||
| GRADE Working Group grades of evidence | ||||||
| 1. In the included trial, 306 participants were randomised, 304 received treatment but not all participants contributed to all outcomes (unclear how many participants contributed to some outcomes, spirometry not performed in very young children (less than 4 years of age)). 2. Downgraded once due to applicability: the included studies recruited only children; results are not applicable to adults. Also the included trial required patients to have been free of P. aeruginosa for at least two years so results may not be applicable to a wider population. 3. Downgraded once due to applicability: a large proportion of the randomised and treated participants (161 out of 304, 53%) did not contribute to this outcome. | ||||||
| Outcome or subgroup title | No. of studies | No. of participants | Statistical method | Effect size |
| 1 Positive respiratory culture for P aeruginosa (300 mg 2x daily) Show forest plot | 1 | Odds Ratio (M‐H, Fixed, 95% CI) | Totals not selected | |
| 1.1 At 1 month | 1 | Odds Ratio (M‐H, Fixed, 95% CI) | 0.0 [0.0, 0.0] | |
| 1.2 At 2 months | 1 | Odds Ratio (M‐H, Fixed, 95% CI) | 0.0 [0.0, 0.0] | |
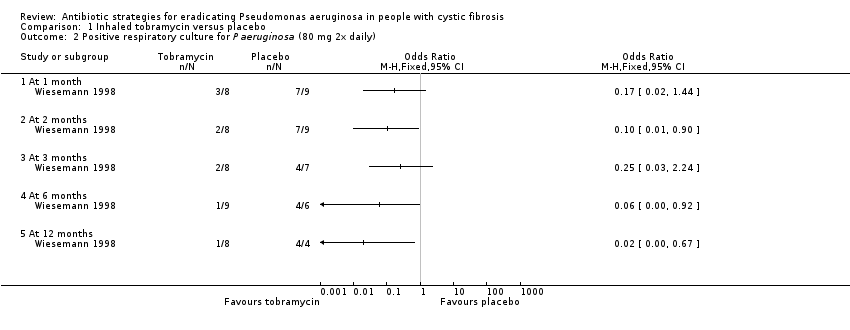
| 2 Positive respiratory culture for P aeruginosa (80 mg 2x daily) Show forest plot | 1 | Odds Ratio (M‐H, Fixed, 95% CI) | Totals not selected | |
| 2.1 At 1 month | 1 | Odds Ratio (M‐H, Fixed, 95% CI) | 0.0 [0.0, 0.0] | |
| 2.2 At 2 months | 1 | Odds Ratio (M‐H, Fixed, 95% CI) | 0.0 [0.0, 0.0] | |
| 2.3 At 3 months | 1 | Odds Ratio (M‐H, Fixed, 95% CI) | 0.0 [0.0, 0.0] | |
| 2.4 At 6 months | 1 | Odds Ratio (M‐H, Fixed, 95% CI) | 0.0 [0.0, 0.0] | |
| 2.5 At 12 months | 1 | Odds Ratio (M‐H, Fixed, 95% CI) | 0.0 [0.0, 0.0] | |
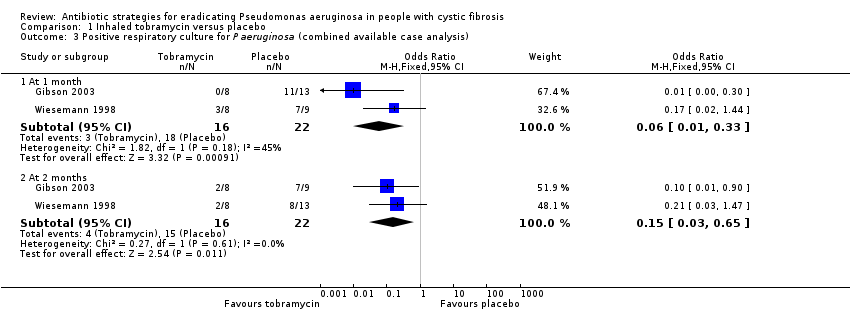
| 3 Positive respiratory culture for P aeruginosa (combined available case analysis) Show forest plot | 2 | Odds Ratio (M‐H, Fixed, 95% CI) | Subtotals only | |
| 3.1 At 1 month | 2 | 38 | Odds Ratio (M‐H, Fixed, 95% CI) | 0.06 [0.01, 0.33] |
| 3.2 At 2 months | 2 | 38 | Odds Ratio (M‐H, Fixed, 95% CI) | 0.15 [0.03, 0.65] |
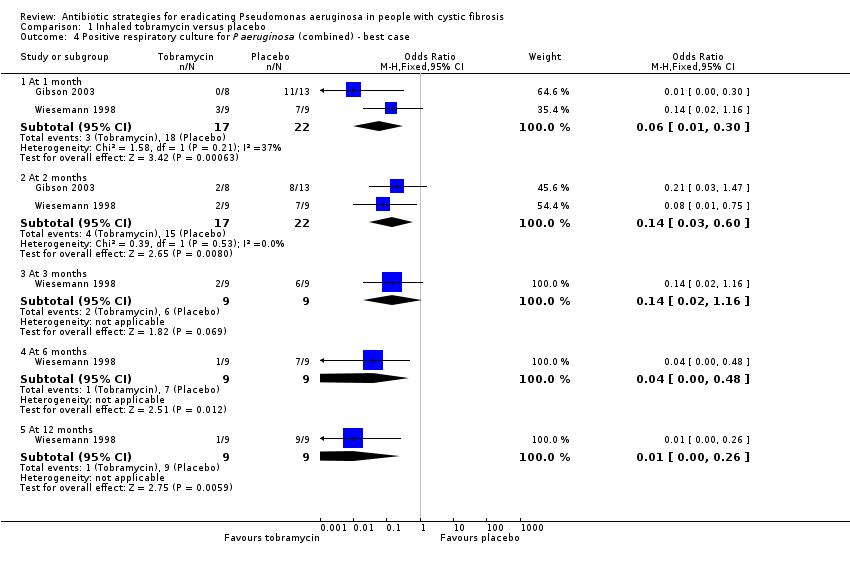
| 4 Positive respiratory culture for P aeruginosa (combined) ‐ best case Show forest plot | 2 | Odds Ratio (M‐H, Fixed, 95% CI) | Subtotals only | |
| 4.1 At 1 month | 2 | 39 | Odds Ratio (M‐H, Fixed, 95% CI) | 0.06 [0.01, 0.30] |
| 4.2 At 2 months | 2 | 39 | Odds Ratio (M‐H, Fixed, 95% CI) | 0.14 [0.03, 0.60] |
| 4.3 At 3 months | 1 | 18 | Odds Ratio (M‐H, Fixed, 95% CI) | 0.14 [0.02, 1.16] |
| 4.4 At 6 months | 1 | 18 | Odds Ratio (M‐H, Fixed, 95% CI) | 0.04 [0.00, 0.48] |
| 4.5 At 12 months | 1 | 18 | Odds Ratio (M‐H, Fixed, 95% CI) | 0.01 [0.00, 0.26] |
| 5 Positive respiratory culture for P aeruginosa (combined) ‐ worst case Show forest plot | 2 | Odds Ratio (M‐H, Fixed, 95% CI) | Subtotals only | |
| 5.1 At 1 month | 2 | 39 | Odds Ratio (M‐H, Fixed, 95% CI) | 0.08 [0.02, 0.38] |
| 5.2 At 2 months | 2 | 39 | Odds Ratio (M‐H, Fixed, 95% CI) | 0.18 [0.04, 0.73] |
| 5.3 At 3 months | 1 | 18 | Odds Ratio (M‐H, Fixed, 95% CI) | 0.36 [0.05, 2.77] |
| 5.4 At 6 months | 1 | 18 | Odds Ratio (M‐H, Fixed, 95% CI) | 0.16 [0.01, 1.83] |
| 5.5 At 12 months | 1 | 18 | Odds Ratio (M‐H, Fixed, 95% CI) | 0.36 [0.05, 2.77] |
| 6 Weight (kg) ‐ change from baseline Show forest plot | 1 | Mean Difference (IV, Fixed, 95% CI) | Totals not selected | |
| 6.1 At 1 month | 1 | Mean Difference (IV, Fixed, 95% CI) | 0.0 [0.0, 0.0] | |
| 6.2 At 2 months | 1 | Mean Difference (IV, Fixed, 95% CI) | 0.0 [0.0, 0.0] | |
| 7 Adverse events Show forest plot | 1 | Odds Ratio (M‐H, Fixed, 95% CI) | Totals not selected | |
| 7.1 Cough | 1 | Odds Ratio (M‐H, Fixed, 95% CI) | 0.0 [0.0, 0.0] | |
| 8 Modified Shwachmann score ‐ change from baseline Show forest plot | 1 | Mean Difference (IV, Fixed, 95% CI) | Totals not selected | |
| 8.1 At 1 month | 1 | Mean Difference (IV, Fixed, 95% CI) | 0.0 [0.0, 0.0] | |
| 8.2 At 2 months | 1 | Mean Difference (IV, Fixed, 95% CI) | 0.0 [0.0, 0.0] | |
| Outcome or subgroup title | No. of studies | No. of participants | Statistical method | Effect size |
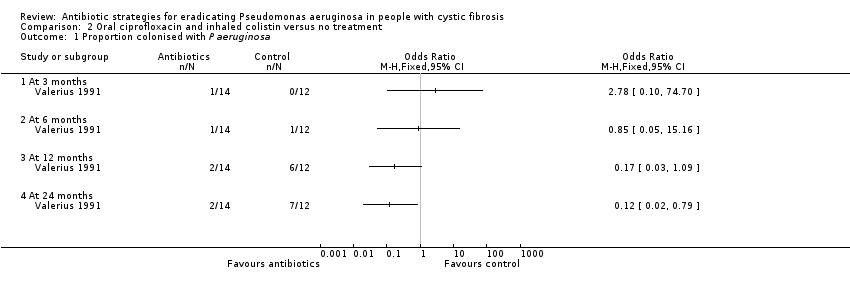
| 1 Proportion colonised with P aeruginosa Show forest plot | 1 | Odds Ratio (M‐H, Fixed, 95% CI) | Totals not selected | |
| 1.1 At 3 months | 1 | Odds Ratio (M‐H, Fixed, 95% CI) | 0.0 [0.0, 0.0] | |
| 1.2 At 6 months | 1 | Odds Ratio (M‐H, Fixed, 95% CI) | 0.0 [0.0, 0.0] | |
| 1.3 At 12 months | 1 | Odds Ratio (M‐H, Fixed, 95% CI) | 0.0 [0.0, 0.0] | |
| 1.4 At 24 months | 1 | Odds Ratio (M‐H, Fixed, 95% CI) | 0.0 [0.0, 0.0] | |
| Outcome or subgroup title | No. of studies | No. of participants | Statistical method | Effect size |
| 1 Positive respiratory culture for P aeruginosa Show forest plot | 1 | Odds Ratio (M‐H, Fixed, 95% CI) | Totals not selected | |
| 1.1 In first 6 months | 1 | Odds Ratio (M‐H, Fixed, 95% CI) | 0.0 [0.0, 0.0] | |
| 1.2 At 24 months | 1 | Odds Ratio (M‐H, Fixed, 95% CI) | 0.0 [0.0, 0.0] | |
| 2 Adverse events Show forest plot | 1 | Odds Ratio (M‐H, Fixed, 95% CI) | Totals not selected | |
| 2.1 Severe cough | 1 | Odds Ratio (M‐H, Fixed, 95% CI) | 0.0 [0.0, 0.0] | |
| Outcome or subgroup title | No. of studies | No. of participants | Statistical method | Effect size |
| 1 Time to next isolation of P aeruginosa from BAL, sputum or oropharyngeal cultures Show forest plot | 1 | Hazard Ratio (Fixed, 95% CI) | Totals not selected | |
| 2 Number of respiratory exacerbations Show forest plot | 1 | Odds Ratio (M‐H, Fixed, 95% CI) | Totals not selected | |
| 2.1 Until recurrence of P. aeruginosa | 1 | Odds Ratio (M‐H, Fixed, 95% CI) | 0.0 [0.0, 0.0] | |
| 3 Adverse events (up to 3 months) Show forest plot | 1 | Odds Ratio (M‐H, Fixed, 95% CI) | Totals not selected | |
| 3.1 Cough | 1 | Odds Ratio (M‐H, Fixed, 95% CI) | 0.0 [0.0, 0.0] | |
| 3.2 Productive cough | 1 | Odds Ratio (M‐H, Fixed, 95% CI) | 0.0 [0.0, 0.0] | |
| 3.3 Haemoptysis | 1 | Odds Ratio (M‐H, Fixed, 95% CI) | 0.0 [0.0, 0.0] | |
| 3.4 Rhinitis | 1 | Odds Ratio (M‐H, Fixed, 95% CI) | 0.0 [0.0, 0.0] | |
| 3.5 Sinusitis | 1 | Odds Ratio (M‐H, Fixed, 95% CI) | 0.0 [0.0, 0.0] | |
| 3.6 Nasopharyngitis | 1 | Odds Ratio (M‐H, Fixed, 95% CI) | 0.0 [0.0, 0.0] | |
| 3.7 Tonsilitis | 1 | Odds Ratio (M‐H, Fixed, 95% CI) | 0.0 [0.0, 0.0] | |
| 3.8 Oropharyngeal pain | 1 | Odds Ratio (M‐H, Fixed, 95% CI) | 0.0 [0.0, 0.0] | |
| 3.9 Dysphonia | 1 | Odds Ratio (M‐H, Fixed, 95% CI) | 0.0 [0.0, 0.0] | |
| 3.10 Headache | 1 | Odds Ratio (M‐H, Fixed, 95% CI) | 0.0 [0.0, 0.0] | |
| 3.11 URTI | 1 | Odds Ratio (M‐H, Fixed, 95% CI) | 0.0 [0.0, 0.0] | |
| 3.12 Lung disorder | 1 | Odds Ratio (M‐H, Fixed, 95% CI) | 0.0 [0.0, 0.0] | |
| 3.13 Bronchitis | 1 | Odds Ratio (M‐H, Fixed, 95% CI) | 0.0 [0.0, 0.0] | |
| 3.14 P. aeruginosa infection | 1 | Odds Ratio (M‐H, Fixed, 95% CI) | 0.0 [0.0, 0.0] | |
| 3.15 Influenza | 1 | Odds Ratio (M‐H, Fixed, 95% CI) | 0.0 [0.0, 0.0] | |
| 3.16 Otitis media | 1 | Odds Ratio (M‐H, Fixed, 95% CI) | 0.0 [0.0, 0.0] | |
| 3.17 Deafness | 1 | Odds Ratio (M‐H, Fixed, 95% CI) | 0.0 [0.0, 0.0] | |
| 3.18 Drug level increased | 1 | Odds Ratio (M‐H, Fixed, 95% CI) | 0.0 [0.0, 0.0] | |
| 3.19 Pyrexia | 1 | Odds Ratio (M‐H, Fixed, 95% CI) | 0.0 [0.0, 0.0] | |
| 3.20 Vomiting | 1 | Odds Ratio (M‐H, Fixed, 95% CI) | 0.0 [0.0, 0.0] | |
| 3.21 Varicella | 1 | Odds Ratio (M‐H, Fixed, 95% CI) | 0.0 [0.0, 0.0] | |
| 4 Adverse events (over 3 months) Show forest plot | 1 | Odds Ratio (M‐H, Fixed, 95% CI) | Totals not selected | |
| 4.1 Cough | 1 | Odds Ratio (M‐H, Fixed, 95% CI) | 0.0 [0.0, 0.0] | |
| 4.2 Productive cough | 1 | Odds Ratio (M‐H, Fixed, 95% CI) | 0.0 [0.0, 0.0] | |
| 4.3 Haemoptysis | 1 | Odds Ratio (M‐H, Fixed, 95% CI) | 0.0 [0.0, 0.0] | |
| 4.4 Rhinitis | 1 | Odds Ratio (M‐H, Fixed, 95% CI) | 0.0 [0.0, 0.0] | |
| 4.5 Sinusitis | 1 | Odds Ratio (M‐H, Fixed, 95% CI) | 0.0 [0.0, 0.0] | |
| 4.6 Nasopharyngitis | 1 | Odds Ratio (M‐H, Fixed, 95% CI) | 0.0 [0.0, 0.0] | |
| 4.7 Tonsilitis | 1 | Odds Ratio (M‐H, Fixed, 95% CI) | 0.0 [0.0, 0.0] | |
| 4.8 Oropharyngeal pain | 1 | Odds Ratio (M‐H, Fixed, 95% CI) | 0.0 [0.0, 0.0] | |
| 4.9 Dysphonia | 1 | Odds Ratio (M‐H, Fixed, 95% CI) | 0.0 [0.0, 0.0] | |
| 4.10 Headache | 1 | Odds Ratio (M‐H, Fixed, 95% CI) | 0.0 [0.0, 0.0] | |
| 4.11 URTI | 1 | Odds Ratio (M‐H, Fixed, 95% CI) | 0.0 [0.0, 0.0] | |
| 4.12 Lung disorder | 1 | Odds Ratio (M‐H, Fixed, 95% CI) | 0.0 [0.0, 0.0] | |
| 4.13 Bronchitis | 1 | Odds Ratio (M‐H, Fixed, 95% CI) | 0.0 [0.0, 0.0] | |
| 4.14 P. aeruginosa infection | 1 | Odds Ratio (M‐H, Fixed, 95% CI) | 0.0 [0.0, 0.0] | |
| 4.15 Influenza | 1 | Odds Ratio (M‐H, Fixed, 95% CI) | 0.0 [0.0, 0.0] | |
| 4.16 Otitis media | 1 | Odds Ratio (M‐H, Fixed, 95% CI) | 0.0 [0.0, 0.0] | |
| 4.17 Deafness | 1 | Odds Ratio (M‐H, Fixed, 95% CI) | 0.0 [0.0, 0.0] | |
| 4.18 Drug level increased | 1 | Odds Ratio (M‐H, Fixed, 95% CI) | 0.0 [0.0, 0.0] | |
| 4.19 Pyrexia | 1 | Odds Ratio (M‐H, Fixed, 95% CI) | 0.0 [0.0, 0.0] | |
| 4.20 Vomiting | 1 | Odds Ratio (M‐H, Fixed, 95% CI) | 0.0 [0.0, 0.0] | |
| 4.21 Varicella | 1 | Odds Ratio (M‐H, Fixed, 95% CI) | 0.0 [0.0, 0.0] | |
| Outcome or subgroup title | No. of studies | No. of participants | Statistical method | Effect size |
| 1 Positive respiratory culture for P aeruginosa Show forest plot | 1 | Odds Ratio (M‐H, Fixed, 95% CI) | Totals not selected | |
| 1.1 In first 6 months | 1 | Odds Ratio (M‐H, Fixed, 95% CI) | 0.0 [0.0, 0.0] | |
| 1.2 At end of follow up (median 16 months) | 1 | Odds Ratio (M‐H, Fixed, 95% CI) | 0.0 [0.0, 0.0] | |
| 2 FEV₁ % predicted (relative change from baseline) Show forest plot | 1 | Mean Difference (IV, Fixed, 95% CI) | Totals not selected | |
| 2.1 At mean 54 days | 1 | Mean Difference (IV, Fixed, 95% CI) | 0.0 [0.0, 0.0] | |
| 3 Microbiology status (post‐trial) Show forest plot | 1 | Odds Ratio (M‐H, Fixed, 95% CI) | Totals not selected | |
| 3.1 Stenotrophomonas maltophilia | 1 | Odds Ratio (M‐H, Fixed, 95% CI) | 0.0 [0.0, 0.0] | |
| 3.2 Achromobacter xylosoxidans | 1 | Odds Ratio (M‐H, Fixed, 95% CI) | 0.0 [0.0, 0.0] | |
| 3.3 Aspergillus species | 1 | Odds Ratio (M‐H, Fixed, 95% CI) | 0.0 [0.0, 0.0] | |
| 4 Adverse events leading to trial discontinuation Show forest plot | 1 | Odds Ratio (M‐H, Fixed, 95% CI) | Totals not selected | |
| 4.1 Vomiting | 1 | Odds Ratio (M‐H, Fixed, 95% CI) | 0.0 [0.0, 0.0] | |
| 4.2 Photosensitivity | 1 | Odds Ratio (M‐H, Fixed, 95% CI) | 0.0 [0.0, 0.0] | |
| 4.3 Wheeze | 1 | Odds Ratio (M‐H, Fixed, 95% CI) | 0.0 [0.0, 0.0] | |
| 4.4 Pulmonary exacerbation during early eradication treatment | 1 | Odds Ratio (M‐H, Fixed, 95% CI) | 0.0 [0.0, 0.0] | |
| 4.5 Lack of compliance | 1 | Odds Ratio (M‐H, Fixed, 95% CI) | 0.0 [0.0, 0.0] | |
| Outcome or subgroup title | No. of studies | No. of participants | Statistical method | Effect size |
| 1 Participants with one or more isolates of P aeruginosa from respiratory tract Show forest plot | 1 | Odds Ratio (IV, Fixed, 95% CI) | Totals not selected | |
| 2 FEV₁ % predicted ‐ change from baseline Show forest plot | 1 | Mean Difference (IV, Fixed, 95% CI) | Totals not selected | |
| 2.1 Mean duration of 70 weeks | 1 | Mean Difference (IV, Fixed, 95% CI) | 0.0 [0.0, 0.0] | |
| 3 Weight (kg) ‐ change from baseline Show forest plot | 1 | Mean Difference (IV, Fixed, 95% CI) | Totals not selected | |
| 3.1 Mean duration of 70 weeks | 1 | Mean Difference (IV, Fixed, 95% CI) | 0.0 [0.0, 0.0] | |
| 4 Height (cm) ‐ change from baseline Show forest plot | 1 | Mean Difference (IV, Fixed, 95% CI) | Totals not selected | |
| 4.1 Mean duration of 70 weeks | 1 | Mean Difference (IV, Fixed, 95% CI) | 0.0 [0.0, 0.0] | |
| 5 Time to severe pulmonary exacerbation Show forest plot | 1 | Hazard Ratio (Fixed, 95% CI) | Totals not selected | |
| 6 Participants with one or more severe pulmonary exacerbations Show forest plot | 1 | Odds Ratio (IV, Fixed, 95% CI) | Totals not selected | |
| 7 Time to pulmonary exacerbation (any severity) Show forest plot | 1 | Hazard Ratio (Fixed, 95% CI) | Totals not selected | |
| 8 Participants with one or more pulmonary exacerbations (any severity) Show forest plot | 1 | Odds Ratio (IV, Fixed, 95% CI) | Totals not selected | |
| 9 Participants with new isolates of Stenotrophomonas maltophilia Show forest plot | 1 | Odds Ratio (IV, Fixed, 95% CI) | Totals not selected | |
| 10 Participants with one or more serious adverse event Show forest plot | 1 | Odds Ratio (IV, Fixed, 95% CI) | Totals not selected | |
| Outcome or subgroup title | No. of studies | No. of participants | Statistical method | Effect size |
| 1 Participants with one or more isolates of P aeruginosa from respiratory tract Show forest plot | 1 | Odds Ratio (IV, Fixed, 95% CI) | Totals not selected | |
| 2 FEV₁ % predicted ‐ change from baseline Show forest plot | 1 | Mean Difference (IV, Fixed, 95% CI) | Totals not selected | |
| 2.1 Mean duration of 70 weeks | 1 | Mean Difference (IV, Fixed, 95% CI) | 0.0 [0.0, 0.0] | |
| 3 Weight (kg) ‐ change from baseline Show forest plot | 1 | Mean Difference (IV, Fixed, 95% CI) | Totals not selected | |
| 3.1 Mean duration of 70 weeks | 1 | Mean Difference (IV, Fixed, 95% CI) | 0.0 [0.0, 0.0] | |
| 4 Height (cm) ‐ change from baseline Show forest plot | 1 | Mean Difference (IV, Fixed, 95% CI) | Totals not selected | |
| 4.1 Mean duration of 70 weeks | 1 | Mean Difference (IV, Fixed, 95% CI) | 0.0 [0.0, 0.0] | |
| 5 Time to severe pulmonary exacerbation Show forest plot | 1 | Hazard Ratio (Fixed, 95% CI) | Totals not selected | |
| 6 Participants with one or more severe pulmonary exacerbations Show forest plot | 1 | Odds Ratio (IV, Fixed, 95% CI) | Totals not selected | |
| 7 Time to pulmonary exacerbation (any severity) Show forest plot | 1 | Hazard Ratio (Fixed, 95% CI) | Totals not selected | |
| 8 Participants with one of more pulmonary exacerbation (any severity) Show forest plot | 1 | Odds Ratio (IV, Fixed, 95% CI) | Totals not selected | |
| 9 Participants with new isolates of Stenotrophomonas maltophilia Show forest plot | 1 | Odds Ratio (IV, Fixed, 95% CI) | Totals not selected | |
| 10 Participants with one or more serious adverse event Show forest plot | 1 | Odds Ratio (IV, Fixed, 95% CI) | Totals not selected | |