Vitamin supplementation for preventing miscarriage
References
References to studies included in this review
References to studies excluded from this review
References to studies awaiting assessment
References to ongoing studies
Additional references
Characteristics of studies
Characteristics of included studies [ordered by study ID]
| Methods | Randomisation and allocation concealment: unclear, no methodological details given, dubious as the number of women allocated to the treatment group was more than double that allocated to the placebo group. "Unselected patients were each given 200 capsules... these were given a code, unknown to us and contained either an inert powder or 100 mg each of ascorbic acid and hesperidin." Blinding of outcome assessment: women and study investigators did not know the treatment codes. Documentation of exclusion: none reported. Use of placebo control: placebo given; however, all women received an additional multivitamin supplement. | |
| Participants | 406 women were recruited in the study. Eligible women were "unselected patients" in private obstetrics care, that were less than or equal to 10 weeks' pregnant, and were eligible regardless of whether they were currently bleeding or the number of previous pregnancies. Women greater than 10 weeks' gestation were excluded. 406 women were randomised to either vitamin C (n = 303) or placebo (n = 103), no losses to follow‐up were reported. 77 women in the study had more than 2 previous miscarriages and/or bleeding in the pregnancy, and 329 had 2 or fewer miscarriages and no bleeding in the pregnancy. | |
| Interventions | All women were given 200 tablets, containing either 100 mg each of ascorbic acid and hesperidin or placebo (an inert powder). | |
| Outcomes |
| |
| Notes | Women's risk of spontaneous and recurrent miscarriage is unclear, as there is no information about concurrent medical conditions or other risk factors for miscarriage. 9 of the 406 women were classified as experiencing recurrent miscarriage. | |
| Risk of bias | ||
| Bias | Authors' judgement | Support for judgement |
| Adequate sequence generation? | Unclear risk | No methodological details given. |
| Allocation concealment? | Unclear risk | No methodological details given. |
| Blinding? | Low risk | Women and study investigators did not know the treatment allocation. |
| Incomplete outcome data addressed? | Low risk | No losses to follow up reported. |
| Free of selective reporting? | Unclear risk | Limited information about selection bias, stated that 'unselected patients' were included. |
| Free of other bias? | Unclear risk | Limited methodological details provided including patient compliance. |
| Methods | Randomisation and allocation concealment: a computer‐generated randomisation list using blocks of 10 was given to the hospital pharmacy departments. Researchers allocated the next available number to participants and women collected the trial tablets from the pharmacy department. Blinding of outcome assessment: women, caregivers and researchers were blinded to the treatment allocation until recruitment, data collection and laboratory analyses were complete. Documentation of exclusion: 123 (43.5%) women were excluded, of which 70 women were withdrawn because their second Doppler scan was normal. Pregnancy outcome data were reported for all women randomised. Use of placebo control: placebo control. | |
| Participants | 283 women were recruited into the study. Inclusion criteria: abnormal Doppler waveform in either uterine artery at 18‐22 weeks' gestation or a history in the preceding pregnancy of pre‐eclampsia necessitating delivery before 37 weeks' gestation, eclampsia or the syndrome of HELLP. | |
| Interventions | Women randomised to the vitamin C and E group received tablets containing 1000 mg vitamin C daily and capsules containing 400 IU vitamin E daily. | |
| Outcomes |
| |
| Notes | Women's risk of spontaneous and recurrent miscarriage is unclear, women were at high risk of pre‐eclampsia. | |
| Risk of bias | ||
| Bias | Authors' judgement | Support for judgement |
| Adequate sequence generation? | Low risk | Computer generated random number list. |
| Allocation concealment? | Low risk | Random number list used blocks of 10 and was held by the pharmacy department. |
| Blinding? | Low risk | Women, caregivers and researchers were blinded until the analyses were completed. |
| Incomplete outcome data addressed? | Low risk | 123 (43.5%) women were excluded, of which, 70 women were withdrawn because their second Doppler scan was normal. Data were reported for all women randomised. |
| Free of selective reporting? | Low risk | Data reported for all outcomes in methods. |
| Free of other bias? | Low risk | The study appears to be free of other sources of bias. |
| Methods | Randomisation and allocation concealment: cluster randomisation of 30 "village development communities" using blocks of 5 within each community, randomisation occurred by "drawing numbered identical chits from a hat". Blinding of outcome assessment: women, field staff, investigators and statisticians did not know the treatment codes until the end of the study. Documentation of exclusion: 534 (10.7%) women or infants were excluded and 343 (6.7%) infants were lost to follow up. Use of placebo control: no placebo given, women in the control group were given vitamin A only. | |
| Participants | All women of reproductive age in the 30 village development communities were considered eligible. Women who were currently pregnant, breastfeeding a baby < 9 months old, menopausal, sterilised or widowed were excluded. | |
| Interventions | Women were allocated to one of five groups:
At enrolment women received 15 caplets and were instructed to take one caplet every night. Women were then visited by field staff twice a week to monitor compliance and replenish supplies of the caplets. | |
| Outcomes |
"The rate if miscarriage did not differ by treatment group and ranged between 12% and 15% (data not show)". "Miscarriage was defined as a pregnancy that ended in a fetal loss before 28 wk of gestation." | |
| Notes | The following information was given about multiple births: "the numbers of twin pregnancies (34 pairs of liveborn twins and 8 pairs with one stillborn) was comparable across treatment groups". | |
| Risk of bias | ||
| Bias | Authors' judgement | Support for judgement |
| Adequate sequence generation? | Unclear risk | Unlcear, 'cluster randomisation using blocks of 5 within each community'. |
| Allocation concealment? | Unclear risk | Unlcear, randomisation occurred by 'drawing numbered identical chits from a hat'. |
| Blinding? | Low risk | Women, field workers and researchers were blinded until after the analysis. |
| Incomplete outcome data addressed? | Low risk | 534 (10.7%) women or infants were excluded and 343 (6.7%) infants were lost to follow‐up, intention to treat analysis performed. |
| Free of selective reporting? | Unclear risk | Information about women's diet was collected but not reported. |
| Free of other bias? | Unclear risk | Unclear due to limited information about the cluster design including allocation concealment. |
| Methods | Randomisation and allocation concealment: unclear, "randomised" stated in text but no details given. Blinding of outcome assessment: "double blind clinical test" stated in the text. Documentation of exclusion: 16 women (35%) excluded. Use of placebo control: placebo control. | |
| Participants | 45 women were initially recruited into the study; however, results are presented for 29 women (folic acid group n = 16, placebo group n = 13). Women were excluded if they had any "pathological data" or if there was "evidence of neglect". No other details given. | |
| Interventions | Women were randomised to either daily ingestion of 10 mg folic acid or placebo. Women were asked to take the tablets from between 12 and 16 weeks until the end of pregnancy. | |
| Outcomes |
| |
| Notes | Women risk of spontaneous and recurrent miscarriage is unclear. Women's nutritional status is also unclear. | |
| Risk of bias | ||
| Bias | Authors' judgement | Support for judgement |
| Adequate sequence generation? | Unclear risk | No methodological details given. |
| Allocation concealment? | Unclear risk | No methodological details given. |
| Blinding? | Unclear risk | Unclear, "double blind clinical test" stated in the text. |
| Incomplete outcome data addressed? | High risk | 16 women (35%) excluded. |
| Free of selective reporting? | High risk | Women were excluded if they had any "pathological data" or if there was "evidence of neglect" but not details given. |
| Free of other bias? | Unclear risk | Limited methodological details given. |
| Methods | Randomisation and allocation concealment: unclear, "women agreed to their allocation on the basis of a random table". Blinding of outcome assessment: unclear, women were aware of the "blind use of one of two kinds of tablets", but no other details given. Documentation of exclusion: 49 women (1%) were lost to follow‐up and excluded. Use of placebo control: "trace element control" given. | |
| Participants | 7765 women were recruited into the study. Women participating in the HOFPP who volunteered to take part, were not currently pregnant, and who conceived within 12 months of ceasing contraception. In the first two years of the HOFPP, women were also required to be aged < 35 years, and not to have had a previous pregnancy except a prior induced abortion. 7905 women were approached, of which 140 refused participation, 7765 were randomised and 5502 women had a confirmed pregnancy and were allocated to either multivitamins (n = 2819) or control (n = 2683). 49 women of the 5502 confirmed pregnancies were lost to follow‐up. | |
| Interventions | Women were provided with multivitamin or trace element 'control' from at least 28 days before conception continuing until at least the second missed menstrual period. | |
| Outcomes |
| |
| Notes | Women's risk of spontaneous and recurrent miscarriage is unclear. | |
| Risk of bias | ||
| Bias | Authors' judgement | Support for judgement |
| Adequate sequence generation? | Unclear risk | Methodological details unclear. |
| Allocation concealment? | Unclear risk | Methodological details unclear, 'women agreed to their allocation on the basis of a random table'. |
| Blinding? | Unclear risk | Women were aware of the 'blind use of one of two kinds of tablets', but no other details given. |
| Incomplete outcome data addressed? | Low risk | 49 women (1%) excluded, partial intention to treat analyses performed. |
| Free of selective reporting? | Unclear risk | Denominators vary with serial publications. |
| Free of other bias? | Unclear risk | Limited methodological details provided. |
| Methods | Randomisation and allocation concealment: block randomisation using blocks of 20, eligible women were "assigned the next numbered bottle of regimen". The study used a 2 by 2 factorial design and women were randomised to 1 of 4 groups. Tablets were indistinguishable and packaged in identically coded bottles. Blinding of outcome assessment: women and study investigators were unaware of the treatment allocation, no information given about blinding of outcome assessors. Documentation of exclusion: 64 women (6%) were lost to follow‐up and excluded. Use of placebo control: placebo given. | |
| Participants | 1085 women were recruited into the study. Pregnant women between 12 and 27 weeks' gestation who were HIV‐1 infected, living in Dar es Salaam and intended to stay there for at least one year were eligible for the study. Women not HIV‐1 positive or moving out of Dar es Salaam were excluded. 13,879 pregnant women consented to be HIV‐1 tested, of which 1806 were positive, and 1085 were randomised. Of these, 3 women were not pregnant and 7 women died before delivery and were excluded from the trial. Of the remaining 1075 women, 54 women (5%) were lost to follow‐up by the time of delivery, leaving birth outcomes reported for 1021 women. Women were randomised to 1 of 4 groups: vitamin A (n = 269), multivitamins excluding vitamin A (n = 269); multivitamins including vitamin A (n = 270) or placebo (n = 267). | |
| Interventions | Women were randomised to 1 of 4 groups:
All women received 400 mg ferrous sulphate and 5 mg folic acid daily, as well as 500 mg chloroquine phosphate weekly. At delivery, all women taking vitamin A were to receive an additional oral dose of 200,000 IU vitamin A and the others an extra dose of a placebo. Pill counts were conducted at each visit and new tablets were given out at each visit. | |
| Outcomes |
| |
| Notes | Women's risk of spontaneous and recurrent miscarriage was unclear, although may be increased due to their HIV‐1 positive status. | |
| Risk of bias | ||
| Bias | Authors' judgement | Support for judgement |
| Adequate sequence generation? | Unclear risk | Block randomisation using blocks of 20. |
| Allocation concealment? | Unclear risk | Women assigned the 'next numbered bottle of regimen'. |
| Blinding? | Low risk | Women and investigators were blinded. |
| Incomplete outcome data addressed? | High risk | 64 women (6%) were lost to follow up and excluded, intention to treat analyses performed. |
| Free of selective reporting? | Unclear risk | Figures change with serial publications, particularly for secondary outcomes, and results are not reported separately for the individual 4 groups. |
| Free of other bias? | Unclear risk | Limited methodological details provided. |
| Methods | Randomisation: unclear about sequence generation. Allocation concealment: States a list was prepared according to the randomisation sequence in blocks of 20, tablets were bottled in identical coded bottles, eligible women were given the next numbered bottle. Blinding of outcome assessment: Women and research assistants who assessed the study outcomes were unaware of the intervention groups. Documentation of exclusion: 49 women lost to follow‐up (multivitamin group: 23, placebo group: 26), no post‐randomisation exclusions. Use of placebo control: placebo given. | |
| Participants | 8428 women were randomised in the study. Pregnant women between 12 and 27 weeks who had a negative test for HIV infection and planned to stay in the city until delivery and for 1 year thereafter recruited through antenatal clinics in Dar es Salaam. 8468 women were enrolled, however 40 women were then found to be ineligible. 8428 women were randomly assigned to receive either a multivitamin (n = 4214) or placebo (n = 4214) from the time of enrolment until 6 weeks after delivery. 6 women died before delivery and 43 were lost to follow up by the time of delivery. | |
| Interventions | The supplements included 20 mg of vitamin B1, 20 mg of vitamin B2, 25 mg of vitamin B6, 100 mg of niacin, 50 mcg of vitamin B12, 500 mg of vitamin C, 30 mg of vitamin E, and 0.8 mg of folic acid. The active tablets and placebo were similar in shape, size, and colour. All women, irrespective of the assigned study regimen, were given daily doses of iron (60 mg of elemental iron) and folic acid (0.25 mg). They were also given malaria prophylaxis in the form of sulfadoxine‐pyrimethamine tablets at 20 weeks and 30 weeks of gestation. | |
| Outcomes |
| |
| Notes | Women's risk of spontaneous and recurrent miscarriage was unclear. Women's nutritional status is also unclear. Intention to treat analyses performed. Compliance: Average compliance was 88%, no difference in compliances between the two groups. Location: Tanzania. Timeframe: August 2001 and July 2004. | |
| Risk of bias | ||
| Bias | Authors' judgement | Support for judgement |
| Adequate sequence generation? | Unclear risk | Generation of sequence not reported, except that there were blocks of 20 in the sequence. |
| Allocation concealment? | Low risk | Identical coded bottles prepared according to the randomisation list, eligible women were assigned the next numbered bottle. |
| Blinding? | Low risk | Women and outcome assessors were blinded to allocation. |
| Incomplete outcome data addressed? | Low risk | 49 (1%) women lost to follow‐up, balanced across groups, analyses by intention to treat. |
| Free of selective reporting? | Low risk | All pre‐specified outcomes appear to be reported. |
| Free of other bias? | Low risk | The study appears to be free of other sources of bias. |
| Methods | Randomisation and allocation concealment: quasi‐randomised, alternate women were allocated to receive folic acid or placebo according to the order in which they attended antenatal clinic. No other methodological details were given. Blinding of outcome assessment: women and investigators were blinded to the treatment allocation, until after the completion of the trial. Documentation of exclusion: 21 women (28%) excluded from the analysis. Use of placebo control: control tablet containing iron given. | |
| Participants | 75 women were recruited into the trial. Women were eligible if they were primigravida, less than 26 weeks' pregnant (range of gestation 10 to 26 weeks'), with haematocrit value (PCV) 27 per cent or more, and who had not received treatment so far as was known. Women with Haemoglobin (Hb) SC, Hb.SS, Hb.CC were excluded. Alternate patients were allocated to group A (placebo) or B (folic acid). 75 women were included (40 in group A and 35 in group B) initially; however, only 26 in group A and 28 in group B completed the trial. 16 women (10 in group A and 8 in group B) defaulted from the trial, 3 (2 in group A and 1 in group B) were anaemic on the second visit warranting folic acid treatment, 1 in group A self medicated with folic acid and 1 in group A 'aborted'. | |
| Interventions | All women received antimalarials and iron supplements as per the standard antenatal care at the hospital. | |
| Outcomes |
| |
| Notes | Results not reported as intention to treat; however, where possible, the review authors included data in the review as intention to treat. | |
| Risk of bias | ||
| Bias | Authors' judgement | Support for judgement |
| Adequate sequence generation? | High risk | Quasi‐randomised, alternate allocation. |
| Allocation concealment? | High risk | Quasi‐randomised, alternate allocation. |
| Blinding? | Low risk | Women and investigators blinded. |
| Incomplete outcome data addressed? | High risk | 21 women (28%) excluded from the analysis. |
| Free of selective reporting? | Unclear risk | Results not reported as intention to treat; however, where possible, the review authors included data in the review as intention to treat. |
| Free of other bias? | Unclear risk | Limited methodological details provided. |
| Methods | Randomisation and allocation concealment: women were "randomly allocated to one of five groups using a random number table", no other details given. Blinding of outcome assessment: Women and investigators were blinded to the treatment allocation, until after the completion of the trial. Documentation of exclusion: 18 women (9%) were excluded due to anaemia at enrolment, 'defaulting', or being 'mentally subnormal', these women were replaced by other women chosen by an investigator. A further 42 women were excluded before delivery and another 30 failed to attend the postnatal clinic, birth outcomes were available for 160 women (80%). Use of placebo control: no placebo control. | |
| Participants | 228 women met the eligibility criteria; however 200 pregnant women were recruited into the study. Women were allocated to one of five groups; 40 women were allocated to each group. Eligible women included:
Women were excluded if they had already taken any antimalarial treatment or haematinics during the pregnancy, or had the following complications: hydatiform mole, haemoglobin SC disease, overt anaemia or proteinuria. The mean gestational age of women at enrolment was 18.5 weeks. | |
| Interventions | Women were allocated to 1 of 5 groups:
| |
| Outcomes | Maternal outcomes
Infant outcomes
Laboratory outcomes
Not all outcomes were reported for each individual treatment group. Miscarriage was reported for the combined groups 4 and 5, therefore for the purpose of this review the groups 4 and 5 are combined (folic acid + iron) and compared with group 2 and group 3 (iron + antimalarials). The authors reported that 8 women had hypertension without other signs, 21 women had preeclampsia and 6 developed eclampsia, with no association between these outcomes and treatment group. No other details were provided, including the breakdown of these outcomes by treatment group. | |
| Notes | Women's risk of spontaneous and recurrent miscarriage was unclear. Women were at high risk of anaemia. Information about other nutritional indices was not provided. Intention to treat analyses not performed, however, where possible, the review authors included data in the review as intention to treat. Compliance: 72 women (36%) were classed as defaulters. Location: Nigeria. Timeframe: Unclear. | |
| Risk of bias | ||
| Bias | Authors' judgement | Support for judgement |
| Adequate sequence generation? | Unclear risk | A random number table was used but no details provided of how it was generated. |
| Allocation concealment? | Unclear risk | No details provided about the allocation. |
| Blinding? | Low risk | Neither the researchers nor the patients were aware of the treatment allocation until after the completion of the study. |
| Incomplete outcome data addressed? | High risk | 228 women met the entry criteria, but only 200 were included in the trial. 18 women were excluded and replaced by other women. |
| Free of selective reporting? | High risk | Not all outcomes are reported by treatment group. In serial publications up to 70% of the data was excluded. |
| Free of other bias? | Unclear risk | Limited methodological details provided. |
| Methods | Randomisation and allocation concealment: unclear, "patients were randomly assigned to the control group or the study group". No other methodological details given. Blinding of outcome assessment: unclear, no details given. Documentation of exclusion: 28 women (19%) in the control group were excluded, no details given for the exclusion. Use of placebo control: no placebo control. | |
| Participants | 150 women were recruited into the study. Women with a luteal phase defect, as described by a peak serum P level < 120 mg/mL in the mid‐luteal phase measured at 3 time points, were eligible and invited to participate. Luteal phase defects were ascertained in two consecutive menstrual cycles, and the third cycle was the intervention cycle. Women receiving IVF‐ET treatment were excluded. 313 women were considered for enrolment in the study, 150 (48%) were randomised. 28 women were withdrawn from the control group, leaving 122 women in the study, who were allocated to vitamin C (n = 76) or control (n = 46). 5 women in the control group and 19 women in the vitamin C group became pregnant during the study period. | |
| Interventions | Women in the intervention group took 750 mg vitamin C per day from the first day of the third menstrual cycle until a urinary pregnancy test was positive. Pregnancy rate was checked up until 6 months after the study cycle was started. Women in the control group received no supplementation and no treatment was given in the third cycle. | |
| Outcomes |
| |
| Notes | Women's risk of spontaneous or recurrent miscarriage was unclear according to criteria specified in the review. | |
| Risk of bias | ||
| Bias | Authors' judgement | Support for judgement |
| Adequate sequence generation? | Unclear risk | Methodological details unclear. |
| Allocation concealment? | Unclear risk | Methodological details unclear. |
| Blinding? | Unclear risk | Methodological details unclear. |
| Incomplete outcome data addressed? | High risk | 28 women (19%) in the control group excluded. |
| Free of selective reporting? | Unclear risk | No details of exclusion of women in the control group given. |
| Free of other bias? | High risk | No placebo control. |
| Methods | Randomisation and allocation concealment: unclear, "containers of vitamin or placebo capsules were given a random number" and "the key to random numbers was kept at the ICMR Headquarters". No other methodological details were given. Blinding of outcome assessment: "double blind" mentioned in the text, but no details given. Documentation of exclusion: 187 women (40%) were excluded from the analysis. Use of placebo control: placebo control. | |
| Participants | 466 women were recruited into the study. Women who had previously given birth to a child with an open NTD, and planned to have another child were eligible and invited to participate. This was regardless of their parity, number of previous births with an NTD, age, consanguinity, and socio‐economic status. Women who had previously given birth to a child with closed spina bifida, or with a history of diabetes or abnormal fasting and post‐prandial blood sugar, history of epilepsy, congenital anomalies indicative of a genetic syndrome in the previous NTD, history of vitamin intake in the 3 months prior to enrolment, and pregnancy were excluded. 466 women were enrolled and randomised to either vitamin (n = 231) or placebo (n = 235), of these women, 90 were lost to follow‐up immediately and 71 did not conceive until the final follow‐up. Of the remaining 305 women who were known to become pregnant (vitamin n = 152, placebo n = 153), pregnancy outcomes were unknown for 26 women. In the paper, 279 of the initial 466 women were included in the analysis; however, in this review results are presented for main outcomes on an intention‐to‐treat basis (i.e. n = 466). | |
| Interventions | The folic acid containing multivitamin included 120 mg ferrous sulphate, 240 mg calcium phosphate, 4000 IU vitamin A, 400 IU vitamin D, 2.5 mg vitamin B1, 2.5 mg vitamin B2, 2 mg vitamin B6, 15 mg nicotinamide, 40 mg vitamin C, 4 mg folic acid, 10 mg zinc. | |
| Outcomes |
| |
| Notes | The risk profile of women in the trial for spontaneous and recurrent miscarriage is unclear, as is the dietary intake of participants. | |
| Risk of bias | ||
| Bias | Authors' judgement | Support for judgement |
| Adequate sequence generation? | Unclear risk | Containers 'given a random number'. |
| Allocation concealment? | Unclear risk | 'Key to random numbers were kept at the ICMR headquarters' but no other details given. |
| Blinding? | Unclear risk | Double blind mentioned in the text but no details given. |
| Incomplete outcome data addressed? | High risk | 187 (40%) women excluded. |
| Free of selective reporting? | Unclear risk | Difficult to assess given the high losses to follow‐up. |
| Free of other bias? | Unclear risk | Limited methodological details provided. |
| Methods | Randomisation and allocation concealment: cluster randomised. 270 centres in the Salarhi district, Nepal, were involved which included 30 subdistricts each with 9 wards. Each ward was assigned to 1 of 3 treatment groups. "Wards were assigned by a random draw of numbered chits, blocked on subdistrict". Blinding of outcome assessment: women and study investigators were not aware of the treatment codes. Maternal mortality was assessed by study investigators blinded to treatment allocation, no details were given for other outcomes. Documentation of exclusions: 157 (1%) women were lost to follow‐up and excluded. Use of placebo: placebo control. | |
| Participants | 15,832 women were recruited into the study. All married women of child bearing age in the Salarhi district, Nepal, were eligible and invited to participate in the study. Women migrating into the study area, or women that were never pregnant or refused participation, or women who migrated before being pregnant, were excluded from the analysis. Eligible women were identified from census data and marriage registers. 44,646 women were recruited, of which 1136 (2.5%) were excluded as they either emigrated before becoming pregnant, died or refused consent. During the study period 15,832 women identified themselves as being pregnant, and 157 women were lost to follow‐up in the postpartum period. Results are reported for 17,373 pregnancies, allocated to the following groups: vitamin A (n = 6070), beta‐carotene (n = 5650) or placebo (n = 5653). Denominators for the treatment groups vary for the measures of early infant mortality, due to losses to follow‐up after birth. | |
| Interventions | The three treatment groups consisted of a weekly single oral supplement of either:
All capsules contained mg dl‐alpha‐tocopherol as an antioxidant. Women took the tablets prior to conception, during pregnancy and postpartum, for a total of 3.5 years. | |
| Outcomes | 1. Fetal loss, defined as any reported miscarriage, stillbirth or maternal death during pregnancy. The outcomes were based on self reports, and women who reported to be pregnant for >= 6 weeks but then no longer reported being pregnant were considered to have had a miscarriage. | |
| Notes | Women's risk profile for spontaneous or recurrent miscarriage was unclear, as was their dietary intake of vitamin A. | |
| Risk of bias | ||
| Bias | Authors' judgement | Support for judgement |
| Adequate sequence generation? | Unclear risk | Cluster randomised, unclear how sequence was generated. |
| Allocation concealment? | Unclear risk | Each ward was assigned to the treatment groups based on 'a random draw of numbered chits, blocked on subdistrict'. |
| Blinding? | Low risk | Women and investigators blinded to treatment allocation. |
| Incomplete outcome data addressed? | Unclear risk | 157 women (1%) were lost to follow‐up and excluded, partial intention to treat analysis performed. |
| Free of selective reporting? | High risk | Denominators vary in serial publications of this trial. |
| Free of other bias? | High risk | Some women were pregnant more than once during the study period, however the denominators reported are the total number of pregnancies during the study period, not the total number of women randomised, which incorrectly assumes that each data point included is independent from the next. |
| Methods | Randomisation and allocation concealment: block randomisation, stratified by hospital, using "consecutively numbered, opaque, sealed envelopes". Blinding of outcome assessment: women and study investigators were initially blinded to the treatment allocation, however the tablet preparations were changed after 55 women were randomised and after this only participants were blinded. Documentation of exclusion: 3 women (1%) were lost to follow‐up and excluded. Use of placebo control: 3 treatment regimens were assessed, no placebo control. | |
| Participants | 354 women were recruited into the study. Women with a previous neural tube defect defined as anencephalus, iniencephalus, encephalocoele, and spina bifida aperta, who were not pregnant when contacted but were planning a future pregnancy, were eligible and invited to participate. Women were identified from case registers at the participating hospitals. Women with conditions likely to result in impaired absorption from the gastrointestinal tract were excluded. | |
| Interventions | Indistinguishable trial tablets were initially made by Beecham and Glaxo, however Beecham withdrew their support after 55 women had been randomised. After this time a commercially available pregnavite Forte F was used (MF tablet) and Antigen Pharmaceuticals produced a white multivitamin tablet without folic acid. This was associated with a loss of blinding. Women were randomised to one of three treatments:
The F and MF resulted in a daily dose of 0.3 mg folic acid. The MF and MV resulted in a daily dose of 4000 IU vitamin A, 400 IU calciferol, 1.5 mg thiamine hydrochloride, 1.5 mg riboflavine, 1 mg pyridoxine hydrochloride, 15 mg nicotinamide, 40 mg ascorbic acid, 480 mg calcium phosphate, and 252 mg ferrous sulphate. Women took the tablets for at least 2 months prior to conception and until the date of the 3rd missed period. | |
| Outcomes |
| |
| Notes | The trial was stopped after there were poor recruitment rates and birth rates. A sample‐size calculation required 462 women to show a reduction in neural tube defects from 5% to 1%. Data from 106 women who were already pregnant at time of recruitment are also included. | |
| Risk of bias | ||
| Bias | Authors' judgement | Support for judgement |
| Adequate sequence generation? | Low risk | Block randomisation stratified by hospital site. |
| Allocation concealment? | Low risk | Consequtively numbered, opaque sealed envelopes used. |
| Blinding? | Low risk | Only participants were blinded. |
| Incomplete outcome data addressed? | Low risk | 3 women (1%) lost to follow‐up and excluded. Intention to treat analyses performed. |
| Free of selective reporting? | Unclear risk | Compliance data not reported. |
| Free of other bias? | High risk | The trial was stopped after there were poor recruitment rates and birth rates. |
| Methods | Randomised controlled trial of vitamin A, iron and folic acid supplementation versus iron and folic acid only, during pregnancy, to improve infant outcomes born to women infected with HIV in Malawi. Randomisation and allocation concealment: "treatment assignment was determined by use of a computer's random‐number generator" and "mothers were assigned an original study identification number at enrolment and were given the next sequentially numbered opaque bottle with supplements". "Treatment assignment was concealed by pre packing study supplements in sequentially numbered series assigned to study identification numbers." Blinding of outcome assessment: unclear, not specifically stated, but participants were blind to their treatment allocation. Documentation of exclusion: 63 (9%) women were lost to follow‐up and 14 (2%) pairs of twins were excluded. Use of placebo control: control tablets containing iron and folic acid were given. | |
| Participants | Pregnant women between 18 and 29 weeks' gestation and infected with HIV. The average gestation of participants was 23 weeks. 693 women were enrolled and allocated to either vitamin A (n = 340) or control (n = 357), of which pregnancy outcomes were known for 623 women. 63 women were lost to follow‐up and 14 sets of twins were excluded due to their higher risk of low birthweight and infant mortality. | |
| Interventions | All women received orally administered daily doses of 30 mg iron and 400 mcg folic acid during the study. Women in the intervention group received 10,000 IU vitamin A (3 mg retinol equivalent) orally, in addition to the iron and folic acid supplements. Women were asked to take the tablets from enrolments until delivery. Tablet counts were conducted every 4 weeks. All women received 30 mg retinol equivalents at 6 weeks postpartum, according to standard postpartum care in Malawi. | |
| Outcomes |
| |
| Notes | Women's risk of spontaneous and recurrent miscarriage is unclear, although may be increased due to their HIV status. | |
| Risk of bias | ||
| Bias | Authors' judgement | Support for judgement |
| Adequate sequence generation? | Low risk | Computer generated random number list. |
| Allocation concealment? | Low risk | Sequentially number opaque bottles used. |
| Blinding? | Unclear risk | Not specifically stated but women were blinded. |
| Incomplete outcome data addressed? | Unclear risk | 63 women (9%) lost to follow‐up and 14 pairs of twins (2%) excluded. No intention to treat analyses performed. |
| Free of selective reporting? | Low risk | All pre‐specified outcomes appear to be reported. |
| Free of other bias? | Unclear risk | Insufficient information to assess whether an important risk of other bias exists. |
| Methods | Randomisation and allocation concealment: third party randomisation, "randomisation was carried out through the Clinical Trials Service Unit in Oxford". Randomisation was stratified by centre. Blinding of outcome assessment: women, caregivers and study investigators were blinded to the treatment allocation. Documentation of exclusion: 164 women (9%) excluded. Use of placebo control: placebo control. | |
| Participants | 1817 women were recruited into the study. Women who had a previous pregnancy affected by a neural tube defect, and were planning another pregnancy and not already taking supplements were eligible for the study. Women whose affected child had Meckel's syndrome and those women with epilepsy were excluded. 1817 women were randomised to either F (n = 449), MV (n = 453), MF (n = 461) or P (n = 454), of which, 1195 were informative pregnancies that is, where the outcome of NTD or not was definitely known (F n = 298, MV n = 302, MF n = 295, P n = 300). Results for pregnancy loss are reported for both informative and not informative pregnancies. 164 women were excluded as they may have been pregnant at the time of randomisation. | |
| Interventions | Women were randomised into 1 of 4 groups:
Women took the tablets prior to conception and attended the site every 3 months to collect additional supplies and again during the 12th week of pregnancy. No special dietary advice was given to women. | |
| Outcomes |
| |
| Notes | The trial was stopped early after there were 1195 informative pregnancies, according to prespecified stopping rules. The aim of the study was to obtain information on at least 2000 informative pregnancies unless a sufficiently clear result emerged sooner. | |
| Risk of bias | ||
| Bias | Authors' judgement | Support for judgement |
| Adequate sequence generation? | Low risk | Third party randomisation, "randomisation was carried out through the Clinical Trials Service Unit in Oxford". |
| Allocation concealment? | Low risk | Third party randomisation, "randomisation was carried out through the Clinical Trials Service Unit in Oxford". |
| Blinding? | Low risk | Women, caregivers and investigators blinded to treatment allocation. |
| Incomplete outcome data addressed? | Low risk | 164 women (9%) excluded, intention‐to‐treat analyses performed. |
| Free of selective reporting? | Unclear risk | No information provided about any women randomised that did not become pregnant in the study period. |
| Free of other bias? | High risk | The trial was stopped early after there were 1195 informative pregnancies, according to prespecified stopping rules. |
| Methods | Randomisation and allocation concealment: One of the authors 'randomly allocated 1200 participant numbers by computer into two groups in permuted blocks of 50'. Every identification number was allocated a supplement container, which was then packed by a team member not otherwise involved in the trial. After enrolment, another author allocated participants sequential identification numbers with the corresponding supplement containers. Blinding of outcome assessment: double blind stated but no other details given. Documentation of exclusion: 61 women (5%) withdrew or were lost to follow‐up, however data on miscarriage were reported for those who withdrew due to miscarriage. Use of placebo control: control of iron and folic acid supplements given which looked identical to the intervention supplements. | |
| Participants | 1200 women were recruited into the study. Women were eligible if they were: less than 20 completed weeks, had a singleton pregnancy, no notable fetal abnormality, no existing maternal illness of a severity that could compromise the outcome of pregnancy, and lived in an area of Dhanusha or the adjoining district of Mahottari accessible for home visits. Maternal illnesses that led to exclusion were: recently treated recurrent cysticercosis, need for chlorpromazine or anticoagulant drugs with changing doses, and symptomatic mitral stenosis or multivalvular heart disease. Fetal exclusions were: twin pregnancies, anencephaly, occipital meningocele, encephalocele, duodenal atresia and a grossly dilated pelvicalyceal system. | |
| Interventions | Intervention group: vitamin A 800 µg, vitamin E 10 mg, vitamin D 5 µg, vitamin B1 1.4 mg, vitamin B2 1.4 mg, niacin 18 mg, vitamin B6 1.9 mg, vitamin B12 2.6 µg, folic acid 400µg, vitamin C 70 mg, iron 30 mg, zinc 15 mg, copper 2 mg, selenium 65 µg, and iodine 150 µg. Control group: iron 60 mg and folic acid 400 µg. Supplementation began at a minimum of 12 weeks’ gestation and continued until delivery. | |
| Outcomes |
| |
| Notes | Women's risk of spontaneous and recurrent miscarriage was unclear. Women's nutritional status is also unclear, however, women are presumable at high risk of under‐nutrition as the paper states that in Nepal 'deficiencies of several micronutrients have been well described in individual studies and in a national sample'. Intention to treat analyses performed. Compliance: Median 'adherence' was 98% in the control group and 97% in the intervention group. Location: Nepal. Timeframe: August 2002 to October 2003. | |
| Risk of bias | ||
| Bias | Authors' judgement | Support for judgement |
| Adequate sequence generation? | Low risk | Computer generated in permuted blocks of 50. |
| Allocation concealment? | Unclear risk | One of the authors allocated participants with sequential identification numbers, but unclear if this person was involved in the recruitment of participants. |
| Blinding? | Unclear risk | Double blind stated in the text but no other details given. |
| Incomplete outcome data addressed? | Low risk | 61 women (5%) withdrew or were lost to follow‐up, however data on miscarriage were reported for those who withdrew due to miscarriage. Intention‐to‐treat analyses performed. |
| Free of selective reporting? | Low risk | All pre‐specified outcomes appear to be reported. |
| Free of other bias? | Low risk | The study appears to be free of other sources of bias. |
| Methods | Randomisation and allocation concealment: "women enrolled at the antenatal clinic were divided into two main groups by placing them alternatively on separate lists". Blinding of outcome assessment: unclear, no information given on blinding of participants, carers or outcome assessors. Documentation of exclusion: 622 (11%) women were excluded. Use of placebo control: no placebo given. | |
| Participants | 5644 women were recruited into the study. All women attending the antenatal clinics and who were less than or equal to 24 weeks' gestation and who were in 'good health' were eligible for the study. Women who were more than 24 weeks' gestation and women who suffered from any disease or physical abnormality were excluded from the study. After enrolment, women who had twin births and who miscarried at an early stage were also excluded. | |
| Interventions | Women allocated to the treatment group were given daily vitamin C 100 mg, ferrous iron 0.26 g, calcium 0.26 g, minute quantities of iodine, manganese and copper, adsorbate of vitamin B1 containing all factors of the B complex and halibut liver oil 0.36 g containing vitamin A (52,000 IU per g) and vitamin D (2500 IU per g). | |
| Outcomes |
| |
| Notes | Women risk status for spontaneous and recurrent miscarriage is unclear. | |
| Risk of bias | ||
| Bias | Authors' judgement | Support for judgement |
| Adequate sequence generation? | High risk | Quasi‐randomistion using alternate separate lists. |
| Allocation concealment? | High risk | No allocation concealment. |
| Blinding? | Unclear risk | No information about blinding provided. |
| Incomplete outcome data addressed? | Unclear risk | 622 women (11%) excluded, intention to treat analyses not performed. |
| Free of selective reporting? | Unclear risk | Limited methodological details provided. |
| Free of other bias? | Unclear risk | Limited methodological details provided. |
| Methods | Randomisation and allocation concealment: the randomisation scheme was generated by a computer program in permuted blocks of 4. Randomisation numbers were sealed in opaque envelopes. At each inclusion, the consulting physician opened the next sealed envelope and transmitted the randomisation number to a pharmacist managing the allocation sequence and the packaging of drugs at a central location. Blinding of outcome assessment: the consulting physicians, pharmacist and women were blinded to allocation. Documentation of exclusions: 107 women were lost to follow‐up (however their pregnancy outcome was reported). Post randomisation 26 twins were excluded (multivitamin group: 15; iron/folic acid group: 11 twins (including one set of triplets). Only singleton pregnancies were included in the analysis because fetal loss and anthropometric measures at birth in multiple pregnancies are not primarily nutrition related. 3 women died before delivery and 1 woman underwent a therapeutic abortion. | |
| Participants | 1374 women were recruited to participate, however 52 women were randomly assigned twice for consecutive pregnancies, resulting in data for 1426 pregnancies. Women had a pregnancy confirmed by urine testing and were randomly assigned to receive either IFA (n = 712) or UNIMMAP (n = 714) daily until 3 months after delivery. Women were recruited between 5 to 36 weeks’ gestation; 34.6% (n = 493) of the participants were recruited in the first trimester of pregnancy, mean gestational age at enrolment was 17.3 weeks (SD 7.8 wk). | |
| Interventions | UNIMMAP: vitamin A 800 µg, Vitamin D 200 IU, Vitamin E 10 mg, Vitamin B‐1 1.4 mg, Vitamin B‐2 1.4 mg, Niacin 18 mg, Folic acid 400 µg, Vitamin B‐6 1.9 mg, Vitamin B‐12 2.6 µg, Vitamin C 70 mg, Zinc 15 mg, Iron 30 mg, Copper 2 mg, Selenium 65 µg, Iodine150 µg. IFA (control): folic acid 400 µg, Iron 60 mg. In a case of maternal illness, appropriate treatments were provided according to national guidelines. Severely anaemic women (haemoglobin < 70 g/L, without dyspnoea) received ferrous sulphate (200 mg) + folic acid (0.25 mg) twice daily, for 3 months, regardless of their allocation group. All participants also received 400 mg albendazole in the second and third trimesters. If malaria occurred despite chemoprophylaxis, quinine (300 mg, 3 times/day) was given for 5 days. Vitamin A (200,000 IU) was given to all women after delivery, in accordance with national recommendations. | |
| Outcomes |
| |
| Notes | Women's risk of spontaneous and recurrent miscarriage was unclear. 18% of women in each group had experienced a previous fetal loss. Women's nutritional status is unclear, although women are presumable at risk as the purpose of the trial is to correct multiple micronutrient deficiencies. Intention to treat analyses not performed, however the review included details of losses to follow‐up where the outcome was known. Compliance: unclear, states that there was no difference in compliance between the two groups. Location: Burkino Faso. Timeframe: March 2004 to October 2006. | |
| Risk of bias | ||
| Bias | Authors' judgement | Support for judgement |
| Adequate sequence generation? | Low risk | Computer generated with permuted blocks of 4. |
| Allocation concealment? | Low risk | Randomization numbers were kept in sealed opaque envelopes. |
| Blinding? | Low risk | Consulting physicians, pharmacist and women were blinded to the intervention. |
| Incomplete outcome data addressed? | High risk | Data were reported for singletons only. |
| Free of selective reporting? | Unclear risk | As above ‐ data only reported for singletons. |
| Free of other bias? | High risk | Some women were pregnant more than once during the study period, however the denominators reported are the total number of pregnancies during the study period, not the total number of women randomised, which incorrectly assumes that each data point included is independent from the next. |
| Methods | Randomisation and allocation concealment: computer generated random number list with balanced variable blocks and stratification for collaborating centre and gestational age (< 18 weeks vs 18 weeks or more), allocation occurred via a central telephone randomisation service. The treatment packs contained four sealed, opaque, white plastic bottles of either the antioxidants vitamin C and vitamin E or the placebo and were prepared by a researcher not involved in recruitment or clinical care. Blinding of outcome assessment: women, caregivers and investigators were blinded to allocation. Documentation of exclusion: no losses to follow‐up. Use of placebo control: placebo given. | |
| Participants | 1877 women were recruited into the study. Eligible women included those: with a nulliparous singleton pregnancy, between 14 and 22 weeks of gestation and with normal blood pressure at the first measurement in pregnancy and again at trial entry. Women who had any of the following were excluded: known multiple pregnancy, known potentially lethal fetal anomaly, known thrombophilia, chronic renal failure, antihypertensive therapy, or specific contraindications to vitamin C or E therapy such as haemochromatosis or anticoagulant therapy. Women were allocated to the vitamin C and E group (n = 935) or placebo (n = 935). | |
| Interventions | Women allocated to the vitamin C and E group took four coated tablets of a combination of 250 mg of vitamin C (as ascorbic acid) and 100 IU of vitamin E (as d‐alpha‐tocopherol succinate) each day from trial entry until delivery (total daily dose of vitamin C: 1000 mg; vitamin E: 400 IU). Women were advised not to take any other antioxidant supplements, although a multivitamin preparation that provided a daily intake of no more than 200 mg of vitamin C or 50 IU of vitamin E was permitted. | |
| Outcomes |
| |
| Notes | Women were at low risk of spontaneous and recurrent miscarriage based on the review criteria. The majority of women participating had a baseline dietary intake of vitamin C and E above the Australian recommended daily amount. Intention to treat analyses performed. Compliance: There was no difference in compliance between the vitamin group (67%) and the placebo group (70%). Location: Australia. Timeframe: December 2001 and January 2005. | |
| Risk of bias | ||
| Bias | Authors' judgement | Support for judgement |
| Adequate sequence generation? | Low risk | Computer generated random number list. |
| Allocation concealment? | Low risk | Allocation occurred via a central telephone randomisation service. Tablets were provided in sealed opaque bottles. |
| Blinding? | Low risk | Women, caregivers and investigators were blinded. |
| Incomplete outcome data addressed? | Low risk | No losses to follow‐up. |
| Free of selective reporting? | Low risk | All pre‐specified outcomes reported. |
| Free of other bias? | Low risk | The study appears to be free of other sources of bias. |
| Methods | Generation of random number sequence: a computer generated random number sequence. Randomisation and allocation concealment: central allocation (randomisation by an independent third party who had no conflict of interest in the study). Blinding of outcome assessment: treatment allocations were blinded to both the investigator and the patient until the study was finished. Documentation of exclusion: none reported. Use of placebo control: no, comparisons were between antioxidants versus iron and folic acid. | |
| Participants | 60 women between 8 and 12 weeks gestation were eligible for randomisation (supplementation group: n = 29; folic acid group: n = 31). Setting: at the antenatal clinic of the Department of Obstetrics and Gynecology, University of Indonesia between March 2003 and June 2004. Eligibility criteria: pregnant women with low antioxidant status. Exclusion criteria:
| |
| Interventions | Supplementation group: received antioxidant supplements daily ‐ vitamins A (1000 IU), B6 (2.2 mg), B12 (2.2 ug), C (200 mg), E (400 IU), folic acid (400 ug), N‐acetylcysteine (200 mg), Cu (2 mg), Zn (15 mg), Mn (0.5 mg), Fe (30 mg), calcium (800 mg), and selenium (100 ug). Folic acid group: received Fe 30 mg and folic acid 400 ug daily. Timing of the intervention: early pregnancy (8 to 12 weeks). | |
| Outcomes |
| |
| Notes | Women's risk of spontaneous and recurrent miscarriage was unclear. Participating women had low antioxidant status at enrolment, as defined as superoxidedismutase level below 164U/mL. No nutritional information provided. Intention to treat analyses performed. Compliance: unclear, no information reported. Location: Indonesia. Timeframe: March 2003 and June 2004. | |
| Risk of bias | ||
| Bias | Authors' judgement | Support for judgement |
| Adequate sequence generation? | Low risk | Computer generated random number sequence. |
| Allocation concealment? | Low risk | Central allocation (randomisation by an independent third party who had no conflict of interest in the study). |
| Blinding? | Low risk | Treatment allocations were blinded to both the investigator and the patient until the study was finished. |
| Incomplete outcome data addressed? | Low risk | No missing data. |
| Free of selective reporting? | Low risk | All pre‐specified outcomes were reported, no apparent evidence of selective reporting. |
| Free of other bias? | Unclear risk | At baseline, the control group appears to have a 2 mmHg higher systolic blood pressure than the intervention group, this figure was of borderline statistical significance, P = 0.059. |
| Methods | Randomisation and allocation concealment: unclear, women were allocated to groups based on "random assignment". Randomisation was stratified on pre‐pregnancy weight, weight gain during pregnancy, previous low birthweight infant and protein intake. No other methodological details given. Blinding of outcome assessment: unclear, women were allocated to 2 forms of treatment or control, where both treatments were given as a canned beverage and the control group were given standard oral multivitamins. No information is given on blinding of outcome assessors. Documentation of exclusion: 237 women (22%) were excluded. Use of placebo control: no placebo, the control group received standard prenatal multivitamin supplements. | |
| Participants | 1051 women were recruited into the study. Women eligible were black, English speaking, and not greater than 30 weeks' gestation. They also had one of the following criteria: low pre‐pregnant weight (under 110 pounds at conception); low weight gain at the time of recruitment; at least 1 previous low birthweight infant; a history of protein intake of less than 50 g in the 24 hours preceding recruitment. Women were not eligible if they were known to be seeking a termination, had specific chronic health disorders, if they admitted to recent use of narcotics or heavy use of alcohol, or weighed >= 140 pounds at conception. | |
| Interventions | Women were randomised to 1 of 3 groups:
Women received the high protein or balanced protein‐energy supplements in the format of a drink. Women in the control group received a standard oral prenatal multivitamin supplement. | |
| Outcomes |
| |
| Notes | Women's risk of spontaneous and recurrent miscarriage is unclear, as there is no information about concurrent medical conditions or other risk factors for miscarriage. Women in the trial had a low caloric intake at trial entry, and unexpectedly, an adequate protein intake. No other specific nutritional information is reported. | |
| Risk of bias | ||
| Bias | Authors' judgement | Support for judgement |
| Adequate sequence generation? | Unclear risk | No methodological details given beyond reporting of 'random assignment'. |
| Allocation concealment? | Unclear risk | No methodological details given beyond reporting of 'random assignment'. |
| Blinding? | Unclear risk | Unlkely as women were given canned beverages or multivitamins. |
| Incomplete outcome data addressed? | Unclear risk | 237 women (22%) excluded, no intention to treat analysis. |
| Free of selective reporting? | Unclear risk | Unclear if all pre‐specified outcomes reported. |
| Free of other bias? | Unclear risk | Limited methodological details provided. |
| Methods | Randomisation and allocation concealment: unclear, women were "randomly assigned on an individual basis, to double‐blind, weekly supplementation until delivery". Blinding of outcome assessment: unclear, double blind stated in text but no details given. Documentation of exclusion: 42 women (17%) were lost to follow‐up and excluded. Use of placebo control: control tablets containing iron and folic acid were given. | |
| Participants | 243 women were recruited into this study. Pregnant women between 16 and 20 weeks' gestation, aged between 17 and 35 years old, with a parity < 6 and haemoglobin level between 80‐140 g/l, were eligible for this study. Women were randomised to receive either vitamin A plus iron and folic acid (n = 122) or iron and folic acid only (n = 121). Of these 22 (18%) and 20 (17%) women in vitamin A plus iron and folic acid and the iron and folic acid groups respectively, dropped out between enrolment and the follow‐up at 4 months. | |
| Interventions | Women were randomised to a weekly supplementation with 120 mg ferrous sulfate and 500 mcg folic acid, with or without vitamin A (2400 retinol equivalents). Women were asked to take the trial tablets from between 16 and 20 weeks' gestation until birth. | |
| Outcomes | 1. Stillbirth. | |
| Notes | Women risk status for spontaneous and recurrent miscarriage is unclear. | |
| Risk of bias | ||
| Bias | Authors' judgement | Support for judgement |
| Adequate sequence generation? | Unclear risk | No information provided about sequence generation. |
| Allocation concealment? | Unclear risk | Women were 'randomly assigned on an individual basis' but no other details given. |
| Blinding? | Unclear risk | Double blind used in the text but not details provided. |
| Incomplete outcome data addressed? | Unclear risk | 42 women (17%) were lost to follow‐up and excluded, no intention to treat analyses performed. |
| Free of selective reporting? | High risk | Serial publications of this study report different denominators. |
| Free of other bias? | Unclear risk | Limited methodological details provided. |
| Methods | Generation of random number sequence: the randomisation sequence was constructed by the data coordinating centre (DCC) as permuted blocks of random size, stratified by clinical centre, and implemented via a program residing on the clinical centres study computer. Randomisation and allocation concealment: central allocation. Blinding of outcome assessment: all clinicians and clinical investigators were blinded to group assignment. Documentation of exclusion: none reported. Use of placebo control: placebo control. | |
| Participants | 739 eligible women between 120/7 and 196/7 weeks of gestation were enrolled in the study (treatment: 371; placebo: 368). Setting: four Brazilian clinical centres: one primary clinical centre (Recife) and 3 additional clinical sites (Campinas, Botucatu, and Porto Alegre); each site’s major teaching hospital serves a primarily urban low‐income population. Eligibility criteria: women between 120/7 and 196/7 weeks of gestation and diagnosed with nonproteinuric chronic hypertension or a prior history of pre‐eclampsia in their most recent pregnancy that progressed beyond 20 weeks' gestation. Exclusion criteria:multifetal gestation, allergy to vitamin C or vitamin E, requirement for aspirin or anticoagulant medication, 24‐hour urinary protein ≥ 300 mg, pre‐pregnancy diabetes mellitus, known fetal anomaly incompatible with life. Loss to follow‐up: 32 women (treatment 16; placebo 16). | |
| Interventions | Intervention group: daily treatment with both vitamin C (1000 mg) and E (400 IU) until delivery or until the diagnosis of pre‐eclampsia. Control group: daily placebo until delivery or until the diagnosis of pre‐eclampsia. Timing of the intervention: between 120/7 and 196/7 weeks of gestation. | |
| Outcomes |
| |
| Notes | 25 inclusion/exclusion criteria violations (23 enrolled outside 12‐19 weeks’ gestation; 2 twin gestations ‐ one lost to spontaneous abortions, one delivered liveborn in treatment group); all 25 women remained in their assigned study groups. 26 women had early treatment terminations (treatment 19; placebo 7), but remained in follow‐up. Women's risk of spontaneous and recurrent miscarriage was unclear. Women's nutritional status is also unclear. Intention to treat analyses performed. Compliance: average compliance was 85%, and similar between treatment groups. Location: Brazil. Timeframe: July 2, 2003 and November 23, 2006. | |
| Risk of bias | ||
| Bias | Authors' judgement | Support for judgement |
| Adequate sequence generation? | Low risk | Computer generated sequence number. |
| Allocation concealment? | Low risk | Central allocation. |
| Blinding? | Low risk | All clinicians and clinical investigators were blinded to group assignment. |
| Incomplete outcome data addressed? | Low risk | Small numbers of missing data, balanced across groups (32 women; treatment 16; placebo 16). |
| Free of selective reporting? | Low risk | All pre‐specified outcomes were reported, no apparent evidence of selective reporting. |
| Free of other bias? | Low risk | The study appears to be free of other sources of bias. |
| Methods | Randomisation and allocation concealment: "randomisation was undertaken by computer‐generated numbers". Roche Pharmaceutical supplied numbered containers with either vitamin C or matching placebo, and they retained the study code until completion of the study. No other methodological details given. Blinding of outcome assessment: "double blind" stated, Roche Pharmaceuticals retained the code until completion of the study. Documentation of exclusion: none reported. Use of placebo control: placebo control. | |
| Participants | 200 women were recruited into the study. Women with a history of a previous mid‐trimester abortion (defined as spontaneous expulsion of the uterine contents between 13 and 26 weeks' gestational age), or previous preterm labour, and less than 26 weeks' gestation were eligible and invited to participate. Women with iatrogenic causes of their previous preterm labour such as previous induction of labour before term for severe pre‐eclampsia, were excluded. 203 consecutive women were approached, of which 200 (98.5%) consented and were randomised to either vitamin C (n = 100) or placebo (n = 100). No losses to follow‐up were reported. | |
| Interventions | Twice daily tablet of either 250 mg vitamin C or placebo, from trial entry until 34 weeks' gestation. All women were tested for bacterial vaginosis and all women with positive cultures for Mycoplasma hominis (and between 22 and 32 weeks' gestation) were treated with erythromycin for 7 days. | |
| Outcomes |
The age of fetal viability was considered to be 28 weeks' gestation. | |
| Notes | Results are from an interim analysis performed when 100 participants were recruited into each arm. Recruitment was stopped after the interim analysis revealed few differences between the two groups. Unclear if there was a sample‐size calculation performed. Women's risk profile spontaneous and recurrent miscarriage is unclear, although they are clearly at high risk of preterm birth. It is also unclear if multiple births were included. | |
| Risk of bias | ||
| Bias | Authors' judgement | Support for judgement |
| Adequate sequence generation? | Low risk | Computer generated sequence number. |
| Allocation concealment? | Low risk | Roche pharmaceuticals supplied numbered study containers and kept the study code until completion of the study. |
| Blinding? | Unclear risk | Double blind stated in the text but not details given. |
| Incomplete outcome data addressed? | Low risk | No losses to follow‐up reported. |
| Free of selective reporting? | Unclear risk | Recruitment stopped after an interim analysis. |
| Free of other bias? | High risk | Results are from an interim analysis performed when 100 participants were recruited into each arm. |
| Methods | Generation of random number sequence: not reported. Randomisation and allocation concealment: women were randomised, no further details given. Blinding of outcome assessment: not reported. Documentation of exclusion: no losses to follow‐up reported, however three women were delivered before 37 weeks and were therefore excluded from the study. Use of placebo control: no. | |
| Participants | 48 healthy pregnant women at 12 weeks' gestation (intervention group: 21; control group: 24). Eligibility criteria: healthy pregnant women with no adverse medical or obstetric history. Loss to follow‐up: no. | |
| Interventions | Intervention group: 325 mg of ferrous sulphate and 350 µg of folic acid to be taken daily throughout the remainder of pregnancy. Control group: the women in non‐therapy group were not given any supplements. Timing of the intervention: from 12 weeks' gestation until delivery. | |
| Outcomes |
| |
| Notes | Women's risk of spontaneous and recurrent miscarriage was unclear. Women's nutritional status is also unclear. Intention to treat analyses: no, 3 women excluded. Compliance: unclear, no information reported. Location: Scotland. Timeframe: unclear. | |
| Risk of bias | ||
| Bias | Authors' judgement | Support for judgement |
| Adequate sequence generation? | Unclear risk | Not reported. |
| Allocation concealment? | Unclear risk | Women were randomised, no further details given. |
| Blinding? | Unclear risk | Not reported. |
| Incomplete outcome data addressed? | Low risk | No missing data; three women were delivered before 37 weeks and were therefore excluded from the study. |
| Free of selective reporting? | Low risk | All pre‐specified outcomes were reported, no apparent evidence of selective reporting. |
| Free of other bias? | Unclear risk | Limited methodological details provided. |
| Methods | Generation of random number sequence: computer‐generated number; 262 clustered unit of randomisations (all pregnant women served by the same midwife received supplements with the same midwife identification number). Randomisation and allocation concealment: central allocation. Blinding of outcome assessment: all study scientists and personnel, government staff, and enrollees were unaware of the allocation. Documentation of exclusion: 1748 loss to follow‐up before delivery (IFA: 853; MMN: 895); 1128 loss to follow‐up after delivery (IFA: 553; MMN: 575). 10,549 pregnant women excluded post‐randomisation because of trial termination (IFA group: 5057; MMN group: 5492). Use of placebo control: no placebo, comparisons were between multiple micronutrients and iron and folic acid. | |
| Participants | 41,839 pregnant women of any gestational age living on Lombok, Nusa Tenggara Barat Province, Indonesia. Women were allocated to iron and folic acid (n = 20,543) or multiple micronutrient (n = 21,296). | |
| Interventions | MMN group: the MMN was the UNIMMAP formulation containing 30 mg iron (ferrous fumarate) and 400 ug folic acid along with 800 ug retinol (retinyl acetate), 200 IU vitamin D (ergocalciferol), 10 mg vitamin E (alpha tocopherol acetate), 70 mg ascorbic acid, 1.4 mg vitamin B1 (thiamine mononitrate), 18 mg niacin (niacinanide), 1.9 mg vitamin B6 (pyridoxine), 2.6 ug vitamin B12 (cyanocobalamin), 15 mg zinc (zinc gluconate), 2 mg copper, 65 ug selenium, and 150 ug iodine ‐ one capsule daily up to 3 months after birth. IFA group: the IFA contained 30 mg iron (ferrous fumarate) and 400 ug folic acid ‐ one capsule daily up to 3 months after birth. Timing of the intervention: any time during pregnancy. | |
| Outcomes |
| |
| Notes | Women's risk of spontaneous and recurrent miscarriage was unclear. Women's nutritional status is also unclear. However, 30% of women in each group had an mid upper arm circumference < 23.5cm, which was used as an indicator of women being undernourished. Intention to treat analyses performed. Compliance: median compliance was 85%, there was no difference between treatment groups in compliance. Location: Indonesia. Timeframe: July 1, 2001, and April 1, 2004. | |
| Risk of bias | ||
| Bias | Authors' judgement | Support for judgement |
| Adequate sequence generation? | Low risk | Computer generated number. |
| Allocation concealment? | Low risk | Central allocation. |
| Blinding? | Low risk | All study scientists and personnel, government staff, and enrollees were unaware of the allocation. |
| Incomplete outcome data addressed? | High risk | Loss to follow‐up: 1748 loss to follow‐up before delivery (IFA: 853; MMN: 895); 1128 loss to follow‐up after delivery (IFA: 553; MMN: 575). Post‐randomisation exclusion: 10,549 pregnant women excluded because of trial termination (IFA group: 5057; MMN group: 5492). |
| Free of selective reporting? | Low risk | All pre‐specified outcomes were reported, no apparent evidence of selective reporting. |
| Free of other bias? | Low risk | The study appears to be free of other sources of bias. |
| Methods | Generation of random number sequence: using a random‐generation procedure. Randomisation and allocation concealment: the supplements in vitamin A and placebo treatments allocated were prepared in identical capsules and were packaged in bottles according to the randomisation schedule (sealed envelopes) by midwives who were not involved in the trial conduct. Blinding of outcome assessment: neither the women nor the midwives involved in treatment allocation revealed the randomisation schedule to anyone involved in the conduct of the trial. Documentation of exclusion: 77 loss to follow‐up before assessment at 26‐28 weeks (5000 IU vitamin A: 26; 10,000 IU vitamin A: 26; placebo: 25). Additional 93 loss to follow‐up before assessment at 36‐38 weeks (5000 IU vitamin A: 34; 10,000 IU vitamin A: 28; placebo: 31). Use of placebo control: placebo control. | |
| Participants | Seven hundred women with singleton pregnancies at 12‐24 weeks gestation measured by ultrasound scan (5000 IU vitamin A: 234; 10,000 IU vitamin A: 234; placebo: 232). Setting: the antenatal clinic at the Namitambo rural Health Centre in southern Malawi, central Africa. Eligibility criteria: (Hb) < 11.0 g/dl by HemoCue screening method at first antenatal visit, singleton pregnancy with gestational age > 12 weeks and ≤ 24 weeks measured by ultrasound scan, no fetal abnormality detectable by ultrasound at time of booking, residing in the catchment area of the health centre. Exclusion criteria: women > 24 weeks' gestation, or twin pregnancy. | |
| Interventions |
Timing of the intervention: supplementation started as early as possible after 12 weeks of pregnancy. All women received iron tablets daily (60 mg elemental iron as ferrous sulphate with 0.25 mg folic acid). | |
| Outcomes |
| |
| Notes | Women's risk of spontaneous and recurrent miscarriage was unclear. Women's nutritional status is also unclear. Intention to treat analyses performed. Compliance: unclear, no information provided. Location: Malawi. Timeframe: April 1997 and July 1999. | |
| Risk of bias | ||
| Bias | Authors' judgement | Support for judgement |
| Adequate sequence generation? | Low risk | Random‐generation procedure used. |
| Allocation concealment? | Low risk | The vitamin A and placebo treatments allocated were prepared in identical capsules and packaged in bottles according to the randomisation schedule (sealed envelopes) by midwives who were not involved in the trial conduct. |
| Blinding? | Low risk | Neither the women nor the midwives involved in treatment allocation revealed the randomisation schedule to anyone involved in the conduct of the trial. |
| Incomplete outcome data addressed? | High risk | 77 loss to follow‐up before assessment at 26‐28 weeks (5000 IU vitamin A: 26; 10,000 IU vitamin A: 26; placebo: 25). Additional 93 loss to follow‐up before assessment at 36‐38 weeks (5000 IU vitamin A: 34; 10,000 IU vitamin A: 28; placebo: 31). |
| Free of selective reporting? | Low risk | All pre‐specified outcomes were reported, no apparent evidence of selective reporting. |
| Free of other bias? | Low risk | The study appears to be free of other sources of bias. |
| Methods | Generation of random number sequence: no sequence generation details available. Randomisation and allocation concealment: central allocation (randomisation was performed by the statisticians of the British VIP Trial). Blinding of outcome assessment: "double blind" stated. Documentation of exclusion: 10 women (treatment 6; placebo 4), and 29 infants (treatment 13, placebo 16) were lost to follow‐up. Use of placebo control: placebo control. | |
| Participants | 1365 women between14‐22 gestational age agreed to participate and were randomised (vitamins group: 687; placebo group: 678). Setting: antenatal clinics located in Nagpur, India; Lima and Trujillo, Peru; Cape Town, South Africa; and Ho Chi Minh City, Viet Nam which served populations with low social‐economic status and had evidence of overall low nutritional status, between October 2004 and December 2006. Eligibility criteria: pregnant women considered high risk for pre‐eclampsia (chronic hypertension, renal disease, pre‐eclampsia‐eclampsia in the pregnancy preceding the index pregnancy requiring delivery before 37 weeks’ gestation, HELLP syndrome in any previous pregnancy, pre‐gestational diabetes, primiparous with a body mass index > 30 kg/m2, history of medically indicated preterm delivery, abnormal uterine artery Doppler waveforms and women with antiphospholipid syndrome), multifetal gestation. Women ingesting medications with aspirin‐like compounds were not excluded. Exclusion criteria: women ingesting vitamin supplements that contained ≥ 200 mg of vitamin C and/or ≥ 50 IU of vitamin E and women receiving warfarin. | |
| Interventions | Intervention group: received 1000 mg vitamin C and 400 IU of vitamin E daily until delivery. Comparison group: received placebo daily until delivery. Timing of the intervention: between 14 and 22 weeks' gestation. | |
| Outcomes |
Pre‐eclampsia information was unavailable for 14 women in the vitamins and 9 in the placebo group. There were data from 81 supplemented (11.8%) and 100 placebo‐treated (14.7%) women with multiple pregnancies, for whom newborn outcomes were considered separately. | |
| Notes | Women's risk of spontaneous and recurrent miscarriage was unclear. Women at high risk of pre‐eclampsia were included but data on fetal loss was not reported separately for this group. No specific information on women's nutritional status is included; however, the paper states that the trial was conducted in populations with 'documented low nutritional status'. Intention to treat analyses performed. Compliance: Median compliance was 87%, and was similar between the treatment groups. Location: Antenatal clinics in India, Peru, South Africa and Viet Nam. Timeframe: October 2004 and December 2006. | |
| Risk of bias | ||
| Bias | Authors' judgement | Support for judgement |
| Adequate sequence generation? | Low risk | Randomisation sequence blocked by centre in groups of 2 to ten10 individuals. |
| Allocation concealment? | Low risk | Central allocation (randomisation was performed by the statisticians of the British VIP Trial). |
| Blinding? | Low risk | Women and investigators blinded to allocation. |
| Incomplete outcome data addressed? | Low risk | Small numbers of missing data, balanced across groups. Women: 10 (treatment 6; placebo 4). Infants: 29 (treatment 13; placebo 16). |
| Free of selective reporting? | Unclear risk | Perinatal death was reported instead of pre‐specified neonatal death. |
| Free of other bias? | Low risk | The study appears to be free of other sources of bias. |
d: day
F: folic acid
HbCC: haemoglobin C disease
HbSc:haemoglobin SC disease
HbSS: haemoglobin sickle cell disease
HELLP syndrome: haemolysis, elevated liver enzymes, low platelet count syndrome
HIV‐1: Human Immunodeficiency Virus‐1
HOFPP: Hungarian Optimal Family Planning Programme
IQR: interquartile range
IFA: iron and folic acid
IU: international units
IVF‐ET: in vitro fertilization and embryo transfer
mcg: micrograms
mg/mL: milligrams per millilitre
MF: multivitamins with folic acid
mg: milligrams
MMN: multiple micronutrient
MRDR: modified relative dose‐response
MV: multivitamins without folic acid
MRC: Medical Research Council
NTD: neural tube defect
P: progesterone
PAI‐1: plasminogen activator inhibitor‐1
PAI‐2: plasminogen activator inhibitor‐2
PCV: packed cell volume
UK: United Kingdom
UNIMMAP: United Nations International Multiple Micronutrient Preparation
USA: United States of America
WBC: white blood cell
wk: week
Characteristics of excluded studies [ordered by study ID]
| Study | Reason for exclusion |
| Onset of supplementation was > 20 weeks' gestation. | |
| Unclear of the gestational age at which women entered the trial. | |
| Onset of supplementation was > 20 weeks' gestation. | |
| Onset of supplementation was > 20 weeks' gestation. | |
| Onset of supplementation was > 20 weeks' gestation. | |
| Onset of supplementation was > 20 weeks' gestation. | |
| Onset of supplementation was > 20 weeks' gestation. | |
| Onset of supplementation was > 20 weeks' gestation. | |
| Only 24 (9%) of the 269 women in the trial began to participate before 15 weeks' gestation and outcomes not reported separately according to gestation at enrolment. | |
| Onset of supplementation was 20 or more weeks' gestation. | |
| No inclusion/exclusion criteria reported, unclear of gestational age at enrolment to the study, reports combined outcomes for "antepartum and threatened or complete abortion" and "stillbirth or neonatal death or congenital malformation" (not reported separately). | |
| Onset of supplementation was > 20 weeks' gestation for a large proportion of the participants. | |
| Unclear of the gestational age at which women entered the trial. | |
| No main outcomes reported. | |
| No main outcomes reported. | |
| All women received a multivitamin in addition to the zinc supplement or placebo. | |
| Both groups received a multivitamin supplement (same vitamin content in each group). | |
| No main outcomes or pregnancy loss outcomes reported. Miscarriage reported in those women where there was a neural tube defect, but not in all women according to treatment group. | |
| No main outcomes reported. | |
| Unclear gestational age at enrolment, 5 women were excluded due to abortion, premature labour, inadequate dietary records or missing more than 3 prenatal visits. Exclusions were not reported by group allocation. Outcomes related to maternal and fetal plasma levels of pyridoxal 5'‐phosphate and coenzyme saturation of aspartate aminotransferase and alanine aminotransferase in maternal erthrocytes were reported. | |
| Onset of supplementation was > 20 weeks' gestation. | |
| No clinical outcomes reported. | |
| Onset of supplementation was > 20 weeks' gestation. | |
| No main outcome reported. | |
| No main outcomes reported. | |
| Onset of supplementation was > 20 weeks' gestation. | |
| Unclear about content of vitamin supplements. | |
| Unclear of gestation at enrolment to the trial. | |
| No main outcomes reported. | |
| Both groups received a multivitamin (same vitamin content in both groups). | |
| Non‐randomised study of periconceptional multivitamin supplementation for the prevention of neural tube defects. | |
| No main outcomes reported. | |
| No main outcomes reported. | |
| No main outcomes reported. | |
| Unclear of gestation at enrolment to the trial. | |
| Non‐randomised study. | |
| No main outcomes reported. | |
| No main outcomes reported. |
Characteristics of studies awaiting assessment [ordered by study ID]
| Methods | Unlcear. |
| Participants | 138 pregnant women recruited from the Mother and Child Institute Hospital, Warsaw, Poland. Inclusion criteria included: maternal good health, no smoking, normal pregnancy, no vitamin and mineral supplementation prior to 12 weeks' gestation, and no fetal development defects. |
| Interventions | Women took either the VIBOVIT®mama preparation or a placebo from 12 weeks' gestation until delivery. The VIBOVIT®mama preparation consisted of: vitamin D (400 IU), vitamin A (2000 IU), beta‐carotene (3000 mcg), vitamin E (18 IU), zinc (15 mg), copper (2 mg) and selenium (20 mcg). |
| Outcomes | Lipid peroxidation and activity of superoxide dismutase and selenium‐dependent glutathione peroxidase in blood samples taken from the mother and the cord blood of the infant. |
| Notes | Translated from Polish. Appears to be the same study as the Kubik 2004 paper, but reporting biochemical outcomes. |
| Methods | Unclear. |
| Participants | Unclear. |
| Interventions | Unclear. |
| Outcomes | Unclear. |
| Notes | A copy of the paper could not be located. |
| Methods | Unclear, described in the abstract as: "healthy pregnant women were divided by a double blinded trial into a test group taking vitamin and mineral supplementation and a control group taking placebo". |
| Participants | 138 pregnant women recruited from the Mother and Child Institute Hospital, Warsaw, Poland. Inclusion criteria included: maternal good health, no smoking, normal pregnancy, no vitamin and mineral supplementation prior to 12 weeks' gestation, and no fetal development defects. |
| Interventions | Women took either the VIBOVIT®mama preparation or a placebo from 12 weeks' gestation until delivery. States in the abstract that women took a vitamin and mineral supplement (VIBOVIT®mama) which contained zinc (15 mg), copper (2 mg) and selenium (20 mcg). |
| Outcomes | Pregnancy induced hypertension, mode of birth, birthweight, Apgar scores, and other outcomes related to the 'course of pregnancy and delivery', biochemical measures of antioxidant status. |
| Notes | Translated from Polish. Actual numbers are not presentation, only %, and it is unclear how many women were allocated to each group at the onset of the study. |
Characteristics of ongoing studies [ordered by study ID]
| Trial name or title | Mumbai Maternal Diet Study: randomised controlled trial of micronutrient‐dense food before and during pregnancy to prevent low birthweight. |
| Methods | Randomised controlled trial. |
| Participants | Inclusion criteria:
Exclusion criteria:
|
| Interventions | Women who are not pregnant, but are planning to have further children, will be recruited and randomised to one of four groups, to receive one of two interventions: a daily food‐based supplement made from vegetables, fruit, and milk, of differing micronutrient content. Supplementation will be supervised. Field staff will record menstrual dates, in order to detect pregnancy as early as possible. Women who become pregnant will have investigations during pregnancy, including blood samples and ultrasound scans. |
| Outcomes |
|
| Starting date | 09/01/2006. |
| Contact information | Dr Caroline Fall MRC Epidemiology Resource Centre |
| Notes | Anticipated end date: 31/03/2010, listed as completed. |
| Trial name or title | The effect of antioxidant supplementation on women with threatened miscarriage. |
| Methods | Randomised controlled trial. |
| Participants | 580 women who present with first trimester bleeding. |
| Interventions | Vitamin C 1000 mg and Vitamin E 400 IU |
| Outcomes |
|
| Starting date | 01/03/2004. |
| Contact information | Dr Jemma Johns UCLH/UCL Research & Development Governance Committee |
| Notes | Listed as completed. |
| Trial name or title | Vitamin C and E Supplementation in Pregnant Women With Low Antioxidant Status. |
| Methods | Randomised controlled trial. |
| Participants | Pregnant women with low antioxidant status at 10‐12 weeks gestation age. Inclusion criteria:
Exclusion criteria:
|
| Interventions | Vitamin C 1000 mg and E 400 IU versus placebo. |
| Outcomes |
|
| Starting date | October 2006. |
| Contact information | Akihiko Sekizawa, MD, PhD Showa University School of Medicine |
| Notes | Listed as completed, last updated February 16th, 2010. |
Data and analyses
| Outcome or subgroup title | No. of studies | No. of participants | Statistical method | Effect size |
| 1 Total fetal loss (including miscarriages or combined miscarriages and stillbirths) Show forest plot | 13 | 33943 | Relative risk (Fixed, 95% CI) | 1.04 [0.95, 1.14] |
| Analysis 1.1  Comparison 1 Any vitamins versus no vitamins (or minimal vitamins), Outcome 1 Total fetal loss (including miscarriages or combined miscarriages and stillbirths). | ||||
| 1.1 Trial entry before pregnancy | 5 | 25182 | Relative risk (Fixed, 95% CI) | 1.06 [0.96, 1.17] |
| 1.2 Trial entry < 12 weeks' gestation | 1 | 406 | Relative risk (Fixed, 95% CI) | 1.32 [0.63, 2.77] |
| 1.3 Trial entry >= 12 weeks' and < 20 weeks' gestation | 1 | 739 | Relative risk (Fixed, 95% CI) | 0.84 [0.38, 1.85] |
| 1.4 Trial entry 'mixed' both < 20 and >= 20 weeks' gestation | 6 | 7616 | Relative risk (Fixed, 95% CI) | 0.89 [0.66, 1.20] |
| 2 Early or late miscarriage Show forest plot | 10 | 11266 | Risk Ratio (M‐H, Fixed, 95% CI) | 1.09 [0.95, 1.25] |
| Analysis 1.2  Comparison 1 Any vitamins versus no vitamins (or minimal vitamins), Outcome 2 Early or late miscarriage. | ||||
| 2.1 Trial entry before pregnancy | 4 | 7809 | Risk Ratio (M‐H, Fixed, 95% CI) | 1.07 [0.93, 1.24] |
| 2.2 Trial entry < 12 weeks' gestation | 1 | 406 | Risk Ratio (M‐H, Fixed, 95% CI) | 1.32 [0.63, 2.77] |
| 2.3 Trial entry >= 12 weeks but < 20 weeks' gestation | 1 | 739 | Risk Ratio (M‐H, Fixed, 95% CI) | 1.32 [0.30, 5.87] |
| 2.4 Trial entry 'mixed' both < 20 and >= 20 weeks' gestation | 4 | 2312 | Risk Ratio (M‐H, Fixed, 95% CI) | 1.19 [0.63, 2.24] |
| 3 Placental abruption Show forest plot | 5 | Risk Ratio (M‐H, Fixed, 95% CI) | Subtotals only | |
| Analysis 1.3  Comparison 1 Any vitamins versus no vitamins (or minimal vitamins), Outcome 3 Placental abruption. | ||||
| 3.1 Placental abruption | 4 | 4264 | Risk Ratio (M‐H, Fixed, 95% CI) | 0.66 [0.34, 1.30] |
| 3.2 Antepartum haemorrhage including placental abruption | 1 | 200 | Risk Ratio (M‐H, Fixed, 95% CI) | 7.0 [0.88, 55.86] |
| 4 Psychological effects (anxiety and depression) | 0 | 0 | Risk Ratio (M‐H, Fixed, 95% CI) | 0.0 [0.0, 0.0] |
| 5 Pre‐eclampsia Show forest plot | 7 | 9561 | Risk Ratio (M‐H, Random, 95% CI) | 0.88 [0.70, 1.09] |
| Analysis 1.5  Comparison 1 Any vitamins versus no vitamins (or minimal vitamins), Outcome 5 Pre‐eclampsia. | ||||
| 6 Stillbirth Show forest plot | 9 | 15980 | Risk Ratio (M‐H, Fixed, 95% CI) | 0.86 [0.65, 1.13] |
| Analysis 1.6  Comparison 1 Any vitamins versus no vitamins (or minimal vitamins), Outcome 6 Stillbirth. | ||||
| 6.1 Trial entry before pregnancy | 3 | 7785 | Risk Ratio (M‐H, Fixed, 95% CI) | 0.94 [0.48, 1.85] |
| 6.2 Trial entry < 12 weeks' gestation | 0 | 0 | Risk Ratio (M‐H, Fixed, 95% CI) | 0.0 [0.0, 0.0] |
| 6.3 Trial entry >= 12 weeks' but < 20 weeks' gestation | 1 | 739 | Risk Ratio (M‐H, Fixed, 95% CI) | 0.69 [0.27, 1.80] |
| 6.4 Trial entry 'mixed' both < 20 and >= 20 weeks' gestation | 5 | 7456 | Risk Ratio (M‐H, Fixed, 95% CI) | 0.86 [0.63, 1.19] |
| 7 Perinatal death Show forest plot | 4 | 4313 | Risk Ratio (M‐H, Fixed, 95% CI) | 0.83 [0.62, 1.11] |
| Analysis 1.7 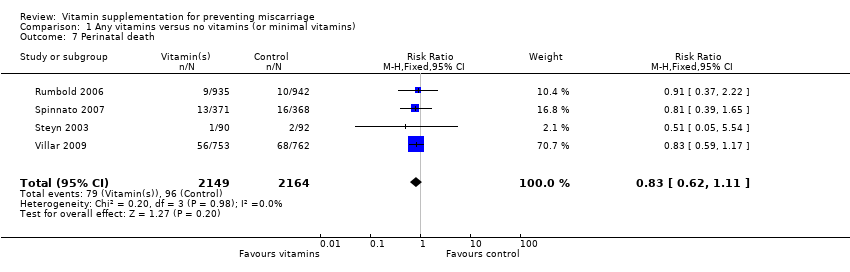 Comparison 1 Any vitamins versus no vitamins (or minimal vitamins), Outcome 7 Perinatal death. | ||||
| 8 Neonatal death Show forest plot | 6 | 27657 | Relative risk (Fixed, 95% CI) | 1.11 [0.94, 1.31] |
| Analysis 1.8  Comparison 1 Any vitamins versus no vitamins (or minimal vitamins), Outcome 8 Neonatal death. | ||||
| 9 Preterm birth Show forest plot | 8 | 27414 | Relative risk (Fixed, 95% CI) | 1.02 [0.94, 1.10] |
| Analysis 1.9  Comparison 1 Any vitamins versus no vitamins (or minimal vitamins), Outcome 9 Preterm birth. | ||||
| 10 Very preterm birth Show forest plot | 4 | 4181 | Risk Ratio (M‐H, Fixed, 95% CI) | 0.93 [0.75, 1.15] |
| Analysis 1.10  Comparison 1 Any vitamins versus no vitamins (or minimal vitamins), Outcome 10 Very preterm birth. | ||||
| 11 Birthweight Show forest plot | 5 | 7497 | Mean Difference (IV, Random, 95% CI) | 16.99 [‐37.66, 71.64] |
| Analysis 1.11  Comparison 1 Any vitamins versus no vitamins (or minimal vitamins), Outcome 11 Birthweight. | ||||
| 12 Small‐for‐gestational age Show forest plot | 7 | 9356 | Risk Ratio (M‐H, Fixed, 95% CI) | 0.96 [0.84, 1.08] |
| Analysis 1.12  Comparison 1 Any vitamins versus no vitamins (or minimal vitamins), Outcome 12 Small‐for‐gestational age. | ||||
| 12.1 Birthweight less than 10th centile or birthweight < 2500 g | 7 | 9356 | Risk Ratio (M‐H, Fixed, 95% CI) | 0.96 [0.84, 1.08] |
| 13 Congenital malformations Show forest plot | 4 | 8933 | Risk Ratio (M‐H, Fixed, 95% CI) | 1.47 [0.90, 2.40] |
| Analysis 1.13  Comparison 1 Any vitamins versus no vitamins (or minimal vitamins), Outcome 13 Congenital malformations. | ||||
| 14 Multiple pregnancy Show forest plot | 3 | 20986 | Relative risk (Fixed, 95% CI) | 1.38 [1.12, 1.70] |
| Analysis 1.14  Comparison 1 Any vitamins versus no vitamins (or minimal vitamins), Outcome 14 Multiple pregnancy. | ||||
| 15 Apgar score less than seven at five minutes Show forest plot | 1 | 700 | Risk Ratio (M‐H, Fixed, 95% CI) | 0.66 [0.27, 1.60] |
| Analysis 1.15  Comparison 1 Any vitamins versus no vitamins (or minimal vitamins), Outcome 15 Apgar score less than seven at five minutes. | ||||
| 16 Use of blood transfusion for the mother | 0 | 0 | Risk Ratio (M‐H, Fixed, 95% CI) | 0.0 [0.0, 0.0] |
| 17 Anaemia (maternal) Show forest plot | 2 | 1190 | Risk Ratio (M‐H, Random, 95% CI) | 0.90 [0.46, 1.73] |
| Analysis 1.17  Comparison 1 Any vitamins versus no vitamins (or minimal vitamins), Outcome 17 Anaemia (maternal). | ||||
| 18 Anaemia (infant) Show forest plot | 1 | 836 | Risk Ratio (M‐H, Fixed, 95% CI) | 1.05 [0.98, 1.12] |
| Analysis 1.18  Comparison 1 Any vitamins versus no vitamins (or minimal vitamins), Outcome 18 Anaemia (infant). | ||||
| 19 Placental weight Show forest plot | 1 | 29 | Mean Difference (IV, Fixed, 95% CI) | 96.0 [30.73, 161.27] |
| Analysis 1.19  Comparison 1 Any vitamins versus no vitamins (or minimal vitamins), Outcome 19 Placental weight. | ||||
| 20 Method of feeding Show forest plot | 1 | 4878 | Risk Ratio (M‐H, Fixed, 95% CI) | 0.98 [0.96, 1.01] |
| Analysis 1.20 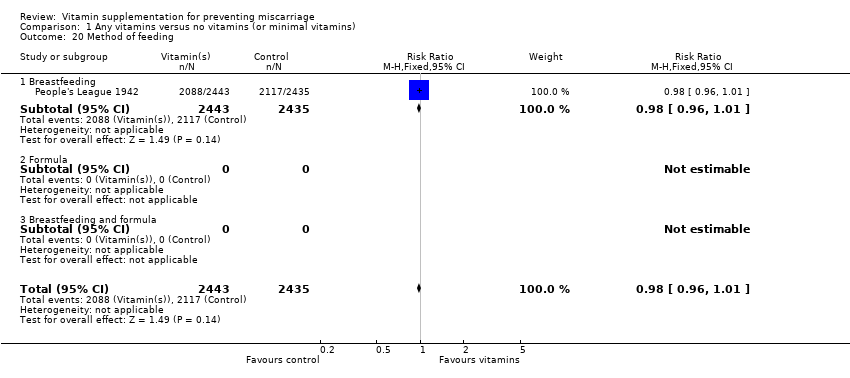 Comparison 1 Any vitamins versus no vitamins (or minimal vitamins), Outcome 20 Method of feeding. | ||||
| 20.1 Breastfeeding | 1 | 4878 | Risk Ratio (M‐H, Fixed, 95% CI) | 0.98 [0.96, 1.01] |
| 20.2 Formula | 0 | 0 | Risk Ratio (M‐H, Fixed, 95% CI) | 0.0 [0.0, 0.0] |
| 20.3 Breastfeeding and formula | 0 | 0 | Risk Ratio (M‐H, Fixed, 95% CI) | 0.0 [0.0, 0.0] |
| 21 Subsequent fertility | 0 | 0 | Risk Ratio (M‐H, Fixed, 95% CI) | 0.0 [0.0, 0.0] |
| 22 Poor growth at childhood follow‐up | 0 | 0 | Risk Ratio (M‐H, Fixed, 95% CI) | 0.0 [0.0, 0.0] |
| 23 Disability at childhood follow‐up | 0 | 0 | Risk Ratio (M‐H, Fixed, 95% CI) | 0.0 [0.0, 0.0] |
| 24 Any adverse effects of vitamin supplementation sufficient to stop supplementation Show forest plot | 1 | 739 | Risk Ratio (M‐H, Fixed, 95% CI) | 1.16 [0.39, 3.41] |
| Analysis 1.24  Comparison 1 Any vitamins versus no vitamins (or minimal vitamins), Outcome 24 Any adverse effects of vitamin supplementation sufficient to stop supplementation. | ||||
| 25 Maternal views of care | 0 | 0 | Mean Difference (IV, Fixed, 95% CI) | 0.0 [0.0, 0.0] |
| 26 Gynaecological hospital admission Show forest plot | 1 | 1365 | Risk Ratio (M‐H, Fixed, 95% CI) | 0.20 [0.02, 1.69] |
| Analysis 1.26  Comparison 1 Any vitamins versus no vitamins (or minimal vitamins), Outcome 26 Gynaecological hospital admission. | ||||
| 26.1 Any maternal admission to ICU | 1 | 1365 | Risk Ratio (M‐H, Fixed, 95% CI) | 0.20 [0.02, 1.69] |
| 27 Admission to neonatal intensive care unit Show forest plot | 2 | Risk Ratio (M‐H, Fixed, 95% CI) | Subtotals only | |
| Analysis 1.27  Comparison 1 Any vitamins versus no vitamins (or minimal vitamins), Outcome 27 Admission to neonatal intensive care unit. | ||||
| 27.1 Any admission to NICU | 1 | 1515 | Risk Ratio (M‐H, Fixed, 95% CI) | 0.81 [0.59, 1.11] |
| 27.2 > 4 days of NICU care | 1 | 1853 | Risk Ratio (M‐H, Fixed, 95% CI) | 0.60 [0.27, 1.37] |
| 27.3 > 7 days in NICU | 1 | 1515 | Risk Ratio (M‐H, Fixed, 95% CI) | 0.87 [0.54, 1.39] |
| 28 Healthcare costs | 0 | 0 | Mean Difference (IV, Fixed, 95% CI) | 0.0 [0.0, 0.0] |
| 29 Duration of admission to the neonatal intensive care unit Show forest plot | 1 | 181 | Mean Difference (IV, Fixed, 95% CI) | 1.30 [‐0.28, 2.88] |
| Analysis 1.29  Comparison 1 Any vitamins versus no vitamins (or minimal vitamins), Outcome 29 Duration of admission to the neonatal intensive care unit. | ||||
| 30 Side effects Show forest plot | 1 | 1734 | Risk Ratio (M‐H, Fixed, 95% CI) | 1.63 [1.12, 2.36] |
| Analysis 1.30  Comparison 1 Any vitamins versus no vitamins (or minimal vitamins), Outcome 30 Side effects. | ||||
| 30.1 Abdominal pain | 1 | 1734 | Risk Ratio (M‐H, Fixed, 95% CI) | 1.63 [1.12, 2.36] |
| Outcome or subgroup title | No. of studies | No. of participants | Statistical method | Effect size |
| 1 Total fetal loss (including miscarriage or combined miscarriages and stillbirths) Show forest plot | 5 | Relative risk (Fixed, 95% CI) | 0.97 [0.84, 1.12] | |
| Analysis 2.1  Comparison 2 Any vitamins (by quality), Outcome 1 Total fetal loss (including miscarriage or combined miscarriages and stillbirths). | ||||
| 1.1 Allocation concealment is adequate | 5 | Relative risk (Fixed, 95% CI) | 0.97 [0.84, 1.12] | |
| 2 Early or late miscarriage Show forest plot | 4 | 4633 | Risk Ratio (M‐H, Fixed, 95% CI) | 0.95 [0.71, 1.27] |
| Analysis 2.2  Comparison 2 Any vitamins (by quality), Outcome 2 Early or late miscarriage. | ||||
| 2.1 Allocation concealment is adequate | 4 | 4633 | Risk Ratio (M‐H, Fixed, 95% CI) | 0.95 [0.71, 1.27] |
| 3 Stillbirth Show forest plot | 5 | 4916 | Risk Ratio (M‐H, Fixed, 95% CI) | 0.85 [0.47, 1.53] |
| Analysis 2.3 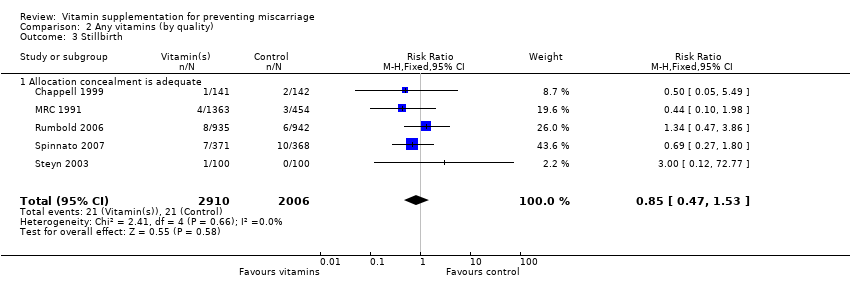 Comparison 2 Any vitamins (by quality), Outcome 3 Stillbirth. | ||||
| 3.1 Allocation concealment is adequate | 5 | 4916 | Risk Ratio (M‐H, Fixed, 95% CI) | 0.85 [0.47, 1.53] |
| Outcome or subgroup title | No. of studies | No. of participants | Statistical method | Effect size |
| 1 Total fetal loss Show forest plot | 6 | Risk Ratio (M‐H, Fixed, 95% CI) | Subtotals only | |
| Analysis 3.1  Comparison 3 Vitamin C, Outcome 1 Total fetal loss. | ||||
| 1.1 Vitamin C + multivitamins versus placebo plus multivitamins | 1 | 406 | Risk Ratio (M‐H, Fixed, 95% CI) | 1.32 [0.63, 2.77] |
| 1.2 Vitamin C and vitamin E versus placebo | 3 | 2899 | Risk Ratio (M‐H, Fixed, 95% CI) | 0.82 [0.48, 1.42] |
| 1.3 Vitamin C versus no supplement/placebo | 2 | 224 | Risk Ratio (M‐H, Fixed, 95% CI) | 1.28 [0.58, 2.83] |
| 2 Early or late miscarriage Show forest plot | 5 | Risk Ratio (M‐H, Fixed, 95% CI) | Subtotals only | |
| Analysis 3.2  Comparison 3 Vitamin C, Outcome 2 Early or late miscarriage. | ||||
| 2.1 Vitamin C + multivitamins versus placebo plus multivitamins | 1 | 406 | Risk Ratio (M‐H, Fixed, 95% CI) | 1.32 [0.63, 2.77] |
| 2.2 Vitamin C and vitamin E versus placebo | 2 | 2616 | Risk Ratio (M‐H, Fixed, 95% CI) | 0.70 [0.27, 1.84] |
| 2.3 Vitamin C versus no supplement/placebo | 2 | 224 | Risk Ratio (M‐H, Fixed, 95% CI) | 1.17 [0.52, 2.65] |
| 3 Antepartum haemorrhage and placental abruption Show forest plot | 5 | Risk Ratio (M‐H, Fixed, 95% CI) | Subtotals only | |
| Analysis 3.3  Comparison 3 Vitamin C, Outcome 3 Antepartum haemorrhage and placental abruption. | ||||
| 3.1 Vitamin C and vitamin E versus placebo ‐ placental abruption only | 4 | 4264 | Risk Ratio (M‐H, Fixed, 95% CI) | 0.66 [0.34, 1.30] |
| 3.2 Vitamin C versus placebo ‐ antepartum haemorrhage including placental abruption | 1 | 200 | Risk Ratio (M‐H, Fixed, 95% CI) | 7.0 [0.88, 55.86] |
| 4 Pre‐eclampsia Show forest plot | 5 | Risk Ratio (M‐H, Random, 95% CI) | Subtotals only | |
| Analysis 3.4  Comparison 3 Vitamin C, Outcome 4 Pre‐eclampsia. | ||||
| 4.1 Vitamin C and vitamin E versus placebo | 4 | 4264 | Risk Ratio (M‐H, Random, 95% CI) | 0.94 [0.72, 1.22] |
| 4.2 Vitamin C versus placebo | 1 | 200 | Risk Ratio (M‐H, Random, 95% CI) | 1.0 [0.21, 4.84] |
| 5 Stillbirth Show forest plot | 4 | Risk Ratio (M‐H, Fixed, 95% CI) | Subtotals only | |
| Analysis 3.5  Comparison 3 Vitamin C, Outcome 5 Stillbirth. | ||||
| 5.1 Vitamin C and vitamin E versus placebo | 3 | 2899 | Risk Ratio (M‐H, Fixed, 95% CI) | 0.89 [0.46, 1.73] |
| 5.2 Vitamin C versus placebo | 1 | 200 | Risk Ratio (M‐H, Fixed, 95% CI) | 3.0 [0.12, 72.77] |
| 6 Perinatal death Show forest plot | 4 | 4313 | Risk Ratio (M‐H, Fixed, 95% CI) | 0.83 [0.62, 1.11] |
| Analysis 3.6  Comparison 3 Vitamin C, Outcome 6 Perinatal death. | ||||
| 6.1 Vitamin C versus placebo | 1 | 182 | Risk Ratio (M‐H, Fixed, 95% CI) | 0.51 [0.05, 5.54] |
| 6.2 Vitamin C and vitamin E versus placebo | 3 | 4131 | Risk Ratio (M‐H, Fixed, 95% CI) | 0.84 [0.63, 1.12] |
| 7 Neonatal death Show forest plot | 3 | 2717 | Risk Ratio (M‐H, Fixed, 95% CI) | 0.69 [0.30, 1.61] |
| Analysis 3.7  Comparison 3 Vitamin C, Outcome 7 Neonatal death. | ||||
| 7.1 Vitamin C versus placebo | 1 | 181 | Risk Ratio (M‐H, Fixed, 95% CI) | 0.69 [0.12, 4.03] |
| 7.2 Vitamin C and E versus placebo | 2 | 2536 | Risk Ratio (M‐H, Fixed, 95% CI) | 0.69 [0.27, 1.81] |
| 8 Preterm birth Show forest plot | 5 | Risk Ratio (M‐H, Fixed, 95% CI) | Subtotals only | |
| Analysis 3.8  Comparison 3 Vitamin C, Outcome 8 Preterm birth. | ||||
| 8.1 Vitamin C and vitamin E versus placebo | 4 | 4264 | Risk Ratio (M‐H, Fixed, 95% CI) | 0.97 [0.85, 1.10] |
| 8.2 Vitamin C versus placebo | 1 | 200 | Risk Ratio (M‐H, Fixed, 95% CI) | 1.43 [1.03, 1.99] |
| 9 Very preterm birth Show forest plot | 4 | 4181 | Risk Ratio (M‐H, Fixed, 95% CI) | 0.93 [0.75, 1.15] |
| Analysis 3.9  Comparison 3 Vitamin C, Outcome 9 Very preterm birth. | ||||
| 9.1 Vitamin C versus placebo | 1 | 200 | Risk Ratio (M‐H, Fixed, 95% CI) | 1.3 [0.78, 2.17] |
| 9.2 Vitamin C and vitamin E versus placebo | 3 | 3981 | Risk Ratio (M‐H, Fixed, 95% CI) | 0.88 [0.70, 1.10] |
| 10 Small‐for‐gestational age Show forest plot | 4 | 4233 | Risk Ratio (M‐H, Fixed, 95% CI) | 0.90 [0.78, 1.04] |
| Analysis 3.10  Comparison 3 Vitamin C, Outcome 10 Small‐for‐gestational age. | ||||
| 10.1 Vitamin C and vitamin E versus placebo | 4 | 4233 | Risk Ratio (M‐H, Fixed, 95% CI) | 0.90 [0.78, 1.04] |
| 11 Birthweight Show forest plot | 2 | 2561 | Mean Difference (IV, Fixed, 95% CI) | 1.25 [‐47.45, 49.95] |
| Analysis 3.11  Comparison 3 Vitamin C, Outcome 11 Birthweight. | ||||
| 11.1 Vitamin C and vitamin E versus placebo | 2 | 2561 | Mean Difference (IV, Fixed, 95% CI) | 1.25 [‐47.45, 49.95] |
| 12 Congenital malformations Show forest plot | 2 | 2254 | Risk Ratio (M‐H, Fixed, 95% CI) | 1.44 [0.73, 2.84] |
| Analysis 3.12  Comparison 3 Vitamin C, Outcome 12 Congenital malformations. | ||||
| 12.1 Vitamin C and vitamin E versus placebo | 2 | 2254 | Risk Ratio (M‐H, Fixed, 95% CI) | 1.44 [0.73, 2.84] |
| 13 Apgar score less than seven at five minutes Show forest plot | 1 | 700 | Risk Ratio (M‐H, Fixed, 95% CI) | 0.66 [0.27, 1.60] |
| Analysis 3.13 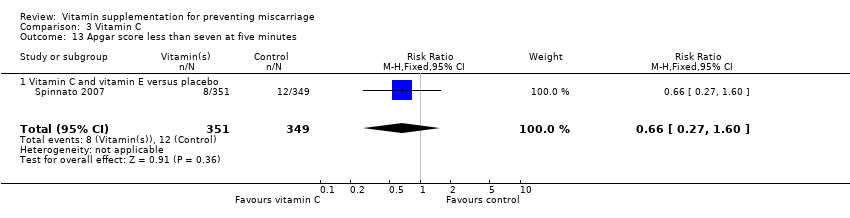 Comparison 3 Vitamin C, Outcome 13 Apgar score less than seven at five minutes. | ||||
| 13.1 Vitamin C and vitamin E versus placebo | 1 | 700 | Risk Ratio (M‐H, Fixed, 95% CI) | 0.66 [0.27, 1.60] |
| 14 Any adverse effects of vitamin supplementation sufficient to stop supplementation Show forest plot | 1 | 739 | Risk Ratio (M‐H, Fixed, 95% CI) | 1.16 [0.39, 3.41] |
| Analysis 3.14  Comparison 3 Vitamin C, Outcome 14 Any adverse effects of vitamin supplementation sufficient to stop supplementation. | ||||
| 14.1 Vitamin C and vitamin E versus placebo | 1 | 739 | Risk Ratio (M‐H, Fixed, 95% CI) | 1.16 [0.39, 3.41] |
| 15 Gynaecological hospital admission Show forest plot | 1 | 1365 | Risk Ratio (M‐H, Fixed, 95% CI) | 0.20 [0.02, 1.69] |
| Analysis 3.15  Comparison 3 Vitamin C, Outcome 15 Gynaecological hospital admission. | ||||
| 15.1 Vitamin C and vitamin E versus placebo: Any maternal admission to ICU | 1 | 1365 | Risk Ratio (M‐H, Fixed, 95% CI) | 0.20 [0.02, 1.69] |
| 16 Admission to neonatal intensive care unit Show forest plot | 2 | Risk Ratio (M‐H, Fixed, 95% CI) | Subtotals only | |
| Analysis 3.16  Comparison 3 Vitamin C, Outcome 16 Admission to neonatal intensive care unit. | ||||
| 16.1 Vitamin C and vitamin E versus placebo: Any admission to NICU | 1 | 1515 | Risk Ratio (M‐H, Fixed, 95% CI) | 0.81 [0.59, 1.11] |
| 16.2 Vitamin C and vitamin E versus placebo: > 4 days of NICU care | 1 | 1853 | Risk Ratio (M‐H, Fixed, 95% CI) | 0.60 [0.27, 1.37] |
| 16.3 Vitamin C and vitamin E versus placebo: > 7 days of NICU care | 1 | 1515 | Risk Ratio (M‐H, Fixed, 95% CI) | 0.87 [0.54, 1.39] |
| 17 Side effects Show forest plot | 1 | 1734 | Risk Ratio (M‐H, Fixed, 95% CI) | 1.63 [1.12, 2.36] |
| Analysis 3.17  Comparison 3 Vitamin C, Outcome 17 Side effects. | ||||
| 17.1 Vitamin C and vitamin E versus placebo: Abdominal pain | 1 | 1734 | Risk Ratio (M‐H, Fixed, 95% CI) | 1.63 [1.12, 2.36] |
| Outcome or subgroup title | No. of studies | No. of participants | Statistical method | Effect size |
| 1 Total fetal loss (including miscarriages or combined miscarriages and stillbirths) Show forest plot | 5 | Relative risk (Fixed, 95% CI) | Subtotals only | |
| Analysis 4.1  Comparison 4 Vitamin A, Outcome 1 Total fetal loss (including miscarriages or combined miscarriages and stillbirths). | ||||
| 1.1 Vitamin A versus placebo | 1 | 11723 | Relative risk (Fixed, 95% CI) | 1.04 [0.92, 1.17] |
| 1.2 B‐carotene versus placebo | 1 | 11303 | Relative risk (Fixed, 95% CI) | 1.03 [0.91, 1.16] |
| 1.3 Vitamin A versus B‐carotene | 1 | 11720 | Relative risk (Fixed, 95% CI) | 1.01 [0.90, 1.14] |
| 1.4 Vitamin A or B‐carotene versus placebo | 1 | 17373 | Relative risk (Fixed, 95% CI) | 1.05 [0.91, 1.21] |
| 1.5 Vitamin A (with/without multivitamins) versus multivitamins or placebo | 1 | 1074 | Relative risk (Fixed, 95% CI) | 0.80 [0.53, 1.21] |
| 1.6 Vitamin A + iron + folate versus iron + folate | 3 | 1640 | Relative risk (Fixed, 95% CI) | 1.01 [0.61, 1.66] |
| 2 Early or late miscarriage Show forest plot | 3 | Risk Ratio (M‐H, Fixed, 95% CI) | Subtotals only | |
| Analysis 4.2 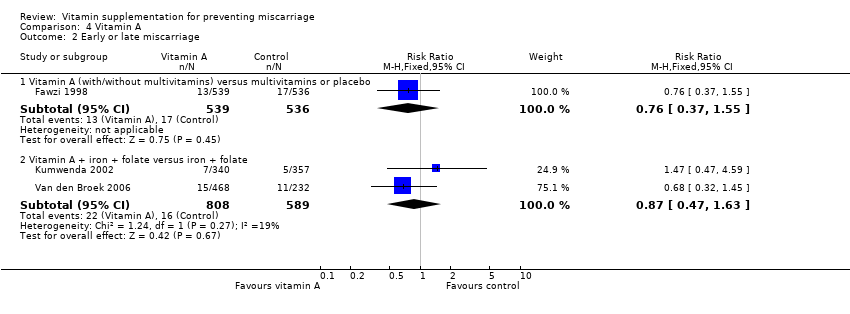 Comparison 4 Vitamin A, Outcome 2 Early or late miscarriage. | ||||
| 2.1 Vitamin A (with/without multivitamins) versus multivitamins or placebo | 1 | 1075 | Risk Ratio (M‐H, Fixed, 95% CI) | 0.76 [0.37, 1.55] |
| 2.2 Vitamin A + iron + folate versus iron + folate | 2 | 1397 | Risk Ratio (M‐H, Fixed, 95% CI) | 0.87 [0.47, 1.63] |
| 3 Stillbirth Show forest plot | 4 | Risk Ratio (M‐H, Fixed, 95% CI) | Subtotals only | |
| Analysis 4.3  Comparison 4 Vitamin A, Outcome 3 Stillbirth. | ||||
| 3.1 Vitamin A (with/without multivitamins) versus multivitamins or placebo | 1 | 1075 | Risk Ratio (M‐H, Fixed, 95% CI) | 1.04 [0.60, 1.79] |
| 3.2 Vitamin A + iron + folate versus iron + folate | 3 | 1640 | Risk Ratio (M‐H, Fixed, 95% CI) | 1.29 [0.57, 2.91] |
| 4 Neonatal death Show forest plot | 1 | Relative risk (Fixed, 95% CI) | Subtotals only | |
| Analysis 4.4  Comparison 4 Vitamin A, Outcome 4 Neonatal death. | ||||
| 4.1 Vitamin A versus placebo | 1 | 10214 | Relative risk (Fixed, 95% CI) | 1.09 [0.92, 1.30] |
| 4.2 B‐carotene versus placebo | 1 | 9788 | Relative risk (Fixed, 95% CI) | 1.09 [0.91, 1.30] |
| 4.3 Vitamin A versus B‐carotene | 1 | 10228 | Relative risk (Fixed, 95% CI) | 1.0 [0.85, 1.18] |
| 4.4 Vitamin A or B‐carotene versus placebo | 1 | 15115 | Relative risk (Fixed, 95% CI) | 1.09 [0.91, 1.30] |
| 5 Preterm birth Show forest plot | 3 | Relative risk (Fixed, 95% CI) | Subtotals only | |
| Analysis 4.5  Comparison 4 Vitamin A, Outcome 5 Preterm birth. | ||||
| 5.1 Vitamin A versus placebo | 1 | 11723 | Relative risk (Fixed, 95% CI) | 1.04 [0.89, 1.21] |
| 5.2 B‐carotene versus placebo | 1 | 11303 | Relative risk (Fixed, 95% CI) | 1.01 [0.86, 1.18] |
| 5.3 Vitamin A versus B‐carotene | 1 | 11720 | Relative risk (Fixed, 95% CI) | 1.03 [0.88, 1.20] |
| 5.4 Vitamin A or B‐carotene versus placebo | 1 | 17373 | Relative risk (Fixed, 95% CI) | 1.02 [0.89, 1.17] |
| 5.5 Vitamin A (with/without multivitamins) versus multivitamins or placebo | 1 | 1075 | Relative risk (Fixed, 95% CI) | 1.07 [0.84, 1.37] |
| 5.6 Vitamin A + iron + folate versus iron + folate | 1 | 700 | Relative risk (Fixed, 95% CI) | 1.11 [0.59, 2.09] |
| 6 Birthweight Show forest plot | 1 | 594 | Mean Difference (IV, Fixed, 95% CI) | 90.0 [2.68, 177.32] |
| Analysis 4.6  Comparison 4 Vitamin A, Outcome 6 Birthweight. | ||||
| 6.1 Vitamin A + iron + folate versus iron + folate | 1 | 594 | Mean Difference (IV, Fixed, 95% CI) | 90.0 [2.68, 177.32] |
| 7 Small‐for‐gestational age Show forest plot | 1 | 1075 | Risk Ratio (M‐H, Fixed, 95% CI) | 0.84 [0.58, 1.21] |
| Analysis 4.7  Comparison 4 Vitamin A, Outcome 7 Small‐for‐gestational age. | ||||
| 7.1 Vitamin A (with/without multivitamins) versus multivitamins or placebo | 1 | 1075 | Risk Ratio (M‐H, Fixed, 95% CI) | 0.84 [0.58, 1.21] |
| 8 Multiple pregnancy Show forest plot | 1 | Relative risk (Fixed, 95% CI) | Subtotals only | |
| Analysis 4.8  Comparison 4 Vitamin A, Outcome 8 Multiple pregnancy. | ||||
| 8.1 Vitamin A versus placebo | 1 | 10697 | Relative risk (Fixed, 95% CI) | 1.35 [0.99, 1.85] |
| 8.2 B‐carotene versus placebo | 1 | 10294 | Relative risk (Fixed, 95% CI) | 1.37 [1.00, 1.88] |
| 8.3 Vitamin A versus B‐carotene | 1 | 10699 | Relative risk (Fixed, 95% CI) | 1.03 [0.77, 1.37] |
| 8.4 Vitamin A or B‐carotene versus placebo | 1 | 15845 | Relative risk (Fixed, 95% CI) | 1.39 [1.05, 1.84] |
| 9 Very preterm birth Show forest plot | 1 | 1075 | Risk Ratio (M‐H, Fixed, 95% CI) | 1.11 [0.71, 1.74] |
| Analysis 4.9  Comparison 4 Vitamin A, Outcome 9 Very preterm birth. | ||||
| 9.1 Vitamin A (with/without multivitamins) versus multivitamins or placebo | 1 | 1075 | Risk Ratio (M‐H, Fixed, 95% CI) | 1.11 [0.71, 1.74] |
| 10 Maternal anaemia Show forest plot | 2 | Risk Ratio (M‐H, Fixed, 95% CI) | Subtotals only | |
| Analysis 4.10  Comparison 4 Vitamin A, Outcome 10 Maternal anaemia. | ||||
| 10.1 Vitamin A + beta‐carotene with or without multivitamin versus placebo | 1 | 807 | Risk Ratio (M‐H, Fixed, 95% CI) | 0.86 [0.60, 1.24] |
| 10.2 Vitamin A + beta‐carotene versus placebo | 1 | 539 | Risk Ratio (M‐H, Fixed, 95% CI) | 0.91 [0.60, 1.38] |
| 10.3 Vitamin A + iron and folic acid versus iron and folic acid | 1 | 700 | Risk Ratio (M‐H, Fixed, 95% CI) | 0.96 [0.82, 1.12] |
| 11 Infant anaemia Show forest plot | 2 | Risk Ratio (M‐H, Fixed, 95% CI) | Subtotals only | |
| Analysis 4.11  Comparison 4 Vitamin A, Outcome 11 Infant anaemia. | ||||
| 11.1 Infant anaemia at 6 weeks' of age ‐ vitamin A + iron + folate versus iron + folate | 1 | 562 | Risk Ratio (M‐H, Fixed, 95% CI) | 0.58 [0.45, 0.75] |
| 11.2 Infant anaemia at 12 months ‐ vitamin A + iron + folate versus iron + folate | 1 | 478 | Risk Ratio (M‐H, Fixed, 95% CI) | 1.03 [0.88, 1.20] |
| 11.3 Infant anaemia ‐ vitamin A + beta‐carotene with or without multivitamins versus placebo | 1 | 625 | Risk Ratio (M‐H, Fixed, 95% CI) | 0.99 [0.92, 1.06] |
| 11.4 Infant anaemia ‐ vitamin A + beta‐carotene versus placebo | 1 | 406 | Risk Ratio (M‐H, Fixed, 95% CI) | 0.99 [0.92, 1.08] |
| 12 Poor growth at childhood follow up Show forest plot | 2 | Mean Difference (IV, Fixed, 95% CI) | Subtotals only | |
| Analysis 4.12  Comparison 4 Vitamin A, Outcome 12 Poor growth at childhood follow up. | ||||
| 12.1 Weight (g) at 6 weeks: vitamin A + iron + folate versus iron + folate | 1 | 546 | Mean Difference (IV, Fixed, 95% CI) | 169.0 [16.55, 321.45] |
| 12.2 Length (cm) at 6 weeks: vitamin A + iron + folate versus iron + folate | 1 | 546 | Mean Difference (IV, Fixed, 95% CI) | 0.70 [0.15, 1.25] |
| 12.3 Weight (g) at 4 months: vitamin A + iron + folate versus iron + folate | 1 | 148 | Mean Difference (IV, Fixed, 95% CI) | ‐100.0 [‐377.14, 177.14] |
| 12.4 Length (cm) at 4 months: vitamin A + iron + folate versus iron + folate | 1 | 148 | Mean Difference (IV, Fixed, 95% CI) | ‐0.5 [‐1.33, 0.33] |
| Outcome or subgroup title | No. of studies | No. of participants | Statistical method | Effect size |
| 1 Total fetal loss (including miscarriages or combined miscarriages and stillbirths) Show forest plot | 12 | Risk Ratio (M‐H, Random, 95% CI) | Subtotals only | |
| Analysis 5.1 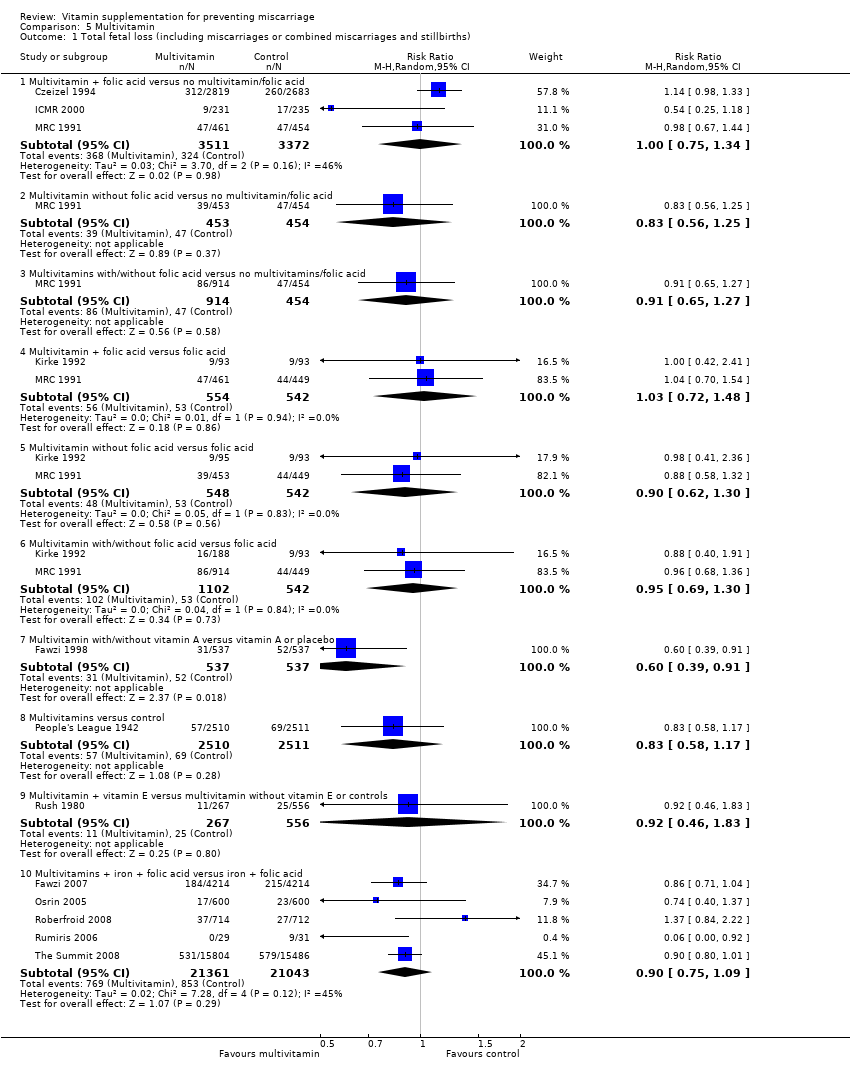 Comparison 5 Multivitamin, Outcome 1 Total fetal loss (including miscarriages or combined miscarriages and stillbirths). | ||||
| 1.1 Multivitamin + folic acid versus no multivitamin/folic acid | 3 | 6883 | Risk Ratio (M‐H, Random, 95% CI) | 1.00 [0.75, 1.34] |
| 1.2 Multivitamin without folic acid versus no multivitamin/folic acid | 1 | 907 | Risk Ratio (M‐H, Random, 95% CI) | 0.83 [0.56, 1.25] |
| 1.3 Multivitamins with/without folic acid versus no multivitamins/folic acid | 1 | 1368 | Risk Ratio (M‐H, Random, 95% CI) | 0.91 [0.65, 1.27] |
| 1.4 Multivitamin + folic acid versus folic acid | 2 | 1096 | Risk Ratio (M‐H, Random, 95% CI) | 1.03 [0.72, 1.48] |
| 1.5 Multivitamin without folic acid versus folic acid | 2 | 1090 | Risk Ratio (M‐H, Random, 95% CI) | 0.90 [0.62, 1.30] |
| 1.6 Multivitamin with/without folic acid versus folic acid | 2 | 1644 | Risk Ratio (M‐H, Random, 95% CI) | 0.95 [0.69, 1.30] |
| 1.7 Multivitamin with/without vitamin A versus vitamin A or placebo | 1 | 1074 | Risk Ratio (M‐H, Random, 95% CI) | 0.60 [0.39, 0.91] |
| 1.8 Multivitamins versus control | 1 | 5021 | Risk Ratio (M‐H, Random, 95% CI) | 0.83 [0.58, 1.17] |
| 1.9 Multivitamin + vitamin E versus multivitamin without vitamin E or controls | 1 | 823 | Risk Ratio (M‐H, Random, 95% CI) | 0.92 [0.46, 1.83] |
| 1.10 Multivitamins + iron + folic acid versus iron + folic acid | 5 | 42404 | Risk Ratio (M‐H, Random, 95% CI) | 0.90 [0.75, 1.09] |
| 2 Early or late miscarriage Show forest plot | 10 | Risk Ratio (M‐H, Random, 95% CI) | Subtotals only | |
| Analysis 5.2 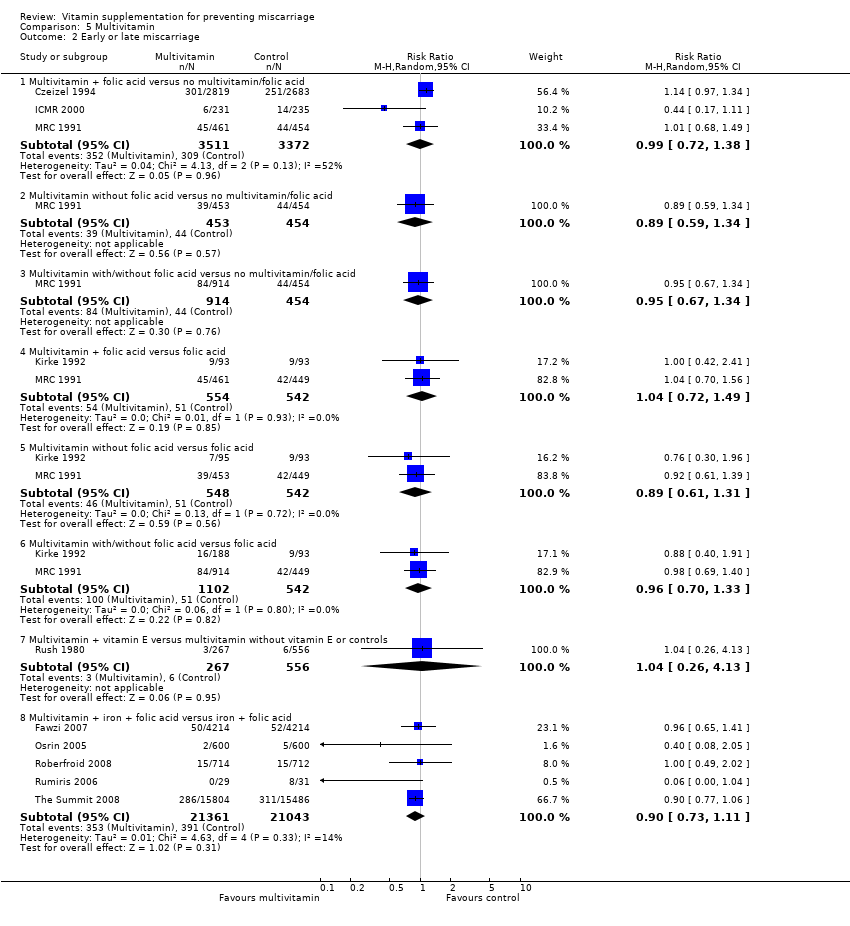 Comparison 5 Multivitamin, Outcome 2 Early or late miscarriage. | ||||
| 2.1 Multivitamin + folic acid versus no multivitamin/folic acid | 3 | 6883 | Risk Ratio (M‐H, Random, 95% CI) | 0.99 [0.72, 1.38] |
| 2.2 Multivitamin without folic acid versus no multivitamin/folic acid | 1 | 907 | Risk Ratio (M‐H, Random, 95% CI) | 0.89 [0.59, 1.34] |
| 2.3 Multivitamin with/without folic acid versus no multivitamin/folic acid | 1 | 1368 | Risk Ratio (M‐H, Random, 95% CI) | 0.95 [0.67, 1.34] |
| 2.4 Multivitamin + folic acid versus folic acid | 2 | 1096 | Risk Ratio (M‐H, Random, 95% CI) | 1.04 [0.72, 1.49] |
| 2.5 Multivitamin without folic acid versus folic acid | 2 | 1090 | Risk Ratio (M‐H, Random, 95% CI) | 0.89 [0.61, 1.31] |
| 2.6 Multivitamin with/without folic acid versus folic acid | 2 | 1644 | Risk Ratio (M‐H, Random, 95% CI) | 0.96 [0.70, 1.33] |
| 2.7 Multivitamin + vitamin E versus multivitamin without vitamin E or controls | 1 | 823 | Risk Ratio (M‐H, Random, 95% CI) | 1.04 [0.26, 4.13] |
| 2.8 Multivitamin + iron + folic acid versus iron + folic acid | 5 | 42404 | Risk Ratio (M‐H, Random, 95% CI) | 0.90 [0.73, 1.11] |
| 3 Placental abruption Show forest plot | 1 | Risk Ratio (M‐H, Fixed, 95% CI) | Subtotals only | |
| Analysis 5.3  Comparison 5 Multivitamin, Outcome 3 Placental abruption. | ||||
| 3.1 Multivitamins + iron + folic acid versus iron + folic acid | 1 | 60 | Risk Ratio (M‐H, Fixed, 95% CI) | 0.0 [0.0, 0.0] |
| 4 Pre‐eclampsia Show forest plot | 2 | Risk Ratio (M‐H, Fixed, 95% CI) | Subtotals only | |
| Analysis 5.4  Comparison 5 Multivitamin, Outcome 4 Pre‐eclampsia. | ||||
| 4.1 Multivitamin versus control | 1 | 5021 | Risk Ratio (M‐H, Fixed, 95% CI) | 0.70 [0.55, 0.90] |
| 4.2 Multivitamin + iron + folic acid versus iron + folic acid | 1 | 60 | Risk Ratio (M‐H, Fixed, 95% CI) | 0.24 [0.06, 1.01] |
| 5 Stillbirth Show forest plot | 11 | Risk Ratio (M‐H, Random, 95% CI) | Subtotals only | |
| Analysis 5.5  Comparison 5 Multivitamin, Outcome 5 Stillbirth. | ||||
| 5.1 Multivitamin + folic acid versus no multivitamin/folic acid | 3 | 6883 | Risk Ratio (M‐H, Random, 95% CI) | 1.04 [0.51, 2.10] |
| 5.2 Multivitamin without folic acid versus no multivitamin/folic acid | 1 | 907 | Risk Ratio (M‐H, Random, 95% CI) | 0.14 [0.01, 2.76] |
| 5.3 Multivitamin with/without folic acid versus no multivitamin/folic acid | 1 | 1368 | Risk Ratio (M‐H, Random, 95% CI) | 0.33 [0.06, 1.97] |
| 5.4 Multivitamin + folic acid versus folic acid | 2 | 1096 | Risk Ratio (M‐H, Random, 95% CI) | 0.97 [0.14, 6.88] |
| 5.5 Multivitamin without folic acid versus folic acid | 2 | 1090 | Risk Ratio (M‐H, Random, 95% CI) | 0.99 [0.04, 22.88] |
| 5.6 Multivitamin with/without folic acid versus folic acid | 2 | 1644 | Risk Ratio (M‐H, Random, 95% CI) | 0.79 [0.15, 4.10] |
| 5.7 Multivitamin versus control | 1 | 5021 | Risk Ratio (M‐H, Random, 95% CI) | 0.83 [0.58, 1.17] |
| 5.8 Multivitamin + vitamin E versus multivitamin without vitamin E or controls | 1 | 823 | Risk Ratio (M‐H, Random, 95% CI) | 0.88 [0.39, 1.98] |
| 5.9 Multivitamin + iron + folic acid versus iron + folic acid | 5 | 42404 | Risk Ratio (M‐H, Random, 95% CI) | 0.90 [0.75, 1.07] |
| 6 Perinatal death Show forest plot | 5 | Relative risk (Random, 95% CI) | Subtotals only | |
| Analysis 5.6  Comparison 5 Multivitamin, Outcome 6 Perinatal death. | ||||
| 6.1 Multivitamin + folic acid + iron + zinc + vitamin A versus folic acid + iron + zinc + vitamin A | 1 | 4308 | Relative risk (Random, 95% CI) | 1.11 [0.98, 1.26] |
| 6.2 Multivitamin + iron + folic acid versus iron + folic acid | 4 | 42344 | Relative risk (Random, 95% CI) | 0.99 [0.80, 1.21] |
| 7 Neonatal death Show forest plot | 8 | Relative risk (Fixed, 95% CI) | Subtotals only | |
| Analysis 5.7 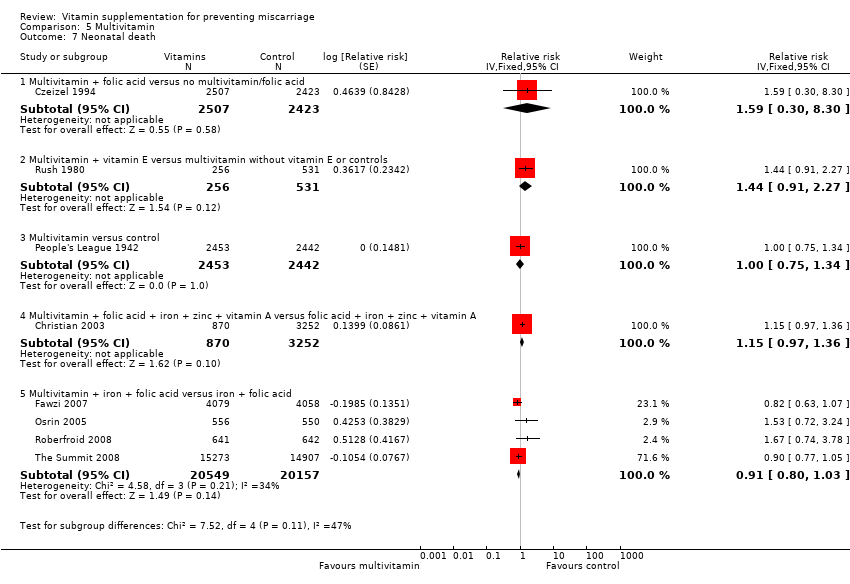 Comparison 5 Multivitamin, Outcome 7 Neonatal death. | ||||
| 7.1 Multivitamin + folic acid versus no multivitamin/folic acid | 1 | 4930 | Relative risk (Fixed, 95% CI) | 1.59 [0.30, 8.30] |
| 7.2 Multivitamin + vitamin E versus multivitamin without vitamin E or controls | 1 | 787 | Relative risk (Fixed, 95% CI) | 1.44 [0.91, 2.27] |
| 7.3 Multivitamin versus control | 1 | 4895 | Relative risk (Fixed, 95% CI) | 1.0 [0.75, 1.34] |
| 7.4 Multivitamin + folic acid + iron + zinc + vitamin A versus folic acid + iron + zinc + vitamin A | 1 | 4122 | Relative risk (Fixed, 95% CI) | 1.15 [0.97, 1.36] |
| 7.5 Multivitamin + iron + folic acid versus iron + folic acid | 4 | 40706 | Relative risk (Fixed, 95% CI) | 0.91 [0.80, 1.03] |
| 8 Preterm birth Show forest plot | 8 | Relative risk (Fixed, 95% CI) | Subtotals only | |
| Analysis 5.8  Comparison 5 Multivitamin, Outcome 8 Preterm birth. | ||||
| 8.1 Multivitamin + folic acid versus no multivitamin/folic acid | 1 | 5502 | Relative risk (Fixed, 95% CI) | 1.01 [0.91, 1.12] |
| 8.2 Multivitamin + folic acid + iron + zinc + vitamin A versus folic acid + iron + zinc + vitamin A | 1 | 3320 | Relative risk (Fixed, 95% CI) | 0.98 [0.90, 1.07] |
| 8.3 Multivitamin + vitamin E versus multivitamin without vitamin E or controls | 1 | 814 | Relative risk (Fixed, 95% CI) | 0.99 [0.85, 1.15] |
| 8.4 Multivitamin + iron + folic acid versus iron + folic acid | 5 | 39540 | Relative risk (Fixed, 95% CI) | 1.00 [0.96, 1.04] |
| 9 Very preterm birth Show forest plot | 1 | 8428 | Risk Ratio (M‐H, Fixed, 95% CI) | 0.88 [0.73, 1.06] |
| Analysis 5.9  Comparison 5 Multivitamin, Outcome 9 Very preterm birth. | ||||
| 9.1 Multivitamin + iron + folic acid versus iron + folic acid | 1 | 8428 | Risk Ratio (M‐H, Fixed, 95% CI) | 0.88 [0.73, 1.06] |
| 10 Birthweight Show forest plot | 4 | Mean Difference (IV, Fixed, 95% CI) | Subtotals only | |
| Analysis 5.10 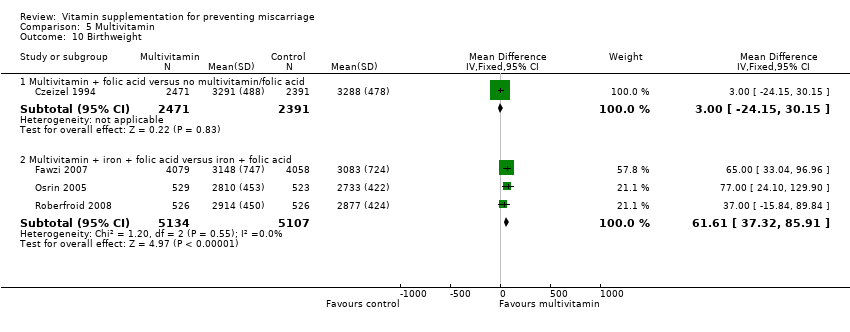 Comparison 5 Multivitamin, Outcome 10 Birthweight. | ||||
| 10.1 Multivitamin + folic acid versus no multivitamin/folic acid | 1 | 4862 | Mean Difference (IV, Fixed, 95% CI) | 3.0 [‐24.15, 30.15] |
| 10.2 Multivitamin + iron + folic acid versus iron + folic acid | 3 | 10241 | Mean Difference (IV, Fixed, 95% CI) | 61.61 [37.32, 85.91] |
| 11 Small‐for‐gestational age (birthweight less than the 10th percentile or < 2500 g Show forest plot | 8 | Relative risk (Random, 95% CI) | Subtotals only | |
| Analysis 5.11  Comparison 5 Multivitamin, Outcome 11 Small‐for‐gestational age (birthweight less than the 10th percentile or < 2500 g. | ||||
| 11.1 Multivitamin + folic acid versus no multivitamin/folic acid | 1 | 4862 | Relative risk (Random, 95% CI) | 1.09 [0.94, 1.26] |
| 11.2 Multivitamin + folic acid versus no multivitamin/folic acid (birthweight < 2500 g) | 1 | 186 | Relative risk (Random, 95% CI) | 0.91 [0.63, 1.32] |
| 11.3 Multivitamin + folic acid + iron + zinc + vitamin A versus folic acid + iron + zinc + vitamin A | 1 | 3320 | Relative risk (Random, 95% CI) | 0.98 [0.95, 1.02] |
| 11.4 Multivitamin + folic acid + iron + zinc + vitamin A versus folic acid + iron + zinc + vitamin A (birthweight < 2500 g) | 1 | 3325 | Relative risk (Random, 95% CI) | 0.95 [0.90, 1.00] |
| 11.5 Multivitamins + iron + folic acid versus iron + folic acid | 5 | 21434 | Relative risk (Random, 95% CI) | 0.93 [0.77, 1.12] |
| 12 Congenital malformations Show forest plot | 4 | Risk Ratio (M‐H, Fixed, 95% CI) | Subtotals only | |
| Analysis 5.12  Comparison 5 Multivitamin, Outcome 12 Congenital malformations. | ||||
| 12.1 Multivitamin + folic acid versus no multivitamin/folic acid | 2 | 5777 | Risk Ratio (M‐H, Fixed, 95% CI) | 1.69 [0.81, 3.53] |
| 12.2 Multivitamin without folic acid without versus no multivitamin/folic acid | 1 | 907 | Risk Ratio (M‐H, Fixed, 95% CI) | 1.60 [0.53, 4.86] |
| 12.3 Multivitamin with/without folic acid versus no multivitamin/folic acid | 1 | 1368 | Risk Ratio (M‐H, Fixed, 95% CI) | 1.99 [0.75, 5.26] |
| 12.4 Multivitamin + folic acid versus folic acid | 2 | 1096 | Risk Ratio (M‐H, Fixed, 95% CI) | 1.71 [0.72, 4.04] |
| 12.5 Multivitamin without folic acid versus folic acid | 2 | 1090 | Risk Ratio (M‐H, Fixed, 95% CI) | 1.61 [0.67, 3.85] |
| 12.6 Multivitamin with/without folic acid versus folic acid | 2 | 1644 | Risk Ratio (M‐H, Fixed, 95% CI) | 1.66 [0.76, 3.63] |
| 12.7 Multivitamin + iron + folic acid versus iron + folic acid | 1 | 1200 | Risk Ratio (M‐H, Fixed, 95% CI) | 1.0 [0.14, 7.08] |
| 13 Multiple pregnancy Show forest plot | 2 | 5141 | Risk Ratio (M‐H, Fixed, 95% CI) | 1.36 [1.00, 1.85] |
| Analysis 5.13  Comparison 5 Multivitamin, Outcome 13 Multiple pregnancy. | ||||
| 13.1 Multivitamin + folic acid versus no multivitamin/folic acid | 2 | 5141 | Risk Ratio (M‐H, Fixed, 95% CI) | 1.36 [1.00, 1.85] |
| 14 Maternal anaemia Show forest plot | 4 | Relative risk (Fixed, 95% CI) | Subtotals only | |
| Analysis 5.14  Comparison 5 Multivitamin, Outcome 14 Maternal anaemia. | ||||
| 14.1 Multivitamin + folic acid + iron + zinc + vitamin A versus folic acid + iron + zinc + vitamin A (any anaemia) | 1 | 813 | Relative risk (Fixed, 95% CI) | 0.92 [0.83, 1.03] |
| 14.2 Multivitamin + folic acid + iron + zinc+vitamin A versus folic acid + iron + zinc + vitamin A (severe anaemia) | 1 | 813 | Relative risk (Fixed, 95% CI) | 0.82 [0.53, 1.27] |
| 14.3 Multivitamins versus placebo | 1 | 538 | Relative risk (Fixed, 95% CI) | 0.78 [0.50, 1.22] |
| 14.4 Multivitamins + vitamin A + beta‐carotene versus placebo | 1 | 535 | Relative risk (Fixed, 95% CI) | 0.82 [0.53, 1.26] |
| 14.5 Multivitamins + iron + folic acid versus iron + folic acid | 2 | 2278 | Relative risk (Fixed, 95% CI) | 0.88 [0.81, 0.96] |
| 15 Breastfeeding Show forest plot | 1 | 4878 | Risk Ratio (M‐H, Fixed, 95% CI) | 0.98 [0.96, 1.01] |
| Analysis 5.15  Comparison 5 Multivitamin, Outcome 15 Breastfeeding. | ||||
| 15.1 Multivitamin versus control | 1 | 4878 | Risk Ratio (M‐H, Fixed, 95% CI) | 0.98 [0.96, 1.01] |
| 16 Poor growth at childhood follow up: Underweight in childhood (6‐8 years of age) Show forest plot | 1 | 3356 | Risk Ratio (Fixed, 95% CI) | 1.05 [0.97, 1.13] |
| Analysis 5.16 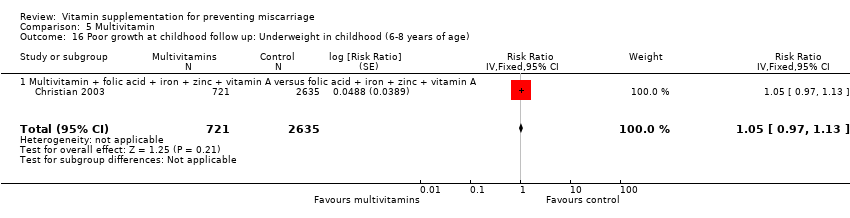 Comparison 5 Multivitamin, Outcome 16 Poor growth at childhood follow up: Underweight in childhood (6‐8 years of age). | ||||
| 16.1 Multivitamin + folic acid + iron + zinc + vitamin A versus folic acid + iron + zinc + vitamin A | 1 | 3356 | Risk Ratio (Fixed, 95% CI) | 1.05 [0.97, 1.13] |
| 17 Poor growth at childhood follow up: Stunting in childhood (6‐8 years of age) Show forest plot | 1 | 3356 | Risk Ratio (Fixed, 95% CI) | 1.09 [1.00, 1.19] |
| Analysis 5.17  Comparison 5 Multivitamin, Outcome 17 Poor growth at childhood follow up: Stunting in childhood (6‐8 years of age). | ||||
| 17.1 Multivitamin + folic acid + iron + zinc + vitamin A versus folic acid + iron + zinc + vitamin A | 1 | 3356 | Risk Ratio (Fixed, 95% CI) | 1.09 [1.00, 1.19] |
| 18 Additional outcomes ‐ infant death Show forest plot | 1 | 4122 | Relative risk (Fixed, 95% CI) | 1.10 [0.94, 1.29] |
| Analysis 5.18  Comparison 5 Multivitamin, Outcome 18 Additional outcomes ‐ infant death. | ||||
| 18.1 Multivitamin + folic acid + iron + zinc + vitamin A versus folic acid + iron + zinc + vitamin A | 1 | 4122 | Relative risk (Fixed, 95% CI) | 1.10 [0.94, 1.29] |
| Outcome or subgroup title | No. of studies | No. of participants | Statistical method | Effect size |
| 1 Total fetal loss (including miscarriages or combined miscarriages and stillbirths) Show forest plot | 6 | Risk Ratio (M‐H, Fixed, 95% CI) | Subtotals only | |
| Analysis 6.1 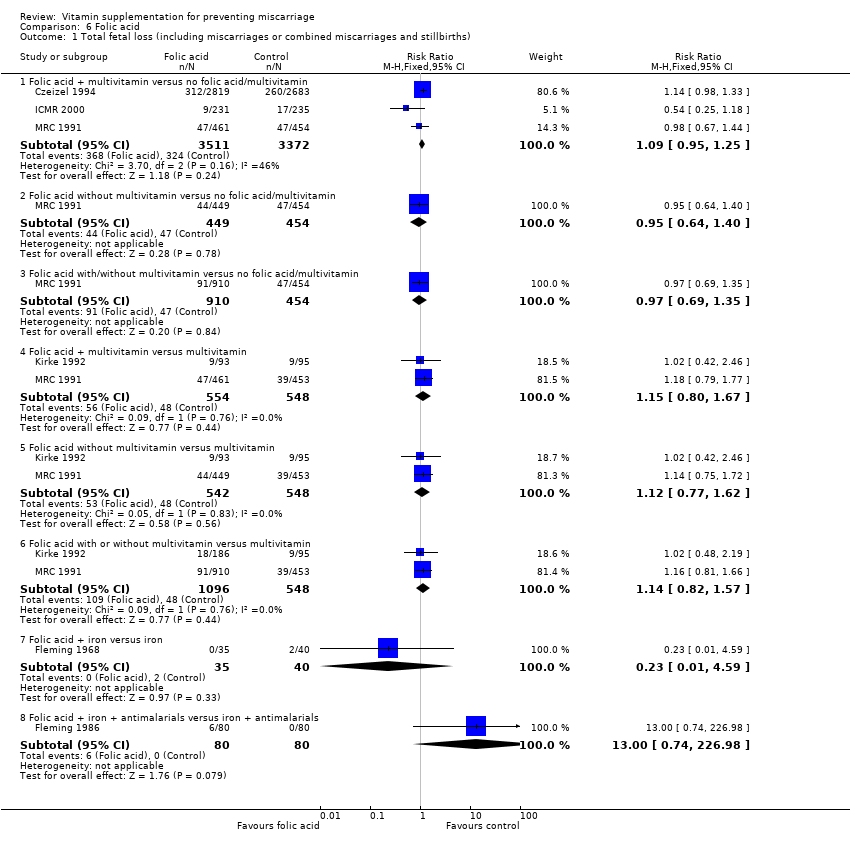 Comparison 6 Folic acid, Outcome 1 Total fetal loss (including miscarriages or combined miscarriages and stillbirths). | ||||
| 1.1 Folic acid + multivitamin versus no folic acid/multivitamin | 3 | 6883 | Risk Ratio (M‐H, Fixed, 95% CI) | 1.09 [0.95, 1.25] |
| 1.2 Folic acid without multivitamin versus no folic acid/multivitamin | 1 | 903 | Risk Ratio (M‐H, Fixed, 95% CI) | 0.95 [0.64, 1.40] |
| 1.3 Folic acid with/without multivitamin versus no folic acid/multivitamin | 1 | 1364 | Risk Ratio (M‐H, Fixed, 95% CI) | 0.97 [0.69, 1.35] |
| 1.4 Folic acid + multivitamin versus multivitamin | 2 | 1102 | Risk Ratio (M‐H, Fixed, 95% CI) | 1.15 [0.80, 1.67] |
| 1.5 Folic acid without multivitamin versus multivitamin | 2 | 1090 | Risk Ratio (M‐H, Fixed, 95% CI) | 1.12 [0.77, 1.62] |
| 1.6 Folic acid with or without multivitamin versus multivitamin | 2 | 1644 | Risk Ratio (M‐H, Fixed, 95% CI) | 1.14 [0.82, 1.57] |
| 1.7 Folic acid + iron versus iron | 1 | 75 | Risk Ratio (M‐H, Fixed, 95% CI) | 0.23 [0.01, 4.59] |
| 1.8 Folic acid + iron + antimalarials versus iron + antimalarials | 1 | 160 | Risk Ratio (M‐H, Fixed, 95% CI) | 13.0 [0.74, 226.98] |
| 2 Early or late miscarriage Show forest plot | 6 | Risk Ratio (M‐H, Random, 95% CI) | Subtotals only | |
| Analysis 6.2  Comparison 6 Folic acid, Outcome 2 Early or late miscarriage. | ||||
| 2.1 Folic acid + multivitamin versus no folic acid/multivitamin | 3 | 6883 | Risk Ratio (M‐H, Random, 95% CI) | 0.99 [0.72, 1.38] |
| 2.2 Folic acid without multivitamins versus no folic acid/multivitamin | 1 | 903 | Risk Ratio (M‐H, Random, 95% CI) | 0.97 [0.65, 1.44] |
| 2.3 Folic acid with/without multivitamin versus no folic acid/multivitamin | 1 | 1364 | Risk Ratio (M‐H, Random, 95% CI) | 0.99 [0.70, 1.39] |
| 2.4 Folic acid + multivitamin versus multivitamin | 2 | 1102 | Risk Ratio (M‐H, Random, 95% CI) | 1.16 [0.80, 1.69] |
| 2.5 Folic acid without multivitamin versus multivitamin | 2 | 1090 | Risk Ratio (M‐H, Random, 95% CI) | 1.12 [0.77, 1.64] |
| 2.6 Folic acid with/without multivitamin versus multivitamin | 2 | 1642 | Risk Ratio (M‐H, Random, 95% CI) | 1.09 [0.79, 1.51] |
| 2.7 Folic acid + iron versus iron | 1 | 75 | Risk Ratio (M‐H, Random, 95% CI) | 0.38 [0.02, 9.03] |
| 2.8 Folic acid + iron + antimalarials versus iron + antimalarials | 1 | 160 | Risk Ratio (M‐H, Random, 95% CI) | 13.0 [0.74, 226.98] |
| 3 Pre‐eclampsia Show forest plot | 1 | 75 | Risk Ratio (M‐H, Fixed, 95% CI) | 1.14 [0.17, 7.69] |
| Analysis 6.3  Comparison 6 Folic acid, Outcome 3 Pre‐eclampsia. | ||||
| 3.1 Folic acid + iron versus iron | 1 | 75 | Risk Ratio (M‐H, Fixed, 95% CI) | 1.14 [0.17, 7.69] |
| 4 Stillbirth Show forest plot | 5 | Risk Ratio (M‐H, Fixed, 95% CI) | Subtotals only | |
| Analysis 6.4  Comparison 6 Folic acid, Outcome 4 Stillbirth. | ||||
| 4.1 Folic acid + multivitamin versus no folic acid/multivitamin | 3 | 6883 | Risk Ratio (M‐H, Fixed, 95% CI) | 1.03 [0.51, 2.09] |
| 4.2 Folic acid without multivitamin versus no folic acid/multivitamin | 1 | 903 | Risk Ratio (M‐H, Fixed, 95% CI) | 0.67 [0.11, 4.02] |
| 4.3 Folic acid with/without multivitamin versus no folic acid/multivitamin | 1 | 1364 | Risk Ratio (M‐H, Fixed, 95% CI) | 0.67 [0.15, 2.96] |
| 4.4 Folic acid + multivitamin versus multivitamin | 2 | 1102 | Risk Ratio (M‐H, Fixed, 95% CI) | 1.00 [0.20, 4.99] |
| 4.5 Folic acid without multivitamin versus multivitamin | 2 | 1090 | Risk Ratio (M‐H, Fixed, 95% CI) | 4.97 [0.58, 42.29] |
| 4.6 Folic acid with/without multivitamin versus multivitamin | 2 | 1644 | Risk Ratio (M‐H, Fixed, 95% CI) | 0.84 [0.20, 3.53] |
| 4.7 Folic acid + iron versus iron | 1 | 75 | Risk Ratio (M‐H, Fixed, 95% CI) | 0.38 [0.02, 9.03] |
| 5 Perinatal death Show forest plot | 1 | 4308 | Relative risk (Fixed, 95% CI) | 0.97 [0.85, 1.11] |
| Analysis 6.5 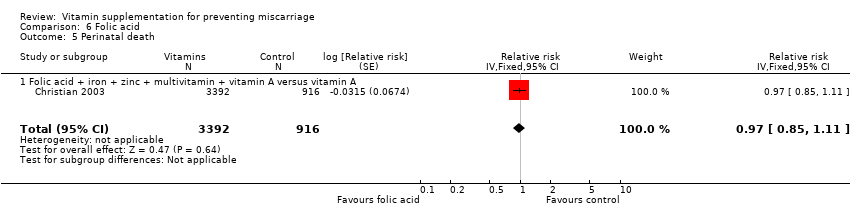 Comparison 6 Folic acid, Outcome 5 Perinatal death. | ||||
| 5.1 Folic acid + iron + zinc + multivitamin + vitamin A versus vitamin A | 1 | 4308 | Relative risk (Fixed, 95% CI) | 0.97 [0.85, 1.11] |
| 6 Neonatal death Show forest plot | 2 | Relative risk (Fixed, 95% CI) | Subtotals only | |
| Analysis 6.6  Comparison 6 Folic acid, Outcome 6 Neonatal death. | ||||
| 6.1 Folic acid + multivitamin versus no folic acid/multivitamin | 1 | 4930 | Relative risk (Fixed, 95% CI) | 1.59 [0.30, 8.28] |
| 6.2 Folic acid + iron + zinc + multivitamin + vitamin A versus vitamin A | 1 | 4122 | Relative risk (Fixed, 95% CI) | 0.96 [0.80, 1.14] |
| 7 Preterm birth Show forest plot | 3 | Relative risk (Fixed, 95% CI) | Subtotals only | |
| Analysis 6.7  Comparison 6 Folic acid, Outcome 7 Preterm birth. | ||||
| 7.1 Folic acid + multivitamin versus no folic acid/multivitamin | 1 | 5502 | Relative risk (Fixed, 95% CI) | 1.01 [0.91, 1.12] |
| 7.2 Folic acid + multivitamin versus no folic acid/multivitamin | 1 | 75 | Relative risk (Fixed, 95% CI) | 1.01 [0.65, 1.56] |
| 7.3 Folic acid + iron + zinc + multivitamin + vitamin A versus vitamin A | 1 | 3320 | Relative risk (Fixed, 95% CI) | 1.02 [0.94, 1.11] |
| 8 Birthweight Show forest plot | 3 | Mean Difference (IV, Fixed, 95% CI) | Subtotals only | |
| Analysis 6.8  Comparison 6 Folic acid, Outcome 8 Birthweight. | ||||
| 8.1 Folic acid + multivitamin versus no folic acid/multivitamin | 1 | 4862 | Mean Difference (IV, Fixed, 95% CI) | 3.0 [‐24.15, 30.15] |
| 8.2 Folic acid versus placebo | 1 | 29 | Mean Difference (IV, Fixed, 95% CI) | 312.0 [108.52, 515.48] |
| 8.3 Folic + iron versus control | 1 | 45 | Mean Difference (IV, Fixed, 95% CI) | ‐32.0 [‐213.62, 149.62] |
| 9 Small‐for‐gestational age Show forest plot | 4 | Relative risk (Fixed, 95% CI) | Subtotals only | |
| Analysis 6.9 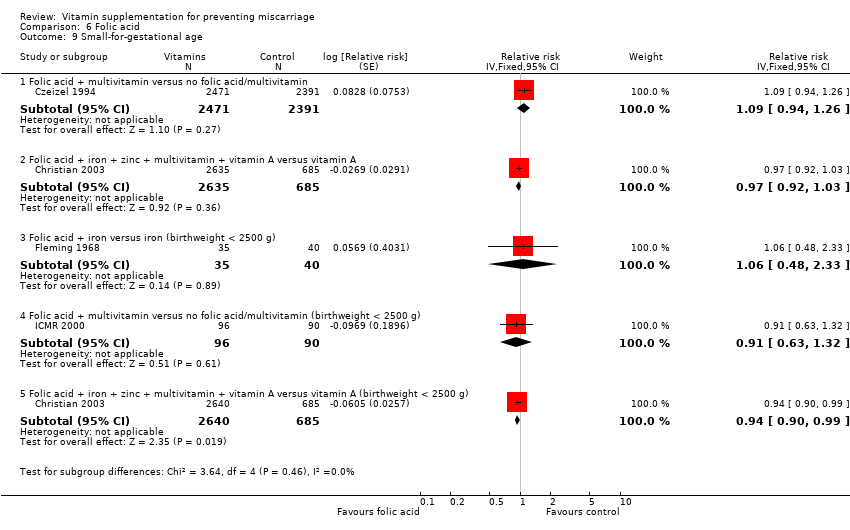 Comparison 6 Folic acid, Outcome 9 Small‐for‐gestational age. | ||||
| 9.1 Folic acid + multivitamin versus no folic acid/multivitamin | 1 | 4862 | Relative risk (Fixed, 95% CI) | 1.09 [0.94, 1.26] |
| 9.2 Folic acid + iron + zinc + multivitamin + vitamin A versus vitamin A | 1 | 3320 | Relative risk (Fixed, 95% CI) | 0.97 [0.92, 1.03] |
| 9.3 Folic acid + iron versus iron (birthweight < 2500 g) | 1 | 75 | Relative risk (Fixed, 95% CI) | 1.06 [0.48, 2.33] |
| 9.4 Folic acid + multivitamin versus no folic acid/multivitamin (birthweight < 2500 g) | 1 | 186 | Relative risk (Fixed, 95% CI) | 0.91 [0.63, 1.32] |
| 9.5 Folic acid + iron + zinc + multivitamin + vitamin A versus vitamin A (birthweight < 2500 g) | 1 | 3325 | Relative risk (Fixed, 95% CI) | 0.94 [0.90, 0.99] |
| 10 Congenital malformations Show forest plot | 3 | Risk Ratio (M‐H, Fixed, 95% CI) | Subtotals only | |
| Analysis 6.10  Comparison 6 Folic acid, Outcome 10 Congenital malformations. | ||||
| 10.1 Folic acid + multivitamin versus no folic acid/multivitamin | 2 | 5777 | Risk Ratio (M‐H, Fixed, 95% CI) | 1.69 [0.81, 3.53] |
| 10.2 Folic acid without multivitamin versus no folic acid/multivitamin | 1 | 903 | Risk Ratio (M‐H, Fixed, 95% CI) | 1.42 [0.45, 4.43] |
| 10.3 Folic acid with/without multivitamin versus no folic acid/multivitamin | 1 | 1364 | Risk Ratio (M‐H, Fixed, 95% CI) | 1.90 [0.71, 5.04] |
| 10.4 Folic acid + multivitamin versus multivitamin | 2 | 1102 | Risk Ratio (M‐H, Fixed, 95% CI) | 1.07 [0.51, 2.26] |
| 10.5 Folic acid without multivitamin versus multivitamin | 2 | 1090 | Risk Ratio (M‐H, Fixed, 95% CI) | 0.62 [0.26, 1.49] |
| 10.6 Folic acid with or without multvitamin versus multivitamin | 2 | 1644 | Risk Ratio (M‐H, Fixed, 95% CI) | 0.85 [0.43, 1.67] |
| 11 Multiple pregnancy Show forest plot | 2 | Risk Ratio (M‐H, Fixed, 95% CI) | Subtotals only | |
| Analysis 6.11  Comparison 6 Folic acid, Outcome 11 Multiple pregnancy. | ||||
| 11.1 Folic acid + multivitamin versus no folic acid/multivitamin | 2 | 5141 | Risk Ratio (M‐H, Fixed, 95% CI) | 1.36 [1.00, 1.85] |
| 12 Maternal anaemia Show forest plot | 3 | Relative risk (Fixed, 95% CI) | Subtotals only | |
| Analysis 6.12  Comparison 6 Folic acid, Outcome 12 Maternal anaemia. | ||||
| 12.1 Folic acid + iron + zinc + multivitamin + vitamin A versus vitamin A (any anaemia) | 1 | 813 | Relative risk (Fixed, 95% CI) | 0.83 [0.77, 0.91] |
| 12.2 Folic acid + iron + zinc + multivitamin + vitamin A versus vitamin A (severe anaemia) | 1 | 813 | Relative risk (Fixed, 95% CI) | 0.82 [0.59, 1.16] |
| 12.3 Folic acid + iron versus iron (severe anaemia) | 1 | 85 | Relative risk (Fixed, 95% CI) | 1.06 [0.25, 4.42] |
| 12.4 Folic acid + iron versus no folic acid or iron | 1 | 89 | Relative risk (Fixed, 95% CI) | 1.53 [0.79, 2.95] |
| 13 Poor growth in childhood: Stunting in childhood (6‐8 years of age) Show forest plot | 1 | 3356 | Risk Ratio (Fixed, 95% CI) | 0.93 [0.86, 1.00] |
| Analysis 6.13  Comparison 6 Folic acid, Outcome 13 Poor growth in childhood: Stunting in childhood (6‐8 years of age). | ||||
| 13.1 Folic acid + iron + zinc + vitamin A versus multivitamin + vitamin A | 1 | 3356 | Risk Ratio (Fixed, 95% CI) | 0.93 [0.86, 1.00] |
| 14 Poor growth in childhood: Underweight in childhood (6‐8 years of age) Show forest plot | 1 | 3356 | Risk Ratio (Fixed, 95% CI) | 0.97 [0.91, 1.04] |
| Analysis 6.14  Comparison 6 Folic acid, Outcome 14 Poor growth in childhood: Underweight in childhood (6‐8 years of age). | ||||
| 14.1 Folic acid + iron + zinc + vitamin A versus multivitamin + vitamin A | 1 | 3356 | Risk Ratio (Fixed, 95% CI) | 0.97 [0.91, 1.04] |
| 15 Placental weight Show forest plot | 1 | 29 | Mean Difference (IV, Fixed, 95% CI) | 96.0 [30.73, 161.27] |
| Analysis 6.15  Comparison 6 Folic acid, Outcome 15 Placental weight. | ||||
| 15.1 Folic acid versus placebo | 1 | 29 | Mean Difference (IV, Fixed, 95% CI) | 96.0 [30.73, 161.27] |
| 16 Additional outcomes ‐ infant death Show forest plot | 1 | 4122 | Relative risk (Fixed, 95% CI) | 0.95 [0.81, 1.11] |
| Analysis 6.16  Comparison 6 Folic acid, Outcome 16 Additional outcomes ‐ infant death. | ||||
| 16.1 Folic acid + iron + zinc + multivitamin + vitamin A versus vitamin A | 1 | 4122 | Relative risk (Fixed, 95% CI) | 0.95 [0.81, 1.11] |

Risk of bias graph: review authors' judgements about each risk of bias item presented as percentages across all included studies

Risk of bias summary: review authors' judgements about each risk of bias item for each included study

Funnel plot of comparison: 1 Any vitamins versus no vitamins (or minimal vitamins), outcome: 1.1 Total fetal loss (including miscarriages or combined miscarriages and stillbirths)

Funnel plot of comparison: 1 Any vitamins versus no vitamins (or minimal vitamins), outcome: 1.2 Early or late miscarriage

Funnel plot of comparison: 5 Multivitamin, outcome: 5.1 Total fetal loss (including miscarriages or combined miscarriages and stillbirths)

Funnel plot of comparison: 5 Multivitamin, outcome: 5.2 Early or late miscarriage
Comparison 1 Any vitamins versus no vitamins (or minimal vitamins), Outcome 1 Total fetal loss (including miscarriages or combined miscarriages and stillbirths).
Comparison 1 Any vitamins versus no vitamins (or minimal vitamins), Outcome 2 Early or late miscarriage.
Comparison 1 Any vitamins versus no vitamins (or minimal vitamins), Outcome 3 Placental abruption.
Comparison 1 Any vitamins versus no vitamins (or minimal vitamins), Outcome 5 Pre‐eclampsia.
Comparison 1 Any vitamins versus no vitamins (or minimal vitamins), Outcome 6 Stillbirth.
Comparison 1 Any vitamins versus no vitamins (or minimal vitamins), Outcome 7 Perinatal death.
Comparison 1 Any vitamins versus no vitamins (or minimal vitamins), Outcome 8 Neonatal death.
Comparison 1 Any vitamins versus no vitamins (or minimal vitamins), Outcome 9 Preterm birth.
Comparison 1 Any vitamins versus no vitamins (or minimal vitamins), Outcome 10 Very preterm birth.
Comparison 1 Any vitamins versus no vitamins (or minimal vitamins), Outcome 11 Birthweight.
Comparison 1 Any vitamins versus no vitamins (or minimal vitamins), Outcome 12 Small‐for‐gestational age.
Comparison 1 Any vitamins versus no vitamins (or minimal vitamins), Outcome 13 Congenital malformations.
Comparison 1 Any vitamins versus no vitamins (or minimal vitamins), Outcome 14 Multiple pregnancy.
Comparison 1 Any vitamins versus no vitamins (or minimal vitamins), Outcome 15 Apgar score less than seven at five minutes.
Comparison 1 Any vitamins versus no vitamins (or minimal vitamins), Outcome 17 Anaemia (maternal).
Comparison 1 Any vitamins versus no vitamins (or minimal vitamins), Outcome 18 Anaemia (infant).
Comparison 1 Any vitamins versus no vitamins (or minimal vitamins), Outcome 19 Placental weight.
Comparison 1 Any vitamins versus no vitamins (or minimal vitamins), Outcome 20 Method of feeding.
Comparison 1 Any vitamins versus no vitamins (or minimal vitamins), Outcome 24 Any adverse effects of vitamin supplementation sufficient to stop supplementation.
Comparison 1 Any vitamins versus no vitamins (or minimal vitamins), Outcome 26 Gynaecological hospital admission.
Comparison 1 Any vitamins versus no vitamins (or minimal vitamins), Outcome 27 Admission to neonatal intensive care unit.
Comparison 1 Any vitamins versus no vitamins (or minimal vitamins), Outcome 29 Duration of admission to the neonatal intensive care unit.
Comparison 1 Any vitamins versus no vitamins (or minimal vitamins), Outcome 30 Side effects.
Comparison 2 Any vitamins (by quality), Outcome 1 Total fetal loss (including miscarriage or combined miscarriages and stillbirths).
Comparison 2 Any vitamins (by quality), Outcome 2 Early or late miscarriage.
Comparison 2 Any vitamins (by quality), Outcome 3 Stillbirth.
Comparison 3 Vitamin C, Outcome 1 Total fetal loss.
Comparison 3 Vitamin C, Outcome 2 Early or late miscarriage.
Comparison 3 Vitamin C, Outcome 3 Antepartum haemorrhage and placental abruption.
Comparison 3 Vitamin C, Outcome 4 Pre‐eclampsia.
Comparison 3 Vitamin C, Outcome 5 Stillbirth.
Comparison 3 Vitamin C, Outcome 6 Perinatal death.
Comparison 3 Vitamin C, Outcome 7 Neonatal death.
Comparison 3 Vitamin C, Outcome 8 Preterm birth.
Comparison 3 Vitamin C, Outcome 9 Very preterm birth.
Comparison 3 Vitamin C, Outcome 10 Small‐for‐gestational age.
Comparison 3 Vitamin C, Outcome 11 Birthweight.
Comparison 3 Vitamin C, Outcome 12 Congenital malformations.
Comparison 3 Vitamin C, Outcome 13 Apgar score less than seven at five minutes.
Comparison 3 Vitamin C, Outcome 14 Any adverse effects of vitamin supplementation sufficient to stop supplementation.
Comparison 3 Vitamin C, Outcome 15 Gynaecological hospital admission.
Comparison 3 Vitamin C, Outcome 16 Admission to neonatal intensive care unit.
Comparison 3 Vitamin C, Outcome 17 Side effects.
Comparison 4 Vitamin A, Outcome 1 Total fetal loss (including miscarriages or combined miscarriages and stillbirths).
Comparison 4 Vitamin A, Outcome 2 Early or late miscarriage.
Comparison 4 Vitamin A, Outcome 3 Stillbirth.
Comparison 4 Vitamin A, Outcome 4 Neonatal death.
Comparison 4 Vitamin A, Outcome 5 Preterm birth.
Comparison 4 Vitamin A, Outcome 6 Birthweight.
Comparison 4 Vitamin A, Outcome 7 Small‐for‐gestational age.
Comparison 4 Vitamin A, Outcome 8 Multiple pregnancy.
Comparison 4 Vitamin A, Outcome 9 Very preterm birth.
Comparison 4 Vitamin A, Outcome 10 Maternal anaemia.
Comparison 4 Vitamin A, Outcome 11 Infant anaemia.
Comparison 4 Vitamin A, Outcome 12 Poor growth at childhood follow up.
Comparison 5 Multivitamin, Outcome 1 Total fetal loss (including miscarriages or combined miscarriages and stillbirths).
Comparison 5 Multivitamin, Outcome 2 Early or late miscarriage.
Comparison 5 Multivitamin, Outcome 3 Placental abruption.
Comparison 5 Multivitamin, Outcome 4 Pre‐eclampsia.
Comparison 5 Multivitamin, Outcome 5 Stillbirth.
Comparison 5 Multivitamin, Outcome 6 Perinatal death.
Comparison 5 Multivitamin, Outcome 7 Neonatal death.
Comparison 5 Multivitamin, Outcome 8 Preterm birth.
Comparison 5 Multivitamin, Outcome 9 Very preterm birth.
Comparison 5 Multivitamin, Outcome 10 Birthweight.
Comparison 5 Multivitamin, Outcome 11 Small‐for‐gestational age (birthweight less than the 10th percentile or < 2500 g.
Comparison 5 Multivitamin, Outcome 12 Congenital malformations.
Comparison 5 Multivitamin, Outcome 13 Multiple pregnancy.
Comparison 5 Multivitamin, Outcome 14 Maternal anaemia.
Comparison 5 Multivitamin, Outcome 15 Breastfeeding.
Comparison 5 Multivitamin, Outcome 16 Poor growth at childhood follow up: Underweight in childhood (6‐8 years of age).
Comparison 5 Multivitamin, Outcome 17 Poor growth at childhood follow up: Stunting in childhood (6‐8 years of age).
Comparison 5 Multivitamin, Outcome 18 Additional outcomes ‐ infant death.
Comparison 6 Folic acid, Outcome 1 Total fetal loss (including miscarriages or combined miscarriages and stillbirths).
Comparison 6 Folic acid, Outcome 2 Early or late miscarriage.
Comparison 6 Folic acid, Outcome 3 Pre‐eclampsia.
Comparison 6 Folic acid, Outcome 4 Stillbirth.
Comparison 6 Folic acid, Outcome 5 Perinatal death.
Comparison 6 Folic acid, Outcome 6 Neonatal death.
Comparison 6 Folic acid, Outcome 7 Preterm birth.
Comparison 6 Folic acid, Outcome 8 Birthweight.
Comparison 6 Folic acid, Outcome 9 Small‐for‐gestational age.
Comparison 6 Folic acid, Outcome 10 Congenital malformations.
Comparison 6 Folic acid, Outcome 11 Multiple pregnancy.
Comparison 6 Folic acid, Outcome 12 Maternal anaemia.
Comparison 6 Folic acid, Outcome 13 Poor growth in childhood: Stunting in childhood (6‐8 years of age).
Comparison 6 Folic acid, Outcome 14 Poor growth in childhood: Underweight in childhood (6‐8 years of age).
Comparison 6 Folic acid, Outcome 15 Placental weight.
Comparison 6 Folic acid, Outcome 16 Additional outcomes ‐ infant death.
| Vitamin A versus placebo for preventing miscarriage | ||||||
| Patient or population: pregnant women | ||||||
| Outcomes | Illustrative comparative risks* (95% CI) | Relative effect | No of Participants | Quality of the evidence | Comments | |
| Assumed risk | Corresponding risk | |||||
| placebo | vitamin A | |||||
| Total fetal loss (including miscarriages or combined miscarriages and stillbirths) | 83 per 10002 | 86 per 1000 | RR 1.04 | 11723 | ⊕⊕⊕⊕ | |
| Neonatal death | 46 per 10002 | 50 per 1000 | RR 1.09 | 10214 | ⊕⊕⊕⊕ | |
| Preterm birth | 282 per 10002 | 293 per 1000 | RR 1.04 | 11723 | ⊕⊕⊕⊝ | |
| *The basis for the assumed risk (e.g. the median control group risk across studies) is provided in footnotes. The corresponding risk (and its 95% confidence interval) is based on the assumed risk in the comparison group and the relative effect of the intervention (and its 95% CI). | ||||||
| GRADE Working Group grades of evidence | ||||||
| 1 Follow‐up up to 24 weeks post birth. | ||||||
| Vitamin A versus B‐Carotene for preventing miscarriage | ||||||
| Patient or population: pregnant women | ||||||
| Outcomes | Illustrative comparative risks* (95% CI) | Relative effect | No of Participants | Quality of the evidence | Comments | |
| Assumed risk | Corresponding risk | |||||
| B‐Carotene | vitamin A | |||||
| Total fetal loss (including miscarriages or combined miscarriages and stillbirths) | 95 per 10002 | 96 per 1000 | RR 1.01 | 11720 | ⊕⊕⊕⊕ | |
| Neonatal death | 50 per 10002 | 50 per 1000 | RR 1 | 10228 | ⊕⊕⊕⊕ | |
| Preterm birth | 284 per 10002 | 293 per 1000 | RR 1.03 | 11720 | ⊕⊕⊕⊝ | |
| *The basis for the assumed risk (e.g. the median control group risk across studies) is provided in footnotes. The corresponding risk (and its 95% confidence interval) is based on the assumed risk in the comparison group and the relative effect of the intervention (and its 95% CI). | ||||||
| GRADE Working Group grades of evidence | ||||||
| 1 Follow‐up up to 24 weeks post birth. | ||||||
| Vitamin A plus iron plus folate versus iron plus folate for preventing miscarriage | ||||||
| Patient or population: pregnant women | ||||||
| Outcomes | Illustrative comparative risks* (95% CI) | Relative effect | No of Participants | Quality of the evidence | Comments | |
| Assumed risk | Corresponding risk | |||||
| iron plus folate | vitamin A plus iron plus folate | |||||
| Total fetal loss (including miscarriages or combined miscarriages and stillbirths) | Low risk population | RR 1.01 | 1640 | ⊕⊝⊝⊝ | ||
| 25 per 10001 | 25 per 1000 | |||||
| Medium risk population | ||||||
| 31 per 10001 | 31 per 1000 | |||||
| High risk population | ||||||
| 52 per 10001 | 52 per 1000 | |||||
| Stillbirth | Study population | RR 1.29 | 1640 | ⊕⊝⊝⊝ | ||
| 14 per 1000 | 18 per 1000 | |||||
| Medium risk population | ||||||
| 17 per 1000 | 22 per 1000 | |||||
| Preterm birth | 56 per 10001 | 62 per 1000 | RR 1.11 | 700 | ⊕⊕⊝⊝ | |
| Birthweight | The mean birthweight in the control groups was | The mean Birthweight in the intervention groups was | 594 | ⊕⊕⊝⊝ | ||
| Maternal anaemia | Study population | RR 0.96 | 700 | ⊕⊕⊕⊝ | ||
| 513 per 1000 | 492 per 1000 | |||||
| Medium risk population | ||||||
| 513 per 1000 | 492 per 1000 | |||||
| *The basis for the assumed risk (e.g. the median control group risk across studies) is provided in footnotes. The corresponding risk (and its 95% confidence interval) is based on the assumed risk in the comparison group and the relative effect of the intervention (and its 95% CI). | ||||||
| GRADE Working Group grades of evidence | ||||||
| 1 Control group risk extracted from the original trial reference(s). | ||||||
| Study ID | Outcome | Vitamin ‐ N | Vitamin ‐ Median | Vitamin ‐ Range | Placebo ‐ N | Placebo ‐ Median | Placebo ‐ Range |
| Steyn 2003 | Median birthweight | 100 | 2491 | 240‐3834 | 100 | 2664 | 334‐4680 |
| Outcome or subgroup title | No. of studies | No. of participants | Statistical method | Effect size |
| 1 Total fetal loss (including miscarriages or combined miscarriages and stillbirths) Show forest plot | 13 | 33943 | Relative risk (Fixed, 95% CI) | 1.04 [0.95, 1.14] |
| 1.1 Trial entry before pregnancy | 5 | 25182 | Relative risk (Fixed, 95% CI) | 1.06 [0.96, 1.17] |
| 1.2 Trial entry < 12 weeks' gestation | 1 | 406 | Relative risk (Fixed, 95% CI) | 1.32 [0.63, 2.77] |
| 1.3 Trial entry >= 12 weeks' and < 20 weeks' gestation | 1 | 739 | Relative risk (Fixed, 95% CI) | 0.84 [0.38, 1.85] |
| 1.4 Trial entry 'mixed' both < 20 and >= 20 weeks' gestation | 6 | 7616 | Relative risk (Fixed, 95% CI) | 0.89 [0.66, 1.20] |
| 2 Early or late miscarriage Show forest plot | 10 | 11266 | Risk Ratio (M‐H, Fixed, 95% CI) | 1.09 [0.95, 1.25] |
| 2.1 Trial entry before pregnancy | 4 | 7809 | Risk Ratio (M‐H, Fixed, 95% CI) | 1.07 [0.93, 1.24] |
| 2.2 Trial entry < 12 weeks' gestation | 1 | 406 | Risk Ratio (M‐H, Fixed, 95% CI) | 1.32 [0.63, 2.77] |
| 2.3 Trial entry >= 12 weeks but < 20 weeks' gestation | 1 | 739 | Risk Ratio (M‐H, Fixed, 95% CI) | 1.32 [0.30, 5.87] |
| 2.4 Trial entry 'mixed' both < 20 and >= 20 weeks' gestation | 4 | 2312 | Risk Ratio (M‐H, Fixed, 95% CI) | 1.19 [0.63, 2.24] |
| 3 Placental abruption Show forest plot | 5 | Risk Ratio (M‐H, Fixed, 95% CI) | Subtotals only | |
| 3.1 Placental abruption | 4 | 4264 | Risk Ratio (M‐H, Fixed, 95% CI) | 0.66 [0.34, 1.30] |
| 3.2 Antepartum haemorrhage including placental abruption | 1 | 200 | Risk Ratio (M‐H, Fixed, 95% CI) | 7.0 [0.88, 55.86] |
| 4 Psychological effects (anxiety and depression) | 0 | 0 | Risk Ratio (M‐H, Fixed, 95% CI) | 0.0 [0.0, 0.0] |
| 5 Pre‐eclampsia Show forest plot | 7 | 9561 | Risk Ratio (M‐H, Random, 95% CI) | 0.88 [0.70, 1.09] |
| 6 Stillbirth Show forest plot | 9 | 15980 | Risk Ratio (M‐H, Fixed, 95% CI) | 0.86 [0.65, 1.13] |
| 6.1 Trial entry before pregnancy | 3 | 7785 | Risk Ratio (M‐H, Fixed, 95% CI) | 0.94 [0.48, 1.85] |
| 6.2 Trial entry < 12 weeks' gestation | 0 | 0 | Risk Ratio (M‐H, Fixed, 95% CI) | 0.0 [0.0, 0.0] |
| 6.3 Trial entry >= 12 weeks' but < 20 weeks' gestation | 1 | 739 | Risk Ratio (M‐H, Fixed, 95% CI) | 0.69 [0.27, 1.80] |
| 6.4 Trial entry 'mixed' both < 20 and >= 20 weeks' gestation | 5 | 7456 | Risk Ratio (M‐H, Fixed, 95% CI) | 0.86 [0.63, 1.19] |
| 7 Perinatal death Show forest plot | 4 | 4313 | Risk Ratio (M‐H, Fixed, 95% CI) | 0.83 [0.62, 1.11] |
| 8 Neonatal death Show forest plot | 6 | 27657 | Relative risk (Fixed, 95% CI) | 1.11 [0.94, 1.31] |
| 9 Preterm birth Show forest plot | 8 | 27414 | Relative risk (Fixed, 95% CI) | 1.02 [0.94, 1.10] |
| 10 Very preterm birth Show forest plot | 4 | 4181 | Risk Ratio (M‐H, Fixed, 95% CI) | 0.93 [0.75, 1.15] |
| 11 Birthweight Show forest plot | 5 | 7497 | Mean Difference (IV, Random, 95% CI) | 16.99 [‐37.66, 71.64] |
| 12 Small‐for‐gestational age Show forest plot | 7 | 9356 | Risk Ratio (M‐H, Fixed, 95% CI) | 0.96 [0.84, 1.08] |
| 12.1 Birthweight less than 10th centile or birthweight < 2500 g | 7 | 9356 | Risk Ratio (M‐H, Fixed, 95% CI) | 0.96 [0.84, 1.08] |
| 13 Congenital malformations Show forest plot | 4 | 8933 | Risk Ratio (M‐H, Fixed, 95% CI) | 1.47 [0.90, 2.40] |
| 14 Multiple pregnancy Show forest plot | 3 | 20986 | Relative risk (Fixed, 95% CI) | 1.38 [1.12, 1.70] |
| 15 Apgar score less than seven at five minutes Show forest plot | 1 | 700 | Risk Ratio (M‐H, Fixed, 95% CI) | 0.66 [0.27, 1.60] |
| 16 Use of blood transfusion for the mother | 0 | 0 | Risk Ratio (M‐H, Fixed, 95% CI) | 0.0 [0.0, 0.0] |
| 17 Anaemia (maternal) Show forest plot | 2 | 1190 | Risk Ratio (M‐H, Random, 95% CI) | 0.90 [0.46, 1.73] |
| 18 Anaemia (infant) Show forest plot | 1 | 836 | Risk Ratio (M‐H, Fixed, 95% CI) | 1.05 [0.98, 1.12] |
| 19 Placental weight Show forest plot | 1 | 29 | Mean Difference (IV, Fixed, 95% CI) | 96.0 [30.73, 161.27] |
| 20 Method of feeding Show forest plot | 1 | 4878 | Risk Ratio (M‐H, Fixed, 95% CI) | 0.98 [0.96, 1.01] |
| 20.1 Breastfeeding | 1 | 4878 | Risk Ratio (M‐H, Fixed, 95% CI) | 0.98 [0.96, 1.01] |
| 20.2 Formula | 0 | 0 | Risk Ratio (M‐H, Fixed, 95% CI) | 0.0 [0.0, 0.0] |
| 20.3 Breastfeeding and formula | 0 | 0 | Risk Ratio (M‐H, Fixed, 95% CI) | 0.0 [0.0, 0.0] |
| 21 Subsequent fertility | 0 | 0 | Risk Ratio (M‐H, Fixed, 95% CI) | 0.0 [0.0, 0.0] |
| 22 Poor growth at childhood follow‐up | 0 | 0 | Risk Ratio (M‐H, Fixed, 95% CI) | 0.0 [0.0, 0.0] |
| 23 Disability at childhood follow‐up | 0 | 0 | Risk Ratio (M‐H, Fixed, 95% CI) | 0.0 [0.0, 0.0] |
| 24 Any adverse effects of vitamin supplementation sufficient to stop supplementation Show forest plot | 1 | 739 | Risk Ratio (M‐H, Fixed, 95% CI) | 1.16 [0.39, 3.41] |
| 25 Maternal views of care | 0 | 0 | Mean Difference (IV, Fixed, 95% CI) | 0.0 [0.0, 0.0] |
| 26 Gynaecological hospital admission Show forest plot | 1 | 1365 | Risk Ratio (M‐H, Fixed, 95% CI) | 0.20 [0.02, 1.69] |
| 26.1 Any maternal admission to ICU | 1 | 1365 | Risk Ratio (M‐H, Fixed, 95% CI) | 0.20 [0.02, 1.69] |
| 27 Admission to neonatal intensive care unit Show forest plot | 2 | Risk Ratio (M‐H, Fixed, 95% CI) | Subtotals only | |
| 27.1 Any admission to NICU | 1 | 1515 | Risk Ratio (M‐H, Fixed, 95% CI) | 0.81 [0.59, 1.11] |
| 27.2 > 4 days of NICU care | 1 | 1853 | Risk Ratio (M‐H, Fixed, 95% CI) | 0.60 [0.27, 1.37] |
| 27.3 > 7 days in NICU | 1 | 1515 | Risk Ratio (M‐H, Fixed, 95% CI) | 0.87 [0.54, 1.39] |
| 28 Healthcare costs | 0 | 0 | Mean Difference (IV, Fixed, 95% CI) | 0.0 [0.0, 0.0] |
| 29 Duration of admission to the neonatal intensive care unit Show forest plot | 1 | 181 | Mean Difference (IV, Fixed, 95% CI) | 1.30 [‐0.28, 2.88] |
| 30 Side effects Show forest plot | 1 | 1734 | Risk Ratio (M‐H, Fixed, 95% CI) | 1.63 [1.12, 2.36] |
| 30.1 Abdominal pain | 1 | 1734 | Risk Ratio (M‐H, Fixed, 95% CI) | 1.63 [1.12, 2.36] |
| Outcome or subgroup title | No. of studies | No. of participants | Statistical method | Effect size |
| 1 Total fetal loss (including miscarriage or combined miscarriages and stillbirths) Show forest plot | 5 | Relative risk (Fixed, 95% CI) | 0.97 [0.84, 1.12] | |
| 1.1 Allocation concealment is adequate | 5 | Relative risk (Fixed, 95% CI) | 0.97 [0.84, 1.12] | |
| 2 Early or late miscarriage Show forest plot | 4 | 4633 | Risk Ratio (M‐H, Fixed, 95% CI) | 0.95 [0.71, 1.27] |
| 2.1 Allocation concealment is adequate | 4 | 4633 | Risk Ratio (M‐H, Fixed, 95% CI) | 0.95 [0.71, 1.27] |
| 3 Stillbirth Show forest plot | 5 | 4916 | Risk Ratio (M‐H, Fixed, 95% CI) | 0.85 [0.47, 1.53] |
| 3.1 Allocation concealment is adequate | 5 | 4916 | Risk Ratio (M‐H, Fixed, 95% CI) | 0.85 [0.47, 1.53] |
| Outcome or subgroup title | No. of studies | No. of participants | Statistical method | Effect size |
| 1 Total fetal loss Show forest plot | 6 | Risk Ratio (M‐H, Fixed, 95% CI) | Subtotals only | |
| 1.1 Vitamin C + multivitamins versus placebo plus multivitamins | 1 | 406 | Risk Ratio (M‐H, Fixed, 95% CI) | 1.32 [0.63, 2.77] |
| 1.2 Vitamin C and vitamin E versus placebo | 3 | 2899 | Risk Ratio (M‐H, Fixed, 95% CI) | 0.82 [0.48, 1.42] |
| 1.3 Vitamin C versus no supplement/placebo | 2 | 224 | Risk Ratio (M‐H, Fixed, 95% CI) | 1.28 [0.58, 2.83] |
| 2 Early or late miscarriage Show forest plot | 5 | Risk Ratio (M‐H, Fixed, 95% CI) | Subtotals only | |
| 2.1 Vitamin C + multivitamins versus placebo plus multivitamins | 1 | 406 | Risk Ratio (M‐H, Fixed, 95% CI) | 1.32 [0.63, 2.77] |
| 2.2 Vitamin C and vitamin E versus placebo | 2 | 2616 | Risk Ratio (M‐H, Fixed, 95% CI) | 0.70 [0.27, 1.84] |
| 2.3 Vitamin C versus no supplement/placebo | 2 | 224 | Risk Ratio (M‐H, Fixed, 95% CI) | 1.17 [0.52, 2.65] |
| 3 Antepartum haemorrhage and placental abruption Show forest plot | 5 | Risk Ratio (M‐H, Fixed, 95% CI) | Subtotals only | |
| 3.1 Vitamin C and vitamin E versus placebo ‐ placental abruption only | 4 | 4264 | Risk Ratio (M‐H, Fixed, 95% CI) | 0.66 [0.34, 1.30] |
| 3.2 Vitamin C versus placebo ‐ antepartum haemorrhage including placental abruption | 1 | 200 | Risk Ratio (M‐H, Fixed, 95% CI) | 7.0 [0.88, 55.86] |
| 4 Pre‐eclampsia Show forest plot | 5 | Risk Ratio (M‐H, Random, 95% CI) | Subtotals only | |
| 4.1 Vitamin C and vitamin E versus placebo | 4 | 4264 | Risk Ratio (M‐H, Random, 95% CI) | 0.94 [0.72, 1.22] |
| 4.2 Vitamin C versus placebo | 1 | 200 | Risk Ratio (M‐H, Random, 95% CI) | 1.0 [0.21, 4.84] |
| 5 Stillbirth Show forest plot | 4 | Risk Ratio (M‐H, Fixed, 95% CI) | Subtotals only | |
| 5.1 Vitamin C and vitamin E versus placebo | 3 | 2899 | Risk Ratio (M‐H, Fixed, 95% CI) | 0.89 [0.46, 1.73] |
| 5.2 Vitamin C versus placebo | 1 | 200 | Risk Ratio (M‐H, Fixed, 95% CI) | 3.0 [0.12, 72.77] |
| 6 Perinatal death Show forest plot | 4 | 4313 | Risk Ratio (M‐H, Fixed, 95% CI) | 0.83 [0.62, 1.11] |
| 6.1 Vitamin C versus placebo | 1 | 182 | Risk Ratio (M‐H, Fixed, 95% CI) | 0.51 [0.05, 5.54] |
| 6.2 Vitamin C and vitamin E versus placebo | 3 | 4131 | Risk Ratio (M‐H, Fixed, 95% CI) | 0.84 [0.63, 1.12] |
| 7 Neonatal death Show forest plot | 3 | 2717 | Risk Ratio (M‐H, Fixed, 95% CI) | 0.69 [0.30, 1.61] |
| 7.1 Vitamin C versus placebo | 1 | 181 | Risk Ratio (M‐H, Fixed, 95% CI) | 0.69 [0.12, 4.03] |
| 7.2 Vitamin C and E versus placebo | 2 | 2536 | Risk Ratio (M‐H, Fixed, 95% CI) | 0.69 [0.27, 1.81] |
| 8 Preterm birth Show forest plot | 5 | Risk Ratio (M‐H, Fixed, 95% CI) | Subtotals only | |
| 8.1 Vitamin C and vitamin E versus placebo | 4 | 4264 | Risk Ratio (M‐H, Fixed, 95% CI) | 0.97 [0.85, 1.10] |
| 8.2 Vitamin C versus placebo | 1 | 200 | Risk Ratio (M‐H, Fixed, 95% CI) | 1.43 [1.03, 1.99] |
| 9 Very preterm birth Show forest plot | 4 | 4181 | Risk Ratio (M‐H, Fixed, 95% CI) | 0.93 [0.75, 1.15] |
| 9.1 Vitamin C versus placebo | 1 | 200 | Risk Ratio (M‐H, Fixed, 95% CI) | 1.3 [0.78, 2.17] |
| 9.2 Vitamin C and vitamin E versus placebo | 3 | 3981 | Risk Ratio (M‐H, Fixed, 95% CI) | 0.88 [0.70, 1.10] |
| 10 Small‐for‐gestational age Show forest plot | 4 | 4233 | Risk Ratio (M‐H, Fixed, 95% CI) | 0.90 [0.78, 1.04] |
| 10.1 Vitamin C and vitamin E versus placebo | 4 | 4233 | Risk Ratio (M‐H, Fixed, 95% CI) | 0.90 [0.78, 1.04] |
| 11 Birthweight Show forest plot | 2 | 2561 | Mean Difference (IV, Fixed, 95% CI) | 1.25 [‐47.45, 49.95] |
| 11.1 Vitamin C and vitamin E versus placebo | 2 | 2561 | Mean Difference (IV, Fixed, 95% CI) | 1.25 [‐47.45, 49.95] |
| 12 Congenital malformations Show forest plot | 2 | 2254 | Risk Ratio (M‐H, Fixed, 95% CI) | 1.44 [0.73, 2.84] |
| 12.1 Vitamin C and vitamin E versus placebo | 2 | 2254 | Risk Ratio (M‐H, Fixed, 95% CI) | 1.44 [0.73, 2.84] |
| 13 Apgar score less than seven at five minutes Show forest plot | 1 | 700 | Risk Ratio (M‐H, Fixed, 95% CI) | 0.66 [0.27, 1.60] |
| 13.1 Vitamin C and vitamin E versus placebo | 1 | 700 | Risk Ratio (M‐H, Fixed, 95% CI) | 0.66 [0.27, 1.60] |
| 14 Any adverse effects of vitamin supplementation sufficient to stop supplementation Show forest plot | 1 | 739 | Risk Ratio (M‐H, Fixed, 95% CI) | 1.16 [0.39, 3.41] |
| 14.1 Vitamin C and vitamin E versus placebo | 1 | 739 | Risk Ratio (M‐H, Fixed, 95% CI) | 1.16 [0.39, 3.41] |
| 15 Gynaecological hospital admission Show forest plot | 1 | 1365 | Risk Ratio (M‐H, Fixed, 95% CI) | 0.20 [0.02, 1.69] |
| 15.1 Vitamin C and vitamin E versus placebo: Any maternal admission to ICU | 1 | 1365 | Risk Ratio (M‐H, Fixed, 95% CI) | 0.20 [0.02, 1.69] |
| 16 Admission to neonatal intensive care unit Show forest plot | 2 | Risk Ratio (M‐H, Fixed, 95% CI) | Subtotals only | |
| 16.1 Vitamin C and vitamin E versus placebo: Any admission to NICU | 1 | 1515 | Risk Ratio (M‐H, Fixed, 95% CI) | 0.81 [0.59, 1.11] |
| 16.2 Vitamin C and vitamin E versus placebo: > 4 days of NICU care | 1 | 1853 | Risk Ratio (M‐H, Fixed, 95% CI) | 0.60 [0.27, 1.37] |
| 16.3 Vitamin C and vitamin E versus placebo: > 7 days of NICU care | 1 | 1515 | Risk Ratio (M‐H, Fixed, 95% CI) | 0.87 [0.54, 1.39] |
| 17 Side effects Show forest plot | 1 | 1734 | Risk Ratio (M‐H, Fixed, 95% CI) | 1.63 [1.12, 2.36] |
| 17.1 Vitamin C and vitamin E versus placebo: Abdominal pain | 1 | 1734 | Risk Ratio (M‐H, Fixed, 95% CI) | 1.63 [1.12, 2.36] |
| Outcome or subgroup title | No. of studies | No. of participants | Statistical method | Effect size |
| 1 Total fetal loss (including miscarriages or combined miscarriages and stillbirths) Show forest plot | 5 | Relative risk (Fixed, 95% CI) | Subtotals only | |
| 1.1 Vitamin A versus placebo | 1 | 11723 | Relative risk (Fixed, 95% CI) | 1.04 [0.92, 1.17] |
| 1.2 B‐carotene versus placebo | 1 | 11303 | Relative risk (Fixed, 95% CI) | 1.03 [0.91, 1.16] |
| 1.3 Vitamin A versus B‐carotene | 1 | 11720 | Relative risk (Fixed, 95% CI) | 1.01 [0.90, 1.14] |
| 1.4 Vitamin A or B‐carotene versus placebo | 1 | 17373 | Relative risk (Fixed, 95% CI) | 1.05 [0.91, 1.21] |
| 1.5 Vitamin A (with/without multivitamins) versus multivitamins or placebo | 1 | 1074 | Relative risk (Fixed, 95% CI) | 0.80 [0.53, 1.21] |
| 1.6 Vitamin A + iron + folate versus iron + folate | 3 | 1640 | Relative risk (Fixed, 95% CI) | 1.01 [0.61, 1.66] |
| 2 Early or late miscarriage Show forest plot | 3 | Risk Ratio (M‐H, Fixed, 95% CI) | Subtotals only | |
| 2.1 Vitamin A (with/without multivitamins) versus multivitamins or placebo | 1 | 1075 | Risk Ratio (M‐H, Fixed, 95% CI) | 0.76 [0.37, 1.55] |
| 2.2 Vitamin A + iron + folate versus iron + folate | 2 | 1397 | Risk Ratio (M‐H, Fixed, 95% CI) | 0.87 [0.47, 1.63] |
| 3 Stillbirth Show forest plot | 4 | Risk Ratio (M‐H, Fixed, 95% CI) | Subtotals only | |
| 3.1 Vitamin A (with/without multivitamins) versus multivitamins or placebo | 1 | 1075 | Risk Ratio (M‐H, Fixed, 95% CI) | 1.04 [0.60, 1.79] |
| 3.2 Vitamin A + iron + folate versus iron + folate | 3 | 1640 | Risk Ratio (M‐H, Fixed, 95% CI) | 1.29 [0.57, 2.91] |
| 4 Neonatal death Show forest plot | 1 | Relative risk (Fixed, 95% CI) | Subtotals only | |
| 4.1 Vitamin A versus placebo | 1 | 10214 | Relative risk (Fixed, 95% CI) | 1.09 [0.92, 1.30] |
| 4.2 B‐carotene versus placebo | 1 | 9788 | Relative risk (Fixed, 95% CI) | 1.09 [0.91, 1.30] |
| 4.3 Vitamin A versus B‐carotene | 1 | 10228 | Relative risk (Fixed, 95% CI) | 1.0 [0.85, 1.18] |
| 4.4 Vitamin A or B‐carotene versus placebo | 1 | 15115 | Relative risk (Fixed, 95% CI) | 1.09 [0.91, 1.30] |
| 5 Preterm birth Show forest plot | 3 | Relative risk (Fixed, 95% CI) | Subtotals only | |
| 5.1 Vitamin A versus placebo | 1 | 11723 | Relative risk (Fixed, 95% CI) | 1.04 [0.89, 1.21] |
| 5.2 B‐carotene versus placebo | 1 | 11303 | Relative risk (Fixed, 95% CI) | 1.01 [0.86, 1.18] |
| 5.3 Vitamin A versus B‐carotene | 1 | 11720 | Relative risk (Fixed, 95% CI) | 1.03 [0.88, 1.20] |
| 5.4 Vitamin A or B‐carotene versus placebo | 1 | 17373 | Relative risk (Fixed, 95% CI) | 1.02 [0.89, 1.17] |
| 5.5 Vitamin A (with/without multivitamins) versus multivitamins or placebo | 1 | 1075 | Relative risk (Fixed, 95% CI) | 1.07 [0.84, 1.37] |
| 5.6 Vitamin A + iron + folate versus iron + folate | 1 | 700 | Relative risk (Fixed, 95% CI) | 1.11 [0.59, 2.09] |
| 6 Birthweight Show forest plot | 1 | 594 | Mean Difference (IV, Fixed, 95% CI) | 90.0 [2.68, 177.32] |
| 6.1 Vitamin A + iron + folate versus iron + folate | 1 | 594 | Mean Difference (IV, Fixed, 95% CI) | 90.0 [2.68, 177.32] |
| 7 Small‐for‐gestational age Show forest plot | 1 | 1075 | Risk Ratio (M‐H, Fixed, 95% CI) | 0.84 [0.58, 1.21] |
| 7.1 Vitamin A (with/without multivitamins) versus multivitamins or placebo | 1 | 1075 | Risk Ratio (M‐H, Fixed, 95% CI) | 0.84 [0.58, 1.21] |
| 8 Multiple pregnancy Show forest plot | 1 | Relative risk (Fixed, 95% CI) | Subtotals only | |
| 8.1 Vitamin A versus placebo | 1 | 10697 | Relative risk (Fixed, 95% CI) | 1.35 [0.99, 1.85] |
| 8.2 B‐carotene versus placebo | 1 | 10294 | Relative risk (Fixed, 95% CI) | 1.37 [1.00, 1.88] |
| 8.3 Vitamin A versus B‐carotene | 1 | 10699 | Relative risk (Fixed, 95% CI) | 1.03 [0.77, 1.37] |
| 8.4 Vitamin A or B‐carotene versus placebo | 1 | 15845 | Relative risk (Fixed, 95% CI) | 1.39 [1.05, 1.84] |
| 9 Very preterm birth Show forest plot | 1 | 1075 | Risk Ratio (M‐H, Fixed, 95% CI) | 1.11 [0.71, 1.74] |
| 9.1 Vitamin A (with/without multivitamins) versus multivitamins or placebo | 1 | 1075 | Risk Ratio (M‐H, Fixed, 95% CI) | 1.11 [0.71, 1.74] |
| 10 Maternal anaemia Show forest plot | 2 | Risk Ratio (M‐H, Fixed, 95% CI) | Subtotals only | |
| 10.1 Vitamin A + beta‐carotene with or without multivitamin versus placebo | 1 | 807 | Risk Ratio (M‐H, Fixed, 95% CI) | 0.86 [0.60, 1.24] |
| 10.2 Vitamin A + beta‐carotene versus placebo | 1 | 539 | Risk Ratio (M‐H, Fixed, 95% CI) | 0.91 [0.60, 1.38] |
| 10.3 Vitamin A + iron and folic acid versus iron and folic acid | 1 | 700 | Risk Ratio (M‐H, Fixed, 95% CI) | 0.96 [0.82, 1.12] |
| 11 Infant anaemia Show forest plot | 2 | Risk Ratio (M‐H, Fixed, 95% CI) | Subtotals only | |
| 11.1 Infant anaemia at 6 weeks' of age ‐ vitamin A + iron + folate versus iron + folate | 1 | 562 | Risk Ratio (M‐H, Fixed, 95% CI) | 0.58 [0.45, 0.75] |
| 11.2 Infant anaemia at 12 months ‐ vitamin A + iron + folate versus iron + folate | 1 | 478 | Risk Ratio (M‐H, Fixed, 95% CI) | 1.03 [0.88, 1.20] |
| 11.3 Infant anaemia ‐ vitamin A + beta‐carotene with or without multivitamins versus placebo | 1 | 625 | Risk Ratio (M‐H, Fixed, 95% CI) | 0.99 [0.92, 1.06] |
| 11.4 Infant anaemia ‐ vitamin A + beta‐carotene versus placebo | 1 | 406 | Risk Ratio (M‐H, Fixed, 95% CI) | 0.99 [0.92, 1.08] |
| 12 Poor growth at childhood follow up Show forest plot | 2 | Mean Difference (IV, Fixed, 95% CI) | Subtotals only | |
| 12.1 Weight (g) at 6 weeks: vitamin A + iron + folate versus iron + folate | 1 | 546 | Mean Difference (IV, Fixed, 95% CI) | 169.0 [16.55, 321.45] |
| 12.2 Length (cm) at 6 weeks: vitamin A + iron + folate versus iron + folate | 1 | 546 | Mean Difference (IV, Fixed, 95% CI) | 0.70 [0.15, 1.25] |
| 12.3 Weight (g) at 4 months: vitamin A + iron + folate versus iron + folate | 1 | 148 | Mean Difference (IV, Fixed, 95% CI) | ‐100.0 [‐377.14, 177.14] |
| 12.4 Length (cm) at 4 months: vitamin A + iron + folate versus iron + folate | 1 | 148 | Mean Difference (IV, Fixed, 95% CI) | ‐0.5 [‐1.33, 0.33] |
| Outcome or subgroup title | No. of studies | No. of participants | Statistical method | Effect size |
| 1 Total fetal loss (including miscarriages or combined miscarriages and stillbirths) Show forest plot | 12 | Risk Ratio (M‐H, Random, 95% CI) | Subtotals only | |
| 1.1 Multivitamin + folic acid versus no multivitamin/folic acid | 3 | 6883 | Risk Ratio (M‐H, Random, 95% CI) | 1.00 [0.75, 1.34] |
| 1.2 Multivitamin without folic acid versus no multivitamin/folic acid | 1 | 907 | Risk Ratio (M‐H, Random, 95% CI) | 0.83 [0.56, 1.25] |
| 1.3 Multivitamins with/without folic acid versus no multivitamins/folic acid | 1 | 1368 | Risk Ratio (M‐H, Random, 95% CI) | 0.91 [0.65, 1.27] |
| 1.4 Multivitamin + folic acid versus folic acid | 2 | 1096 | Risk Ratio (M‐H, Random, 95% CI) | 1.03 [0.72, 1.48] |
| 1.5 Multivitamin without folic acid versus folic acid | 2 | 1090 | Risk Ratio (M‐H, Random, 95% CI) | 0.90 [0.62, 1.30] |
| 1.6 Multivitamin with/without folic acid versus folic acid | 2 | 1644 | Risk Ratio (M‐H, Random, 95% CI) | 0.95 [0.69, 1.30] |
| 1.7 Multivitamin with/without vitamin A versus vitamin A or placebo | 1 | 1074 | Risk Ratio (M‐H, Random, 95% CI) | 0.60 [0.39, 0.91] |
| 1.8 Multivitamins versus control | 1 | 5021 | Risk Ratio (M‐H, Random, 95% CI) | 0.83 [0.58, 1.17] |
| 1.9 Multivitamin + vitamin E versus multivitamin without vitamin E or controls | 1 | 823 | Risk Ratio (M‐H, Random, 95% CI) | 0.92 [0.46, 1.83] |
| 1.10 Multivitamins + iron + folic acid versus iron + folic acid | 5 | 42404 | Risk Ratio (M‐H, Random, 95% CI) | 0.90 [0.75, 1.09] |
| 2 Early or late miscarriage Show forest plot | 10 | Risk Ratio (M‐H, Random, 95% CI) | Subtotals only | |
| 2.1 Multivitamin + folic acid versus no multivitamin/folic acid | 3 | 6883 | Risk Ratio (M‐H, Random, 95% CI) | 0.99 [0.72, 1.38] |
| 2.2 Multivitamin without folic acid versus no multivitamin/folic acid | 1 | 907 | Risk Ratio (M‐H, Random, 95% CI) | 0.89 [0.59, 1.34] |
| 2.3 Multivitamin with/without folic acid versus no multivitamin/folic acid | 1 | 1368 | Risk Ratio (M‐H, Random, 95% CI) | 0.95 [0.67, 1.34] |
| 2.4 Multivitamin + folic acid versus folic acid | 2 | 1096 | Risk Ratio (M‐H, Random, 95% CI) | 1.04 [0.72, 1.49] |
| 2.5 Multivitamin without folic acid versus folic acid | 2 | 1090 | Risk Ratio (M‐H, Random, 95% CI) | 0.89 [0.61, 1.31] |
| 2.6 Multivitamin with/without folic acid versus folic acid | 2 | 1644 | Risk Ratio (M‐H, Random, 95% CI) | 0.96 [0.70, 1.33] |
| 2.7 Multivitamin + vitamin E versus multivitamin without vitamin E or controls | 1 | 823 | Risk Ratio (M‐H, Random, 95% CI) | 1.04 [0.26, 4.13] |
| 2.8 Multivitamin + iron + folic acid versus iron + folic acid | 5 | 42404 | Risk Ratio (M‐H, Random, 95% CI) | 0.90 [0.73, 1.11] |
| 3 Placental abruption Show forest plot | 1 | Risk Ratio (M‐H, Fixed, 95% CI) | Subtotals only | |
| 3.1 Multivitamins + iron + folic acid versus iron + folic acid | 1 | 60 | Risk Ratio (M‐H, Fixed, 95% CI) | 0.0 [0.0, 0.0] |
| 4 Pre‐eclampsia Show forest plot | 2 | Risk Ratio (M‐H, Fixed, 95% CI) | Subtotals only | |
| 4.1 Multivitamin versus control | 1 | 5021 | Risk Ratio (M‐H, Fixed, 95% CI) | 0.70 [0.55, 0.90] |
| 4.2 Multivitamin + iron + folic acid versus iron + folic acid | 1 | 60 | Risk Ratio (M‐H, Fixed, 95% CI) | 0.24 [0.06, 1.01] |
| 5 Stillbirth Show forest plot | 11 | Risk Ratio (M‐H, Random, 95% CI) | Subtotals only | |
| 5.1 Multivitamin + folic acid versus no multivitamin/folic acid | 3 | 6883 | Risk Ratio (M‐H, Random, 95% CI) | 1.04 [0.51, 2.10] |
| 5.2 Multivitamin without folic acid versus no multivitamin/folic acid | 1 | 907 | Risk Ratio (M‐H, Random, 95% CI) | 0.14 [0.01, 2.76] |
| 5.3 Multivitamin with/without folic acid versus no multivitamin/folic acid | 1 | 1368 | Risk Ratio (M‐H, Random, 95% CI) | 0.33 [0.06, 1.97] |
| 5.4 Multivitamin + folic acid versus folic acid | 2 | 1096 | Risk Ratio (M‐H, Random, 95% CI) | 0.97 [0.14, 6.88] |
| 5.5 Multivitamin without folic acid versus folic acid | 2 | 1090 | Risk Ratio (M‐H, Random, 95% CI) | 0.99 [0.04, 22.88] |
| 5.6 Multivitamin with/without folic acid versus folic acid | 2 | 1644 | Risk Ratio (M‐H, Random, 95% CI) | 0.79 [0.15, 4.10] |
| 5.7 Multivitamin versus control | 1 | 5021 | Risk Ratio (M‐H, Random, 95% CI) | 0.83 [0.58, 1.17] |
| 5.8 Multivitamin + vitamin E versus multivitamin without vitamin E or controls | 1 | 823 | Risk Ratio (M‐H, Random, 95% CI) | 0.88 [0.39, 1.98] |
| 5.9 Multivitamin + iron + folic acid versus iron + folic acid | 5 | 42404 | Risk Ratio (M‐H, Random, 95% CI) | 0.90 [0.75, 1.07] |
| 6 Perinatal death Show forest plot | 5 | Relative risk (Random, 95% CI) | Subtotals only | |
| 6.1 Multivitamin + folic acid + iron + zinc + vitamin A versus folic acid + iron + zinc + vitamin A | 1 | 4308 | Relative risk (Random, 95% CI) | 1.11 [0.98, 1.26] |
| 6.2 Multivitamin + iron + folic acid versus iron + folic acid | 4 | 42344 | Relative risk (Random, 95% CI) | 0.99 [0.80, 1.21] |
| 7 Neonatal death Show forest plot | 8 | Relative risk (Fixed, 95% CI) | Subtotals only | |
| 7.1 Multivitamin + folic acid versus no multivitamin/folic acid | 1 | 4930 | Relative risk (Fixed, 95% CI) | 1.59 [0.30, 8.30] |
| 7.2 Multivitamin + vitamin E versus multivitamin without vitamin E or controls | 1 | 787 | Relative risk (Fixed, 95% CI) | 1.44 [0.91, 2.27] |
| 7.3 Multivitamin versus control | 1 | 4895 | Relative risk (Fixed, 95% CI) | 1.0 [0.75, 1.34] |
| 7.4 Multivitamin + folic acid + iron + zinc + vitamin A versus folic acid + iron + zinc + vitamin A | 1 | 4122 | Relative risk (Fixed, 95% CI) | 1.15 [0.97, 1.36] |
| 7.5 Multivitamin + iron + folic acid versus iron + folic acid | 4 | 40706 | Relative risk (Fixed, 95% CI) | 0.91 [0.80, 1.03] |
| 8 Preterm birth Show forest plot | 8 | Relative risk (Fixed, 95% CI) | Subtotals only | |
| 8.1 Multivitamin + folic acid versus no multivitamin/folic acid | 1 | 5502 | Relative risk (Fixed, 95% CI) | 1.01 [0.91, 1.12] |
| 8.2 Multivitamin + folic acid + iron + zinc + vitamin A versus folic acid + iron + zinc + vitamin A | 1 | 3320 | Relative risk (Fixed, 95% CI) | 0.98 [0.90, 1.07] |
| 8.3 Multivitamin + vitamin E versus multivitamin without vitamin E or controls | 1 | 814 | Relative risk (Fixed, 95% CI) | 0.99 [0.85, 1.15] |
| 8.4 Multivitamin + iron + folic acid versus iron + folic acid | 5 | 39540 | Relative risk (Fixed, 95% CI) | 1.00 [0.96, 1.04] |
| 9 Very preterm birth Show forest plot | 1 | 8428 | Risk Ratio (M‐H, Fixed, 95% CI) | 0.88 [0.73, 1.06] |
| 9.1 Multivitamin + iron + folic acid versus iron + folic acid | 1 | 8428 | Risk Ratio (M‐H, Fixed, 95% CI) | 0.88 [0.73, 1.06] |
| 10 Birthweight Show forest plot | 4 | Mean Difference (IV, Fixed, 95% CI) | Subtotals only | |
| 10.1 Multivitamin + folic acid versus no multivitamin/folic acid | 1 | 4862 | Mean Difference (IV, Fixed, 95% CI) | 3.0 [‐24.15, 30.15] |
| 10.2 Multivitamin + iron + folic acid versus iron + folic acid | 3 | 10241 | Mean Difference (IV, Fixed, 95% CI) | 61.61 [37.32, 85.91] |
| 11 Small‐for‐gestational age (birthweight less than the 10th percentile or < 2500 g Show forest plot | 8 | Relative risk (Random, 95% CI) | Subtotals only | |
| 11.1 Multivitamin + folic acid versus no multivitamin/folic acid | 1 | 4862 | Relative risk (Random, 95% CI) | 1.09 [0.94, 1.26] |
| 11.2 Multivitamin + folic acid versus no multivitamin/folic acid (birthweight < 2500 g) | 1 | 186 | Relative risk (Random, 95% CI) | 0.91 [0.63, 1.32] |
| 11.3 Multivitamin + folic acid + iron + zinc + vitamin A versus folic acid + iron + zinc + vitamin A | 1 | 3320 | Relative risk (Random, 95% CI) | 0.98 [0.95, 1.02] |
| 11.4 Multivitamin + folic acid + iron + zinc + vitamin A versus folic acid + iron + zinc + vitamin A (birthweight < 2500 g) | 1 | 3325 | Relative risk (Random, 95% CI) | 0.95 [0.90, 1.00] |
| 11.5 Multivitamins + iron + folic acid versus iron + folic acid | 5 | 21434 | Relative risk (Random, 95% CI) | 0.93 [0.77, 1.12] |
| 12 Congenital malformations Show forest plot | 4 | Risk Ratio (M‐H, Fixed, 95% CI) | Subtotals only | |
| 12.1 Multivitamin + folic acid versus no multivitamin/folic acid | 2 | 5777 | Risk Ratio (M‐H, Fixed, 95% CI) | 1.69 [0.81, 3.53] |
| 12.2 Multivitamin without folic acid without versus no multivitamin/folic acid | 1 | 907 | Risk Ratio (M‐H, Fixed, 95% CI) | 1.60 [0.53, 4.86] |
| 12.3 Multivitamin with/without folic acid versus no multivitamin/folic acid | 1 | 1368 | Risk Ratio (M‐H, Fixed, 95% CI) | 1.99 [0.75, 5.26] |
| 12.4 Multivitamin + folic acid versus folic acid | 2 | 1096 | Risk Ratio (M‐H, Fixed, 95% CI) | 1.71 [0.72, 4.04] |
| 12.5 Multivitamin without folic acid versus folic acid | 2 | 1090 | Risk Ratio (M‐H, Fixed, 95% CI) | 1.61 [0.67, 3.85] |
| 12.6 Multivitamin with/without folic acid versus folic acid | 2 | 1644 | Risk Ratio (M‐H, Fixed, 95% CI) | 1.66 [0.76, 3.63] |
| 12.7 Multivitamin + iron + folic acid versus iron + folic acid | 1 | 1200 | Risk Ratio (M‐H, Fixed, 95% CI) | 1.0 [0.14, 7.08] |
| 13 Multiple pregnancy Show forest plot | 2 | 5141 | Risk Ratio (M‐H, Fixed, 95% CI) | 1.36 [1.00, 1.85] |
| 13.1 Multivitamin + folic acid versus no multivitamin/folic acid | 2 | 5141 | Risk Ratio (M‐H, Fixed, 95% CI) | 1.36 [1.00, 1.85] |
| 14 Maternal anaemia Show forest plot | 4 | Relative risk (Fixed, 95% CI) | Subtotals only | |
| 14.1 Multivitamin + folic acid + iron + zinc + vitamin A versus folic acid + iron + zinc + vitamin A (any anaemia) | 1 | 813 | Relative risk (Fixed, 95% CI) | 0.92 [0.83, 1.03] |
| 14.2 Multivitamin + folic acid + iron + zinc+vitamin A versus folic acid + iron + zinc + vitamin A (severe anaemia) | 1 | 813 | Relative risk (Fixed, 95% CI) | 0.82 [0.53, 1.27] |
| 14.3 Multivitamins versus placebo | 1 | 538 | Relative risk (Fixed, 95% CI) | 0.78 [0.50, 1.22] |
| 14.4 Multivitamins + vitamin A + beta‐carotene versus placebo | 1 | 535 | Relative risk (Fixed, 95% CI) | 0.82 [0.53, 1.26] |
| 14.5 Multivitamins + iron + folic acid versus iron + folic acid | 2 | 2278 | Relative risk (Fixed, 95% CI) | 0.88 [0.81, 0.96] |
| 15 Breastfeeding Show forest plot | 1 | 4878 | Risk Ratio (M‐H, Fixed, 95% CI) | 0.98 [0.96, 1.01] |
| 15.1 Multivitamin versus control | 1 | 4878 | Risk Ratio (M‐H, Fixed, 95% CI) | 0.98 [0.96, 1.01] |
| 16 Poor growth at childhood follow up: Underweight in childhood (6‐8 years of age) Show forest plot | 1 | 3356 | Risk Ratio (Fixed, 95% CI) | 1.05 [0.97, 1.13] |
| 16.1 Multivitamin + folic acid + iron + zinc + vitamin A versus folic acid + iron + zinc + vitamin A | 1 | 3356 | Risk Ratio (Fixed, 95% CI) | 1.05 [0.97, 1.13] |
| 17 Poor growth at childhood follow up: Stunting in childhood (6‐8 years of age) Show forest plot | 1 | 3356 | Risk Ratio (Fixed, 95% CI) | 1.09 [1.00, 1.19] |
| 17.1 Multivitamin + folic acid + iron + zinc + vitamin A versus folic acid + iron + zinc + vitamin A | 1 | 3356 | Risk Ratio (Fixed, 95% CI) | 1.09 [1.00, 1.19] |
| 18 Additional outcomes ‐ infant death Show forest plot | 1 | 4122 | Relative risk (Fixed, 95% CI) | 1.10 [0.94, 1.29] |
| 18.1 Multivitamin + folic acid + iron + zinc + vitamin A versus folic acid + iron + zinc + vitamin A | 1 | 4122 | Relative risk (Fixed, 95% CI) | 1.10 [0.94, 1.29] |
| Outcome or subgroup title | No. of studies | No. of participants | Statistical method | Effect size |
| 1 Total fetal loss (including miscarriages or combined miscarriages and stillbirths) Show forest plot | 6 | Risk Ratio (M‐H, Fixed, 95% CI) | Subtotals only | |
| 1.1 Folic acid + multivitamin versus no folic acid/multivitamin | 3 | 6883 | Risk Ratio (M‐H, Fixed, 95% CI) | 1.09 [0.95, 1.25] |
| 1.2 Folic acid without multivitamin versus no folic acid/multivitamin | 1 | 903 | Risk Ratio (M‐H, Fixed, 95% CI) | 0.95 [0.64, 1.40] |
| 1.3 Folic acid with/without multivitamin versus no folic acid/multivitamin | 1 | 1364 | Risk Ratio (M‐H, Fixed, 95% CI) | 0.97 [0.69, 1.35] |
| 1.4 Folic acid + multivitamin versus multivitamin | 2 | 1102 | Risk Ratio (M‐H, Fixed, 95% CI) | 1.15 [0.80, 1.67] |
| 1.5 Folic acid without multivitamin versus multivitamin | 2 | 1090 | Risk Ratio (M‐H, Fixed, 95% CI) | 1.12 [0.77, 1.62] |
| 1.6 Folic acid with or without multivitamin versus multivitamin | 2 | 1644 | Risk Ratio (M‐H, Fixed, 95% CI) | 1.14 [0.82, 1.57] |
| 1.7 Folic acid + iron versus iron | 1 | 75 | Risk Ratio (M‐H, Fixed, 95% CI) | 0.23 [0.01, 4.59] |
| 1.8 Folic acid + iron + antimalarials versus iron + antimalarials | 1 | 160 | Risk Ratio (M‐H, Fixed, 95% CI) | 13.0 [0.74, 226.98] |
| 2 Early or late miscarriage Show forest plot | 6 | Risk Ratio (M‐H, Random, 95% CI) | Subtotals only | |
| 2.1 Folic acid + multivitamin versus no folic acid/multivitamin | 3 | 6883 | Risk Ratio (M‐H, Random, 95% CI) | 0.99 [0.72, 1.38] |
| 2.2 Folic acid without multivitamins versus no folic acid/multivitamin | 1 | 903 | Risk Ratio (M‐H, Random, 95% CI) | 0.97 [0.65, 1.44] |
| 2.3 Folic acid with/without multivitamin versus no folic acid/multivitamin | 1 | 1364 | Risk Ratio (M‐H, Random, 95% CI) | 0.99 [0.70, 1.39] |
| 2.4 Folic acid + multivitamin versus multivitamin | 2 | 1102 | Risk Ratio (M‐H, Random, 95% CI) | 1.16 [0.80, 1.69] |
| 2.5 Folic acid without multivitamin versus multivitamin | 2 | 1090 | Risk Ratio (M‐H, Random, 95% CI) | 1.12 [0.77, 1.64] |
| 2.6 Folic acid with/without multivitamin versus multivitamin | 2 | 1642 | Risk Ratio (M‐H, Random, 95% CI) | 1.09 [0.79, 1.51] |
| 2.7 Folic acid + iron versus iron | 1 | 75 | Risk Ratio (M‐H, Random, 95% CI) | 0.38 [0.02, 9.03] |
| 2.8 Folic acid + iron + antimalarials versus iron + antimalarials | 1 | 160 | Risk Ratio (M‐H, Random, 95% CI) | 13.0 [0.74, 226.98] |
| 3 Pre‐eclampsia Show forest plot | 1 | 75 | Risk Ratio (M‐H, Fixed, 95% CI) | 1.14 [0.17, 7.69] |
| 3.1 Folic acid + iron versus iron | 1 | 75 | Risk Ratio (M‐H, Fixed, 95% CI) | 1.14 [0.17, 7.69] |
| 4 Stillbirth Show forest plot | 5 | Risk Ratio (M‐H, Fixed, 95% CI) | Subtotals only | |
| 4.1 Folic acid + multivitamin versus no folic acid/multivitamin | 3 | 6883 | Risk Ratio (M‐H, Fixed, 95% CI) | 1.03 [0.51, 2.09] |
| 4.2 Folic acid without multivitamin versus no folic acid/multivitamin | 1 | 903 | Risk Ratio (M‐H, Fixed, 95% CI) | 0.67 [0.11, 4.02] |
| 4.3 Folic acid with/without multivitamin versus no folic acid/multivitamin | 1 | 1364 | Risk Ratio (M‐H, Fixed, 95% CI) | 0.67 [0.15, 2.96] |
| 4.4 Folic acid + multivitamin versus multivitamin | 2 | 1102 | Risk Ratio (M‐H, Fixed, 95% CI) | 1.00 [0.20, 4.99] |
| 4.5 Folic acid without multivitamin versus multivitamin | 2 | 1090 | Risk Ratio (M‐H, Fixed, 95% CI) | 4.97 [0.58, 42.29] |
| 4.6 Folic acid with/without multivitamin versus multivitamin | 2 | 1644 | Risk Ratio (M‐H, Fixed, 95% CI) | 0.84 [0.20, 3.53] |
| 4.7 Folic acid + iron versus iron | 1 | 75 | Risk Ratio (M‐H, Fixed, 95% CI) | 0.38 [0.02, 9.03] |
| 5 Perinatal death Show forest plot | 1 | 4308 | Relative risk (Fixed, 95% CI) | 0.97 [0.85, 1.11] |
| 5.1 Folic acid + iron + zinc + multivitamin + vitamin A versus vitamin A | 1 | 4308 | Relative risk (Fixed, 95% CI) | 0.97 [0.85, 1.11] |
| 6 Neonatal death Show forest plot | 2 | Relative risk (Fixed, 95% CI) | Subtotals only | |
| 6.1 Folic acid + multivitamin versus no folic acid/multivitamin | 1 | 4930 | Relative risk (Fixed, 95% CI) | 1.59 [0.30, 8.28] |
| 6.2 Folic acid + iron + zinc + multivitamin + vitamin A versus vitamin A | 1 | 4122 | Relative risk (Fixed, 95% CI) | 0.96 [0.80, 1.14] |
| 7 Preterm birth Show forest plot | 3 | Relative risk (Fixed, 95% CI) | Subtotals only | |
| 7.1 Folic acid + multivitamin versus no folic acid/multivitamin | 1 | 5502 | Relative risk (Fixed, 95% CI) | 1.01 [0.91, 1.12] |
| 7.2 Folic acid + multivitamin versus no folic acid/multivitamin | 1 | 75 | Relative risk (Fixed, 95% CI) | 1.01 [0.65, 1.56] |
| 7.3 Folic acid + iron + zinc + multivitamin + vitamin A versus vitamin A | 1 | 3320 | Relative risk (Fixed, 95% CI) | 1.02 [0.94, 1.11] |
| 8 Birthweight Show forest plot | 3 | Mean Difference (IV, Fixed, 95% CI) | Subtotals only | |
| 8.1 Folic acid + multivitamin versus no folic acid/multivitamin | 1 | 4862 | Mean Difference (IV, Fixed, 95% CI) | 3.0 [‐24.15, 30.15] |
| 8.2 Folic acid versus placebo | 1 | 29 | Mean Difference (IV, Fixed, 95% CI) | 312.0 [108.52, 515.48] |
| 8.3 Folic + iron versus control | 1 | 45 | Mean Difference (IV, Fixed, 95% CI) | ‐32.0 [‐213.62, 149.62] |
| 9 Small‐for‐gestational age Show forest plot | 4 | Relative risk (Fixed, 95% CI) | Subtotals only | |
| 9.1 Folic acid + multivitamin versus no folic acid/multivitamin | 1 | 4862 | Relative risk (Fixed, 95% CI) | 1.09 [0.94, 1.26] |
| 9.2 Folic acid + iron + zinc + multivitamin + vitamin A versus vitamin A | 1 | 3320 | Relative risk (Fixed, 95% CI) | 0.97 [0.92, 1.03] |
| 9.3 Folic acid + iron versus iron (birthweight < 2500 g) | 1 | 75 | Relative risk (Fixed, 95% CI) | 1.06 [0.48, 2.33] |
| 9.4 Folic acid + multivitamin versus no folic acid/multivitamin (birthweight < 2500 g) | 1 | 186 | Relative risk (Fixed, 95% CI) | 0.91 [0.63, 1.32] |
| 9.5 Folic acid + iron + zinc + multivitamin + vitamin A versus vitamin A (birthweight < 2500 g) | 1 | 3325 | Relative risk (Fixed, 95% CI) | 0.94 [0.90, 0.99] |
| 10 Congenital malformations Show forest plot | 3 | Risk Ratio (M‐H, Fixed, 95% CI) | Subtotals only | |
| 10.1 Folic acid + multivitamin versus no folic acid/multivitamin | 2 | 5777 | Risk Ratio (M‐H, Fixed, 95% CI) | 1.69 [0.81, 3.53] |
| 10.2 Folic acid without multivitamin versus no folic acid/multivitamin | 1 | 903 | Risk Ratio (M‐H, Fixed, 95% CI) | 1.42 [0.45, 4.43] |
| 10.3 Folic acid with/without multivitamin versus no folic acid/multivitamin | 1 | 1364 | Risk Ratio (M‐H, Fixed, 95% CI) | 1.90 [0.71, 5.04] |
| 10.4 Folic acid + multivitamin versus multivitamin | 2 | 1102 | Risk Ratio (M‐H, Fixed, 95% CI) | 1.07 [0.51, 2.26] |
| 10.5 Folic acid without multivitamin versus multivitamin | 2 | 1090 | Risk Ratio (M‐H, Fixed, 95% CI) | 0.62 [0.26, 1.49] |
| 10.6 Folic acid with or without multvitamin versus multivitamin | 2 | 1644 | Risk Ratio (M‐H, Fixed, 95% CI) | 0.85 [0.43, 1.67] |
| 11 Multiple pregnancy Show forest plot | 2 | Risk Ratio (M‐H, Fixed, 95% CI) | Subtotals only | |
| 11.1 Folic acid + multivitamin versus no folic acid/multivitamin | 2 | 5141 | Risk Ratio (M‐H, Fixed, 95% CI) | 1.36 [1.00, 1.85] |
| 12 Maternal anaemia Show forest plot | 3 | Relative risk (Fixed, 95% CI) | Subtotals only | |
| 12.1 Folic acid + iron + zinc + multivitamin + vitamin A versus vitamin A (any anaemia) | 1 | 813 | Relative risk (Fixed, 95% CI) | 0.83 [0.77, 0.91] |
| 12.2 Folic acid + iron + zinc + multivitamin + vitamin A versus vitamin A (severe anaemia) | 1 | 813 | Relative risk (Fixed, 95% CI) | 0.82 [0.59, 1.16] |
| 12.3 Folic acid + iron versus iron (severe anaemia) | 1 | 85 | Relative risk (Fixed, 95% CI) | 1.06 [0.25, 4.42] |
| 12.4 Folic acid + iron versus no folic acid or iron | 1 | 89 | Relative risk (Fixed, 95% CI) | 1.53 [0.79, 2.95] |
| 13 Poor growth in childhood: Stunting in childhood (6‐8 years of age) Show forest plot | 1 | 3356 | Risk Ratio (Fixed, 95% CI) | 0.93 [0.86, 1.00] |
| 13.1 Folic acid + iron + zinc + vitamin A versus multivitamin + vitamin A | 1 | 3356 | Risk Ratio (Fixed, 95% CI) | 0.93 [0.86, 1.00] |
| 14 Poor growth in childhood: Underweight in childhood (6‐8 years of age) Show forest plot | 1 | 3356 | Risk Ratio (Fixed, 95% CI) | 0.97 [0.91, 1.04] |
| 14.1 Folic acid + iron + zinc + vitamin A versus multivitamin + vitamin A | 1 | 3356 | Risk Ratio (Fixed, 95% CI) | 0.97 [0.91, 1.04] |
| 15 Placental weight Show forest plot | 1 | 29 | Mean Difference (IV, Fixed, 95% CI) | 96.0 [30.73, 161.27] |
| 15.1 Folic acid versus placebo | 1 | 29 | Mean Difference (IV, Fixed, 95% CI) | 96.0 [30.73, 161.27] |
| 16 Additional outcomes ‐ infant death Show forest plot | 1 | 4122 | Relative risk (Fixed, 95% CI) | 0.95 [0.81, 1.11] |
| 16.1 Folic acid + iron + zinc + multivitamin + vitamin A versus vitamin A | 1 | 4122 | Relative risk (Fixed, 95% CI) | 0.95 [0.81, 1.11] |