Oral versus intravenous antibiotic treatment for febrile neutropenia in cancer patients
Information
- DOI:
- https://doi.org/10.1002/14651858.CD003992.pub3Copy DOI

- Database:
-
- Cochrane Database of Systematic Reviews
- Version published:
-
- 09 October 2013see what's new
- Type:
-
- Intervention
- Stage:
-
- Review
- Cochrane Editorial Group:
-
Cochrane Gynaecological, Neuro-oncology and Orphan Cancer Group
- Copyright:
-
- Copyright © 2016 The Cochrane Collaboration. Published by John Wiley & Sons, Ltd.
Article metrics
Altmetric:
Cited by:
Authors
Contributions of authors
Liat Vidal (contact review author) ‐ reference search, article retrieval, study inclusion and exclusion, data extraction, analysis, and writing.
Mical Paul ‐ data extraction, study inclusion and exclusion, analysis, and manuscript review.
Itsik Ben dor ‐ reference search, data extraction, study inclusion and exclusion.
Ellisheva Pokroy‐ reference search, article retrieval.
Karla Soares‐Weiser ‐ analysis, interpretation of results and manuscript review.
Leonard Leibovici (secondary contact) ‐ study inclusion and exclusion, analysis, and manuscript review.
Noa Eliakim‐Raz ‐ reference search, data extraction, study inclusion and exclusion.
Sources of support
Internal sources
-
None, Not specified.
External sources
-
None, Not specified.
Declarations of interest
None known
Acknowledgements
We warmly thank Clare Jess and Gail Quinn, Managing Editors of the Cochrane Gynaecological Cancer Group, for there helpful editorial advice and assistance in obtaining manuscripts.
We thank Jane Hayes, Information Manager of the Cochrane Gynaecological Cancer Group for her support and help in bringing the review up‐to‐date.
We would like to express our appreciation to all the authors who responded to our letters and supplied additional information on their studies: Drs Ammann (Brack 2012*), Freifeld, Hidalgo, Niho, Paesmans (Kern 1999), Paganini, Shenep, Velasco, Marshall (Innes 2003) who supplied the full unpublished manuscript and Dr Anaissie for providing unpublished data from Samonis 1997. We would like to thank Mr Ochan Kilama from Bayer Italia for clarifying the details of Minotti 1999 though not included in the analysis.
The National Institute for Health Research (NIHR) is the largest single funder of the Cochrane Gynaecological Cancer Group. The views and opinions expressed in this review are those of the authors and do not necessarily reflect those of the NIHR, NHS or the Department of Health.
Version history
| Published | Title | Stage | Authors | Version |
| 2013 Oct 09 | Oral versus intravenous antibiotic treatment for febrile neutropenia in cancer patients | Review | Liat Vidal, Itsik Ben dor, Mical Paul, Noa Eliakim‐Raz, Ellisheva Pokroy, Karla Soares‐Weiser, Leonard Leibovici | |
| 2004 Oct 18 | Oral versus intravenous antibiotic treatment for febrile neutropenia in cancer patients | Review | Liat Vidal, Itsik Ben dor, Mical Paul, Ellisheva Pokroy, Karla Soares‐Weiser, Leonard Leibovici | |
| 2003 Jan 20 | Oral versus intravenous antibiotic treatment for febrile neutropenia in cancer patients | Protocol | Liat Vidal, Mical Paul, Itsik Ben‐dor, Ellisheva Pokroy, Karla Soares‐Weiser, Leonard Leibovici | |
Notes
A version of this review was published in the Journal of Antimicrobial Chemotherapy 2004 Jul;54(1):29‐37.
Keywords
MeSH
Medical Subject Headings (MeSH) Keywords
Medical Subject Headings Check Words
Humans;
PICOs

Risk of bias graph: review authors' judgements about each risk of bias item presented as percentages across all included studies.

Risk of bias summary: review authors' judgements about each risk of bias item for each included study.
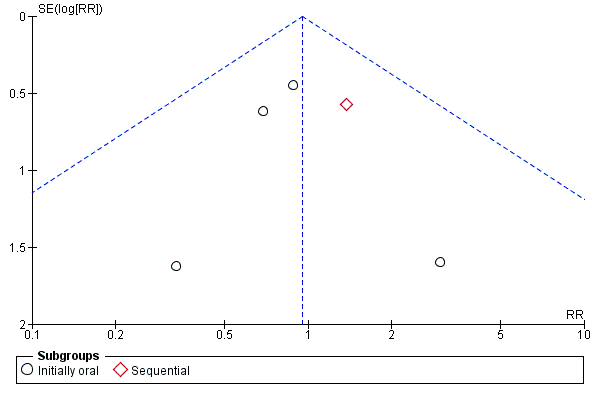
Funnel plot of comparison: 1 Oral versus intravenous antibiotic therapy, outcome: 1.1 Mortality.
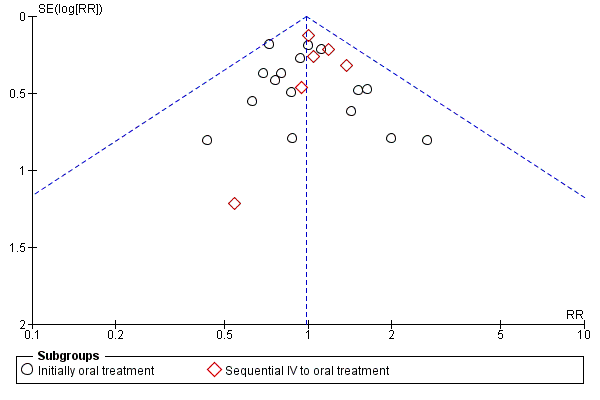
Funnel plot of comparison: 1 Oral versus intravenous antibiotic therapy, outcome: 1.3 Treatment failure ‐ per protocol analysis.

Comparison 1 Oral versus intravenous antibiotic therapy, Outcome 1 Mortality.

Comparison 1 Oral versus intravenous antibiotic therapy, Outcome 2 Treatment failure.

Comparison 1 Oral versus intravenous antibiotic therapy, Outcome 3 Treatment failure ‐ per protocol analysis.

Comparison 1 Oral versus intravenous antibiotic therapy, Outcome 4 Adverse events requiring discontinuation of antibiotics.

Comparison 1 Oral versus intravenous antibiotic therapy, Outcome 5 Gastrointestinal adverse events ('post‐protocol' analysis).

Comparison 1 Oral versus intravenous antibiotic therapy, Outcome 6 Lost to follow‐up.

Comparison 1 Oral versus intravenous antibiotic therapy, Outcome 7 Treatment failure not dt modification in update.

Comparison 2 Oral versus intravenous antibiotic therapy ‐ subgroup analysis, Outcome 1 Treatment failure ‐ age.

Comparison 2 Oral versus intravenous antibiotic therapy ‐ subgroup analysis, Outcome 2 Treatment failure ‐ source of infection.

Comparison 2 Oral versus intravenous antibiotic therapy ‐ subgroup analysis, Outcome 3 Treatment failure ‐ severity of neutropenia.

Comparison 2 Oral versus intravenous antibiotic therapy ‐ subgroup analysis, Outcome 4 Treatment failure ‐ type of malignancy.

Comparison 3 Methodological quality of studies, Outcome 1 Allocation concealment.

Comparison 4 Post hoc subgroup analyses, Outcome 1 Setting.

Comparison 4 Post hoc subgroup analyses, Outcome 2 Type of oral antibiotics.
| Oral compared to intravenous antibiotic therapy for febrile neutropenia in cancer patients | ||||||
| Patient or population: patients with febrile neutropenia in cancer patients | ||||||
| Outcomes | Illustrative comparative risks* (95% CI) | Relative effect | No of Participants | Quality of the evidence | Comments | |
| Assumed risk | Corresponding risk | |||||
| intravenous antibiotic therapy | Oral | |||||
| Mortality | Study population | RR 0.95 | 1392 | ⊕⊕⊕⊝ | ||
| 32 per 1000 | 30 per 1000 | |||||
| Low risk | ||||||
| 0 per 1000 | 0 per 1000 | |||||
| Treatment failure | Study population | RR 0.96 | 3142 | ⊕⊕⊕⊝ moderate1 | ||
| 284 per 1000 | 272 per 1000 | |||||
| Moderate | ||||||
| 211 per 1000 | 203 per 1000 | |||||
| Treatment failure ‐ per protocol analysis | Study population | RR 0.98 | 2912 | ⊕⊕⊕⊝ | ||
| 225 per 1000 | 221 per 1000 | |||||
| Moderate | ||||||
| 184 per 1000 | 180 per 1000 | |||||
| Adverse events requiring discontinuation of antibiotics | Study population | RR 1.45 | 1823 | ⊕⊕⊝⊝ low1, 2 | ||
| 21 per 1000 | 31 per 1000 | |||||
| Moderate | ||||||
| 0 per 1000 | 0 per 1000 | |||||
| Treatment failure not dt modification in update | Study population | RR 0.95 | 3041 | ⊕⊕⊕⊝ | ||
| 267 per 1000 | 254 per 1000 | |||||
| Moderate | ||||||
| 180 per 1000 | 171 per 1000 | |||||
| *The basis for the assumed risk (e.g. the median control group risk across studies) is provided in footnotes. The corresponding risk (and its 95% confidence interval) is based on the assumed risk in the comparison group and the relative effect of the intervention (and its 95% CI). | ||||||
| GRADE Working Group grades of evidence | ||||||
| 1 High risk of detection bias in most of the trials 2 A wide CI | ||||||
| Common criteria |
| Haemodynamic stablity |
| No organ failure |
| Ability to take oral medications |
| No pneumonia |
| No infection of a central line |
| No severe soft‐tissue infection |
| No acute leukaemia as the background malignancy |
| No known drug allergy |
| Not pregnant or lactating women |
| Study ID | Evident infection | Previous AB | Prolonged neutropeni | Performance status | Active malignancy | BMT/PSCT | Other |
| Kern 1999 | Infected catheter or CNS infection, known bacterial /viral/fungal infection | yes | yes | no | no | yes | Need of IV supportive therapy, expected to die within 48 hours, HIV, fever unrelated to infection and protocol violation |
| Mullen 1999 | A source of infection that required hospitalisation as: tunnelitis, pneumonia, perirectal cellulitis, typhlitis, resistant microorganism to one of the study's drugs | no | no | no | yes | yes | >10% dehydration, bleeding requiring platelet transfusion, |
| Paganini 2000 | Infected catheter, perineal/ facial cellulitis, uncontrolled local infection, positive blood cultures at 72 hours | no | no | no | yes | yes | Persistance of fever >48 hours, incorrectable bleeding; refractory hypoglycemia or hypocalcemia |
| Rubenstein 1993 | Known resistant microorganism | no | no | no | no | no | Na<128, uncontrolled hypercalcemia, more than 30 miles away |
| Samonis 1997 | Pneumonia, deep organ infection | yes | yes | no | yes | no* | Prior hospitalisation |
| Shenep 2001 | Pneumonia, clinical or radiographic evidence of focal bacterial infection, severe mucositis, positive blood cultures at 48 hours | no | no | no | no | no | MRSA or P.Aeroginosa in any culture obtained in preceding 12weeks |
| Velasco1995 | Meningitis, pyelonephritis | yes | no | yes | no | no* | Long term central vein catheter |
| Petrilli 1999 | no | no | no | no | no | no* | |
| Flaherty 1989 | no | yes | no | no | no | no | |
| Freifeld 1999 | Intravascular infection, tunnelitis, pneumonia, neurologic symtoms, | no | yes | no | no | yes | Treatment with Ca‐Mg or probenecid or alluporinol or theophylline, HIV |
| Giamarelou 2000 | Suspected anaerobes | no | no | yes | no | no | Moribund and high probability of dying within 48 hours |
| Hidalgo 1999 | Pneumonia, extensive cellulitis, meningitis, pyelonephritis | no | no | yes | yes | no | Clotting abnormalities, acidosis, hypercalcaemia, uncontrolled bleeding, live >2h apart from hospital; Hx of tumour fever, other severe extra hematologic chemotherapy induced toxicity, no 24 hours home companion |
| Innes 2003 | Tunnelitis, cellulitis, abcess, clinically documented infection likely to require prolonged antibiotic therapy | yes | yes | no | no | yes | Need for the use of G/GM‐CSF and cytokines; no responsible adult living with them (carer); |
| Malik 1992 | no | yes | no | no | no | no | Recurrent FUO |
| Cornely 2003 | not excluded | excluded (except cotrimoxazole prophylaxis) | yes | yes | excluded | excluded | potential compromised absorption; inability to take oral medication; tenopathy, epilepsy; aplastic anaemia, acute leukaemia; septic shock or signs of sever infection; HIV carrier; serious concomitant disease, liver transaminase> x5 of norm. |
| Niho 2004 | not excluded | excluded | no | not excluded | no | yes | Recurrent FUO; renal insufficiency; hepatic insufficiency; hypotension or peripheral circulatory failure; uncontrolled hypercalcaemia; altered sensorium; respiratory rate >30 breaths/min; serum sodium <128 mg/dl; inability to take oral medications; intestinal malabsorption |
| Paganini 2003 | Fascial, perineal, or catheter‐associated cellulites; uncontrolled local infection; positive blood cultures within the first 48 hours; infection with microorganisms known as resistant to ceftriaxone or ciprofloxacin | included | yes | not excluded | not excluded | excluded | severe comorbidity factors; respiratory failure |
| Outcome or subgroup title | No. of studies | No. of participants | Statistical method | Effect size |
| 1 Mortality Show forest plot | 9 | 1392 | Risk Ratio (M‐H, Fixed, 95% CI) | 0.95 [0.54, 1.68] |
| 1.1 Initially oral | 6 | 961 | Risk Ratio (M‐H, Fixed, 95% CI) | 0.83 [0.43, 1.62] |
| 1.2 Sequential | 3 | 431 | Risk Ratio (M‐H, Fixed, 95% CI) | 1.38 [0.45, 4.22] |
| 2 Treatment failure Show forest plot | 22 | 3142 | Risk Ratio (M‐H, Fixed, 95% CI) | 0.96 [0.86, 1.06] |
| 2.1 Initially oral treatment | 16 | 2196 | Risk Ratio (M‐H, Fixed, 95% CI) | 0.91 [0.79, 1.03] |
| 2.2 Sequential IV to oral treatment | 6 | 946 | Risk Ratio (M‐H, Fixed, 95% CI) | 1.07 [0.90, 1.27] |
| 3 Treatment failure ‐ per protocol analysis Show forest plot | 22 | 2912 | Risk Ratio (M‐H, Fixed, 95% CI) | 0.98 [0.86, 1.11] |
| 3.1 Initially oral treatment | 16 | 1991 | Risk Ratio (M‐H, Fixed, 95% CI) | 0.93 [0.78, 1.10] |
| 3.2 Sequential IV to oral treatment | 6 | 921 | Risk Ratio (M‐H, Fixed, 95% CI) | 1.07 [0.88, 1.29] |
| 4 Adverse events requiring discontinuation of antibiotics Show forest plot | 15 | 1823 | Risk Ratio (M‐H, Random, 95% CI) | 1.45 [0.61, 3.46] |
| 4.1 Initially oral treatment | 10 | 1064 | Risk Ratio (M‐H, Random, 95% CI) | 2.78 [1.14, 6.75] |
| 4.2 Sequential IV to oral treatment | 5 | 759 | Risk Ratio (M‐H, Random, 95% CI) | 0.57 [0.26, 1.25] |
| 5 Gastrointestinal adverse events ('post‐protocol' analysis) Show forest plot | 15 | Risk Ratio (M‐H, Fixed, 95% CI) | Subtotals only | |
| 5.1 Initially oral treatment | 11 | 1400 | Risk Ratio (M‐H, Fixed, 95% CI) | 4.49 [2.87, 7.04] |
| 5.2 Sequential IV to oral treatment | 4 | 784 | Risk Ratio (M‐H, Fixed, 95% CI) | 2.81 [1.03, 7.66] |
| 6 Lost to follow‐up Show forest plot | 19 | 2810 | Risk Ratio (M‐H, Fixed, 95% CI) | 0.82 [0.61, 1.10] |
| 7 Treatment failure not dt modification in update Show forest plot | 21 | 3041 | Risk Ratio (M‐H, Fixed, 95% CI) | 0.95 [0.85, 1.06] |
| 7.1 Initially oral treatment | 15 | 2095 | Risk Ratio (M‐H, Fixed, 95% CI) | 0.91 [0.79, 1.04] |
| 7.2 Sequential IV to oral treatment | 6 | 946 | Risk Ratio (M‐H, Fixed, 95% CI) | 1.05 [0.88, 1.25] |
| Outcome or subgroup title | No. of studies | No. of participants | Statistical method | Effect size |
| 1 Treatment failure ‐ age Show forest plot | 20 | Risk Ratio (M‐H, Fixed, 95% CI) | Subtotals only | |
| 1.1 Children | 8 | 1013 | Risk Ratio (M‐H, Fixed, 95% CI) | 1.02 [0.82, 1.28] |
| 1.2 Adults | 12 | 1652 | Risk Ratio (M‐H, Fixed, 95% CI) | 0.98 [0.85, 1.12] |
| 2 Treatment failure ‐ source of infection Show forest plot | 10 | Risk Ratio (M‐H, Fixed, 95% CI) | Subtotals only | |
| 2.1 Unexplained fever | 10 | 924 | Risk Ratio (M‐H, Fixed, 95% CI) | 1.03 [0.79, 1.33] |
| 2.2 Documented infection | 10 | 641 | Risk Ratio (M‐H, Fixed, 95% CI) | 1.00 [0.84, 1.19] |
| 3 Treatment failure ‐ severity of neutropenia Show forest plot | 3 | Risk Ratio (M‐H, Fixed, 95% CI) | Subtotals only | |
| 3.1 Absolute neutrophil count >=10^9/L | 3 | 328 | Risk Ratio (M‐H, Fixed, 95% CI) | 0.66 [0.45, 0.98] |
| 3.2 Absolute neutrophil count <10^9/L | 3 | 370 | Risk Ratio (M‐H, Fixed, 95% CI) | 1.07 [0.76, 1.49] |
| 4 Treatment failure ‐ type of malignancy Show forest plot | 8 | Risk Ratio (M‐H, Fixed, 95% CI) | Subtotals only | |
| 4.1 Solid tumour | 7 | 990 | Risk Ratio (M‐H, Fixed, 95% CI) | 0.89 [0.70, 1.12] |
| 4.2 Haemetologic malignancy | 4 | 412 | Risk Ratio (M‐H, Fixed, 95% CI) | 1.04 [0.84, 1.28] |
| Outcome or subgroup title | No. of studies | No. of participants | Statistical method | Effect size |
| 1 Allocation concealment Show forest plot | 22 | Risk Ratio (M‐H, Fixed, 95% CI) | Subtotals only | |
| 1.1 Adequate (A) | 12 | 1651 | Risk Ratio (M‐H, Fixed, 95% CI) | 0.94 [0.81, 1.09] |
| 1.2 Unclear (B) | 10 | 1477 | Risk Ratio (M‐H, Fixed, 95% CI) | 0.98 [0.84, 1.14] |
| Outcome or subgroup title | No. of studies | No. of participants | Statistical method | Effect size |
| 1 Setting Show forest plot | 18 | Risk Ratio (M‐H, Fixed, 95% CI) | Subtotals only | |
| 1.1 Oral‐outpatient, IV‐inpatients | 3 | 430 | Risk Ratio (M‐H, Fixed, 95% CI) | 0.95 [0.63, 1.43] |
| 1.2 Inpatients | 6 | 1128 | Risk Ratio (M‐H, Fixed, 95% CI) | 0.93 [0.81, 1.07] |
| 1.3 Outpatients | 7 | 816 | Risk Ratio (M‐H, Fixed, 95% CI) | 1.13 [0.85, 1.50] |
| 1.4 Only first dose in | 2 | 161 | Risk Ratio (M‐H, Fixed, 95% CI) | 0.74 [0.41, 1.34] |
| 2 Type of oral antibiotics Show forest plot | 22 | Risk Ratio (M‐H, Fixed, 95% CI) | Subtotals only | |
| 2.1 Quinolones only | 7 | 967 | Risk Ratio (M‐H, Fixed, 95% CI) | 1.03 [0.88, 1.20] |
| 2.2 Quinolones in combination with augmentin, ampicillin‐sulbactam, penicillin V or clindamycin | 11 | 1679 | Risk Ratio (M‐H, Fixed, 95% CI) | 0.89 [0.76, 1.04] |
| 2.3 Cefixime | 2 | 354 | Risk Ratio (M‐H, Fixed, 95% CI) | 1.00 [0.64, 1.56] |
| 2.4 New quinolones | 2 | 128 | Risk Ratio (M‐H, Fixed, 95% CI) | 0.97 [0.50, 1.86] |