Anticonceptivos combinados: efectos sobre el peso
Information
- DOI:
- https://doi.org/10.1002/14651858.CD003987.pub5Copy DOI

- Database:
-
- Cochrane Database of Systematic Reviews
- Version published:
-
- 29 January 2014see what's new
- Type:
-
- Intervention
- Stage:
-
- Review
- Cochrane Editorial Group:
-
Cochrane Fertility Regulation Group
- Copyright:
-
- Copyright © 2014 The Cochrane Collaboration. Published by John Wiley & Sons, Ltd.
Article metrics
Altmetric:
Cited by:
Authors
Contributions of authors
F Helmerhorst developed the idea. M Gallo extracted data for the original review in 2003 and drafted the review. D Grimes did the second data extraction for the initial review and the updates through 2011. For the 2005 to 2013 updates, L Lopez reviewed the search results, did the primary data extraction, and incorporated the results. In 2013, F Carayon helped review search results, entered information, and checked the review. D Grimes, K Schulz, and F Helmerhorst revised and approved the initial review and reviewed the updates.
Sources of support
Internal sources
-
No sources of support supplied
External sources
-
National Institute of Child Health and Human Development, USA.
Support for conducting the review and updates at FHI 360
-
U.S. Agency for International Development, USA.
Support for conducting the review and updates (through 2011) at FHI 360
Declarations of interest
DA Grimes has consulted with the pharmaceutical companies Bayer Healthcare Pharmaceuticals and Merck & Co, Inc.
FM Helmerhorst has supervised studies sponsored or assigned by various pharmaceutical companies that manufacture oral contraceptives.
Acknowledgements
Carol Manion of FHI 360 helped with the literature searches. For the original review, Anne Eisinga of the Cochrane Fertility Regulation Group also provided assistance.
Version history
| Published | Title | Stage | Authors | Version |
| 2014 Jan 29 | Combination contraceptives: effects on weight | Review | Maria F Gallo, Laureen M Lopez, David A Grimes, Florence Carayon, Kenneth F Schulz, Frans M Helmerhorst | |
| 2011 Sep 07 | Combination contraceptives: effects on weight | Review | Maria F Gallo, Laureen M Lopez, David A Grimes, Kenneth F Schulz, Frans M Helmerhorst | |
| 2008 Oct 08 | Combination contraceptives: effects on weight | Review | Maria F Gallo, Laureen M Lopez, David A Grimes, Kenneth F Schulz, Frans M Helmerhorst | |
| 2006 Jan 25 | Combination contraceptives: effects on weight | Review | Maria F Gallo, Laureen M Lopez, David A Grimes, Kenneth F Schulz, Frans M Helmerhorst | |
| 2003 Apr 22 | Combination contraceptives: effects on weight | Review | Maria M.F. Gallo, David Grimes, Kenneth F Schulz, Frans F.M. Helmerhorst | |
Keywords
MeSH
Medical Subject Headings (MeSH) Keywords
Medical Subject Headings Check Words
Female; Humans;
PICOs
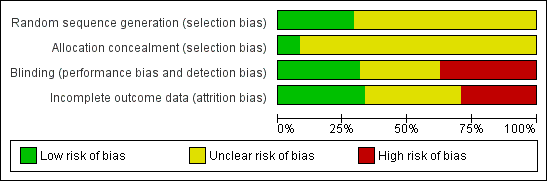
Risk of bias graph: review authors' judgements about each risk of bias item presented as percentages across all included studies.

Risk of bias summary: review authors' judgements about each risk of bias item for each included study.

Comparison 1 Dimethisterone 25 mg and ethinyl estradiol (EE) 100 µg versus placebo, Outcome 1 Gained >2.3 kg (cycle 4).

Comparison 2 Ethynodiol diacetate 1 mg and mestranol 100 µg versus placebo, Outcome 1 Gained >2.3 kg (cycle 4).
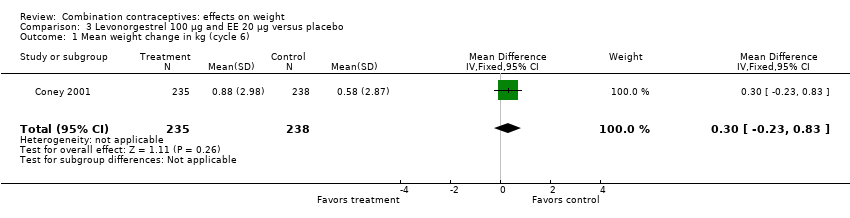
Comparison 3 Levonorgestrel 100 µg and EE 20 µg versus placebo, Outcome 1 Mean weight change in kg (cycle 6).
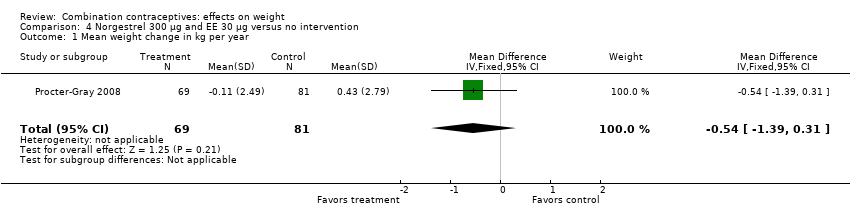
Comparison 4 Norgestrel 300 µg and EE 30 µg versus no intervention, Outcome 1 Mean weight change in kg per year.
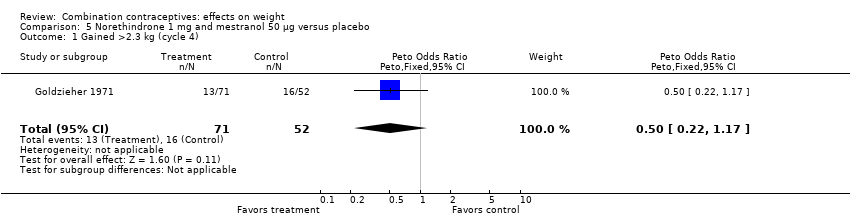
Comparison 5 Norethindrone 1 mg and mestranol 50 µg versus placebo, Outcome 1 Gained >2.3 kg (cycle 4).
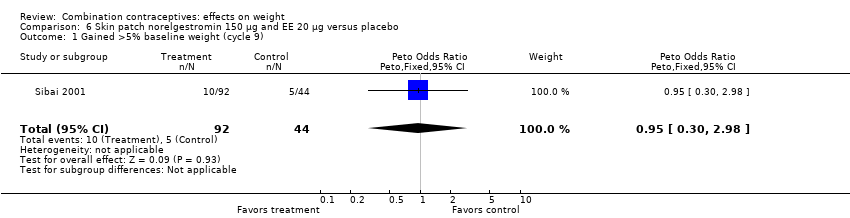
Comparison 6 Skin patch norelgestromin 150 µg and EE 20 µg versus placebo, Outcome 1 Gained >5% baseline weight (cycle 9).
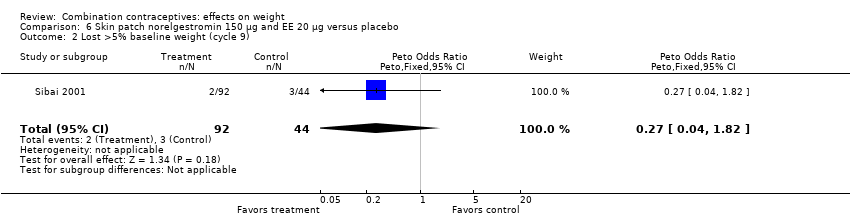
Comparison 6 Skin patch norelgestromin 150 µg and EE 20 µg versus placebo, Outcome 2 Lost >5% baseline weight (cycle 9).
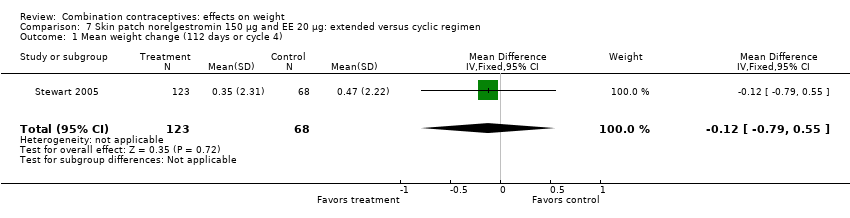
Comparison 7 Skin patch norelgestromin 150 µg and EE 20 µg: extended versus cyclic regimen, Outcome 1 Mean weight change (112 days or cycle 4).

Comparison 8 Desogestrel 150 µg and EE 20 µg versus desogestrel 150 µg and EE 30 µg, Outcome 1 Mean body mass percentage change (cycle 6).

Comparison 9 Desogestrel 150 µg and EE 20 µg versus gestodene 75 µg and EE 20 µg, Outcome 1 Gained >2 kg (cycle 6).

Comparison 9 Desogestrel 150 µg and EE 20 µg versus gestodene 75 µg and EE 20 µg, Outcome 2 Lost >2 kg (cycle 6).

Comparison 9 Desogestrel 150 µg and EE 20 µg versus gestodene 75 µg and EE 20 µg, Outcome 3 Gained >2 kg (cycle 12).

Comparison 9 Desogestrel 150 µg and EE 20 µg versus gestodene 75 µg and EE 20 µg, Outcome 4 Lost >2 kg (cycle 12).
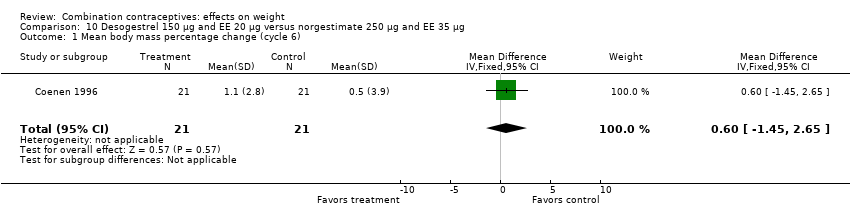
Comparison 10 Desogestrel 150 µg and EE 20 µg versus norgestimate 250 µg and EE 35 µg, Outcome 1 Mean body mass percentage change (cycle 6).
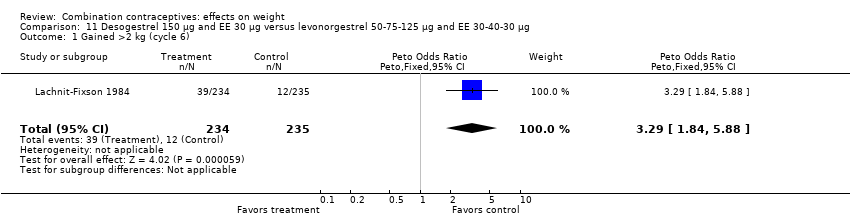
Comparison 11 Desogestrel 150 µg and EE 30 µg versus levonorgestrel 50‐75‐125 µg and EE 30‐40‐30 µg, Outcome 1 Gained >2 kg (cycle 6).

Comparison 12 Standard desogestrel and EE regimen versus prolonged gestodene and EE regimen, Outcome 1 Gained >2 kg (cycle 7).

Comparison 13 Prolonged desogestrel and EE regimen versus standard desogestrel and EE regimen, Outcome 1 Mean weight change in kg (cycle 12).

Comparison 14 Dienogest 2 mg, EE 10 µg and estradiol valerate 2 mg versus levonorgestrel 100 µg and EE 20 µg, Outcome 1 Gained >5% baseline weight (cycle 3).
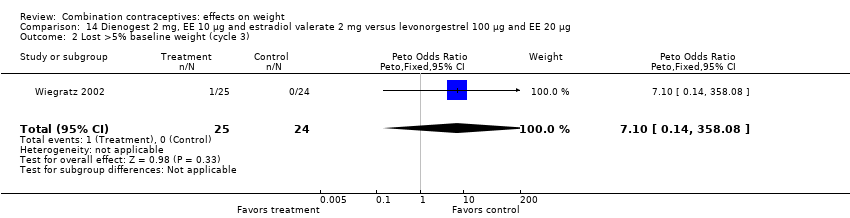
Comparison 14 Dienogest 2 mg, EE 10 µg and estradiol valerate 2 mg versus levonorgestrel 100 µg and EE 20 µg, Outcome 2 Lost >5% baseline weight (cycle 3).

Comparison 15 Dienogest 2 mg and EE 20 µg versus levonorgestrel 100 µg and EE 20 µg, Outcome 1 Gained >5% baseline weight (cycle 3).
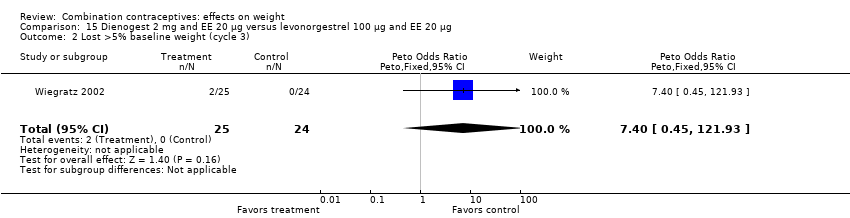
Comparison 15 Dienogest 2 mg and EE 20 µg versus levonorgestrel 100 µg and EE 20 µg, Outcome 2 Lost >5% baseline weight (cycle 3).

Comparison 16 Dienogest 2 mg and EE 30 µg versus levonorgestrel 100 µg and EE 20 µg, Outcome 1 Gained >5% baseline weight (cycle 3).
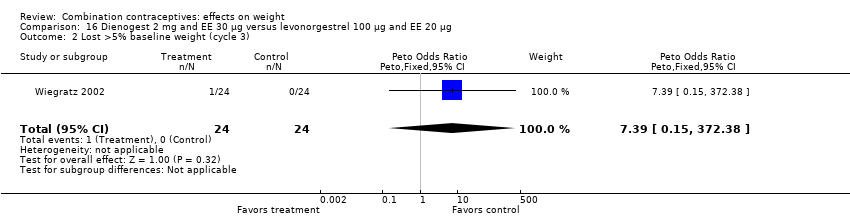
Comparison 16 Dienogest 2 mg and EE 30 µg versus levonorgestrel 100 µg and EE 20 µg, Outcome 2 Lost >5% baseline weight (cycle 3).
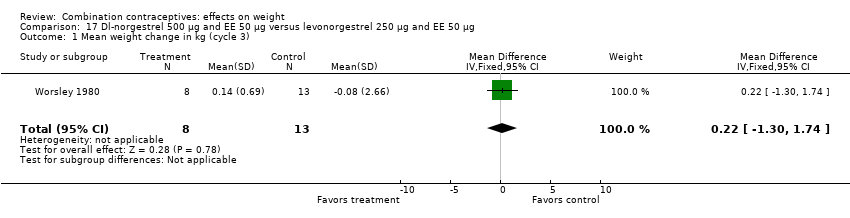
Comparison 17 Dl‐norgestrel 500 µg and EE 50 µg versus levonorgestrel 250 µg and EE 50 µg, Outcome 1 Mean weight change in kg (cycle 3).
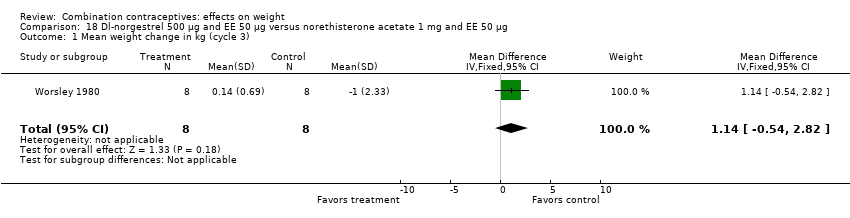
Comparison 18 Dl‐norgestrel 500 µg and EE 50 µg versus norethisterone acetate 1 mg and EE 50 µg, Outcome 1 Mean weight change in kg (cycle 3).
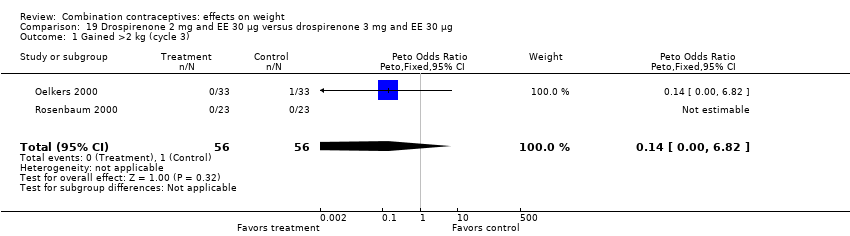
Comparison 19 Drospirenone 2 mg and EE 30 µg versus drospirenone 3 mg and EE 30 µg, Outcome 1 Gained >2 kg (cycle 3).
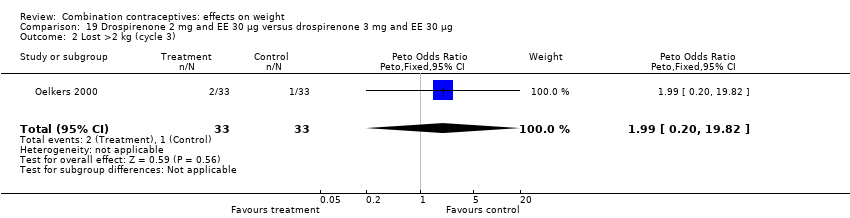
Comparison 19 Drospirenone 2 mg and EE 30 µg versus drospirenone 3 mg and EE 30 µg, Outcome 2 Lost >2 kg (cycle 3).

Comparison 20 Drospirenone 3 mg and EE 15 µg versus levonorgestrel 150 µg and EE 30 µg, Outcome 1 Gained >2 kg (cycle 6).

Comparison 20 Drospirenone 3 mg and EE 15 µg versus levonorgestrel 150 µg and EE 30 µg, Outcome 2 Lost >2 kg (cycle 6).

Comparison 21 Drospirenone 3 mg and EE 20 µg versus levonorgestrel 150 µg and EE 30 µg, Outcome 1 Gained >2 kg (cycle 6).
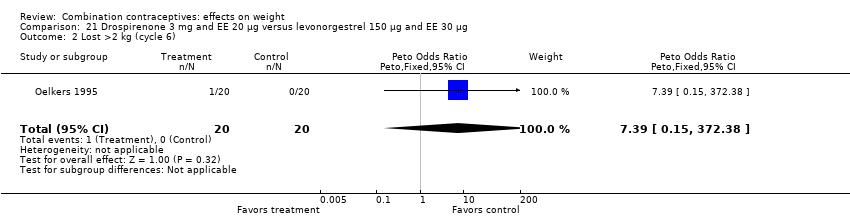
Comparison 21 Drospirenone 3 mg and EE 20 µg versus levonorgestrel 150 µg and EE 30 µg, Outcome 2 Lost >2 kg (cycle 6).

Comparison 22 Drospirenone 3 mg and EE 30 µg versus desogestrel 150 µg and EE 30 µg, Outcome 1 Gained >2 kg (cycle 13).
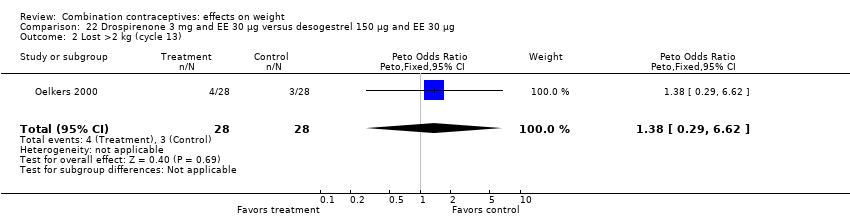
Comparison 22 Drospirenone 3 mg and EE 30 µg versus desogestrel 150 µg and EE 30 µg, Outcome 2 Lost >2 kg (cycle 13).

Comparison 23 Drospirenone 3 mg and EE 20 μg versus desogestrel 150 μg and EE 20 μg, Outcome 1 Mean weight change in kg (cycle 7).

Comparison 24 Drospirenone 3 mg and EE 30 µg versus levonorgestrel 150 µg and EE 30 µg, Outcome 1 Gained >2 kg (cycle 6).
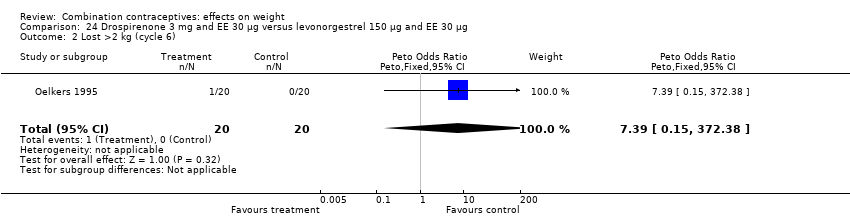
Comparison 24 Drospirenone 3 mg and EE 30 µg versus levonorgestrel 150 µg and EE 30 µg, Outcome 2 Lost >2 kg (cycle 6).
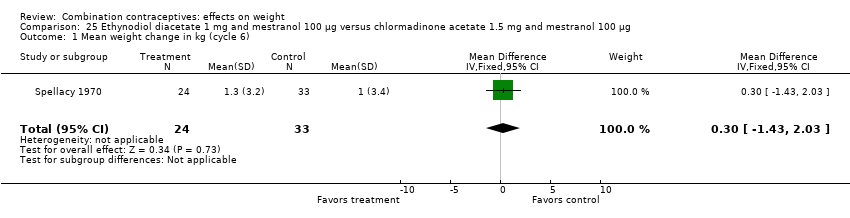
Comparison 25 Ethynodiol diacetate 1 mg and mestranol 100 µg versus chlormadinone acetate 1.5 mg and mestranol 100 µg, Outcome 1 Mean weight change in kg (cycle 6).
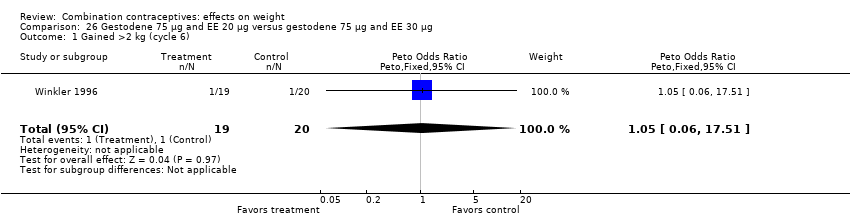
Comparison 26 Gestodene 75 µg and EE 20 µg versus gestodene 75 µg and EE 30 µg, Outcome 1 Gained >2 kg (cycle 6).

Comparison 26 Gestodene 75 µg and EE 20 µg versus gestodene 75 µg and EE 30 µg, Outcome 2 Lost >2 kg (cycle 6).
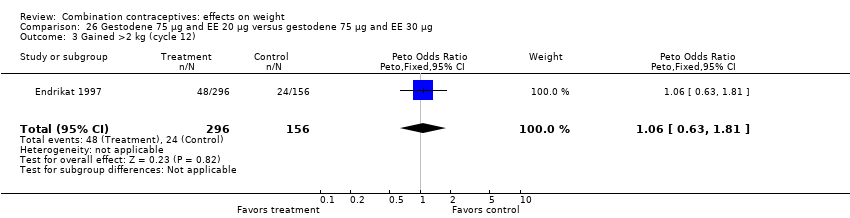
Comparison 26 Gestodene 75 µg and EE 20 µg versus gestodene 75 µg and EE 30 µg, Outcome 3 Gained >2 kg (cycle 12).

Comparison 26 Gestodene 75 µg and EE 20 µg versus gestodene 75 µg and EE 30 µg, Outcome 4 Lost >2 kg (cycle 12).
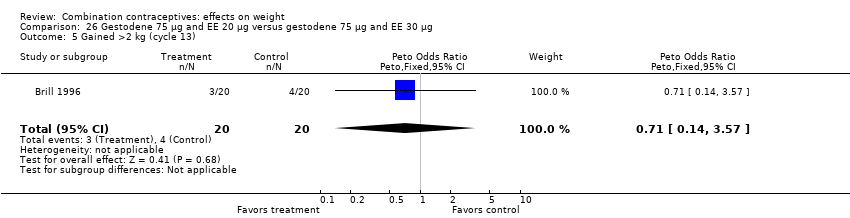
Comparison 26 Gestodene 75 µg and EE 20 µg versus gestodene 75 µg and EE 30 µg, Outcome 5 Gained >2 kg (cycle 13).

Comparison 26 Gestodene 75 µg and EE 20 µg versus gestodene 75 µg and EE 30 µg, Outcome 6 Lost >2 kg (cycle 13).

Comparison 27 Gestodene 75 µg and EE 30 µg versus desogestrel 150 µg and EE 20 µg, Outcome 1 Mean body mass percentage change (cycle 6).
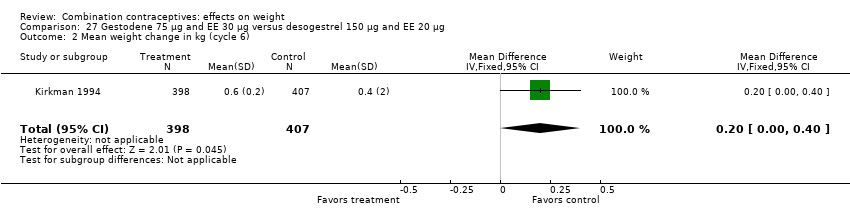
Comparison 27 Gestodene 75 µg and EE 30 µg versus desogestrel 150 µg and EE 20 µg, Outcome 2 Mean weight change in kg (cycle 6).
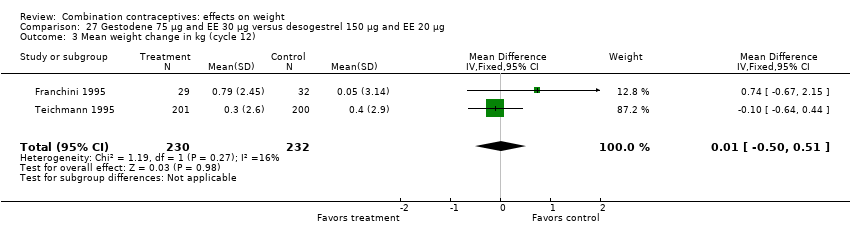
Comparison 27 Gestodene 75 µg and EE 30 µg versus desogestrel 150 µg and EE 20 µg, Outcome 3 Mean weight change in kg (cycle 12).
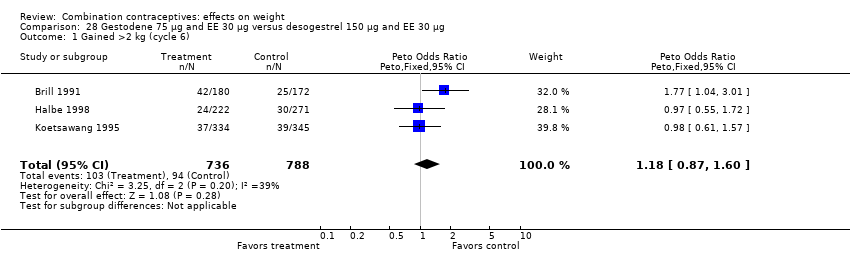
Comparison 28 Gestodene 75 µg and EE 30 µg versus desogestrel 150 µg and EE 30 µg, Outcome 1 Gained >2 kg (cycle 6).
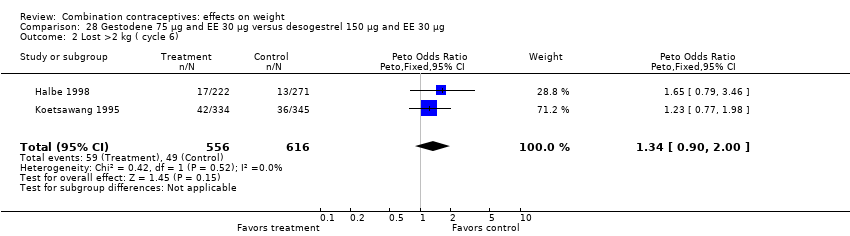
Comparison 28 Gestodene 75 µg and EE 30 µg versus desogestrel 150 µg and EE 30 µg, Outcome 2 Lost >2 kg ( cycle 6).
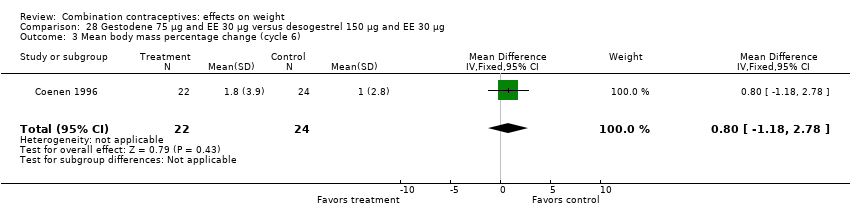
Comparison 28 Gestodene 75 µg and EE 30 µg versus desogestrel 150 µg and EE 30 µg, Outcome 3 Mean body mass percentage change (cycle 6).

Comparison 29 Gestodene 75 µg and EE 30 µg versus norgestimate 250 µg and EE 35 µg, Outcome 1 Gained >2 kg (cycle 6).

Comparison 29 Gestodene 75 µg and EE 30 µg versus norgestimate 250 µg and EE 35 µg, Outcome 2 Mean body mass percentage change (cycle 6).

Comparison 30 Gestodene 50‐70‐100 µg and EE 30‐40‐30 µg versus desogestrel 150 µg and EE 30 µg, Outcome 1 Mean weight change in kg (cycle 12).

Comparison 31 Gestodene 50‐70‐100 µg and EE 30‐40‐30 µg versus norgestimate 250 µg and EE 35 µg, Outcome 1 Mean weight change in kg (cycle 12).
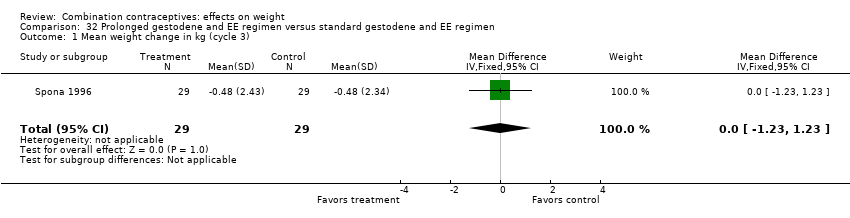
Comparison 32 Prolonged gestodene and EE regimen versus standard gestodene and EE regimen, Outcome 1 Mean weight change in kg (cycle 3).
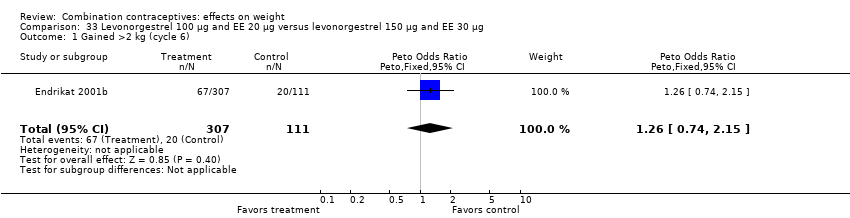
Comparison 33 Levonorgestrel 100 µg and EE 20 µg versus levonorgestrel 150 µg and EE 30 µg, Outcome 1 Gained >2 kg (cycle 6).

Comparison 33 Levonorgestrel 100 µg and EE 20 µg versus levonorgestrel 150 µg and EE 30 µg, Outcome 2 Lost >2 kg (cycle 6).

Comparison 34 Levonorgestrel 150 µg and EE 30 µg versus desogestrel 150 µg and EE 30 µg, Outcome 1 Gained >2.5 kg (cycle 24).

Comparison 34 Levonorgestrel 150 µg and EE 30 µg versus desogestrel 150 µg and EE 30 µg, Outcome 2 Lost >2.5 kg (cycle 24).

Comparison 35 Levonorgestrel 150 µg and EE 30 µg versus gestodene 75 µg and EE 30 µg, Outcome 1 Mean weight change in kg (cycle 6).
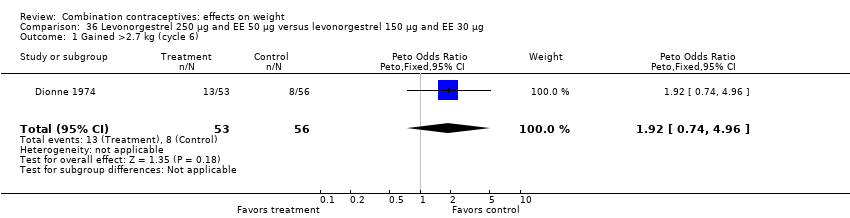
Comparison 36 Levonorgestrel 250 µg and EE 50 µg versus levonorgestrel 150 µg and EE 30 µg, Outcome 1 Gained >2.7 kg (cycle 6).
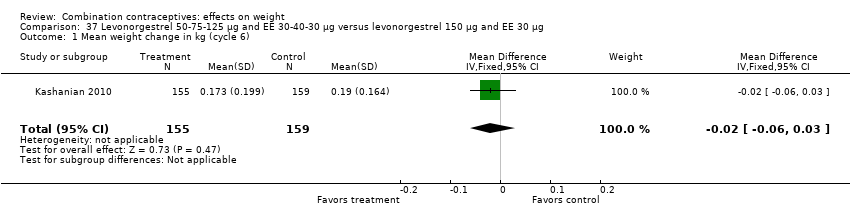
Comparison 37 Levonorgestrel 50‐75‐125 µg and EE 30‐40‐30 µg versus levonorgestrel 150 µg and EE 30 µg, Outcome 1 Mean weight change in kg (cycle 6).
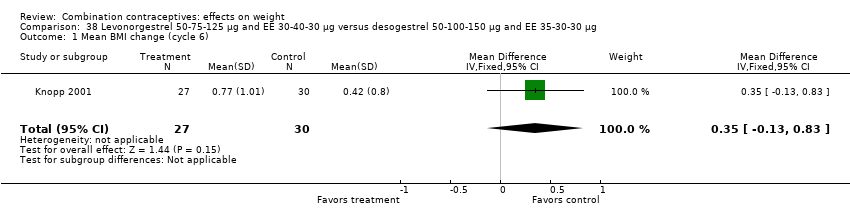
Comparison 38 Levonorgestrel 50‐75‐125 µg and EE 30‐40‐30 µg versus desogestrel 50‐100‐150 µg and EE 35‐30‐30 µg, Outcome 1 Mean BMI change (cycle 6).

Comparison 38 Levonorgestrel 50‐75‐125 µg and EE 30‐40‐30 µg versus desogestrel 50‐100‐150 µg and EE 35‐30‐30 µg, Outcome 2 Mean weight change in kg (cycle 6).

Comparison 39 Levonorgestrel 50‐75‐125 µg and EE 30‐40‐30 µg versus desogestrel 150 µg and EE 20 µg, Outcome 1 Mean weight change in kg (cycle 3).
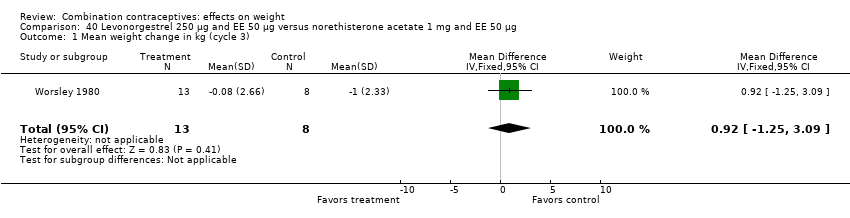
Comparison 40 Levonorgestrel 250 µg and EE 50 µg versus norethisterone acetate 1 mg and EE 50 µg, Outcome 1 Mean weight change in kg (cycle 3).

Comparison 41 Levonorgestrel and EE 6‐6‐9 day regimen versus levonorgestrel 6‐5‐10 day regimen, Outcome 1 Mean weight change in kg (cycle 3).

Comparison 42 Lynestrenol 2 mg and EE 40 µg versus lynestrenol 1 mg and EE 40 µg, Outcome 1 Gained >2.5 kg (cycle 12).

Comparison 42 Lynestrenol 2 mg and EE 40 µg versus lynestrenol 1 mg and EE 40 µg, Outcome 2 Lost >2.5 kg (cycle 12).

Comparison 43 Norethisterone 500‐1000 µg and EE 35 µg versus levonorgestrel 50‐75‐125 µg and EE 30‐40 µg, Outcome 1 Mean weight change in kg (cycle 6).
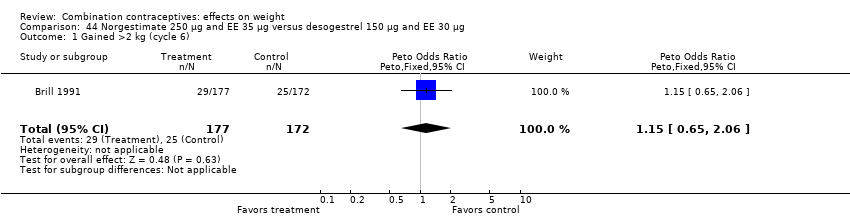
Comparison 44 Norgestimate 250 µg and EE 35 µg versus desogestrel 150 µg and EE 30 µg, Outcome 1 Gained >2 kg (cycle 6).

Comparison 44 Norgestimate 250 µg and EE 35 µg versus desogestrel 150 µg and EE 30 µg, Outcome 2 Mean body mass percentage change (cycle 6).
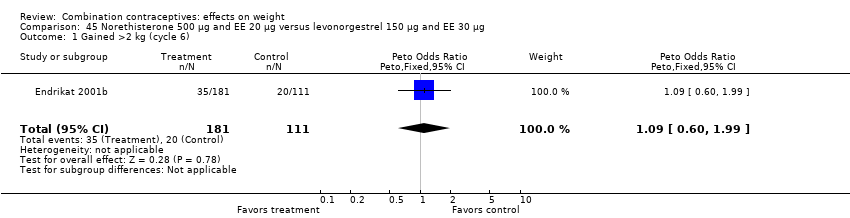
Comparison 45 Norethisterone 500 µg and EE 20 µg versus levonorgestrel 150 µg and EE 30 µg, Outcome 1 Gained >2 kg (cycle 6).

Comparison 45 Norethisterone 500 µg and EE 20 µg versus levonorgestrel 150 µg and EE 30 µg, Outcome 2 Lost >2 kg (cycle 6).
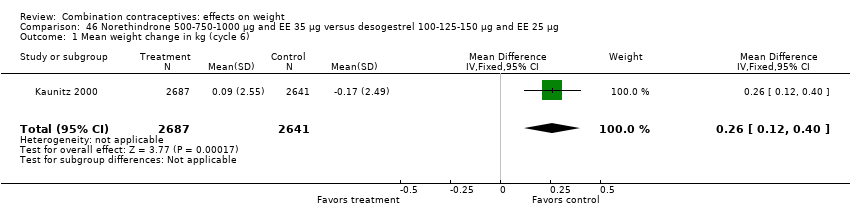
Comparison 46 Norethindrone 500‐750‐1000 µg and EE 35 µg versus desogestrel 100‐125‐150 µg and EE 25 µg, Outcome 1 Mean weight change in kg (cycle 6).

Comparison 47 Norgestimate 180‐215‐250 µg and EE 25 µg versus norethindrone acetate 1 mg and EE 20 µg, Outcome 1 Weight gain >=5% (cycle 6).

Comparison 47 Norgestimate 180‐215‐250 µg and EE 25 µg versus norethindrone acetate 1 mg and EE 20 µg, Outcome 2 Weight gain >=5% (cycle 13).
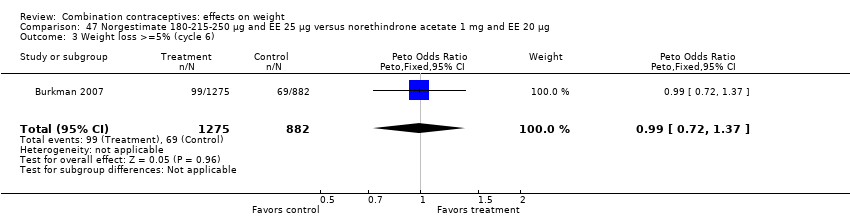
Comparison 47 Norgestimate 180‐215‐250 µg and EE 25 µg versus norethindrone acetate 1 mg and EE 20 µg, Outcome 3 Weight loss >=5% (cycle 6).
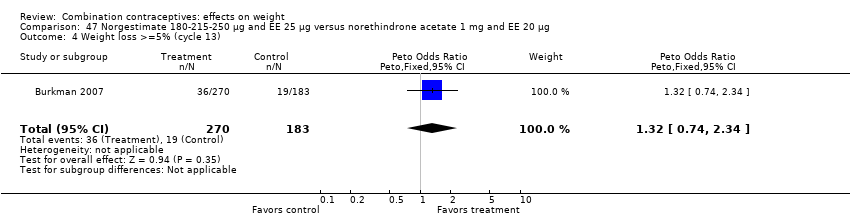
Comparison 47 Norgestimate 180‐215‐250 µg and EE 25 µg versus norethindrone acetate 1 mg and EE 20 µg, Outcome 4 Weight loss >=5% (cycle 13).
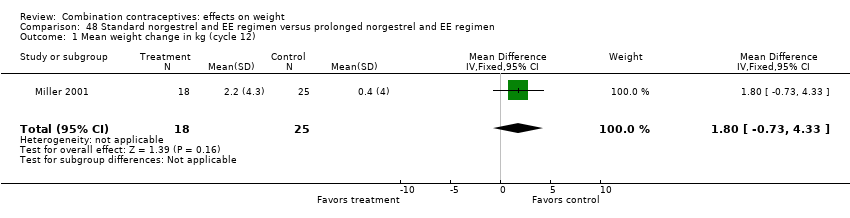
Comparison 48 Standard norgestrel and EE regimen versus prolonged norgestrel and EE regimen, Outcome 1 Mean weight change in kg (cycle 12).

Comparison 49 Injectable medroxyprogesterone acetate 25 mg and EC 5 mg versus norethisterone enanthate 50 mg and EV 5 mg, Outcome 1 Mean weight change in kg (cycle 12).
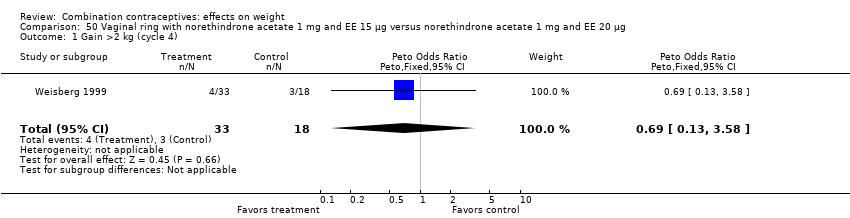
Comparison 50 Vaginal ring with norethindrone acetate 1 mg and EE 15 µg versus norethindrone acetate 1 mg and EE 20 µg, Outcome 1 Gain >2 kg (cycle 4).
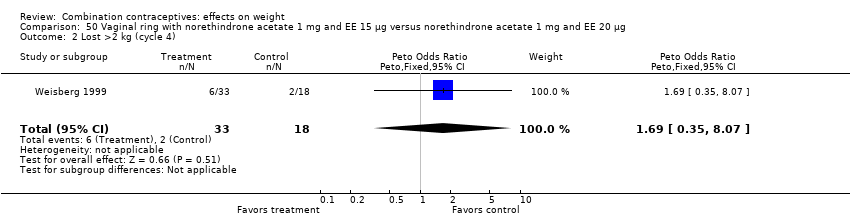
Comparison 50 Vaginal ring with norethindrone acetate 1 mg and EE 15 µg versus norethindrone acetate 1 mg and EE 20 µg, Outcome 2 Lost >2 kg (cycle 4).

Comparison 51 Vaginal ring etonogestrel 120 µg and EE 15 µg versus levonorgestrel 150 µg and EE 30 µg, Outcome 1 Gain >=7% body weight (cycle 13).

Comparison 51 Vaginal ring etonogestrel 120 µg and EE 15 µg versus levonorgestrel 150 µg and EE 30 µg, Outcome 2 Lost >=7% body weight (cycle 13).
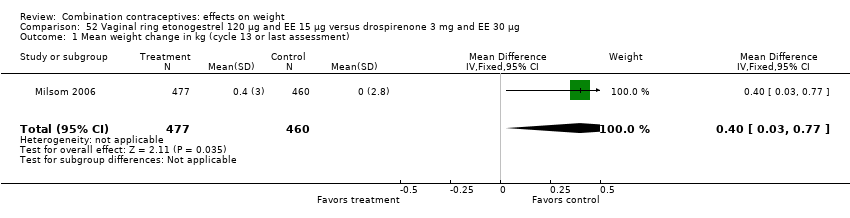
Comparison 52 Vaginal ring etonogestrel 120 µg and EE 15 µg versus drospirenone 3 mg and EE 30 µg, Outcome 1 Mean weight change in kg (cycle 13 or last assessment).
| Study ID | Intervention group | n | N (randomized women) |
| Prolonged desogestrel / ethinyl estradiol (EE) regimen | 10 | 200 | |
| Standard desogestrel / EE regimen | 1 | 100 | |
| Norgestimate 250 μg / EE 35 μg | 1 | 25 | |
| Gestodene 75 μg / EE 30 μg | 0 | 25 | |
| Desogestrel 150 μg / EE 30 μg | 0 | 25 | |
| Desogestrel 150 μg / EE 20 μg | 0 | 25 | |
| Levonorgestrel 100 μg / EE 20 μg | 2 | 359 | |
| Placebo | 0 | 362 | |
| Levonorgestrel 250 μg / EE 50 μg | 3 | 73 | |
| Levonorgestrel 150 μg / EE 30 μg | 1 | 77 | |
| Gestodene 75 μg / EE 30 μg | 4 | 279 | |
| Desogestrel 150 μg / EE 30 μg | 0 | 316 | |
| Gestodene 75 μg / EE 30 μg | 4 | 505 | |
| Desogestrel 150 μg / EE 20 μg | 2 | 501 | |
| Standard norgestrel / EE regimen | 0 | 44 | |
| Prolonged norgestrel / EE regimen | 1 | 46 | |
| Vaginal ring etonogestrel 120 µg / EE 15 µg | 2 | 512 | |
| Levonorgestrel 150 µg / EE 30 µg | 6 | 518 | |
| Injectable medroxyprogesterone acetate 25 mg / estradiol cypionatge (EC) 5 mg | 14 | 1955 | |
| Injectable norethisterone enanthate 50 mg / estradiol valerate (EV) 5 mg | 10 | 1960 | |
| Norethisterone 500‐1000 μg / EE 35 μg | 3 | 100 | |
| Levonorgestrel 50‐75‐125 μg / EE 30‐40 μg | 1 | 96 |
| Outcome or subgroup title | No. of studies | No. of participants | Statistical method | Effect size |
| 1 Gained >2.3 kg (cycle 4) Show forest plot | 1 | 113 | Peto Odds Ratio (Peto, Fixed, 95% CI) | 1.02 [0.46, 2.26] |
| Outcome or subgroup title | No. of studies | No. of participants | Statistical method | Effect size |
| 1 Gained >2.3 kg (cycle 4) Show forest plot | 1 | 112 | Peto Odds Ratio (Peto, Fixed, 95% CI) | 0.57 [0.24, 1.33] |
| Outcome or subgroup title | No. of studies | No. of participants | Statistical method | Effect size |
| 1 Mean weight change in kg (cycle 6) Show forest plot | 1 | 473 | Mean Difference (IV, Fixed, 95% CI) | 0.30 [‐0.23, 0.83] |
| Outcome or subgroup title | No. of studies | No. of participants | Statistical method | Effect size |
| 1 Mean weight change in kg per year Show forest plot | 1 | 150 | Mean Difference (IV, Fixed, 95% CI) | ‐0.54 [‐1.39, 0.31] |
| Outcome or subgroup title | No. of studies | No. of participants | Statistical method | Effect size |
| 1 Gained >2.3 kg (cycle 4) Show forest plot | 1 | 123 | Peto Odds Ratio (Peto, Fixed, 95% CI) | 0.50 [0.22, 1.17] |
| Outcome or subgroup title | No. of studies | No. of participants | Statistical method | Effect size |
| 1 Gained >5% baseline weight (cycle 9) Show forest plot | 1 | 136 | Peto Odds Ratio (Peto, Fixed, 95% CI) | 0.95 [0.30, 2.98] |
| 2 Lost >5% baseline weight (cycle 9) Show forest plot | 1 | 136 | Peto Odds Ratio (Peto, Fixed, 95% CI) | 0.27 [0.04, 1.82] |
| Outcome or subgroup title | No. of studies | No. of participants | Statistical method | Effect size |
| 1 Mean weight change (112 days or cycle 4) Show forest plot | 1 | 191 | Mean Difference (IV, Fixed, 95% CI) | ‐0.12 [‐0.79, 0.55] |
| Outcome or subgroup title | No. of studies | No. of participants | Statistical method | Effect size |
| 1 Mean body mass percentage change (cycle 6) Show forest plot | 1 | 45 | Mean Difference (IV, Fixed, 95% CI) | 0.10 [‐1.54, 1.74] |
| Outcome or subgroup title | No. of studies | No. of participants | Statistical method | Effect size |
| 1 Gained >2 kg (cycle 6) Show forest plot | 1 | 801 | Peto Odds Ratio (Peto, Fixed, 95% CI) | 0.84 [0.58, 1.22] |
| 2 Lost >2 kg (cycle 6) Show forest plot | 1 | 801 | Peto Odds Ratio (Peto, Fixed, 95% CI) | 1.65 [1.13, 2.41] |
| 3 Gained >2 kg (cycle 12) Show forest plot | 1 | 1476 | Peto Odds Ratio (Peto, Fixed, 95% CI) | 1.13 [0.85, 1.49] |
| 4 Lost >2 kg (cycle 12) Show forest plot | 1 | 1476 | Peto Odds Ratio (Peto, Fixed, 95% CI) | 0.95 [0.68, 1.33] |
| Outcome or subgroup title | No. of studies | No. of participants | Statistical method | Effect size |
| 1 Mean body mass percentage change (cycle 6) Show forest plot | 1 | 42 | Mean Difference (IV, Fixed, 95% CI) | 0.60 [‐1.45, 2.65] |
| Outcome or subgroup title | No. of studies | No. of participants | Statistical method | Effect size |
| 1 Gained >2 kg (cycle 6) Show forest plot | 1 | 469 | Peto Odds Ratio (Peto, Fixed, 95% CI) | 3.29 [1.84, 5.88] |
| Outcome or subgroup title | No. of studies | No. of participants | Statistical method | Effect size |
| 1 Gained >2 kg (cycle 7) Show forest plot | 1 | 890 | Peto Odds Ratio (Peto, Fixed, 95% CI) | 1.20 [0.86, 1.68] |
| Outcome or subgroup title | No. of studies | No. of participants | Statistical method | Effect size |
| 1 Mean weight change in kg (cycle 12) Show forest plot | 1 | 196 | Mean Difference (IV, Fixed, 95% CI) | 0.57 [‐0.42, 1.56] |
| Outcome or subgroup title | No. of studies | No. of participants | Statistical method | Effect size |
| 1 Gained >5% baseline weight (cycle 3) Show forest plot | 1 | 49 | Peto Odds Ratio (Peto, Fixed, 95% CI) | 1.20 [0.32, 4.51] |
| 2 Lost >5% baseline weight (cycle 3) Show forest plot | 1 | 49 | Peto Odds Ratio (Peto, Fixed, 95% CI) | 7.10 [0.14, 358.08] |
| Outcome or subgroup title | No. of studies | No. of participants | Statistical method | Effect size |
| 1 Gained >5% baseline weight (cycle 3) Show forest plot | 1 | 49 | Peto Odds Ratio (Peto, Fixed, 95% CI) | 0.95 [0.24, 3.76] |
| 2 Lost >5% baseline weight (cycle 3) Show forest plot | 1 | 49 | Peto Odds Ratio (Peto, Fixed, 95% CI) | 7.40 [0.45, 121.93] |
| Outcome or subgroup title | No. of studies | No. of participants | Statistical method | Effect size |
| 1 Gained >5% baseline weight (cycle 3) Show forest plot | 1 | 48 | Peto Odds Ratio (Peto, Fixed, 95% CI) | 0.77 [0.18, 3.21] |
| 2 Lost >5% baseline weight (cycle 3) Show forest plot | 1 | 48 | Peto Odds Ratio (Peto, Fixed, 95% CI) | 7.39 [0.15, 372.38] |
| Outcome or subgroup title | No. of studies | No. of participants | Statistical method | Effect size |
| 1 Mean weight change in kg (cycle 3) Show forest plot | 1 | 21 | Mean Difference (IV, Fixed, 95% CI) | 0.22 [‐1.30, 1.74] |
| Outcome or subgroup title | No. of studies | No. of participants | Statistical method | Effect size |
| 1 Mean weight change in kg (cycle 3) Show forest plot | 1 | 16 | Mean Difference (IV, Fixed, 95% CI) | 1.14 [‐0.54, 2.82] |
| Outcome or subgroup title | No. of studies | No. of participants | Statistical method | Effect size |
| 1 Gained >2 kg (cycle 3) Show forest plot | 2 | 112 | Peto Odds Ratio (Peto, Fixed, 95% CI) | 0.14 [0.00, 6.82] |
| 2 Lost >2 kg (cycle 3) Show forest plot | 1 | 66 | Peto Odds Ratio (Peto, Fixed, 95% CI) | 1.99 [0.20, 19.82] |
| Outcome or subgroup title | No. of studies | No. of participants | Statistical method | Effect size |
| 1 Gained >2 kg (cycle 6) Show forest plot | 1 | 40 | Peto Odds Ratio (Peto, Fixed, 95% CI) | 0.50 [0.05, 5.06] |
| 2 Lost >2 kg (cycle 6) Show forest plot | 1 | 40 | Peto Odds Ratio (Peto, Fixed, 95% CI) | 9.92 [1.79, 55.04] |
| Outcome or subgroup title | No. of studies | No. of participants | Statistical method | Effect size |
| 1 Gained >2 kg (cycle 6) Show forest plot | 1 | 40 | Peto Odds Ratio (Peto, Fixed, 95% CI) | 0.13 [0.01, 2.13] |
| 2 Lost >2 kg (cycle 6) Show forest plot | 1 | 40 | Peto Odds Ratio (Peto, Fixed, 95% CI) | 7.39 [0.15, 372.38] |
| Outcome or subgroup title | No. of studies | No. of participants | Statistical method | Effect size |
| 1 Gained >2 kg (cycle 13) Show forest plot | 1 | 56 | Peto Odds Ratio (Peto, Fixed, 95% CI) | 0.86 [0.29, 2.56] |
| 2 Lost >2 kg (cycle 13) Show forest plot | 1 | 56 | Peto Odds Ratio (Peto, Fixed, 95% CI) | 1.38 [0.29, 6.62] |
| Outcome or subgroup title | No. of studies | No. of participants | Statistical method | Effect size |
| 1 Mean weight change in kg (cycle 7) Show forest plot | 1 | 441 | Mean Difference (IV, Fixed, 95% CI) | ‐0.67 [‐1.16, ‐0.18] |
| Outcome or subgroup title | No. of studies | No. of participants | Statistical method | Effect size |
| 1 Gained >2 kg (cycle 6) Show forest plot | 1 | 40 | Peto Odds Ratio (Peto, Fixed, 95% CI) | 0.13 [0.01, 2.13] |
| 2 Lost >2 kg (cycle 6) Show forest plot | 1 | 40 | Peto Odds Ratio (Peto, Fixed, 95% CI) | 7.39 [0.15, 372.38] |
| Outcome or subgroup title | No. of studies | No. of participants | Statistical method | Effect size |
| 1 Mean weight change in kg (cycle 6) Show forest plot | 1 | 57 | Mean Difference (IV, Fixed, 95% CI) | 0.30 [‐1.43, 2.03] |
| Outcome or subgroup title | No. of studies | No. of participants | Statistical method | Effect size |
| 1 Gained >2 kg (cycle 6) Show forest plot | 1 | 39 | Peto Odds Ratio (Peto, Fixed, 95% CI) | 1.05 [0.06, 17.51] |
| 2 Lost >2 kg (cycle 6) Show forest plot | 1 | 39 | Peto Odds Ratio (Peto, Fixed, 95% CI) | 7.79 [0.15, 393.02] |
| 3 Gained >2 kg (cycle 12) Show forest plot | 1 | 452 | Peto Odds Ratio (Peto, Fixed, 95% CI) | 1.06 [0.63, 1.81] |
| 4 Lost >2 kg (cycle 12) Show forest plot | 1 | 452 | Peto Odds Ratio (Peto, Fixed, 95% CI) | 1.13 [0.63, 2.03] |
| 5 Gained >2 kg (cycle 13) Show forest plot | 1 | 40 | Peto Odds Ratio (Peto, Fixed, 95% CI) | 0.71 [0.14, 3.57] |
| 6 Lost >2 kg (cycle 13) Show forest plot | 1 | 40 | Peto Odds Ratio (Peto, Fixed, 95% CI) | 0.14 [0.00, 6.82] |
| Outcome or subgroup title | No. of studies | No. of participants | Statistical method | Effect size |
| 1 Mean body mass percentage change (cycle 6) Show forest plot | 1 | 43 | Mean Difference (IV, Fixed, 95% CI) | 0.7 [‐1.32, 2.72] |
| 2 Mean weight change in kg (cycle 6) Show forest plot | 1 | 805 | Mean Difference (IV, Fixed, 95% CI) | 0.20 [0.00, 0.40] |
| 3 Mean weight change in kg (cycle 12) Show forest plot | 2 | 462 | Mean Difference (IV, Fixed, 95% CI) | 0.01 [‐0.50, 0.51] |
| Outcome or subgroup title | No. of studies | No. of participants | Statistical method | Effect size |
| 1 Gained >2 kg (cycle 6) Show forest plot | 3 | 1524 | Peto Odds Ratio (Peto, Fixed, 95% CI) | 1.18 [0.87, 1.60] |
| 2 Lost >2 kg ( cycle 6) Show forest plot | 2 | 1172 | Peto Odds Ratio (Peto, Fixed, 95% CI) | 1.34 [0.90, 2.00] |
| 3 Mean body mass percentage change (cycle 6) Show forest plot | 1 | 46 | Mean Difference (IV, Fixed, 95% CI) | 0.8 [‐1.18, 2.78] |
| Outcome or subgroup title | No. of studies | No. of participants | Statistical method | Effect size |
| 1 Gained >2 kg (cycle 6) Show forest plot | 1 | 357 | Peto Odds Ratio (Peto, Fixed, 95% CI) | 1.54 [0.92, 2.60] |
| 2 Mean body mass percentage change (cycle 6) Show forest plot | 1 | 43 | Mean Difference (IV, Fixed, 95% CI) | 1.3 [‐1.03, 3.63] |
| Outcome or subgroup title | No. of studies | No. of participants | Statistical method | Effect size |
| 1 Mean weight change in kg (cycle 12) Show forest plot | 1 | 30 | Mean Difference (IV, Fixed, 95% CI) | 1.25 [‐1.22, 3.72] |
| Outcome or subgroup title | No. of studies | No. of participants | Statistical method | Effect size |
| 1 Mean weight change in kg (cycle 12) Show forest plot | 1 | 47 | Mean Difference (IV, Fixed, 95% CI) | ‐0.25 [‐1.09, 0.59] |
| Outcome or subgroup title | No. of studies | No. of participants | Statistical method | Effect size |
| 1 Mean weight change in kg (cycle 3) Show forest plot | 1 | 58 | Mean Difference (IV, Fixed, 95% CI) | 0.0 [‐1.23, 1.23] |
| Outcome or subgroup title | No. of studies | No. of participants | Statistical method | Effect size |
| 1 Gained >2 kg (cycle 6) Show forest plot | 1 | 418 | Peto Odds Ratio (Peto, Fixed, 95% CI) | 1.26 [0.74, 2.15] |
| 2 Lost >2 kg (cycle 6) Show forest plot | 1 | 418 | Peto Odds Ratio (Peto, Fixed, 95% CI) | 1.31 [0.70, 2.44] |
| Outcome or subgroup title | No. of studies | No. of participants | Statistical method | Effect size |
| 1 Gained >2.5 kg (cycle 24) Show forest plot | 1 | 17 | Peto Odds Ratio (Peto, Fixed, 95% CI) | 8.66 [0.77, 97.74] |
| 2 Lost >2.5 kg (cycle 24) Show forest plot | 1 | 17 | Peto Odds Ratio (Peto, Fixed, 95% CI) | 1.88 [0.17, 21.18] |
| Outcome or subgroup title | No. of studies | No. of participants | Statistical method | Effect size |
| 1 Mean weight change in kg (cycle 6) Show forest plot | 1 | 369 | Mean Difference (IV, Fixed, 95% CI) | 0.7 [0.14, 1.26] |
| Outcome or subgroup title | No. of studies | No. of participants | Statistical method | Effect size |
| 1 Gained >2.7 kg (cycle 6) Show forest plot | 1 | 109 | Peto Odds Ratio (Peto, Fixed, 95% CI) | 1.92 [0.74, 4.96] |
| Outcome or subgroup title | No. of studies | No. of participants | Statistical method | Effect size |
| 1 Mean weight change in kg (cycle 6) Show forest plot | 1 | 314 | Mean Difference (IV, Fixed, 95% CI) | ‐0.02 [‐0.06, 0.03] |
| Outcome or subgroup title | No. of studies | No. of participants | Statistical method | Effect size |
| 1 Mean BMI change (cycle 6) Show forest plot | 1 | 57 | Mean Difference (IV, Fixed, 95% CI) | 0.35 [‐0.13, 0.83] |
| 2 Mean weight change in kg (cycle 6) Show forest plot | 1 | 31 | Mean Difference (IV, Fixed, 95% CI) | 1.30 [‐0.32, 2.92] |
| Outcome or subgroup title | No. of studies | No. of participants | Statistical method | Effect size |
| 1 Mean weight change in kg (cycle 3) Show forest plot | 1 | 33 | Mean Difference (IV, Fixed, 95% CI) | 0.78 [‐0.28, 1.84] |
| Outcome or subgroup title | No. of studies | No. of participants | Statistical method | Effect size |
| 1 Mean weight change in kg (cycle 3) Show forest plot | 1 | 21 | Mean Difference (IV, Fixed, 95% CI) | 0.92 [‐1.25, 3.09] |
| Outcome or subgroup title | No. of studies | No. of participants | Statistical method | Effect size |
| 1 Mean weight change in kg (cycle 3) Show forest plot | 1 | 28 | Mean Difference (IV, Fixed, 95% CI) | 0.09 [‐1.15, 1.33] |
| Outcome or subgroup title | No. of studies | No. of participants | Statistical method | Effect size |
| 1 Gained >2.5 kg (cycle 12) Show forest plot | 1 | 228 | Peto Odds Ratio (Peto, Fixed, 95% CI) | 1.75 [0.98, 3.11] |
| 2 Lost >2.5 kg (cycle 12) Show forest plot | 1 | 228 | Peto Odds Ratio (Peto, Fixed, 95% CI) | 0.66 [0.25, 1.77] |
| Outcome or subgroup title | No. of studies | No. of participants | Statistical method | Effect size |
| 1 Mean weight change in kg (cycle 6) Show forest plot | 1 | 144 | Mean Difference (IV, Fixed, 95% CI) | 0.10 [‐0.70, 0.90] |
| Outcome or subgroup title | No. of studies | No. of participants | Statistical method | Effect size |
| 1 Gained >2 kg (cycle 6) Show forest plot | 1 | 349 | Peto Odds Ratio (Peto, Fixed, 95% CI) | 1.15 [0.65, 2.06] |
| 2 Mean body mass percentage change (cycle 6) Show forest plot | 1 | 45 | Mean Difference (IV, Fixed, 95% CI) | ‐0.5 [‐2.51, 1.51] |
| Outcome or subgroup title | No. of studies | No. of participants | Statistical method | Effect size |
| 1 Gained >2 kg (cycle 6) Show forest plot | 1 | 292 | Peto Odds Ratio (Peto, Fixed, 95% CI) | 1.09 [0.60, 1.99] |
| 2 Lost >2 kg (cycle 6) Show forest plot | 1 | 292 | Peto Odds Ratio (Peto, Fixed, 95% CI) | 1.69 [0.89, 3.20] |
| Outcome or subgroup title | No. of studies | No. of participants | Statistical method | Effect size |
| 1 Mean weight change in kg (cycle 6) Show forest plot | 1 | 5328 | Mean Difference (IV, Fixed, 95% CI) | 0.26 [0.12, 0.40] |
| Outcome or subgroup title | No. of studies | No. of participants | Statistical method | Effect size |
| 1 Weight gain >=5% (cycle 6) Show forest plot | 1 | 2157 | Peto Odds Ratio (Peto, Fixed, 95% CI) | 1.15 [0.91, 1.45] |
| 2 Weight gain >=5% (cycle 13) Show forest plot | 1 | 453 | Peto Odds Ratio (Peto, Fixed, 95% CI) | 1.09 [0.69, 1.74] |
| 3 Weight loss >=5% (cycle 6) Show forest plot | 1 | 2157 | Peto Odds Ratio (Peto, Fixed, 95% CI) | 0.99 [0.72, 1.37] |
| 4 Weight loss >=5% (cycle 13) Show forest plot | 1 | 453 | Peto Odds Ratio (Peto, Fixed, 95% CI) | 1.32 [0.74, 2.34] |
| Outcome or subgroup title | No. of studies | No. of participants | Statistical method | Effect size |
| 1 Mean weight change in kg (cycle 12) Show forest plot | 1 | 43 | Mean Difference (IV, Fixed, 95% CI) | 1.8 [‐0.73, 4.33] |
| Outcome or subgroup title | No. of studies | No. of participants | Statistical method | Effect size |
| 1 Mean weight change in kg (cycle 12) Show forest plot | 1 | 3029 | Mean Difference (IV, Fixed, 95% CI) | 0.13 [‐0.04, 0.30] |
| Outcome or subgroup title | No. of studies | No. of participants | Statistical method | Effect size |
| 1 Gain >2 kg (cycle 4) Show forest plot | 1 | 51 | Peto Odds Ratio (Peto, Fixed, 95% CI) | 0.69 [0.13, 3.58] |
| 2 Lost >2 kg (cycle 4) Show forest plot | 1 | 51 | Peto Odds Ratio (Peto, Fixed, 95% CI) | 1.69 [0.35, 8.07] |
| Outcome or subgroup title | No. of studies | No. of participants | Statistical method | Effect size |
| 1 Gain >=7% body weight (cycle 13) Show forest plot | 1 | 1030 | Peto Odds Ratio (Peto, Fixed, 95% CI) | 0.84 [0.55, 1.28] |
| 2 Lost >=7% body weight (cycle 13) Show forest plot | 1 | 1030 | Peto Odds Ratio (Peto, Fixed, 95% CI) | 1.39 [0.83, 2.32] |
| Outcome or subgroup title | No. of studies | No. of participants | Statistical method | Effect size |
| 1 Mean weight change in kg (cycle 13 or last assessment) Show forest plot | 1 | 937 | Mean Difference (IV, Fixed, 95% CI) | 0.4 [0.03, 0.77] |