| 1 Mortality until discharge Show forest plot | 12 | | Risk Ratio (M‐H, Fixed, 95% CI) | Subtotals only |
|
| 1.1 All infants in all studies | 12 | 2028 | Risk Ratio (M‐H, Fixed, 95% CI) | 0.97 [0.83, 1.14] |
| 1.2 Birth weight > 1000 grams | 1 | 97 | Risk Ratio (M‐H, Fixed, 95% CI) | 0.95 [0.34, 2.62] |
| 1.3 Enteral | 3 | 445 | Risk Ratio (M‐H, Fixed, 95% CI) | 0.92 [0.63, 1.35] |
| 1.4 Enteral hypertonic formulation, at pharmacologic doses | 1 | 149 | Risk Ratio (M‐H, Fixed, 95% CI) | 0.95 [0.62, 1.46] |
| 1.5 Parenteral with or without enteral | 9 | 1583 | Risk Ratio (M‐H, Fixed, 95% CI) | 0.98 [0.83, 1.17] |
| 1.6 Parenteral with hypertonic enteral formulation at pharmacologic dose | 5 | 1247 | Risk Ratio (M‐H, Fixed, 95% CI) | 0.99 [0.82, 1.20] |
| 1.7 Intravenous (with or without other routes of administration) | 2 | 832 | Risk Ratio (M‐H, Fixed, 95% CI) | 1.04 [0.82, 1.32] |
| 1.8 Excluding intravenous vitamin E administration | 10 | 1196 | Risk Ratio (M‐H, Fixed, 95% CI) | 0.92 [0.75, 1.14] |
| 1.9 Total dose of vitamin E in the treatment group <= 30 IU/kg/day | 5 | 575 | Risk Ratio (M‐H, Fixed, 95% CI) | 0.89 [0.60, 1.34] |
| 1.10 Total dose of vitamin E in the treatment group > 30 IU/kg/day | 6 | 1396 | Risk Ratio (M‐H, Fixed, 95% CI) | 0.99 [0.83, 1.17] |
| 1.11 Serum tocopherol level in the treatment group <= 3.5 mg/dl | 7 | 1157 | Risk Ratio (M‐H, Fixed, 95% CI) | 0.95 [0.75, 1.19] |
| 1.12 Serum tocopherol level in the treatment group >3.5 mg/dl | 5 | 871 | Risk Ratio (M‐H, Fixed, 95% CI) | 1.00 [0.80, 1.24] |
| 1.13 Onset of vitamin E supplementation in the treatment group within 48 hours of life | 11 | 1998 | Risk Ratio (M‐H, Fixed, 95% CI) | 0.97 [0.83, 1.14] |
| 1.14 Onset of treatment after 48 hours of life | 1 | 30 | Risk Ratio (M‐H, Fixed, 95% CI) | 0.0 [0.0, 0.0] |
| 1.15 Duration of treatment <= 1 week (7 days) | 4 | 475 | Risk Ratio (M‐H, Fixed, 95% CI) | 0.81 [0.56, 1.18] |
| 1.16 Duration of treatment > 1 week | 7 | 1008 | Risk Ratio (M‐H, Fixed, 95% CI) | 1.02 [0.82, 1.28] |
| 1.17 Total dose of vitamin E in the control group <= 10 mg vit E/100 kcal | 9 | 1613 | Risk Ratio (M‐H, Fixed, 95% CI) | 0.99 [0.82, 1.19] |
| 1.18 Total dose of vitamin E in the control group > 10 mg vit E/100 kcal | 3 | 415 | Risk Ratio (M‐H, Fixed, 95% CI) | 0.92 [0.68, 1.24] |
| 1.19 Iron supplementation > 2 mg/kg/day in both groups | 1 | 30 | Risk Ratio (M‐H, Fixed, 95% CI) | 0.0 [0.0, 0.0] |
| 1.20 Iron supplementation > 2 mg/kg/day in neither group | 1 | 266 | Risk Ratio (M‐H, Fixed, 95% CI) | 0.86 [0.40, 1.85] |
| 1.21 PUFA >= 400 mg/100 ml milk | 1 | 266 | Risk Ratio (M‐H, Fixed, 95% CI) | 0.86 [0.40, 1.85] |
| 2 Mortality until discharge among very low birth weight infants Show forest plot | 8 | | Risk Ratio (M‐H, Fixed, 95% CI) | Subtotals only |
|
| 2.1 All infants in all studies | 7 | 1334 | Risk Ratio (M‐H, Fixed, 95% CI) | 0.97 [0.80, 1.16] |
| 2.2 Birth weight <= 1500 grams | 6 | 1187 | Risk Ratio (M‐H, Fixed, 95% CI) | 0.93 [0.75, 1.15] |
| 2.3 Birth weight > 1000 grams | 2 | 496 | Risk Ratio (M‐H, Fixed, 95% CI) | 1.11 [0.74, 1.67] |
| 2.4 Birth weight <= 1000 grams | 4 | 449 | Risk Ratio (M‐H, Fixed, 95% CI) | 0.95 [0.77, 1.17] |
| 2.5 Enteral | 3 | 445 | Risk Ratio (M‐H, Fixed, 95% CI) | 0.92 [0.63, 1.35] |
| 2.6 Enteral hypertonic formulation, at pharmacologic doses | 1 | 149 | Risk Ratio (M‐H, Fixed, 95% CI) | 0.95 [0.62, 1.46] |
| 2.7 Parenteral with or without enteral | 4 | 889 | Risk Ratio (M‐H, Fixed, 95% CI) | 0.98 [0.79, 1.21] |
| 2.8 Parenteral with hypertonic enteral formulation at pharmacologic dose | 1 | 168 | Risk Ratio (M‐H, Fixed, 95% CI) | 0.69 [0.38, 1.24] |
| 2.9 Intravenous (with or without other routes of administration) | 1 | 545 | Risk Ratio (M‐H, Fixed, 95% CI) | 1.00 [0.75, 1.34] |
| 2.10 Excluding intravenous vitamin E supplementation | 6 | 789 | Risk Ratio (M‐H, Fixed, 95% CI) | 0.94 [0.73, 1.19] |
| 2.11 Total dose of vitamin E in the treatment group <= 30 IU/kg/day | 2 | 268 | Risk Ratio (M‐H, Fixed, 95% CI) | 0.86 [0.40, 1.85] |
| 2.12 Total dose of vitamin E in the treatment group > 30 IU/kg/day | 4 | 1009 | Risk Ratio (M‐H, Fixed, 95% CI) | 0.97 [0.80, 1.18] |
| 2.13 Serum tocopherol level in the treatment group <= 3.5 mg/dl | 5 | 642 | Risk Ratio (M‐H, Fixed, 95% CI) | 0.85 [0.63, 1.17] |
| 2.14 Serum tocopherol level in the treatment group >3.5 mg/dl | 2 | 692 | Risk Ratio (M‐H, Fixed, 95% CI) | 1.04 [0.82, 1.31] |
| 2.15 Onset of vitamin E supplementation in the treatment group within 48 hours of life | 6 | 1304 | Risk Ratio (M‐H, Fixed, 95% CI) | 0.97 [0.80, 1.16] |
| 2.16 Onset of treatment after 48 hours of life | 1 | 30 | Risk Ratio (M‐H, Fixed, 95% CI) | 0.0 [0.0, 0.0] |
| 2.17 Duration of treatment <= 1 week (7 days) | 1 | 168 | Risk Ratio (M‐H, Fixed, 95% CI) | 0.69 [0.38, 1.24] |
| 2.18 Duration of treatment > 1 week | 6 | 1166 | Risk Ratio (M‐H, Fixed, 95% CI) | 1.01 [0.83, 1.23] |
| 2.19 Total dose of vitamin E in the control group <= 10 mg vit E/100 kcal | 5 | 1019 | Risk Ratio (M‐H, Fixed, 95% CI) | 0.98 [0.78, 1.23] |
| 2.20 Total dose of vitamin E in the control group > 10 mg vit E/100 kcal | 2 | 315 | Risk Ratio (M‐H, Fixed, 95% CI) | 0.93 [0.67, 1.29] |
| 2.21 Iron supplementation > 2 mg/kg/day in both groups | 1 | 30 | Risk Ratio (M‐H, Fixed, 95% CI) | 0.0 [0.0, 0.0] |
| 2.22 Iron supplementation > 2 mg/kg/day in neither group | 1 | 266 | Risk Ratio (M‐H, Fixed, 95% CI) | 0.86 [0.40, 1.85] |
| 2.23 PUFA >= 400 mg/100 ml milk | 1 | 266 | Risk Ratio (M‐H, Fixed, 95% CI) | 0.86 [0.40, 1.85] |
| 3 Bronchopulmonary dysplasia Show forest plot | 7 | | Risk Ratio (M‐H, Fixed, 95% CI) | Subtotals only |
|
| 3.1 All infants in all studies | 6 | 1127 | Risk Ratio (M‐H, Fixed, 95% CI) | 0.91 [0.73, 1.14] |
| 3.2 Enteral | 1 | 266 | Risk Ratio (M‐H, Fixed, 95% CI) | 0.83 [0.50, 1.38] |
| 3.3 Parenteral with or without enteral | 6 | 912 | Risk Ratio (M‐H, Fixed, 95% CI) | 0.96 [0.75, 1.23] |
| 3.4 Parenteral with hypertonic enteral formulation at pharmacologic dose | 3 | 771 | Risk Ratio (M‐H, Fixed, 95% CI) | 0.93 [0.73, 1.20] |
| 3.5 Intravenous (with or without other routes of administration) | 1 | 545 | Risk Ratio (M‐H, Fixed, 95% CI) | 0.91 [0.68, 1.21] |
| 3.6 Excluding intravenous vitamin E administration | 5 | 582 | Risk Ratio (M‐H, Fixed, 95% CI) | 0.92 [0.64, 1.31] |
| 3.7 Total dose of vitamin E in the treatment group <= 30 IU/kg/day | 4 | 498 | Risk Ratio (M‐H, Fixed, 95% CI) | 0.93 [0.63, 1.38] |
| 3.8 Total dose of vitamin E in the treatment group > 30 IU/kg/day | 3 | 680 | Risk Ratio (M‐H, Fixed, 95% CI) | 0.93 [0.71, 1.22] |
| 3.9 Serum tocopherol level in the treatment group <= 3.5 mg/dl | 3 | 352 | Risk Ratio (M‐H, Fixed, 95% CI) | 0.91 [0.56, 1.50] |
| 3.10 Serum tocopherol level in the treatment group > 3.5 mg/dl | 4 | 826 | Risk Ratio (M‐H, Fixed, 95% CI) | 0.93 [0.73, 1.20] |
| 3.11 Onset of treatment within 48 hours of life | 7 | 1178 | Risk Ratio (M‐H, Fixed, 95% CI) | 0.93 [0.74, 1.16] |
| 3.12 Duration of treatment <= 1 week | 3 | 141 | Risk Ratio (M‐H, Fixed, 95% CI) | 6.04 [0.30, 119.88] |
| 3.13 Duration of treatment > 1 week | 3 | 492 | Risk Ratio (M‐H, Fixed, 95% CI) | 0.92 [0.64, 1.31] |
| 3.14 Total dose of vitamin E in the control group <= 10 mg vit E/100 kcal | 6 | 1078 | Risk Ratio (M‐H, Fixed, 95% CI) | 0.91 [0.72, 1.16] |
| 3.15 Total dose of vitamin E in the control group > 10 mg vit E/100 kcal | 1 | 100 | Risk Ratio (M‐H, Fixed, 95% CI) | 1.13 [0.49, 2.60] |
| 3.16 Iron supplementation >2 mg/kg/day in both groups | 1 | 10 | Risk Ratio (M‐H, Fixed, 95% CI) | 0.0 [0.0, 0.0] |
| 3.17 Iron supplementation > 2 mg/kg/day in neither group | 2 | 291 | Risk Ratio (M‐H, Fixed, 95% CI) | 0.83 [0.50, 1.38] |
| 3.18 PUFA >= 400 mg/100 ml milk | 1 | 266 | Risk Ratio (M‐H, Fixed, 95% CI) | 0.83 [0.50, 1.38] |
| 3.19 Vitamin A supplementation in both groups >= 1500 IU/day | 1 | 35 | Risk Ratio (M‐H, Fixed, 95% CI) | 0.0 [0.0, 0.0] |
| 4 Bronchopulmonary dysplasia among very low birth weight infants Show forest plot | 4 | | Risk Ratio (M‐H, Fixed, 95% CI) | Subtotals only |
|
| 4.1 All infants in all studies | 4 | 972 | Risk Ratio (M‐H, Fixed, 95% CI) | 0.89 [0.71, 1.13] |
| 4.2 Enteral | 1 | 266 | Risk Ratio (M‐H, Fixed, 95% CI) | 0.83 [0.50, 1.38] |
| 4.3 Parenteral with or without enteral | 3 | 706 | Risk Ratio (M‐H, Fixed, 95% CI) | 0.92 [0.70, 1.19] |
| 4.4 Parenteral with hypertonic enteral formulation at pharmacologic dose | 1 | 545 | Risk Ratio (M‐H, Fixed, 95% CI) | 0.91 [0.68, 1.21] |
| 4.5 Intravenous (with or without other routes of administration) | 1 | 545 | Risk Ratio (M‐H, Fixed, 95% CI) | 0.91 [0.68, 1.21] |
| 4.6 Excluding intravenous | 3 | 427 | Risk Ratio (M‐H, Fixed, 95% CI) | 0.88 [0.59, 1.30] |
| 4.7 Total dose of vitamin E <= 30 IU/kg/day | 2 | 392 | Risk Ratio (M‐H, Fixed, 95% CI) | 0.88 [0.59, 1.30] |
| 4.8 Total dose of vitamin E > 30 IU/kg/day | 2 | 580 | Risk Ratio (M‐H, Fixed, 95% CI) | 0.91 [0.68, 1.21] |
| 4.9 Serum tocopherol level in the treatment group <= 3.5 mg/dl | 2 | 301 | Risk Ratio (M‐H, Fixed, 95% CI) | 0.83 [0.50, 1.38] |
| 4.10 Serum tocopherol level in the treatment group > 3.5 mg/dl | 2 | 671 | Risk Ratio (M‐H, Fixed, 95% CI) | 0.92 [0.70, 1.19] |
| 4.11 Onset of vitamin E supplementation in the treatment group within 48 hours of life | 4 | 972 | Risk Ratio (M‐H, Fixed, 95% CI) | 0.89 [0.71, 1.13] |
| 4.12 Duration of treatment <= 1 week | 1 | 35 | Risk Ratio (M‐H, Fixed, 95% CI) | 0.0 [0.0, 0.0] |
| 4.13 Duration of treatment > 1 week | 2 | 392 | Risk Ratio (M‐H, Fixed, 95% CI) | 0.88 [0.59, 1.30] |
| 4.14 Total dose of vitamin E in the control group <= 10 mg vit E/100 kcal | 4 | 972 | Risk Ratio (M‐H, Fixed, 95% CI) | 0.89 [0.71, 1.13] |
| 4.15 Iron supplementation >2 mg/kg/day in both groups | 1 | 10 | Risk Ratio (M‐H, Fixed, 95% CI) | 0.0 [0.0, 0.0] |
| 4.16 Iron supplementation > 2 mg/kg/day in neither group | 2 | 291 | Risk Ratio (M‐H, Fixed, 95% CI) | 0.83 [0.50, 1.38] |
| 4.17 PUFA >= 400 mg/100 ml mik | 1 | 266 | Risk Ratio (M‐H, Fixed, 95% CI) | 0.83 [0.50, 1.38] |
| 4.18 Vitamin A supplementation in both groups >= 1500 IU/day | 1 | 35 | Risk Ratio (M‐H, Fixed, 95% CI) | 0.0 [0.0, 0.0] |
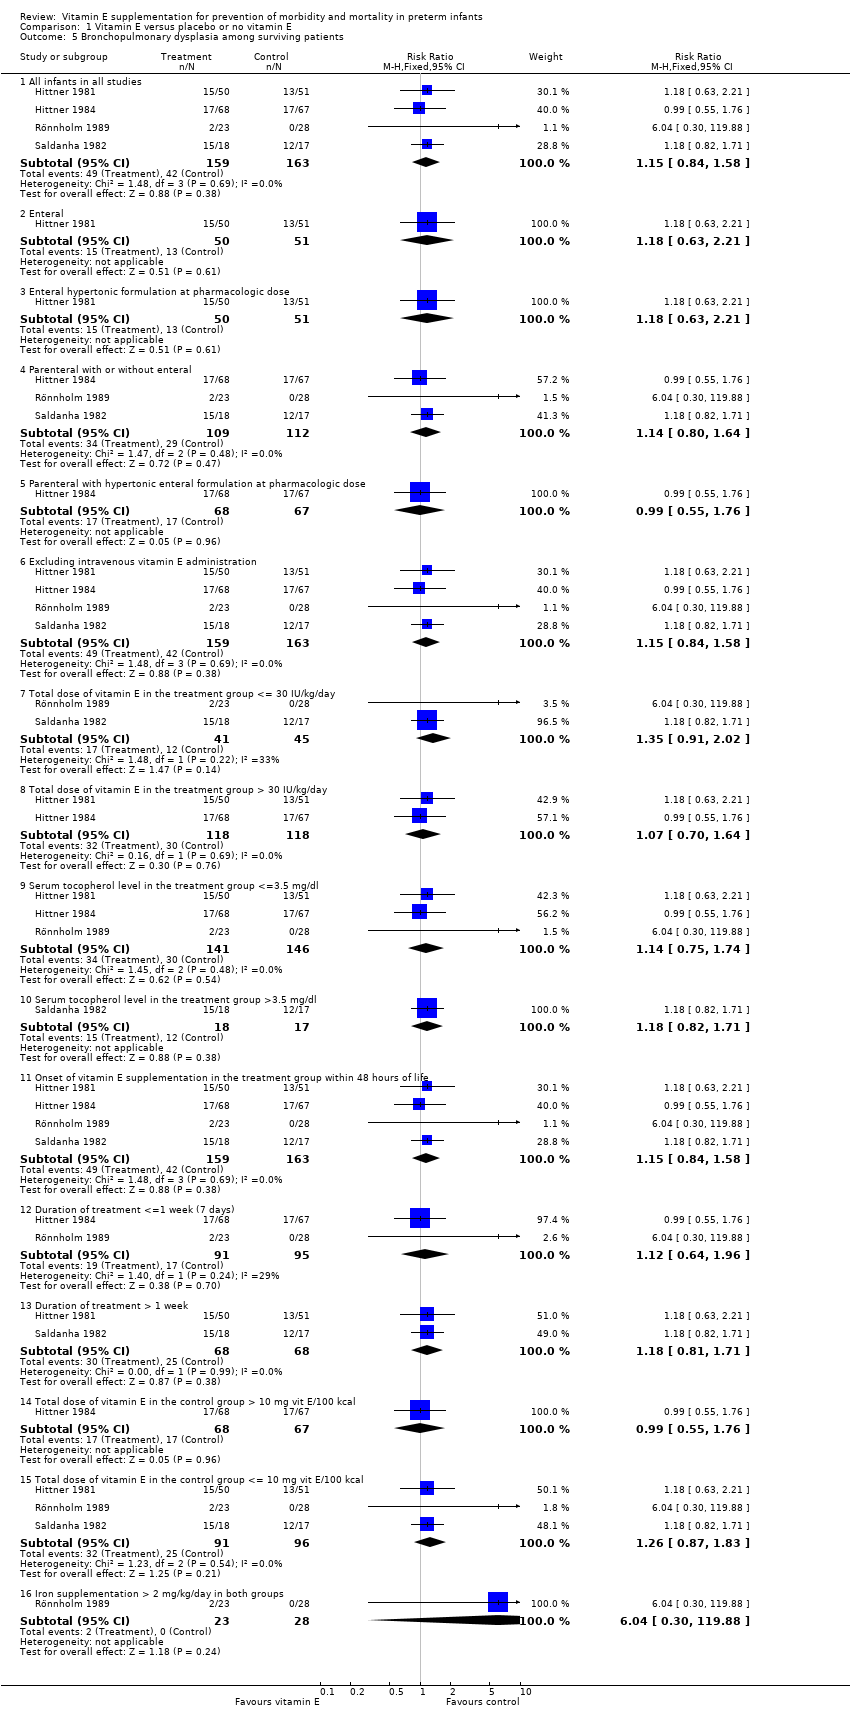
| 5 Bronchopulmonary dysplasia among surviving patients Show forest plot | 4 | | Risk Ratio (M‐H, Fixed, 95% CI) | Subtotals only |
|
| 5.1 All infants in all studies | 4 | 322 | Risk Ratio (M‐H, Fixed, 95% CI) | 1.15 [0.84, 1.58] |
| 5.2 Enteral | 1 | 101 | Risk Ratio (M‐H, Fixed, 95% CI) | 1.18 [0.63, 2.21] |
| 5.3 Enteral hypertonic formulation at pharmacologic dose | 1 | 101 | Risk Ratio (M‐H, Fixed, 95% CI) | 1.18 [0.63, 2.21] |
| 5.4 Parenteral with or without enteral | 3 | 221 | Risk Ratio (M‐H, Fixed, 95% CI) | 1.14 [0.80, 1.64] |
| 5.5 Parenteral with hypertonic enteral formulation at pharmacologic dose | 1 | 135 | Risk Ratio (M‐H, Fixed, 95% CI) | 0.99 [0.55, 1.76] |
| 5.6 Excluding intravenous vitamin E administration | 4 | 322 | Risk Ratio (M‐H, Fixed, 95% CI) | 1.15 [0.84, 1.58] |
| 5.7 Total dose of vitamin E in the treatment group <= 30 IU/kg/day | 2 | 86 | Risk Ratio (M‐H, Fixed, 95% CI) | 1.35 [0.91, 2.02] |
| 5.8 Total dose of vitamin E in the treatment group > 30 IU/kg/day | 2 | 236 | Risk Ratio (M‐H, Fixed, 95% CI) | 1.07 [0.70, 1.64] |
| 5.9 Serum tocopherol level in the treatment group <=3.5 mg/dl | 3 | 287 | Risk Ratio (M‐H, Fixed, 95% CI) | 1.14 [0.75, 1.74] |
| 5.10 Serum tocopherol level in the treatment group >3.5 mg/dl | 1 | 35 | Risk Ratio (M‐H, Fixed, 95% CI) | 1.18 [0.82, 1.71] |
| 5.11 Onset of vitamin E supplementation in the treatment group within 48 hours of life | 4 | 322 | Risk Ratio (M‐H, Fixed, 95% CI) | 1.15 [0.84, 1.58] |
| 5.12 Duration of treatment <=1 week (7 days) | 2 | 186 | Risk Ratio (M‐H, Fixed, 95% CI) | 1.12 [0.64, 1.96] |
| 5.13 Duration of treatment > 1 week | 2 | 136 | Risk Ratio (M‐H, Fixed, 95% CI) | 1.18 [0.81, 1.71] |
| 5.14 Total dose of vitamin E in the control group > 10 mg vit E/100 kcal | 1 | 135 | Risk Ratio (M‐H, Fixed, 95% CI) | 0.99 [0.55, 1.76] |
| 5.15 Total dose of vitamin E in the control group <= 10 mg vit E/100 kcal | 3 | 187 | Risk Ratio (M‐H, Fixed, 95% CI) | 1.26 [0.87, 1.83] |
| 5.16 Iron supplementation > 2 mg/kg/day in both groups | 1 | 51 | Risk Ratio (M‐H, Fixed, 95% CI) | 6.04 [0.30, 119.88] |
| 6 Bronchopulmonary dysplasia among surviving very low birth weight infants Show forest plot | 2 | | Risk Ratio (M‐H, Fixed, 95% CI) | Subtotals only |
|
| 6.1 All infants in all studies | 2 | 236 | Risk Ratio (M‐H, Fixed, 95% CI) | 1.07 [0.70, 1.64] |
| 6.2 Enteral | 1 | 101 | Risk Ratio (M‐H, Fixed, 95% CI) | 1.18 [0.63, 2.21] |
| 6.3 Enteral hypertonic formulation at pharmacologic dose | 1 | 101 | Risk Ratio (M‐H, Fixed, 95% CI) | 1.18 [0.63, 2.21] |
| 6.4 Parenteral with or without enteral | 1 | 135 | Risk Ratio (M‐H, Fixed, 95% CI) | 0.99 [0.55, 1.76] |
| 6.5 Parenteral with hypertonic enteral formulation at pharmacologic dose | 1 | 135 | Risk Ratio (M‐H, Fixed, 95% CI) | 0.99 [0.55, 1.76] |
| 6.6 Excluding intravenous vitamin E administration | 2 | 236 | Risk Ratio (M‐H, Fixed, 95% CI) | 1.07 [0.70, 1.64] |
| 6.7 Total dose of vitamin E in the treatment group > 30 IU/kg/day | 2 | 236 | Risk Ratio (M‐H, Fixed, 95% CI) | 1.07 [0.70, 1.64] |
| 6.8 Serum tocopherol level in the treatment group <=3.5 mg/dl | 2 | 236 | Risk Ratio (M‐H, Fixed, 95% CI) | 1.07 [0.70, 1.64] |
| 6.9 Onset of vitamin E supplementation in the treatment group within 48 hours of life | 2 | 236 | Risk Ratio (M‐H, Fixed, 95% CI) | 1.07 [0.70, 1.64] |
| 6.10 Duration of treatment <=1 week (7 days) | 1 | 135 | Risk Ratio (M‐H, Fixed, 95% CI) | 0.99 [0.55, 1.76] |
| 6.11 Duration of treatment > 1 week | 1 | 101 | Risk Ratio (M‐H, Fixed, 95% CI) | 1.18 [0.63, 2.21] |
| 6.12 Total dose of vitamin E in the control group > 10 mg vit E/100 kcal | 1 | 135 | Risk Ratio (M‐H, Fixed, 95% CI) | 0.99 [0.55, 1.76] |
| 6.13 Total dose of vitamin E in the control group <= 10 mg vit E/100 kcal | 1 | 101 | Risk Ratio (M‐H, Fixed, 95% CI) | 1.18 [0.63, 2.21] |
| 7 Radiographic signs of bronchopulmonary dysplasia persistent at 6 weeks ‐ 2 months Show forest plot | 3 | | Risk Ratio (M‐H, Fixed, 95% CI) | Subtotals only |
|
| 7.1 All infants in all studies | 3 | 364 | Risk Ratio (M‐H, Fixed, 95% CI) | 0.99 [0.67, 1.46] |
| 7.2 Enteral | 1 | 138 | Risk Ratio (M‐H, Fixed, 95% CI) | 0.94 [0.51, 1.72] |
| 7.3 Parenteral with or without enteral | 2 | 226 | Risk Ratio (M‐H, Fixed, 95% CI) | 1.02 [0.62, 1.70] |
| 7.4 Parenteral with hypertonic enteral formulation at pharmacologic dose | 2 | 226 | Risk Ratio (M‐H, Fixed, 95% CI) | 1.02 [0.62, 1.70] |
| 7.5 Excluding intravenous vitamin E administration | 3 | 364 | Risk Ratio (M‐H, Fixed, 95% CI) | 0.99 [0.67, 1.46] |
| 7.6 Total dose of vitamin E in the treatment group <= 30 IU/kg/day | 2 | 264 | Risk Ratio (M‐H, Fixed, 95% CI) | 0.95 [0.61, 1.47] |
| 7.7 Total dose of vitamin E in the treatment group > 30 IU/kg/day | 1 | 100 | Risk Ratio (M‐H, Fixed, 95% CI) | 1.13 [0.49, 2.60] |
| 7.8 Serum tocopherol level in the treatment group <=3.5 mg/dl | 1 | 138 | Risk Ratio (M‐H, Fixed, 95% CI) | 0.94 [0.51, 1.72] |
| 7.9 Serum tocopherol level in the treatment group >3.5 mg/dl | 2 | 226 | Risk Ratio (M‐H, Fixed, 95% CI) | 1.02 [0.62, 1.70] |
| 7.10 Onset of vitamin E supplementation in the treatment group within 48 hours of life | 3 | 364 | Risk Ratio (M‐H, Fixed, 95% CI) | 0.99 [0.67, 1.46] |
| 7.11 Duration of treatment > 1 week | 3 | 364 | Risk Ratio (M‐H, Fixed, 95% CI) | 0.99 [0.67, 1.46] |
| 7.12 Total dose of vitamin E in the control group <= 10 mg vit E/100 kcal | 2 | 264 | Risk Ratio (M‐H, Fixed, 95% CI) | 0.95 [0.61, 1.47] |
| 7.13 Total dose of vitamin E in the control group > 10 mg vit E/100 kcal | 1 | 100 | Risk Ratio (M‐H, Fixed, 95% CI) | 1.13 [0.49, 2.60] |
| 7.14 Iron supplementation >2 mg/kg/day in neither group | 1 | 138 | Risk Ratio (M‐H, Fixed, 95% CI) | 0.94 [0.51, 1.72] |
| 7.15 PUFA >= 400 mg/100 ml milk | 1 | 138 | Risk Ratio (M‐H, Fixed, 95% CI) | 0.94 [0.51, 1.72] |
| 8 Radiographic signs of bronchopulmonary dysplasia at 6 weeks ‐ 2 months among very low birth weight infants Show forest plot | 2 | | Risk Ratio (M‐H, Fixed, 95% CI) | Subtotals only |
|
| 8.1 All infants in all studies | 2 | 264 | Risk Ratio (M‐H, Fixed, 95% CI) | 0.95 [0.61, 1.47] |
| 8.2 Birth weight <= 1500 grams | 2 | 264 | Risk Ratio (M‐H, Fixed, 95% CI) | 0.95 [0.61, 1.47] |
| 8.3 Birth weight <= 1000 grams | 1 | 54 | Risk Ratio (M‐H, Fixed, 95% CI) | 1.25 [0.72, 2.17] |
| 8.4 Birth weight > 1000 grams | 1 | 84 | Risk Ratio (M‐H, Fixed, 95% CI) | 0.48 [0.09, 2.46] |
| 8.5 Enteral | 1 | 138 | Risk Ratio (M‐H, Fixed, 95% CI) | 0.94 [0.51, 1.72] |
| 8.6 Parenteral with or without enteral | 1 | 126 | Risk Ratio (M‐H, Fixed, 95% CI) | 0.96 [0.51, 1.83] |
| 8.7 Parenteral with hypertonic enteral formulation at pharmacologic dose | 1 | 126 | Risk Ratio (M‐H, Fixed, 95% CI) | 0.96 [0.51, 1.83] |
| 8.8 Excluding intravenous vitamin E administration | 2 | 264 | Risk Ratio (M‐H, Fixed, 95% CI) | 0.95 [0.61, 1.47] |
| 8.9 Total dose of vitamin E in the treatment group <= 30 IU/kg/day | 2 | 264 | Risk Ratio (M‐H, Fixed, 95% CI) | 0.95 [0.61, 1.47] |
| 8.10 Serum tocopherol level in the treatment group <=3.5 mg/dl | 1 | 138 | Risk Ratio (M‐H, Fixed, 95% CI) | 0.94 [0.51, 1.72] |
| 8.11 Serum tocopherol level in the treatment group >3.5 mg/dl | 1 | 126 | Risk Ratio (M‐H, Fixed, 95% CI) | 0.96 [0.51, 1.83] |
| 8.12 Onset of vitamin E supplementation in the treatment group within 48 hours of life | 2 | 264 | Risk Ratio (M‐H, Fixed, 95% CI) | 0.95 [0.61, 1.47] |
| 8.13 Duration of treatment > 1 week | 2 | 264 | Risk Ratio (M‐H, Fixed, 95% CI) | 0.95 [0.61, 1.47] |
| 8.14 Total dose of vitamin E in the control group <= 10 mg vit E/100 kcal | 2 | 264 | Risk Ratio (M‐H, Fixed, 95% CI) | 0.95 [0.61, 1.47] |
| 8.15 Iron supplementation >2 mg/kg/day in neither group | 1 | 138 | Risk Ratio (M‐H, Fixed, 95% CI) | 0.94 [0.51, 1.72] |
| 8.16 PUFA >= 400 mg/100 ml milk | 1 | 138 | Risk Ratio (M‐H, Fixed, 95% CI) | 0.94 [0.51, 1.72] |
| 9 Patent ductus arteriosus Show forest plot | 6 | | Risk Ratio (M‐H, Fixed, 95% CI) | Subtotals only |
|
| 9.1 All infants in all studies | 6 | 976 | Risk Ratio (M‐H, Fixed, 95% CI) | 1.07 [0.93, 1.23] |
| 9.2 Parenteral with or without enteral | 6 | 976 | Risk Ratio (M‐H, Fixed, 95% CI) | 1.07 [0.93, 1.23] |
| 9.3 Parenteral with hypertonic enteral formulation at pharmacologic dose | 4 | 918 | Risk Ratio (M‐H, Fixed, 95% CI) | 1.08 [0.93, 1.25] |
| 9.4 Intravenous (with or without other routes of administration) | 1 | 545 | Risk Ratio (M‐H, Fixed, 95% CI) | 1.09 [0.91, 1.31] |
| 9.5 Excluding intravenous vitamin E administration | 5 | 431 | Risk Ratio (M‐H, Fixed, 95% CI) | 1.03 [0.83, 1.28] |
| 9.6 Total dose of vitamin E in the treatment group <= 30 IU/kg/day | 3 | 184 | Risk Ratio (M‐H, Fixed, 95% CI) | 1.02 [0.75, 1.38] |
| 9.7 Total dose of vitamin E in the treatment group > 30 IU/kg/day | 3 | 792 | Risk Ratio (M‐H, Fixed, 95% CI) | 1.08 [0.93, 1.26] |
| 9.8 Serum tocopherol level in the treatment group <=3.5 mg/dl | 2 | 58 | Risk Ratio (M‐H, Fixed, 95% CI) | 1.00 [0.69, 1.45] |
| 9.9 Serum tocopherol level in the treatment group >3.5 mg/dl | 4 | 918 | Risk Ratio (M‐H, Fixed, 95% CI) | 1.08 [0.93, 1.25] |
| 9.10 Onset of vitamin E supplementation in the treatment group within 48 hours of life | 5 | 947 | Risk Ratio (M‐H, Fixed, 95% CI) | 1.08 [0.93, 1.24] |
| 9.11 Duration of treatment > 1 week | 5 | 431 | Risk Ratio (M‐H, Fixed, 95% CI) | 1.03 [0.83, 1.28] |
| 9.12 Total dose of vitamin E in the control group <= 10 mg vit E/100 kcal | 4 | 729 | Risk Ratio (M‐H, Fixed, 95% CI) | 1.07 [0.92, 1.25] |
| 9.13 Total dose of vitamin E in the control group > 10 mg vit E/100 kcal | 2 | 247 | Risk Ratio (M‐H, Fixed, 95% CI) | 1.05 [0.77, 1.42] |
| 10 Patent ductus arteriosus among very low birth weight infants Show forest plot | 4 | | Risk Ratio (M‐H, Fixed, 95% CI) | Subtotals only |
|
| 10.1 All infants in all studies | 4 | 847 | Risk Ratio (M‐H, Fixed, 95% CI) | 1.09 [0.93, 1.28] |
| 10.2 Birth weight <= 1500 grams | 3 | 700 | Risk Ratio (M‐H, Fixed, 95% CI) | 1.08 [0.92, 1.27] |
| 10.3 Birth weight <= 1000 grams | 1 | 147 | Risk Ratio (M‐H, Fixed, 95% CI) | 1.24 [0.55, 2.81] |
| 10.4 Parenteral with or without enteral | 4 | 847 | Risk Ratio (M‐H, Fixed, 95% CI) | 1.09 [0.93, 1.28] |
| 10.5 Parenteral with hypertonic enteral formulation at pharmacologic dose | 1 | 545 | Risk Ratio (M‐H, Fixed, 95% CI) | 1.09 [0.91, 1.31] |
| 10.6 Intravenous with our without other routes of administration | 1 | 545 | Risk Ratio (M‐H, Fixed, 95% CI) | 1.09 [0.91, 1.31] |
| 10.7 Excluding intravenous administration | 3 | 302 | Risk Ratio (M‐H, Fixed, 95% CI) | 1.10 [0.78, 1.54] |
| 10.8 Total dose of vitamin E in the treatment group <= 30 IU/kg/day | 2 | 155 | Risk Ratio (M‐H, Fixed, 95% CI) | 1.05 [0.73, 1.52] |
| 10.9 Total dose of vitamin E in the treatment group > 30 IU/kg/day | 2 | 692 | Risk Ratio (M‐H, Fixed, 95% CI) | 1.10 [0.93, 1.31] |
| 10.10 Serum tocopherol level in the treatment group <= 3.5 mg/dl | 1 | 29 | Risk Ratio (M‐H, Fixed, 95% CI) | 1.11 [0.66, 1.87] |
| 10.11 Serum tocopherol level in the treatment group >3.5 mg/dl | 3 | 818 | Risk Ratio (M‐H, Fixed, 95% CI) | 1.09 [0.93, 1.29] |
| 10.12 Onset of vitamin E supplementation in the treatment group within 48 hours of life | 4 | 847 | Risk Ratio (M‐H, Fixed, 95% CI) | 1.09 [0.93, 1.28] |
| 10.13 Duration of treatment > 1 week | 3 | 302 | Risk Ratio (M‐H, Fixed, 95% CI) | 1.10 [0.78, 1.54] |
| 10.14 Total dose of vitamin E in the control group <= 10 mg vit E/100 kcal | 3 | 700 | Risk Ratio (M‐H, Fixed, 95% CI) | 1.08 [0.92, 1.27] |
| 10.15 Total dose of vitamin E in the control group > 10 mg vit E/100 kcal | 1 | 147 | Risk Ratio (M‐H, Fixed, 95% CI) | 1.24 [0.55, 2.81] |
| 11 Patent ductus arteriosus among surviving patients (at 10 days‐10 weeks) Show forest plot | 3 | | Risk Ratio (M‐H, Fixed, 95% CI) | Subtotals only |
|
| 11.1 All infants in all studies | 3 | 271 | Risk Ratio (M‐H, Fixed, 95% CI) | 0.98 [0.70, 1.38] |
| 11.2 Enteral | 1 | 101 | Risk Ratio (M‐H, Fixed, 95% CI) | 0.89 [0.35, 2.28] |
| 11.3 Enteral hypertonic formulation at pharmacologic doses | 1 | 101 | Risk Ratio (M‐H, Fixed, 95% CI) | 0.89 [0.35, 2.28] |
| 11.4 Parenteral with or without enteral | 2 | 170 | Risk Ratio (M‐H, Fixed, 95% CI) | 1.00 [0.70, 1.44] |
| 11.5 Parenteral with hypertonic enteral formulation at pharmacologic dose | 1 | 135 | Risk Ratio (M‐H, Fixed, 95% CI) | 0.84 [0.54, 1.31] |
| 11.6 Excluding intravenous administration | 3 | 271 | Risk Ratio (M‐H, Fixed, 95% CI) | 0.98 [0.70, 1.38] |
| 11.7 Total dose of vitamin E in the treatment group <= 30 IU/kg/day | 1 | 35 | Risk Ratio (M‐H, Fixed, 95% CI) | 1.62 [0.84, 3.12] |
| 11.8 Total dose of vitamin E in the treatment group > 30 IU/kg/day | 2 | 236 | Risk Ratio (M‐H, Fixed, 95% CI) | 0.85 [0.57, 1.27] |
| 11.9 Serum tocopherol level in the treatment group <= 3.5 mg/dl | 2 | 236 | Risk Ratio (M‐H, Fixed, 95% CI) | 0.85 [0.57, 1.27] |
| 11.10 Serum tocopherol level in the treatment group >3.5 mg/dl | 1 | 35 | Risk Ratio (M‐H, Fixed, 95% CI) | 1.62 [0.84, 3.12] |
| 11.11 Onset of vitamin E supplementation in the treatment group within 48 hours of life | 3 | 271 | Risk Ratio (M‐H, Fixed, 95% CI) | 0.98 [0.70, 1.38] |
| 11.12 Duration of treatment <= 1 week (7 days) | 1 | 135 | Risk Ratio (M‐H, Fixed, 95% CI) | 0.84 [0.54, 1.31] |
| 11.13 Duration of treatment > 1 week | 2 | 136 | Risk Ratio (M‐H, Fixed, 95% CI) | 1.24 [0.72, 2.14] |
| 11.14 Total dose of vitamin E in the control group <= 10 mg vit E/100 kcal | 2 | 136 | Risk Ratio (M‐H, Fixed, 95% CI) | 1.24 [0.72, 2.14] |
| 11.15 Total dose of vitamin E in the control group > 10 mg vit E/100 kcal | 1 | 135 | Risk Ratio (M‐H, Fixed, 95% CI) | 0.84 [0.54, 1.31] |
| 12 Patent ductus arteriosus among surviving very low birth infants (at 10 days‐10 weeks) Show forest plot | 2 | | Risk Ratio (M‐H, Fixed, 95% CI) | Subtotals only |
|
| 12.1 All infants in all studies | 2 | 236 | Risk Ratio (M‐H, Fixed, 95% CI) | 0.85 [0.57, 1.27] |
| 12.2 Birth weight <= 1500 grams | 2 | 236 | Risk Ratio (M‐H, Fixed, 95% CI) | 0.85 [0.57, 1.27] |
| 12.3 Enteral | 1 | 101 | Risk Ratio (M‐H, Fixed, 95% CI) | 0.89 [0.35, 2.28] |
| 12.4 Enteral hypertonic formulation at pharmacologic doses | 1 | 101 | Risk Ratio (M‐H, Fixed, 95% CI) | 0.89 [0.35, 2.28] |
| 12.5 Parenteral with or without enteral | 1 | 135 | Risk Ratio (M‐H, Fixed, 95% CI) | 0.84 [0.54, 1.31] |
| 12.6 Parenteral with hypertonic enteral formulation at pharmacologic dose | 1 | 135 | Risk Ratio (M‐H, Fixed, 95% CI) | 0.84 [0.54, 1.31] |
| 12.7 Excluding intravenous administration | 2 | 236 | Risk Ratio (M‐H, Fixed, 95% CI) | 0.85 [0.57, 1.27] |
| 12.8 Total dose of vitamin E in the treatment group > 30 IU/kg/day | 2 | 236 | Risk Ratio (M‐H, Fixed, 95% CI) | 0.85 [0.57, 1.27] |
| 12.9 Serum tocopherol level in the treatment group <= 3.5 mg/dl | 2 | 236 | Risk Ratio (M‐H, Fixed, 95% CI) | 0.85 [0.57, 1.27] |
| 12.10 Onset of vitamin E supplementation in the treatment group within 48 hours of life | 2 | 236 | Risk Ratio (M‐H, Fixed, 95% CI) | 0.85 [0.57, 1.27] |
| 12.11 Duration of treatment <= 1 week (7 days) | 1 | 135 | Risk Ratio (M‐H, Fixed, 95% CI) | 0.84 [0.54, 1.31] |
| 12.12 Duration of treatment > 1 week | 1 | 101 | Risk Ratio (M‐H, Fixed, 95% CI) | 0.89 [0.35, 2.28] |
| 12.13 Total dose of vitamin E in the control group <= 10 mg vit E/100 kcal | 1 | 101 | Risk Ratio (M‐H, Fixed, 95% CI) | 0.89 [0.35, 2.28] |
| 12.14 Total dose of vitamin E in the control group > 10 mg vit E/100 kcal | 1 | 135 | Risk Ratio (M‐H, Fixed, 95% CI) | 0.84 [0.54, 1.31] |
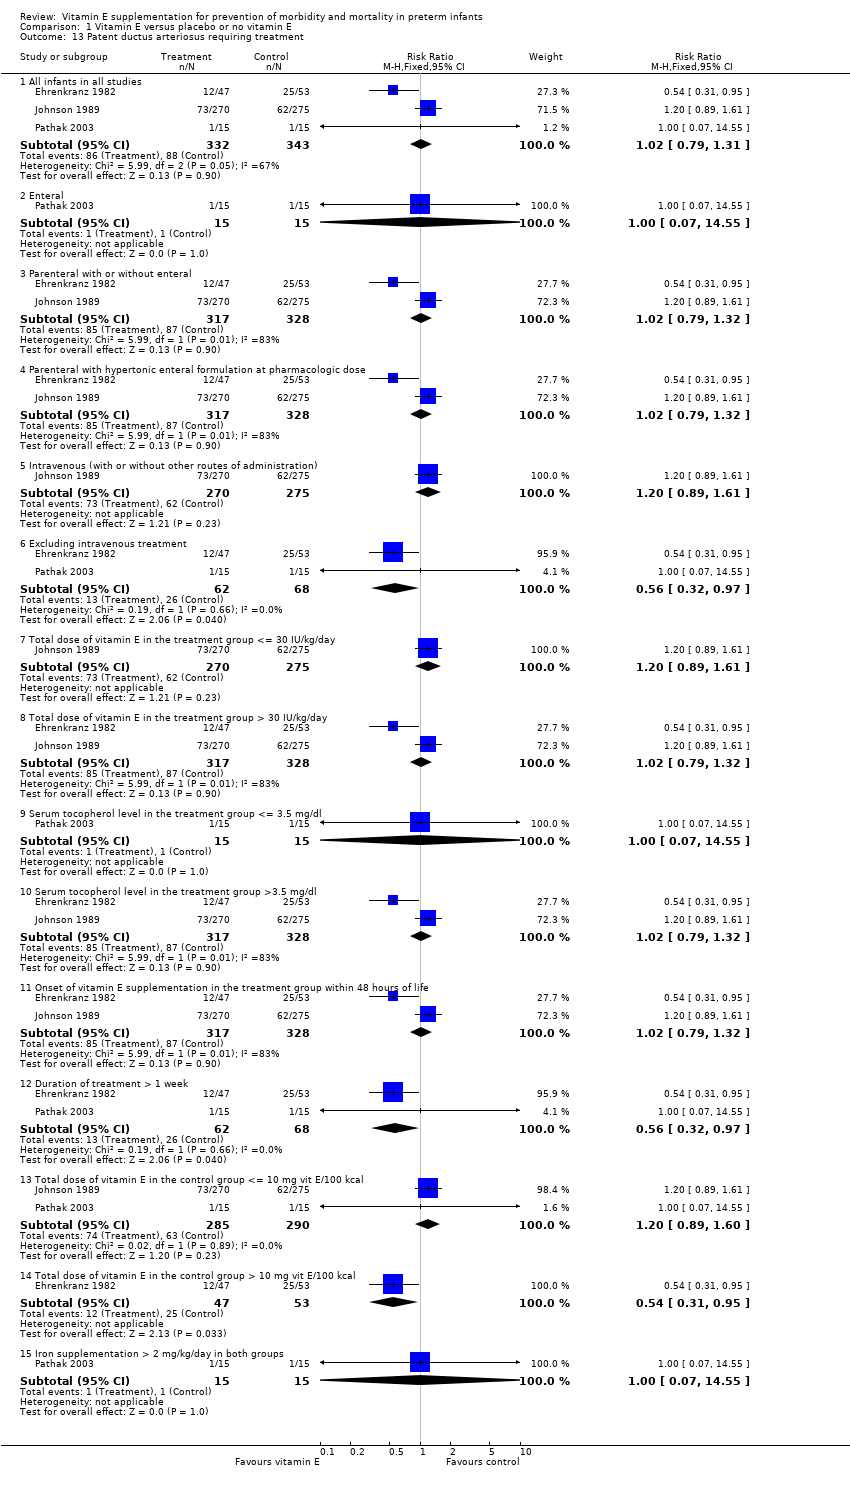
| 13 Patent ductus arteriosus requiring treatment Show forest plot | 3 | | Risk Ratio (M‐H, Fixed, 95% CI) | Subtotals only |
|
| 13.1 All infants in all studies | 3 | 675 | Risk Ratio (M‐H, Fixed, 95% CI) | 1.02 [0.79, 1.31] |
| 13.2 Enteral | 1 | 30 | Risk Ratio (M‐H, Fixed, 95% CI) | 1.0 [0.07, 14.55] |
| 13.3 Parenteral with or without enteral | 2 | 645 | Risk Ratio (M‐H, Fixed, 95% CI) | 1.02 [0.79, 1.32] |
| 13.4 Parenteral with hypertonic enteral formulation at pharmacologic dose | 2 | 645 | Risk Ratio (M‐H, Fixed, 95% CI) | 1.02 [0.79, 1.32] |
| 13.5 Intravenous (with or without other routes of administration) | 1 | 545 | Risk Ratio (M‐H, Fixed, 95% CI) | 1.20 [0.89, 1.61] |
| 13.6 Excluding intravenous treatment | 2 | 130 | Risk Ratio (M‐H, Fixed, 95% CI) | 0.56 [0.32, 0.97] |
| 13.7 Total dose of vitamin E in the treatment group <= 30 IU/kg/day | 1 | 545 | Risk Ratio (M‐H, Fixed, 95% CI) | 1.20 [0.89, 1.61] |
| 13.8 Total dose of vitamin E in the treatment group > 30 IU/kg/day | 2 | 645 | Risk Ratio (M‐H, Fixed, 95% CI) | 1.02 [0.79, 1.32] |
| 13.9 Serum tocopherol level in the treatment group <= 3.5 mg/dl | 1 | 30 | Risk Ratio (M‐H, Fixed, 95% CI) | 1.0 [0.07, 14.55] |
| 13.10 Serum tocopherol level in the treatment group >3.5 mg/dl | 2 | 645 | Risk Ratio (M‐H, Fixed, 95% CI) | 1.02 [0.79, 1.32] |
| 13.11 Onset of vitamin E supplementation in the treatment group within 48 hours of life | 2 | 645 | Risk Ratio (M‐H, Fixed, 95% CI) | 1.02 [0.79, 1.32] |
| 13.12 Duration of treatment > 1 week | 2 | 130 | Risk Ratio (M‐H, Fixed, 95% CI) | 0.56 [0.32, 0.97] |
| 13.13 Total dose of vitamin E in the control group <= 10 mg vit E/100 kcal | 2 | 575 | Risk Ratio (M‐H, Fixed, 95% CI) | 1.20 [0.89, 1.60] |
| 13.14 Total dose of vitamin E in the control group > 10 mg vit E/100 kcal | 1 | 100 | Risk Ratio (M‐H, Fixed, 95% CI) | 0.54 [0.31, 0.95] |
| 13.15 Iron supplementation > 2 mg/kg/day in both groups | 1 | 30 | Risk Ratio (M‐H, Fixed, 95% CI) | 1.0 [0.07, 14.55] |
| 14 Patent ductus arteriosus requiring treatment among very low birth weight infants Show forest plot | 2 | | Risk Ratio (M‐H, Fixed, 95% CI) | Subtotals only |
|
| 14.1 All infants in all studies | 2 | 575 | Risk Ratio (M‐H, Fixed, 95% CI) | 1.20 [0.89, 1.60] |
| 14.2 Birth weight <= 1500 grams | 2 | 575 | Risk Ratio (M‐H, Fixed, 95% CI) | 1.20 [0.89, 1.60] |
| 14.3 Enteral | 1 | 30 | Risk Ratio (M‐H, Fixed, 95% CI) | 1.0 [0.07, 14.55] |
| 14.4 Parenteral with or without enteral | 1 | 545 | Risk Ratio (M‐H, Fixed, 95% CI) | 1.20 [0.89, 1.61] |
| 14.5 Parenteral with hypertonic enteral formulation at pharmacologic dose | 1 | 545 | Risk Ratio (M‐H, Fixed, 95% CI) | 1.20 [0.89, 1.61] |
| 14.6 Intravenous (with or without other routes of administration) | 1 | 545 | Risk Ratio (M‐H, Fixed, 95% CI) | 1.20 [0.89, 1.61] |
| 14.7 Excluding intravenous treatment | 1 | 30 | Risk Ratio (M‐H, Fixed, 95% CI) | 1.0 [0.07, 14.55] |
| 14.8 Total dose of vitamin E in the treatment group > 30 IU/kg/day | 1 | 545 | Risk Ratio (M‐H, Fixed, 95% CI) | 1.20 [0.89, 1.61] |
| 14.9 Serum tocopherol level in the treatment group <= 3.5 mg/dl | 1 | 30 | Risk Ratio (M‐H, Fixed, 95% CI) | 1.0 [0.07, 14.55] |
| 14.10 Serum tocopherol level in the treatment group >3.5 mg/dl | 1 | 545 | Risk Ratio (M‐H, Fixed, 95% CI) | 1.20 [0.89, 1.61] |
| 14.11 Onset of vitamin E supplementation in the treatment group within 48 hours of life | 1 | 545 | Risk Ratio (M‐H, Fixed, 95% CI) | 1.20 [0.89, 1.61] |
| 14.12 Onset of treatment after 48 hours of life | 1 | 30 | Risk Ratio (M‐H, Fixed, 95% CI) | 1.0 [0.07, 14.55] |
| 14.13 Duration of treatment > 1 week | 1 | 30 | Risk Ratio (M‐H, Fixed, 95% CI) | 1.0 [0.07, 14.55] |
| 14.14 Total dose of vitamin E in the control group <= 10 mg vit E/100 kcal | 2 | 575 | Risk Ratio (M‐H, Fixed, 95% CI) | 1.20 [0.89, 1.60] |
| 14.15 Iron supplementation > 2 mg/kg/day in both groups | 1 | 30 | Risk Ratio (M‐H, Fixed, 95% CI) | 1.0 [0.07, 14.55] |
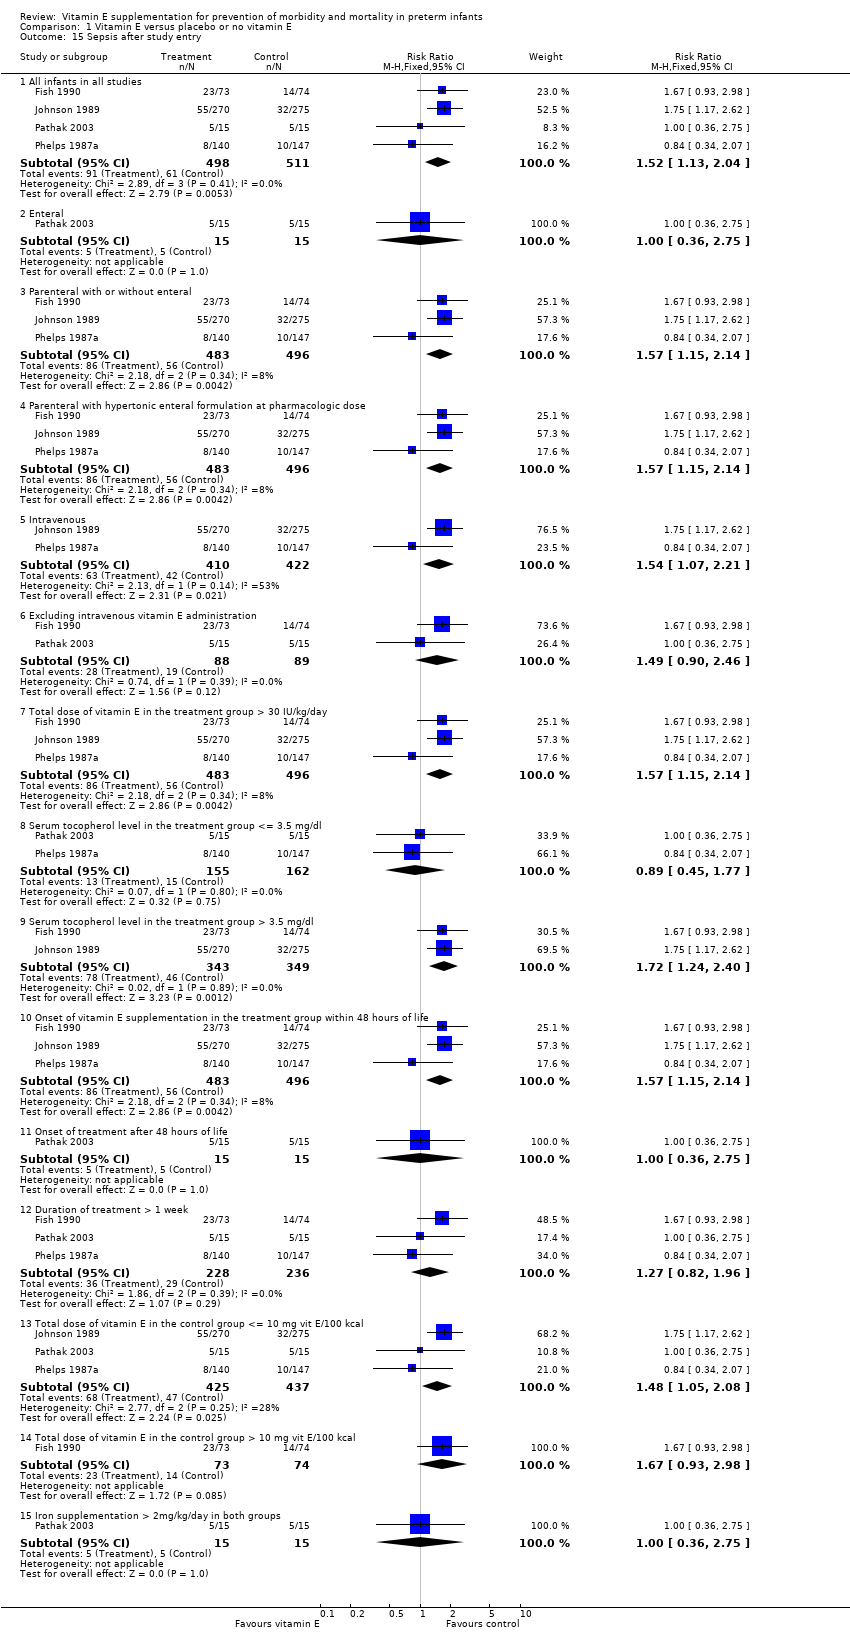
| 15 Sepsis after study entry Show forest plot | 4 | | Risk Ratio (M‐H, Fixed, 95% CI) | Subtotals only |
|
| 15.1 All infants in all studies | 4 | 1009 | Risk Ratio (M‐H, Fixed, 95% CI) | 1.52 [1.13, 2.04] |
| 15.2 Enteral | 1 | 30 | Risk Ratio (M‐H, Fixed, 95% CI) | 1.0 [0.36, 2.75] |
| 15.3 Parenteral with or without enteral | 3 | 979 | Risk Ratio (M‐H, Fixed, 95% CI) | 1.57 [1.15, 2.14] |
| 15.4 Parenteral with hypertonic enteral formulation at pharmacologic dose | 3 | 979 | Risk Ratio (M‐H, Fixed, 95% CI) | 1.57 [1.15, 2.14] |
| 15.5 Intravenous | 2 | 832 | Risk Ratio (M‐H, Fixed, 95% CI) | 1.54 [1.07, 2.21] |
| 15.6 Excluding intravenous vitamin E administration | 2 | 177 | Risk Ratio (M‐H, Fixed, 95% CI) | 1.49 [0.90, 2.46] |
| 15.7 Total dose of vitamin E in the treatment group > 30 IU/kg/day | 3 | 979 | Risk Ratio (M‐H, Fixed, 95% CI) | 1.57 [1.15, 2.14] |
| 15.8 Serum tocopherol level in the treatment group <= 3.5 mg/dl | 2 | 317 | Risk Ratio (M‐H, Fixed, 95% CI) | 0.89 [0.45, 1.77] |
| 15.9 Serum tocopherol level in the treatment group > 3.5 mg/dl | 2 | 692 | Risk Ratio (M‐H, Fixed, 95% CI) | 1.72 [1.24, 2.40] |
| 15.10 Onset of vitamin E supplementation in the treatment group within 48 hours of life | 3 | 979 | Risk Ratio (M‐H, Fixed, 95% CI) | 1.57 [1.15, 2.14] |
| 15.11 Onset of treatment after 48 hours of life | 1 | 30 | Risk Ratio (M‐H, Fixed, 95% CI) | 1.0 [0.36, 2.75] |
| 15.12 Duration of treatment > 1 week | 3 | 464 | Risk Ratio (M‐H, Fixed, 95% CI) | 1.27 [0.82, 1.96] |
| 15.13 Total dose of vitamin E in the control group <= 10 mg vit E/100 kcal | 3 | 862 | Risk Ratio (M‐H, Fixed, 95% CI) | 1.48 [1.05, 2.08] |
| 15.14 Total dose of vitamin E in the control group > 10 mg vit E/100 kcal | 1 | 147 | Risk Ratio (M‐H, Fixed, 95% CI) | 1.67 [0.93, 2.98] |
| 15.15 Iron supplementation > 2mg/kg/day in both groups | 1 | 30 | Risk Ratio (M‐H, Fixed, 95% CI) | 1.0 [0.36, 2.75] |
| 16 Sepsis after study entry among very low birth weight infants Show forest plot | 5 | | Risk Ratio (M‐H, Fixed, 95% CI) | Subtotals only |
|
| 16.1 All infants in all studies | 4 | 807 | Risk Ratio (M‐H, Fixed, 95% CI) | 1.53 [1.13, 2.08] |
| 16.2 Birth weight <= 1500 grams | 2 | 575 | Risk Ratio (M‐H, Fixed, 95% CI) | 1.65 [1.13, 2.40] |
| 16.3 Birth weight <= 1000 grams | 2 | 232 | Risk Ratio (M‐H, Fixed, 95% CI) | 1.32 [0.79, 2.22] |
| 16.4 Enteral | 1 | 30 | Risk Ratio (M‐H, Fixed, 95% CI) | 1.0 [0.36, 2.75] |
| 16.5 Parental with or without enteral | 3 | 777 | Risk Ratio (M‐H, Fixed, 95% CI) | 1.59 [1.15, 2.18] |
| 16.6 Parenteral with hypertonic enteral formulation at pharmacologic dose | 0 | 0 | Risk Ratio (M‐H, Fixed, 95% CI) | 0.0 [0.0, 0.0] |
| 16.7 Intravenous | 2 | 630 | Risk Ratio (M‐H, Fixed, 95% CI) | 1.56 [1.07, 2.27] |
| 16.8 Excluding intravenous vitamin E supplementation | 3 | 326 | Risk Ratio (M‐H, Fixed, 95% CI) | 1.35 [0.86, 2.12] |
| 16.9 Total dose of vitamin E supplementation in the treatment group > 30 IU/kd/day | 3 | 777 | Risk Ratio (M‐H, Fixed, 95% CI) | 1.59 [1.15, 2.18] |
| 16.10 Serum tocopherol level in the treatment group <= 3.5 mg/dl | 2 | 115 | Risk Ratio (M‐H, Fixed, 95% CI) | 0.74 [0.33, 1.64] |
| 16.11 Serum tocopherol level in the treatment group > 3.5 mg/dl | 2 | 692 | Risk Ratio (M‐H, Fixed, 95% CI) | 1.72 [1.24, 2.40] |
| 16.12 Onset of vitamin E supplementation in the treatment group within 48 hours of life | 3 | 777 | Risk Ratio (M‐H, Fixed, 95% CI) | 1.59 [1.15, 2.18] |
| 16.13 Onset of treatment after 48 hours of life | 1 | 30 | Risk Ratio (M‐H, Fixed, 95% CI) | 1.0 [0.36, 2.75] |
| 16.14 Duration of treatment > 1 week | 3 | 262 | Risk Ratio (M‐H, Fixed, 95% CI) | 1.26 [0.79, 1.99] |
| 16.15 Total dose of vitamin E in the control group <= 10 mg vit E/100 kcal | 3 | 660 | Risk Ratio (M‐H, Fixed, 95% CI) | 1.49 [1.04, 2.13] |
| 16.16 Total dose of vitamin E in the control group > 10 mg vit E/100 kcal | 1 | 147 | Risk Ratio (M‐H, Fixed, 95% CI) | 1.67 [0.93, 2.98] |
| 16.17 Iron supplementation > 2mg/kg/day in both groups | 1 | 30 | Risk Ratio (M‐H, Fixed, 95% CI) | 1.0 [0.36, 2.75] |
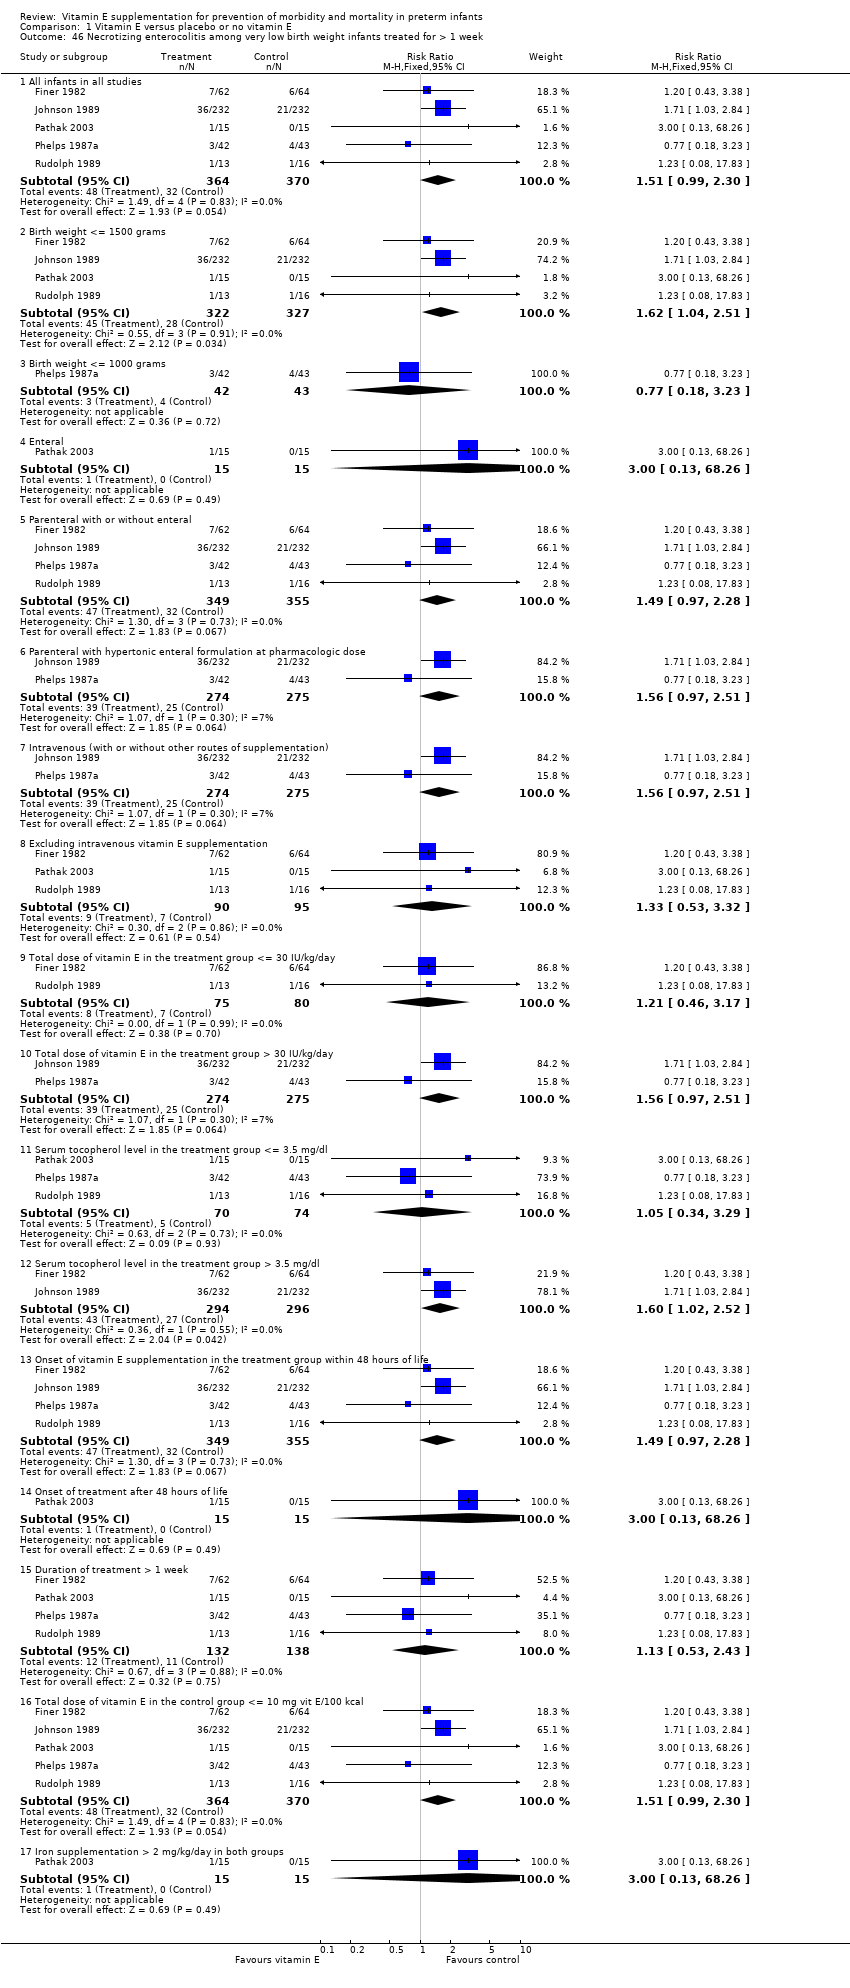
| 17 Sepsis after study entry among very low birth weight infants treated for > 1 week Show forest plot | 4 | | Risk Ratio (M‐H, Fixed, 95% CI) | Subtotals only |
|
| 17.1 All infants in all studies | 4 | 726 | Risk Ratio (M‐H, Fixed, 95% CI) | 1.63 [1.17, 2.26] |
| 17.2 Birth weight <= 1500 grams | 3 | 641 | Risk Ratio (M‐H, Fixed, 95% CI) | 1.79 [1.27, 2.53] |
| 17.3 Birth weight <= 1000 grams | 2 | 232 | Risk Ratio (M‐H, Fixed, 95% CI) | 1.32 [0.79, 2.22] |
| 17.4 Enteral | 1 | 30 | Risk Ratio (M‐H, Fixed, 95% CI) | 1.0 [0.36, 2.75] |
| 17.5 Parental with or without enteral | 3 | 696 | Risk Ratio (M‐H, Fixed, 95% CI) | 1.70 [1.20, 2.41] |
| 17.6 Intravenous | 2 | 549 | Risk Ratio (M‐H, Fixed, 95% CI) | 1.72 [1.11, 2.66] |
| 17.7 Excluding intravenous vitamin E supplementation | 2 | 177 | Risk Ratio (M‐H, Fixed, 95% CI) | 1.49 [0.90, 2.46] |
| 17.8 Total dose of vitamin E supplementation in the treatment group > 30 IU/kd/day | 3 | 696 | Risk Ratio (M‐H, Fixed, 95% CI) | 1.70 [1.20, 2.41] |
| 17.9 Serum tocopherol level in the treatment group <= 3.5 mg/dl | 2 | 115 | Risk Ratio (M‐H, Fixed, 95% CI) | 0.74 [0.33, 1.64] |
| 17.10 Serum tocopherol level in the treatment group > 3.5 mg/dl | 2 | 611 | Risk Ratio (M‐H, Fixed, 95% CI) | 1.90 [1.31, 2.75] |
| 17.11 Onset of vitamin E supplementation in the treatment group within 48 hours of life | 3 | 696 | Risk Ratio (M‐H, Fixed, 95% CI) | 1.70 [1.20, 2.41] |
| 17.12 Onset of treatment after 48 hours of life | 1 | 30 | Risk Ratio (M‐H, Fixed, 95% CI) | 1.0 [0.36, 2.75] |
| 17.13 Total dose of vitamin E in the control group <= 10 mg vit E/100 kcal | 3 | 579 | Risk Ratio (M‐H, Fixed, 95% CI) | 1.61 [1.08, 2.41] |
| 17.14 Total dose of vitamin E in the control group > 10 mg vit E/100 kcal | 1 | 147 | Risk Ratio (M‐H, Fixed, 95% CI) | 1.67 [0.93, 2.98] |
| 17.15 Iron supplementation > 2mg/kg/day in both groups | 1 | 30 | Risk Ratio (M‐H, Fixed, 95% CI) | 1.0 [0.36, 2.75] |
| 18 Sepsis among surviving very low birth weight infants Show forest plot | 2 | | Risk Ratio (M‐H, Fixed, 95% CI) | Subtotals only |
|
| 18.1 All infants in all studies | 2 | 284 | Risk Ratio (M‐H, Fixed, 95% CI) | 0.88 [0.48, 1.62] |
| 18.2 Enteral | 1 | 149 | Risk Ratio (M‐H, Fixed, 95% CI) | 0.99 [0.36, 2.67] |
| 18.3 Enteral hypertonic formulation, at pharmacologic doses | 1 | 149 | Risk Ratio (M‐H, Fixed, 95% CI) | 0.99 [0.36, 2.67] |
| 18.4 Parenteral with or without enteral | 1 | 135 | Risk Ratio (M‐H, Fixed, 95% CI) | 0.82 [0.38, 1.77] |
| 18.5 Parenteral with hypertonic enteral formulation at pharmacologic dose | 1 | 135 | Risk Ratio (M‐H, Fixed, 95% CI) | 0.82 [0.38, 1.77] |
| 18.6 Excluding intravenous vitamin E administration | 2 | 284 | Risk Ratio (M‐H, Fixed, 95% CI) | 0.88 [0.48, 1.62] |
| 18.7 Total dose of vitamin E in the treatment group > 30 IU/kg/day | 2 | 284 | Risk Ratio (M‐H, Fixed, 95% CI) | 0.88 [0.48, 1.62] |
| 18.8 Serum tocopherol level in the treatment group <= 3.5 mg/dl | 2 | 284 | Risk Ratio (M‐H, Fixed, 95% CI) | 0.88 [0.48, 1.62] |
| 18.9 Onset of vitamin E supplementation in the treatment group within 48 hours of life | 2 | 284 | Risk Ratio (M‐H, Fixed, 95% CI) | 0.88 [0.48, 1.62] |
| 18.10 Duration of treatment <= 1 week | 1 | 135 | Risk Ratio (M‐H, Fixed, 95% CI) | 0.82 [0.38, 1.77] |
| 18.11 Duration of treatment > 1 week | 1 | 149 | Risk Ratio (M‐H, Fixed, 95% CI) | 0.99 [0.36, 2.67] |
| 18.12 Total dose of vitamin E in the control group <= 10 mg vit E/100 kcal | 1 | 149 | Risk Ratio (M‐H, Fixed, 95% CI) | 0.99 [0.36, 2.67] |
| 18.13 Total dose of vitamin E in the control group > 10 mg vit E/100 kcal | 1 | 135 | Risk Ratio (M‐H, Fixed, 95% CI) | 0.82 [0.38, 1.77] |
| 19 Germinal matrix/intraventricular hemorrhage (grades I‐IV) Show forest plot | 7 | | Risk Ratio (M‐H, Fixed, 95% CI) | Subtotals only |
|
| 19.1 All infants in all studies | 7 | 1755 | Risk Ratio (M‐H, Fixed, 95% CI) | 0.85 [0.73, 0.99] |
| 19.2 Birth weight >= 1000 grams | 1 | 760 | Risk Ratio (M‐H, Fixed, 95% CI) | 1.29 [0.78, 2.14] |
| 19.3 Parenteral with or without enteral | 7 | 1755 | Risk Ratio (M‐H, Fixed, 95% CI) | 0.84 [0.72, 0.98] |
| 19.4 Parenteral with hypertonic enteral formulation at pharmacologic dose | 4 | 1448 | Risk Ratio (M‐H, Fixed, 95% CI) | 0.93 [0.78, 1.12] |
| 19.5 Intravenous (with or without other routes of administration) | 2 | 1201 | Risk Ratio (M‐H, Fixed, 95% CI) | 1.02 [0.82, 1.28] |
| 19.6 Excluding intravenous administration | 5 | 554 | Risk Ratio (M‐H, Fixed, 95% CI) | 0.71 [0.58, 0.87] |
| 19.7 Total dose of vitamin E in the treatment group <= 30 IU/kg/day | 3 | 307 | Risk Ratio (M‐H, Fixed, 95% CI) | 0.65 [0.50, 0.85] |
| 19.8 Total dose of vitamin E in the treatment group > 30 IU/kg/day | 4 | 1448 | Risk Ratio (M‐H, Fixed, 95% CI) | 0.93 [0.78, 1.12] |
| 19.9 Serum tocopherol level in the treatment group <= 3.5 mg/dl | 2 | 515 | Risk Ratio (M‐H, Fixed, 95% CI) | 0.82 [0.67, 1.00] |
| 19.10 Serum tocopherol level in the treatment group >3.5 mg/dl | 5 | 1240 | Risk Ratio (M‐H, Fixed, 95% CI) | 0.86 [0.68, 1.08] |
| 19.11 Onset of vitamin E supplementation in the treatment group within 48 hours of life | 7 | 1755 | Risk Ratio (M‐H, Fixed, 95% CI) | 0.85 [0.73, 0.99] |
| 19.12 Duration of treatment <= 1 week | 3 | 307 | Risk Ratio (M‐H, Fixed, 95% CI) | 0.65 [0.50, 0.85] |
| 19.13 Duration of treatment > 1 week | 3 | 534 | Risk Ratio (M‐H, Fixed, 95% CI) | 0.88 [0.71, 1.09] |
| 19.14 Total dose of vitamin E in the control group <= 10 mg vit E/100 kcal | 5 | 1508 | Risk Ratio (M‐H, Fixed, 95% CI) | 0.86 [0.73, 1.03] |
| 19.15 Total dose of vitamin E in the control group > 10 mg vit E/100 kcal | 2 | 247 | Risk Ratio (M‐H, Fixed, 95% CI) | 0.75 [0.55, 1.04] |
| 20 Germinal matrix/intraventricular hemorrhage among very low birth weight infants Show forest plot | 3 | | Risk Ratio (M‐H, Fixed, 95% CI) | Subtotals only |
|
| 20.1 All infants in all studies | 3 | 777 | Risk Ratio (M‐H, Fixed, 95% CI) | 0.94 [0.75, 1.18] |
| 20.2 Birth weight <= 1500 grams | 1 | 545 | Risk Ratio (M‐H, Fixed, 95% CI) | 1.00 [0.68, 1.46] |
| 20.3 Birth weight <= 1000 grams | 3 | 377 | Risk Ratio (M‐H, Fixed, 95% CI) | 0.88 [0.69, 1.11] |
| 20.4 Birth weight 1001‐1500 grams | 1 | 393 | Risk Ratio (M‐H, Fixed, 95% CI) | 1.21 [0.69, 2.11] |
| 20.5 Parenteral with or without enteral | 3 | 777 | Risk Ratio (M‐H, Fixed, 95% CI) | 0.94 [0.75, 1.18] |
| 20.6 Parenteral with hypertonic enteral formulation at pharmacologic dose | 3 | 777 | Risk Ratio (M‐H, Fixed, 95% CI) | 0.94 [0.75, 1.18] |
| 20.7 Intravenous (with or without other routes of administration) | 2 | 630 | Risk Ratio (M‐H, Fixed, 95% CI) | 1.07 [0.81, 1.40] |
| 20.8 Excluding intravenous administration | 1 | 147 | Risk Ratio (M‐H, Fixed, 95% CI) | 0.70 [0.46, 1.04] |
| 20.9 Total dose of vitamin E in the treatment group > 30 IU/kg/day | 3 | 777 | Risk Ratio (M‐H, Fixed, 95% CI) | 0.94 [0.75, 1.18] |
| 20.10 Serum tocopherol level in the treatment group <= 3.5 mg/dl | 1 | 85 | Risk Ratio (M‐H, Fixed, 95% CI) | 1.19 [0.85, 1.68] |
| 20.11 Serum tocopherol level in the treatment group >3.5 mg/dl | 2 | 692 | Risk Ratio (M‐H, Fixed, 95% CI) | 0.86 [0.65, 1.14] |
| 20.12 Onset of vitamin E supplementation in the treatment group within 48 hours of life | 3 | 777 | Risk Ratio (M‐H, Fixed, 95% CI) | 0.94 [0.75, 1.18] |
| 20.13 Duration of treatment > 1 week | 2 | 232 | Risk Ratio (M‐H, Fixed, 95% CI) | 0.90 [0.69, 1.17] |
| 20.14 Total dose of vitamin E in the control group <= 10 mg vit E/100 kcal | 2 | 630 | Risk Ratio (M‐H, Fixed, 95% CI) | 1.07 [0.81, 1.40] |
| 20.15 Total dose of vitamin E in the control group > 10 mg vit E/100 kcal | 1 | 147 | Risk Ratio (M‐H, Fixed, 95% CI) | 0.70 [0.46, 1.04] |
| 21 Germinal matrix/intraventricular hemorrhage among patients with negative initial ultrasonogram Show forest plot | 1 | | Risk Ratio (M‐H, Fixed, 95% CI) | Subtotals only |
|
| 21.1 All infants in all studies | 1 | 210 | Risk Ratio (M‐H, Fixed, 95% CI) | 0.57 [0.40, 0.80] |
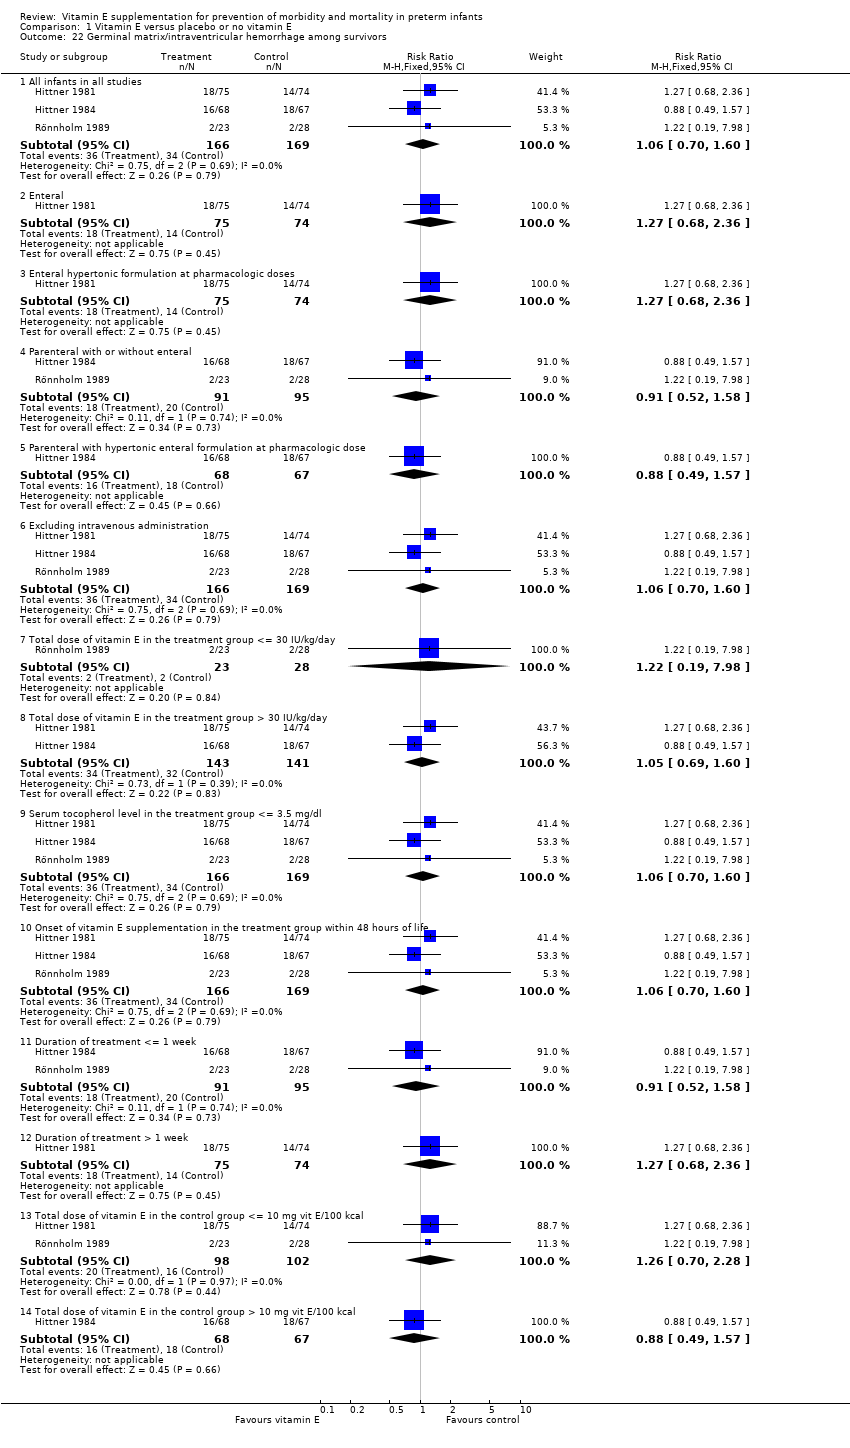
| 22 Germinal matrix/intraventricular hemorrhage among survivors Show forest plot | 3 | | Risk Ratio (M‐H, Fixed, 95% CI) | Subtotals only |
|
| 22.1 All infants in all studies | 3 | 335 | Risk Ratio (M‐H, Fixed, 95% CI) | 1.06 [0.70, 1.60] |
| 22.2 Enteral | 1 | 149 | Risk Ratio (M‐H, Fixed, 95% CI) | 1.27 [0.68, 2.36] |
| 22.3 Enteral hypertonic formulation at pharmacologic doses | 1 | 149 | Risk Ratio (M‐H, Fixed, 95% CI) | 1.27 [0.68, 2.36] |
| 22.4 Parenteral with or without enteral | 2 | 186 | Risk Ratio (M‐H, Fixed, 95% CI) | 0.91 [0.52, 1.58] |
| 22.5 Parenteral with hypertonic enteral formulation at pharmacologic dose | 1 | 135 | Risk Ratio (M‐H, Fixed, 95% CI) | 0.88 [0.49, 1.57] |
| 22.6 Excluding intravenous administration | 3 | 335 | Risk Ratio (M‐H, Fixed, 95% CI) | 1.06 [0.70, 1.60] |
| 22.7 Total dose of vitamin E in the treatment group <= 30 IU/kg/day | 1 | 51 | Risk Ratio (M‐H, Fixed, 95% CI) | 1.22 [0.19, 7.98] |
| 22.8 Total dose of vitamin E in the treatment group > 30 IU/kg/day | 2 | 284 | Risk Ratio (M‐H, Fixed, 95% CI) | 1.05 [0.69, 1.60] |
| 22.9 Serum tocopherol level in the treatment group <= 3.5 mg/dl | 3 | 335 | Risk Ratio (M‐H, Fixed, 95% CI) | 1.06 [0.70, 1.60] |
| 22.10 Onset of vitamin E supplementation in the treatment group within 48 hours of life | 3 | 335 | Risk Ratio (M‐H, Fixed, 95% CI) | 1.06 [0.70, 1.60] |
| 22.11 Duration of treatment <= 1 week | 2 | 186 | Risk Ratio (M‐H, Fixed, 95% CI) | 0.91 [0.52, 1.58] |
| 22.12 Duration of treatment > 1 week | 1 | 149 | Risk Ratio (M‐H, Fixed, 95% CI) | 1.27 [0.68, 2.36] |
| 22.13 Total dose of vitamin E in the control group <= 10 mg vit E/100 kcal | 2 | 200 | Risk Ratio (M‐H, Fixed, 95% CI) | 1.26 [0.70, 2.28] |
| 22.14 Total dose of vitamin E in the control group > 10 mg vit E/100 kcal | 1 | 135 | Risk Ratio (M‐H, Fixed, 95% CI) | 0.88 [0.49, 1.57] |
| 23 Germinal matrix/intraventricular hemorrhage among surviving very low birth weight infants Show forest plot | 3 | | Risk Ratio (M‐H, Fixed, 95% CI) | Subtotals only |
|
| 23.1 All infants in all studies | 2 | 284 | Risk Ratio (M‐H, Fixed, 95% CI) | 1.05 [0.69, 1.60] |
| 23.2 Birth weight <= 1500 grams | 2 | 284 | Risk Ratio (M‐H, Fixed, 95% CI) | 1.05 [0.69, 1.60] |
| 23.3 Birth weight <= 1000 grams | 1 | 49 | Risk Ratio (M‐H, Fixed, 95% CI) | 0.93 [0.40, 2.17] |
| 23.4 Enteral | 1 | 149 | Risk Ratio (M‐H, Fixed, 95% CI) | 1.27 [0.68, 2.36] |
| 23.5 Enteral hypertonic formulation at pharmacologic doses | 1 | 149 | Risk Ratio (M‐H, Fixed, 95% CI) | 1.27 [0.68, 2.36] |
| 23.6 Parenteral with or without enteral | 1 | 135 | Risk Ratio (M‐H, Fixed, 95% CI) | 0.88 [0.49, 1.57] |
| 23.7 Parenteral with hypertonic enteral formulation at pharmacologic dose | 1 | 135 | Risk Ratio (M‐H, Fixed, 95% CI) | 0.88 [0.49, 1.57] |
| 23.8 Excluding intravenous administration | 2 | 284 | Risk Ratio (M‐H, Fixed, 95% CI) | 1.05 [0.69, 1.60] |
| 23.9 Total dose of vitamin E in the treatment group > 30 IU/kg/day | 2 | 284 | Risk Ratio (M‐H, Fixed, 95% CI) | 1.05 [0.69, 1.60] |
| 23.10 Serum tocopherol level in the treatment group <= 3.5 mg/dl | 2 | 284 | Risk Ratio (M‐H, Fixed, 95% CI) | 1.05 [0.69, 1.60] |
| 23.11 Onset of vitamin E supplementation in the treatment group within 48 hours of life | 2 | 284 | Risk Ratio (M‐H, Fixed, 95% CI) | 1.05 [0.69, 1.60] |
| 23.12 Duration of treatment <= 1 week | 2 | 186 | Risk Ratio (M‐H, Fixed, 95% CI) | 0.91 [0.52, 1.58] |
| 23.13 Duration of treatment > 1 week | 1 | 149 | Risk Ratio (M‐H, Fixed, 95% CI) | 1.27 [0.68, 2.36] |
| 23.14 Total dose of vitamin E in the control group <= 10 mg vit E/100 kcal | 2 | 200 | Risk Ratio (M‐H, Fixed, 95% CI) | 1.26 [0.70, 2.28] |
| 23.15 Total dose of vitamin E in the control group > 10 mg vit E/100 kcal | 1 | 135 | Risk Ratio (M‐H, Fixed, 95% CI) | 0.88 [0.49, 1.57] |
| 24 Severe intraventricular hemorrhage (grade III‐IV) Show forest plot | 3 | | Risk Ratio (M‐H, Fixed, 95% CI) | Subtotals only |
|
| 24.1 All infants in all studies | 3 | 644 | Risk Ratio (M‐H, Fixed, 95% CI) | 0.91 [0.60, 1.38] |
| 24.2 Parenteral with or without enteral | 3 | 644 | Risk Ratio (M‐H, Fixed, 95% CI) | 0.91 [0.60, 1.38] |
| 24.3 Parenteral with hypertonic enteral formulation at pharmacologic dose | 2 | 434 | Risk Ratio (M‐H, Fixed, 95% CI) | 1.03 [0.67, 1.60] |
| 24.4 Intravenous (with or without other routes of administration) | 1 | 287 | Risk Ratio (M‐H, Fixed, 95% CI) | 1.61 [0.88, 2.96] |
| 24.5 Excluding intravenous vitamin E supplementation | 2 | 357 | Risk Ratio (M‐H, Fixed, 95% CI) | 0.51 [0.28, 0.94] |
| 24.6 Total dose of vitamin E in the treatment group <= 30 IU/kg/day | 1 | 210 | Risk Ratio (M‐H, Fixed, 95% CI) | 0.30 [0.06, 1.42] |
| 24.7 Total dose of vitamin E in the treatment group > 30 IU/kg/day | 2 | 434 | Risk Ratio (M‐H, Fixed, 95% CI) | 1.03 [0.67, 1.60] |
| 24.8 Serum tocopherol level in the treatment group <= 3.5 mg/dl | 2 | 497 | Risk Ratio (M‐H, Fixed, 95% CI) | 1.20 [0.70, 2.05] |
| 24.9 Serum tocopherol level in the treatment group > 3.5 mg/dl | 1 | 147 | Risk Ratio (M‐H, Fixed, 95% CI) | 0.59 [0.30, 1.15] |
| 24.10 Onset of vitamin E supplementation in the treatment group within 48 hours of life | 3 | 644 | Risk Ratio (M‐H, Fixed, 95% CI) | 0.91 [0.60, 1.38] |
| 24.11 Duration of treatment <= 1 week | 1 | 210 | Risk Ratio (M‐H, Fixed, 95% CI) | 0.30 [0.06, 1.42] |
| 24.12 Duration of treatment > 1 week | 2 | 434 | Risk Ratio (M‐H, Fixed, 95% CI) | 1.03 [0.67, 1.60] |
| 24.13 Total dose of vitamin E in the control group <= 10 mg vit E/100 kcal | 2 | 497 | Risk Ratio (M‐H, Fixed, 95% CI) | 1.20 [0.70, 2.05] |
| 24.14 Total dose of vitamin E in the control group > 10 mg vit E/100 kcal | 1 | 147 | Risk Ratio (M‐H, Fixed, 95% CI) | 0.59 [0.30, 1.15] |
| 25 Severe intraventricular hemorrhage among very low birth weight infants Show forest plot | 2 | | Risk Ratio (M‐H, Fixed, 95% CI) | Subtotals only |
|
| 25.1 All infants in all studies | 2 | 434 | Risk Ratio (M‐H, Fixed, 95% CI) | 1.03 [0.67, 1.60] |
| 25.2 Birth weight <= 1000 grams | 2 | 232 | Risk Ratio (M‐H, Fixed, 95% CI) | 1.06 [0.63, 1.78] |
| 25.3 Parenteral with or without enteral | 2 | 434 | Risk Ratio (M‐H, Fixed, 95% CI) | 1.03 [0.67, 1.60] |
| 25.4 Parenteral with hypertonic enteral formulation at pharmacologic dose | 2 | 434 | Risk Ratio (M‐H, Fixed, 95% CI) | 1.03 [0.67, 1.60] |
| 25.5 Intravenous (with or without other routes of administration) | 1 | 287 | Risk Ratio (M‐H, Fixed, 95% CI) | 1.61 [0.88, 2.96] |
| 25.6 Excluding intravenous vitamin E supplementation | 1 | 147 | Risk Ratio (M‐H, Fixed, 95% CI) | 0.59 [0.30, 1.15] |
| 25.7 Total dose of vitamin E in the treatment group > 30 IU/kg/day | 2 | 434 | Risk Ratio (M‐H, Fixed, 95% CI) | 1.03 [0.67, 1.60] |
| 25.8 Serum tocopherol level in the treatment group <= 3.5 mg/dl | 1 | 287 | Risk Ratio (M‐H, Fixed, 95% CI) | 1.61 [0.88, 2.96] |
| 25.9 Serum tocopherol level in the treatment group > 3.5 mg/dl | 1 | 147 | Risk Ratio (M‐H, Fixed, 95% CI) | 0.59 [0.30, 1.15] |
| 25.10 Onset of vitamin E supplementation in the treatment group within 48 hours of life | 2 | 434 | Risk Ratio (M‐H, Fixed, 95% CI) | 1.03 [0.67, 1.60] |
| 25.11 Duration of treatment > 1 week | 2 | 434 | Risk Ratio (M‐H, Fixed, 95% CI) | 1.03 [0.67, 1.60] |
| 25.12 Total dose of vitamin E in the control group <= 10 mg vit E/100 kcal | 1 | 287 | Risk Ratio (M‐H, Fixed, 95% CI) | 1.61 [0.88, 2.96] |
| 25.13 Total dose of vitamin E in the control group > 10 mg vit E/100 kcal | 1 | 147 | Risk Ratio (M‐H, Fixed, 95% CI) | 0.59 [0.30, 1.15] |
| 26 Severe intraventricular hemorrhage among surviving very low birth weight infants Show forest plot | 3 | | Risk Ratio (M‐H, Fixed, 95% CI) | Subtotals only |
|
| 26.1 All infants in all studies | 3 | 320 | Risk Ratio (M‐H, Fixed, 95% CI) | 0.76 [0.41, 1.39] |
| 26.2 Birth weight <= 1500 grams | 2 | 236 | Risk Ratio (M‐H, Fixed, 95% CI) | 1.29 [0.62, 2.66] |
| 26.3 Birth weight <= 1000 grams | 2 | 133 | Risk Ratio (M‐H, Fixed, 95% CI) | 0.31 [0.10, 0.92] |
| 26.4 Enteral | 1 | 101 | Risk Ratio (M‐H, Fixed, 95% CI) | 1.40 [0.62, 3.19] |
| 26.5 Enteral hypertonic formulation at pharmacologic dose | 1 | 101 | Risk Ratio (M‐H, Fixed, 95% CI) | 1.40 [0.62, 3.19] |
| 26.6 Parenteral with or without enteral | 2 | 219 | Risk Ratio (M‐H, Fixed, 95% CI) | 0.38 [0.14, 1.02] |
| 26.7 Parenteral with hypertonic enteral formulation at pharmacologic dose | 2 | 219 | Risk Ratio (M‐H, Fixed, 95% CI) | 0.38 [0.14, 1.02] |
| 26.8 Excluding intravenous vitamin E supplementation | 3 | 320 | Risk Ratio (M‐H, Fixed, 95% CI) | 0.76 [0.41, 1.39] |
| 26.9 Total dose of vitamin E in the treatment group > 30 IU/kg/day | 3 | 320 | Risk Ratio (M‐H, Fixed, 95% CI) | 0.76 [0.41, 1.39] |
| 26.10 Serum tocopherol level in the treatment group <= 3.5 mg/dl | 2 | 236 | Risk Ratio (M‐H, Fixed, 95% CI) | 1.29 [0.62, 2.66] |
| 26.11 Serum tocopherol level in the treatment group > 3.5 mg/dl | 1 | 84 | Risk Ratio (M‐H, Fixed, 95% CI) | 0.2 [0.05, 0.85] |
| 26.12 Onset of vitamin E supplementation in the treatment group within 48 hours of life | 3 | 320 | Risk Ratio (M‐H, Fixed, 95% CI) | 0.76 [0.41, 1.39] |
| 26.13 Duration of treatment <= 1 week | 1 | 135 | Risk Ratio (M‐H, Fixed, 95% CI) | 0.99 [0.21, 4.71] |
| 26.14 Duration of treatment > 1 week | 2 | 185 | Risk Ratio (M‐H, Fixed, 95% CI) | 0.72 [0.37, 1.39] |
| 26.15 Total dose of vitamin E in the control group <= 10 mg/100 kcal | 1 | 101 | Risk Ratio (M‐H, Fixed, 95% CI) | 1.40 [0.62, 3.19] |
| 26.16 Total dose of vitamin E in the control group > 10 mg vit E/100 kcal | 2 | 219 | Risk Ratio (M‐H, Fixed, 95% CI) | 0.38 [0.14, 1.02] |
| 27 Parenchymal hemorrhage (grade IV) Show forest plot | 2 | | Risk Ratio (M‐H, Fixed, 95% CI) | Subtotals only |
|
| 27.1 All infants in all studies | 2 | 497 | Risk Ratio (M‐H, Fixed, 95% CI) | 1.35 [0.69, 2.67] |
| 27.2 Parenteral with or without enteral | 2 | 497 | Risk Ratio (M‐H, Fixed, 95% CI) | 1.35 [0.69, 2.67] |
| 27.3 Parenteral with hypertonic enteral formulation at pharmacologic dose | 1 | 287 | Risk Ratio (M‐H, Fixed, 95% CI) | 2.4 [1.02, 5.66] |
| 27.4 Intravenous (with or without other routes of administration) | 1 | 287 | Risk Ratio (M‐H, Fixed, 95% CI) | 2.4 [1.02, 5.66] |
| 27.5 Excluding intravenous vitamin E administration | 1 | 210 | Risk Ratio (M‐H, Fixed, 95% CI) | 0.30 [0.06, 1.42] |
| 27.6 Total dose of vitamin E in the treatment group <= 30 IU/kg/day | 1 | 210 | Risk Ratio (M‐H, Fixed, 95% CI) | 0.30 [0.06, 1.42] |
| 27.7 Total dose of vitamin E in the treatment group > 30 IU/kg/day | 1 | 287 | Risk Ratio (M‐H, Fixed, 95% CI) | 2.4 [1.02, 5.66] |
| 27.8 Serum tocopherol level in the treatment group <= 3.5 mg/dl | 2 | 497 | Risk Ratio (M‐H, Fixed, 95% CI) | 1.35 [0.69, 2.67] |
| 27.9 Onset of vitamin E supplementation in the treatment group within 48 hours of life | 2 | 497 | Risk Ratio (M‐H, Fixed, 95% CI) | 1.35 [0.69, 2.67] |
| 27.10 Duration of treatment <= 1 week | 1 | 210 | Risk Ratio (M‐H, Fixed, 95% CI) | 0.30 [0.06, 1.42] |
| 27.11 Duration of treatment > 1 week | 1 | 287 | Risk Ratio (M‐H, Fixed, 95% CI) | 2.4 [1.02, 5.66] |
| 27.12 Total dose of vitamin E in the control group <= 10 mg vit E/100 kcal | 2 | 497 | Risk Ratio (M‐H, Fixed, 95% CI) | 1.35 [0.69, 2.67] |
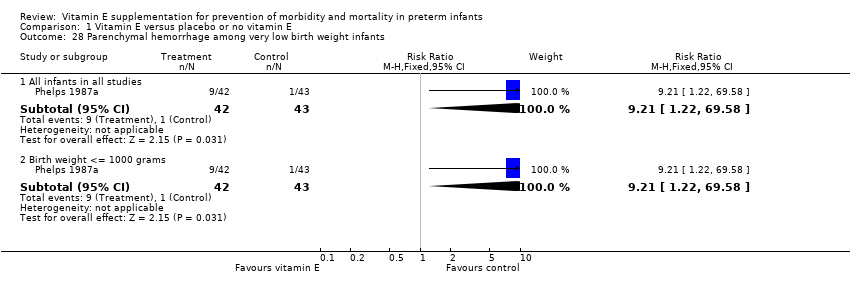
| 28 Parenchymal hemorrhage among very low birth weight infants Show forest plot | 1 | | Risk Ratio (M‐H, Fixed, 95% CI) | Subtotals only |
|
| 28.1 All infants in all studies | 1 | 85 | Risk Ratio (M‐H, Fixed, 95% CI) | 9.21 [1.22, 69.58] |
| 28.2 Birth weight <= 1000 grams | 1 | 85 | Risk Ratio (M‐H, Fixed, 95% CI) | 9.21 [1.22, 69.58] |
| 29 Parenchymal hemorrhage among patients with negative initial ultrasonogram Show forest plot | 1 | | Risk Ratio (M‐H, Fixed, 95% CI) | Subtotals only |
|
| 29.1 All infants in all studies | 1 | 210 | Risk Ratio (M‐H, Fixed, 95% CI) | 0.30 [0.06, 1.42] |
| 30 Parenchymal hemorrhage (Grade IV) among surviving very low birth weight infants Show forest plot | 2 | | Risk Ratio (M‐H, Fixed, 95% CI) | Subtotals only |
|
| 30.1 All infants in all studies | 2 | 236 | Risk Ratio (M‐H, Fixed, 95% CI) | 1.46 [0.46, 4.66] |
| 30.2 Birth weight <= 1500 grams | 2 | 236 | Risk Ratio (M‐H, Fixed, 95% CI) | 1.46 [0.46, 4.66] |
| 30.3 Birth weight <= 1000 grams | 1 | 49 | Risk Ratio (M‐H, Fixed, 95% CI) | 0.27 [0.01, 6.41] |
| 30.4 Enteral | 1 | 101 | Risk Ratio (M‐H, Fixed, 95% CI) | 2.04 [0.54, 7.71] |
| 30.5 Enteral hypertonic formulation at pharmacologic dose | 1 | 101 | Risk Ratio (M‐H, Fixed, 95% CI) | 2.04 [0.54, 7.71] |
| 30.6 Parenteral with or without enteral | 1 | 135 | Risk Ratio (M‐H, Fixed, 95% CI) | 0.33 [0.01, 7.92] |
| 30.7 Parenteral with hypertonic enteral formulation at pharmacologic dose | 1 | 135 | Risk Ratio (M‐H, Fixed, 95% CI) | 0.33 [0.01, 7.92] |
| 30.8 Excluding intravenous vitamin E supplementation | 2 | 236 | Risk Ratio (M‐H, Fixed, 95% CI) | 1.46 [0.46, 4.66] |
| 30.9 Total dose of vitamin E in the treatment group > 30 IU/kg/day | 2 | 236 | Risk Ratio (M‐H, Fixed, 95% CI) | 1.46 [0.46, 4.66] |
| 30.10 Serum tocopherol level in the treatment group <= 3.5 mg/dl | 2 | 236 | Risk Ratio (M‐H, Fixed, 95% CI) | 1.46 [0.46, 4.66] |
| 30.11 Onset of vitamin E supplementation in the treatment group within 48 hours of life | 2 | 236 | Risk Ratio (M‐H, Fixed, 95% CI) | 1.46 [0.46, 4.66] |
| 30.12 Duration of treatment <= 1 week | 1 | 135 | Risk Ratio (M‐H, Fixed, 95% CI) | 0.33 [0.01, 7.92] |
| 30.13 Duration of treatment > 1 week | 1 | 101 | Risk Ratio (M‐H, Fixed, 95% CI) | 2.04 [0.54, 7.71] |
| 30.14 Total dose of vitamin E in the control group <= 10 mg/100 kcal | 1 | 101 | Risk Ratio (M‐H, Fixed, 95% CI) | 2.04 [0.54, 7.71] |
| 30.15 Total dose of vitamin E in the control group > 10 mg vit E/100 kcal | 1 | 135 | Risk Ratio (M‐H, Fixed, 95% CI) | 0.33 [0.01, 7.92] |
| 31 Retrolental fibroplasia/retinopathy of prematurity Show forest plot | 7 | | Risk Ratio (M‐H, Fixed, 95% CI) | Subtotals only |
|
| 31.1 All infants in all studies | 7 | 1342 | Risk Ratio (M‐H, Fixed, 95% CI) | 0.90 [0.75, 1.09] |
| 31.2 Enteral | 1 | 268 | Risk Ratio (M‐H, Fixed, 95% CI) | 0.67 [0.35, 1.31] |
| 31.3 Parenteral with or without enteral | 5 | 973 | Risk Ratio (M‐H, Fixed, 95% CI) | 0.91 [0.75, 1.11] |
| 31.4 Parenteral with hypertonic enteral formulation at pharmacologic dose | 3 | 932 | Risk Ratio (M‐H, Fixed, 95% CI) | 0.93 [0.77, 1.13] |
| 31.5 Intravenous (with or without other routes of administration) | 2 | 832 | Risk Ratio (M‐H, Fixed, 95% CI) | 0.91 [0.75, 1.11] |
| 31.6 Excluding intravenous vitamin E supplementation | 5 | 510 | Risk Ratio (M‐H, Fixed, 95% CI) | 0.85 [0.50, 1.43] |
| 31.7 Total dose of vitamin E in the treatment group <= 30 IU/kg/day | 3 | 374 | Risk Ratio (M‐H, Fixed, 95% CI) | 0.67 [0.35, 1.31] |
| 31.8 Total dose of vitamin E in the treatment group > 30 IU/kg/day | 4 | 967 | Risk Ratio (M‐H, Fixed, 95% CI) | 0.93 [0.77, 1.13] |
| 31.9 Serum tocopherol level in the treatment group <= 3.5 mg/dl | 4 | 641 | Risk Ratio (M‐H, Fixed, 95% CI) | 0.87 [0.59, 1.28] |
| 31.10 Serum tocopherol level in the treatment group > 3.5 mg/dl | 3 | 700 | Risk Ratio (M‐H, Fixed, 95% CI) | 0.91 [0.74, 1.13] |
| 31.11 Onset of vitamin E supplementation in the treatment group within 48 hours of life | 6 | 796 | Risk Ratio (M‐H, Fixed, 95% CI) | 0.93 [0.65, 1.32] |
| 31.12 Duration of treatment <= 1 week | 3 | 141 | Risk Ratio (M‐H, Fixed, 95% CI) | 0.0 [0.0, 0.0] |
| 31.13 Duration of treatment > 1 week | 3 | 655 | Risk Ratio (M‐H, Fixed, 95% CI) | 0.93 [0.65, 1.32] |
| 31.14 Total dose of vitamin E in the control group <= 10 mg vit E/100 kcal | 6 | 1241 | Risk Ratio (M‐H, Fixed, 95% CI) | 0.88 [0.73, 1.07] |
| 31.15 Total dose of vitamin E in the control group > 10 mg vit E/100 kcal | 1 | 100 | Risk Ratio (M‐H, Fixed, 95% CI) | 1.27 [0.53, 3.02] |
| 31.16 Iron supplementation >2 mg/kg in both groups | 2 | 61 | Risk Ratio (M‐H, Fixed, 95% CI) | 0.0 [0.0, 0.0] |
| 31.17 Iron supplementation > 2 mg/kg in neither group | 2 | 293 | Risk Ratio (M‐H, Fixed, 95% CI) | 0.67 [0.35, 1.31] |
| 31.18 Vitamin A supplementation in both groups >= 1500 IU/day | 1 | 25 | Risk Ratio (M‐H, Fixed, 95% CI) | 0.0 [0.0, 0.0] |
| 31.19 PUFA >= 400 mg/100 ml milk | 1 | 269 | Risk Ratio (M‐H, Fixed, 95% CI) | 0.68 [0.35, 1.32] |
| 32 Retrolental fibroplasia/retinopathy of prematurity among very low birth weight infants Show forest plot | 5 | | Risk Ratio (M‐H, Fixed, 95% CI) | Subtotals only |
|
| 32.1 All infants in all studies | 5 | 975 | Risk Ratio (M‐H, Fixed, 95% CI) | 0.88 [0.73, 1.07] |
| 32.2 Birth weight <= 1500 grams | 4 | 890 | Risk Ratio (M‐H, Fixed, 95% CI) | 0.86 [0.70, 1.05] |
| 32.3 Birth weight <= 1000 grams | 1 | 85 | Risk Ratio (M‐H, Fixed, 95% CI) | 1.23 [0.60, 2.53] |
| 32.4 Enteral | 1 | 268 | Risk Ratio (M‐H, Fixed, 95% CI) | 0.67 [0.35, 1.31] |
| 32.5 Parenteral with or without enteral | 4 | 707 | Risk Ratio (M‐H, Fixed, 95% CI) | 0.92 [0.75, 1.12] |
| 32.6 Parenteral with hypertonic enteral formulation at pharmacologic dose | 3 | 672 | Risk Ratio (M‐H, Fixed, 95% CI) | 0.92 [0.75, 1.12] |
| 32.7 Intravenous (with or without other routes of administration) | 2 | 630 | Risk Ratio (M‐H, Fixed, 95% CI) | 0.92 [0.74, 1.13] |
| 32.8 Excluding intravenous vitamin E supplementation | 3 | 345 | Risk Ratio (M‐H, Fixed, 95% CI) | 0.75 [0.45, 1.24] |
| 32.9 Total dose of vitamin E in the treatment group <= 30 IU/kg/day | 1 | 268 | Risk Ratio (M‐H, Fixed, 95% CI) | 0.67 [0.35, 1.31] |
| 32.10 Total dose of vitamin E in the treatment group > 30 IU/kg/day | 4 | 707 | Risk Ratio (M‐H, Fixed, 95% CI) | 0.92 [0.75, 1.12] |
| 32.11 Serum tocopherol level in the treatment group <= 3.5 mg/dl | 3 | 388 | Risk Ratio (M‐H, Fixed, 95% CI) | 0.86 [0.53, 1.40] |
| 32.12 Serum tocopherol level in the treatment group > 3.5 mg/dl | 2 | 587 | Risk Ratio (M‐H, Fixed, 95% CI) | 0.89 [0.72, 1.10] |
| 32.13 Onset of vitamin E supplementation in the treatment group within 48 hours of life | 5 | 975 | Risk Ratio (M‐H, Fixed, 95% CI) | 0.88 [0.73, 1.07] |
| 32.14 Duration of treatment <= 1 week | 1 | 35 | Risk Ratio (M‐H, Fixed, 95% CI) | 0.0 [0.0, 0.0] |
| 32.15 Duration of treatment > 1 week | 3 | 395 | Risk Ratio (M‐H, Fixed, 95% CI) | 0.87 [0.58, 1.32] |
| 32.16 Total dose of vitamin E in the control group <= 10 mg vit E/100 kcal | 4 | 933 | Risk Ratio (M‐H, Fixed, 95% CI) | 0.88 [0.72, 1.08] |
| 32.17 Total dose of vitamin E in the control group > 10 mg vit E/100 kcal | 1 | 42 | Risk Ratio (M‐H, Fixed, 95% CI) | 0.91 [0.42, 1.96] |
| 32.18 Iron supplementation >2 mg/kg in both groups | 1 | 10 | Risk Ratio (M‐H, Fixed, 95% CI) | 0.0 [0.0, 0.0] |
| 32.19 Iron supplementation > 2 mg/kg in neither group | 2 | 293 | Risk Ratio (M‐H, Fixed, 95% CI) | 0.67 [0.35, 1.31] |
| 32.20 Vitamin A supplementation in both groups >= 1500 IU/day | 1 | 35 | Risk Ratio (M‐H, Fixed, 95% CI) | 0.0 [0.0, 0.0] |
| 32.21 PUFA >= 400 mg/100 ml milk | 1 | 268 | Risk Ratio (M‐H, Fixed, 95% CI) | 0.67 [0.35, 1.31] |
| 33 Retrolental fibroplasia/retinopathy of prematurity among infants examined/survivors Show forest plot | 8 | | Risk Ratio (M‐H, Fixed, 95% CI) | Subtotals only |
|
| 33.1 All infants in all studies | 8 | 1666 | Risk Ratio (M‐H, Fixed, 95% CI) | 0.90 [0.78, 1.03] |
| 33.2 Enteral | 2 | 354 | Risk Ratio (M‐H, Fixed, 95% CI) | 0.90 [0.66, 1.23] |
| 33.3 Enteral hypertonic formulation at pharmacologic doses | 1 | 129 | Risk Ratio (M‐H, Fixed, 95% CI) | 1.02 [0.72, 1.43] |
| 33.4 Parenteral with or without enteral | 5 | 1261 | Risk Ratio (M‐H, Fixed, 95% CI) | 0.90 [0.77, 1.05] |
| 33.5 Parenteral with hypertonic enteral formulation at pharmacologic dose | 5 | 1261 | Risk Ratio (M‐H, Fixed, 95% CI) | 0.90 [0.77, 1.05] |
| 33.6 Intravenous (with or without other routes of administration) | 2 | 953 | Risk Ratio (M‐H, Fixed, 95% CI) | 0.86 [0.70, 1.04] |
| 33.7 Excluding intravenous supplementation | 6 | 713 | Risk Ratio (M‐H, Fixed, 95% CI) | 0.96 [0.79, 1.15] |
| 33.8 Total dose of vitamin E in the treatment group <= 30 IU/kg/day | 2 | 324 | Risk Ratio (M‐H, Fixed, 95% CI) | 0.74 [0.45, 1.22] |
| 33.9 Total dose of vitamin E in the treatment group > 30 IU/kg/day | 5 | 1291 | Risk Ratio (M‐H, Fixed, 95% CI) | 0.92 [0.80, 1.06] |
| 33.10 Serum tocopherol level in the treatment group <= 3.5 mg/dl | 4 | 687 | Risk Ratio (M‐H, Fixed, 95% CI) | 0.96 [0.80, 1.15] |
| 33.11 Serum tocopherol level in the treatment group > 3.5 mg/dl | 3 | 928 | Risk Ratio (M‐H, Fixed, 95% CI) | 0.84 [0.69, 1.04] |
| 33.12 Onset of vitamin E supplementation in the treatment group within 48 hours of life | 7 | 1615 | Risk Ratio (M‐H, Fixed, 95% CI) | 0.90 [0.78, 1.03] |
| 33.13 Duration of treatment <= 1 week | 1 | 135 | Risk Ratio (M‐H, Fixed, 95% CI) | 1.03 [0.82, 1.28] |
| 33.14 Duration of treatment > 1 week | 6 | 1480 | Risk Ratio (M‐H, Fixed, 95% CI) | 0.87 [0.74, 1.03] |
| 33.15 Total dose of vitamin E in the control group <= 10 mg vit E/100 kcal | 5 | 1406 | Risk Ratio (M‐H, Fixed, 95% CI) | 0.86 [0.73, 1.02] |
| 33.16 Total dose of vitamin E in the control group > 10 mg vit E/100 kcal | 2 | 209 | Risk Ratio (M‐H, Fixed, 95% CI) | 1.04 [0.83, 1.31] |
| 33.17 Iron supplementation >2 mg/kg in both groups | 1 | 51 | Risk Ratio (M‐H, Fixed, 95% CI) | 0.0 [0.0, 0.0] |
| 33.18 Iron supplementation > 2 mg/kg in neither group | 1 | 225 | Risk Ratio (M‐H, Fixed, 95% CI) | 0.70 [0.36, 1.35] |
| 33.19 PUFA >= 400 mg/100 ml milk | 1 | 225 | Risk Ratio (M‐H, Fixed, 95% CI) | 0.70 [0.36, 1.35] |
| 34 Retrolental fibroplasia/retinopathy of prematurity among very low birth weight infants examined Show forest plot | 7 | | Risk Ratio (M‐H, Fixed, 95% CI) | Subtotals only |
|
| 34.1 All infants in all studies | 7 | 1090 | Risk Ratio (M‐H, Fixed, 95% CI) | 0.94 [0.82, 1.07] |
| 34.2 Birth weight <= 1500 grams | 6 | 1054 | Risk Ratio (M‐H, Fixed, 95% CI) | 0.92 [0.81, 1.06] |
| 34.3 Birth weight <= 1000 grams | 3 | 84 | Risk Ratio (M‐H, Fixed, 95% CI) | 1.02 [0.81, 1.29] |
| 34.4 Birth weight > 1000 grams | 3 | 181 | Risk Ratio (M‐H, Fixed, 95% CI) | 1.04 [0.76, 1.42] |
| 34.5 Enteral | 2 | 354 | Risk Ratio (M‐H, Fixed, 95% CI) | 0.90 [0.66, 1.23] |
| 34.6 Enteral hypertonic formulation at pharmacologic doses | 1 | 129 | Risk Ratio (M‐H, Fixed, 95% CI) | 1.02 [0.72, 1.43] |
| 34.7 Parenteral with or without enteral | 5 | 736 | Risk Ratio (M‐H, Fixed, 95% CI) | 0.95 [0.82, 1.09] |
| 34.8 Parenteral with hypertonic enteral formulation at pharmacologic dose | 5 | 736 | Risk Ratio (M‐H, Fixed, 95% CI) | 0.95 [0.82, 1.09] |
| 34.9 Intravenous (with or without other routes of administration) | 2 | 460 | Risk Ratio (M‐H, Fixed, 95% CI) | 0.93 [0.77, 1.12] |
| 34.10 Excluding intravenous supplementation | 5 | 630 | Risk Ratio (M‐H, Fixed, 95% CI) | 0.94 [0.78, 1.13] |
| 34.11 Total dose of vitamin E in the treatment group <= 30 IU/kg/day | 1 | 225 | Risk Ratio (M‐H, Fixed, 95% CI) | 0.70 [0.36, 1.35] |
| 34.12 Total dose of vitamin E in the treatment group > 30 IU/kg/day | 6 | 865 | Risk Ratio (M‐H, Fixed, 95% CI) | 0.96 [0.84, 1.09] |
| 34.13 Serum tocopherol level in the treatment group <= 3.5 mg/dl | 4 | 525 | Risk Ratio (M‐H, Fixed, 95% CI) | 0.98 [0.82, 1.18] |
| 34.14 Serum tocopherol level in the treatment group > 3.5 mg/dl | 3 | 565 | Risk Ratio (M‐H, Fixed, 95% CI) | 0.90 [0.74, 1.08] |
| 34.15 Onset of vitamin E supplementation in the treatment group within 48 hours of life | 7 | 1090 | Risk Ratio (M‐H, Fixed, 95% CI) | 0.94 [0.82, 1.07] |
| 34.16 Duration of treatment <= 1 week | 1 | 135 | Risk Ratio (M‐H, Fixed, 95% CI) | 1.03 [0.82, 1.28] |
| 34.17 Duration of treatment > 1 week | 5 | 531 | Risk Ratio (M‐H, Fixed, 95% CI) | 0.92 [0.72, 1.18] |
| 34.18 Total dose of vitamin E in the control group <= 10 mg vit E/100 kcal | 5 | 913 | Risk Ratio (M‐H, Fixed, 95% CI) | 0.91 [0.78, 1.07] |
| 34.19 Total dose of vitamin E in the control group > 10 mg vit E/100 kcal | 2 | 177 | Risk Ratio (M‐H, Fixed, 95% CI) | 1.01 [0.81, 1.26] |
| 34.20 Iron supplementation > 2 mg/kg in neither group | 1 | 225 | Risk Ratio (M‐H, Fixed, 95% CI) | 0.70 [0.36, 1.35] |
| 34.21 PUFA >= 400 mg/100 ml milk | 1 | 225 | Risk Ratio (M‐H, Fixed, 95% CI) | 0.70 [0.36, 1.35] |
| 35 Severe retrolental fibroplasia/retinopathy of prematurity (grade 3 or worse) Show forest plot | 8 | | Risk Ratio (M‐H, Fixed, 95% CI) | Subtotals only |
|
| 35.1 All infants in all studies | 6 | 1565 | Risk Ratio (M‐H, Fixed, 95% CI) | 0.72 [0.41, 1.25] |
| 35.2 Enteral | 1 | 29 | Risk Ratio (M‐H, Fixed, 95% CI) | 0.0 [0.0, 0.0] |
| 35.3 Parenteral with or without enteral | 5 | 1297 | Risk Ratio (M‐H, Fixed, 95% CI) | 0.73 [0.39, 1.37] |
| 35.4 Parenteral with hypertonic enteral formulation at pharmacologic dose | 4 | 1268 | Risk Ratio (M‐H, Fixed, 95% CI) | 0.74 [0.41, 1.37] |
| 35.5 Intravenous (with or without other routes of administration) | 2 | 1042 | Risk Ratio (M‐H, Fixed, 95% CI) | 0.86 [0.43, 1.72] |
| 35.6 Excluding intravenous vitamin E supplementation | 4 | 523 | Risk Ratio (M‐H, Fixed, 95% CI) | 0.51 [0.20, 1.35] |
| 35.7 Total dose of vitamin E in the treatment group <= 30 IU/kg/day | 3 | 423 | Risk Ratio (M‐H, Fixed, 95% CI) | 0.50 [0.15, 1.64] |
| 35.8 Total dose of vitamin E in the treatment group > 30 IU/kg/day | 3 | 1142 | Risk Ratio (M‐H, Fixed, 95% CI) | 0.79 [0.41, 1.52] |
| 35.9 Serum tocopherol level in the treatment group <= 3.5 mg/dl | 3 | 584 | Risk Ratio (M‐H, Fixed, 95% CI) | 1.11 [0.53, 2.31] |
| 35.10 Serum tocopherol level in the treatment group > 3.5 mg/dl | 3 | 981 | Risk Ratio (M‐H, Fixed, 95% CI) | 0.39 [0.16, 1.00] |
| 35.11 Onset of vitamin E supplementation in the treatment group within 48 hours of life | 8 | 1882 | Risk Ratio (M‐H, Fixed, 95% CI) | 0.68 [0.40, 1.14] |
| 35.12 Duration of treatment > 1 week | 6 | 1565 | Risk Ratio (M‐H, Fixed, 95% CI) | 0.72 [0.41, 1.25] |
| 35.13 Total dose of vitamin E in the control group <= 10 mg vit E/100 kcal | 5 | 1465 | Risk Ratio (M‐H, Fixed, 95% CI) | 0.76 [0.42, 1.35] |
| 35.14 Total dose of vitamin E in the control group > 10 mg vit E/100 kcal | 1 | 100 | Risk Ratio (M‐H, Fixed, 95% CI) | 0.38 [0.04, 3.49] |
| 35.15 Iron supplementation > 2 mg/kg in neither group | 1 | 268 | Risk Ratio (M‐H, Fixed, 95% CI) | 0.59 [0.14, 2.42] |
| 35.16 PUFA >= 400 mg/100 ml milk | 1 | 268 | Risk Ratio (M‐H, Fixed, 95% CI) | 0.59 [0.14, 2.42] |
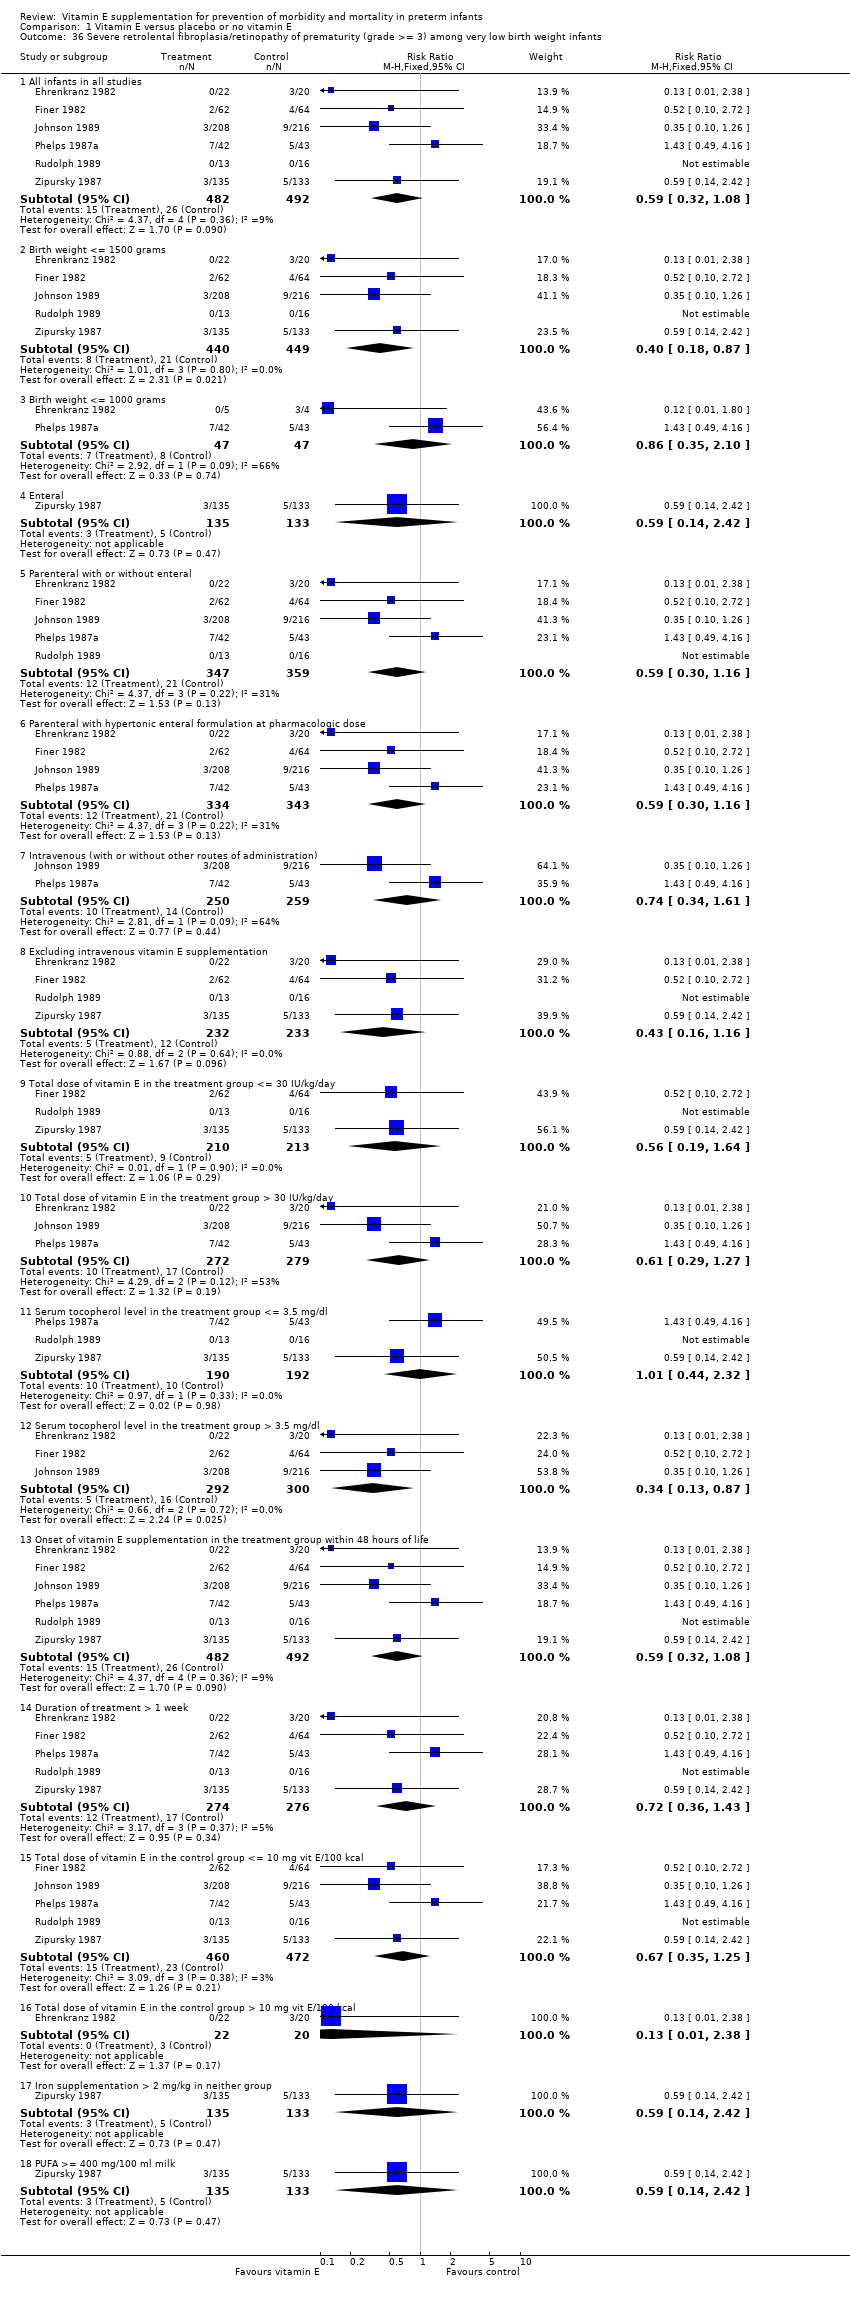
| 36 Severe retrolental fibroplasia/retinopathy of prematurity (grade >= 3) among very low birth weight infants Show forest plot | 6 | | Risk Ratio (M‐H, Fixed, 95% CI) | Subtotals only |
|
| 36.1 All infants in all studies | 6 | 974 | Risk Ratio (M‐H, Fixed, 95% CI) | 0.59 [0.32, 1.08] |
| 36.2 Birth weight <= 1500 grams | 5 | 889 | Risk Ratio (M‐H, Fixed, 95% CI) | 0.40 [0.18, 0.87] |
| 36.3 Birth weight <= 1000 grams | 2 | 94 | Risk Ratio (M‐H, Fixed, 95% CI) | 0.86 [0.35, 2.10] |
| 36.4 Enteral | 1 | 268 | Risk Ratio (M‐H, Fixed, 95% CI) | 0.59 [0.14, 2.42] |
| 36.5 Parenteral with or without enteral | 5 | 706 | Risk Ratio (M‐H, Fixed, 95% CI) | 0.59 [0.30, 1.16] |
| 36.6 Parenteral with hypertonic enteral formulation at pharmacologic dose | 4 | 677 | Risk Ratio (M‐H, Fixed, 95% CI) | 0.59 [0.30, 1.16] |
| 36.7 Intravenous (with or without other routes of administration) | 2 | 509 | Risk Ratio (M‐H, Fixed, 95% CI) | 0.74 [0.34, 1.61] |
| 36.8 Excluding intravenous vitamin E supplementation | 4 | 465 | Risk Ratio (M‐H, Fixed, 95% CI) | 0.43 [0.16, 1.16] |
| 36.9 Total dose of vitamin E in the treatment group <= 30 IU/kg/day | 3 | 423 | Risk Ratio (M‐H, Fixed, 95% CI) | 0.56 [0.19, 1.64] |
| 36.10 Total dose of vitamin E in the treatment group > 30 IU/kg/day | 3 | 551 | Risk Ratio (M‐H, Fixed, 95% CI) | 0.61 [0.29, 1.27] |
| 36.11 Serum tocopherol level in the treatment group <= 3.5 mg/dl | 3 | 382 | Risk Ratio (M‐H, Fixed, 95% CI) | 1.01 [0.44, 2.32] |
| 36.12 Serum tocopherol level in the treatment group > 3.5 mg/dl | 3 | 592 | Risk Ratio (M‐H, Fixed, 95% CI) | 0.34 [0.13, 0.87] |
| 36.13 Onset of vitamin E supplementation in the treatment group within 48 hours of life | 6 | 974 | Risk Ratio (M‐H, Fixed, 95% CI) | 0.59 [0.32, 1.08] |
| 36.14 Duration of treatment > 1 week | 5 | 550 | Risk Ratio (M‐H, Fixed, 95% CI) | 0.72 [0.36, 1.43] |
| 36.15 Total dose of vitamin E in the control group <= 10 mg vit E/100 kcal | 5 | 932 | Risk Ratio (M‐H, Fixed, 95% CI) | 0.67 [0.35, 1.25] |
| 36.16 Total dose of vitamin E in the control group > 10 mg vit E/100 kcal | 1 | 42 | Risk Ratio (M‐H, Fixed, 95% CI) | 0.13 [0.01, 2.38] |
| 36.17 Iron supplementation > 2 mg/kg in neither group | 1 | 268 | Risk Ratio (M‐H, Fixed, 95% CI) | 0.59 [0.14, 2.42] |
| 36.18 PUFA >= 400 mg/100 ml milk | 1 | 268 | Risk Ratio (M‐H, Fixed, 95% CI) | 0.59 [0.14, 2.42] |
| 37 Severe retrolental fibroplasia/retinopathy of prematurity (grade 3 or worse) among patients examined Show forest plot | 7 | | Risk Ratio (M‐H, Fixed, 95% CI) | Subtotals only |
|
| 37.1 All infants in all studies | 7 | 1587 | Risk Ratio (M‐H, Fixed, 95% CI) | 0.67 [0.40, 1.12] |
| 37.2 Enteral | 2 | 326 | Risk Ratio (M‐H, Fixed, 95% CI) | 0.34 [0.10, 1.13] |
| 37.3 Enteral hypertonic formulation at pharmacologic doses | 1 | 101 | Risk Ratio (M‐H, Fixed, 95% CI) | 0.09 [0.01, 1.63] |
| 37.4 Parenteral or both parenteral and enteral | 5 | 1261 | Risk Ratio (M‐H, Fixed, 95% CI) | 0.81 [0.46, 1.44] |
| 37.5 Parenteral with hypertonic enteral formulation at pharmacologic dose | 4 | 1162 | Risk Ratio (M‐H, Fixed, 95% CI) | 0.87 [0.47, 1.60] |
| 37.6 Intravenous (with or without other routes of administration) | 2 | 953 | Risk Ratio (M‐H, Fixed, 95% CI) | 0.84 [0.42, 1.66] |
| 37.7 Excluding intravenous vitamin E supplementation | 5 | 634 | Risk Ratio (M‐H, Fixed, 95% CI) | 0.52 [0.24, 1.13] |
| 37.8 Total dose of vitamin E in the treatment group <= 30 IU/kg/day | 2 | 324 | Risk Ratio (M‐H, Fixed, 95% CI) | 0.58 [0.20, 1.69] |
| 37.9 Total dose of vitamin E in the treatment group > 30 IU/kg/day | 5 | 1263 | Risk Ratio (M‐H, Fixed, 95% CI) | 0.71 [0.39, 1.26] |
| 37.10 Serum tocopherol level in the treatment group <= 3.5 mg/dl | 4 | 659 | Risk Ratio (M‐H, Fixed, 95% CI) | 0.90 [0.48, 1.69] |
| 37.11 Serum tocopherol level in the treatment group > 3.5 mg/dl | 3 | 928 | Risk Ratio (M‐H, Fixed, 95% CI) | 0.39 [0.15, 0.98] |
| 37.12 Onset of vitamin E supplementation in the treatment group within 48 hours of life | 7 | 1587 | Risk Ratio (M‐H, Fixed, 95% CI) | 0.67 [0.40, 1.12] |
| 37.13 Duration of treatment <= 1 week (7 days) | 1 | 135 | Risk Ratio (M‐H, Fixed, 95% CI) | 2.96 [0.32, 27.71] |
| 37.14 Duration of treatment > 1 week | 5 | 697 | Risk Ratio (M‐H, Fixed, 95% CI) | 0.70 [0.39, 1.26] |
| 37.15 Total dose of vitamin E in the control group <= 10 mg vit E/100 kcal | 5 | 1378 | Risk Ratio (M‐H, Fixed, 95% CI) | 0.63 [0.36, 1.10] |
| 37.16 Total dose of vitamin E in the control group > 10 mg vit E/100 kcal | 2 | 209 | Risk Ratio (M‐H, Fixed, 95% CI) | 0.99 [0.25, 3.89] |
| 37.17 Iron supplementation > 2 mg/kg in neither group | 1 | 225 | Risk Ratio (M‐H, Fixed, 95% CI) | 0.62 [0.15, 2.52] |
| 37.18 PUFA >= 400 mg/100 ml milk | 1 | 225 | Risk Ratio (M‐H, Fixed, 95% CI) | 0.62 [0.15, 2.52] |
| 38 Severe retrolental fibroplasia/retinopathy of prematurity among very low birth weight infants examined Show forest plot | 7 | | Risk Ratio (M‐H, Fixed, 95% CI) | Subtotals only |
|
| 38.1 All infants in all studies | 7 | 1062 | Risk Ratio (M‐H, Fixed, 95% CI) | 0.58 [0.34, 1.00] |
| 38.2 Birth weight <= 1500 grams | 6 | 1026 | Risk Ratio (M‐H, Fixed, 95% CI) | 0.44 [0.22, 0.85] |
| 38.3 Birth weight <= 1000 grams | 3 | 94 | Risk Ratio (M‐H, Fixed, 95% CI) | 1.02 [0.48, 2.19] |
| 38.4 Birth weight > 1000 grams | 3 | 181 | Risk Ratio (M‐H, Fixed, 95% CI) | 0.35 [0.02, 8.39] |
| 38.5 Enteral | 2 | 326 | Risk Ratio (M‐H, Fixed, 95% CI) | 0.34 [0.10, 1.13] |
| 38.6 Enteral hypertonic formulation at pharmacologic doses | 1 | 101 | Risk Ratio (M‐H, Fixed, 95% CI) | 0.09 [0.01, 1.63] |
| 38.7 Parenteral or both parenteral and enteral | 5 | 736 | Risk Ratio (M‐H, Fixed, 95% CI) | 0.70 [0.38, 1.28] |
| 38.8 Parenteral with hypertonic enteral formulation at pharmacologic dose | 5 | 736 | Risk Ratio (M‐H, Fixed, 95% CI) | 0.70 [0.38, 1.28] |
| 38.9 Intravenous (with or without other routes of administration) | 2 | 460 | Risk Ratio (M‐H, Fixed, 95% CI) | 0.73 [0.35, 1.52] |
| 38.10 Excluding intravenous vitamin E supplementation | 5 | 602 | Risk Ratio (M‐H, Fixed, 95% CI) | 0.48 [0.22, 1.04] |
| 38.11 Total dose of vitamin E in the treatment group <= 30 IU/kg/day | 2 | 324 | Risk Ratio (M‐H, Fixed, 95% CI) | 0.58 [0.20, 1.69] |
| 38.12 Total dose of vitamin E in the treatment group > 30 IU/kg/day | 5 | 738 | Risk Ratio (M‐H, Fixed, 95% CI) | 0.59 [0.32, 1.09] |
| 38.13 Serum tocopherol level in the treatment group <= 3.5 mg/dl | 4 | 497 | Risk Ratio (M‐H, Fixed, 95% CI) | 0.83 [0.42, 1.61] |
| 38.14 Serum tocopherol level in the treatment group > 3.5 mg/dl | 3 | 565 | Risk Ratio (M‐H, Fixed, 95% CI) | 0.34 [0.13, 0.88] |
| 38.15 Onset of vitamin E supplementation in the treatment group within 48 hours of life | 7 | 1062 | Risk Ratio (M‐H, Fixed, 95% CI) | 0.58 [0.34, 1.00] |
| 38.16 Duration of treatment <= 1 week (7 days) | 1 | 135 | Risk Ratio (M‐H, Fixed, 95% CI) | 2.96 [0.32, 27.71] |
| 38.17 Duration of treatment > 1 week | 5 | 503 | Risk Ratio (M‐H, Fixed, 95% CI) | 0.57 [0.30, 1.07] |
| 38.18 Total dose of vitamin E in the control group <= 10 mg vit E/100 kcal | 5 | 885 | Risk Ratio (M‐H, Fixed, 95% CI) | 0.56 [0.31, 1.00] |
| 38.19 Total dose of vitamin E in the control group > 10 mg vit E/100 kcal | 2 | 177 | Risk Ratio (M‐H, Fixed, 95% CI) | 0.74 [0.19, 2.88] |
| 38.20 Iron supplementation > 2 mg/kg in neither group | 1 | 225 | Risk Ratio (M‐H, Fixed, 95% CI) | 0.62 [0.15, 2.52] |
| 38.21 PUFA >= 400 mg/100 ml milk | 1 | 225 | Risk Ratio (M‐H, Fixed, 95% CI) | 0.62 [0.15, 2.52] |
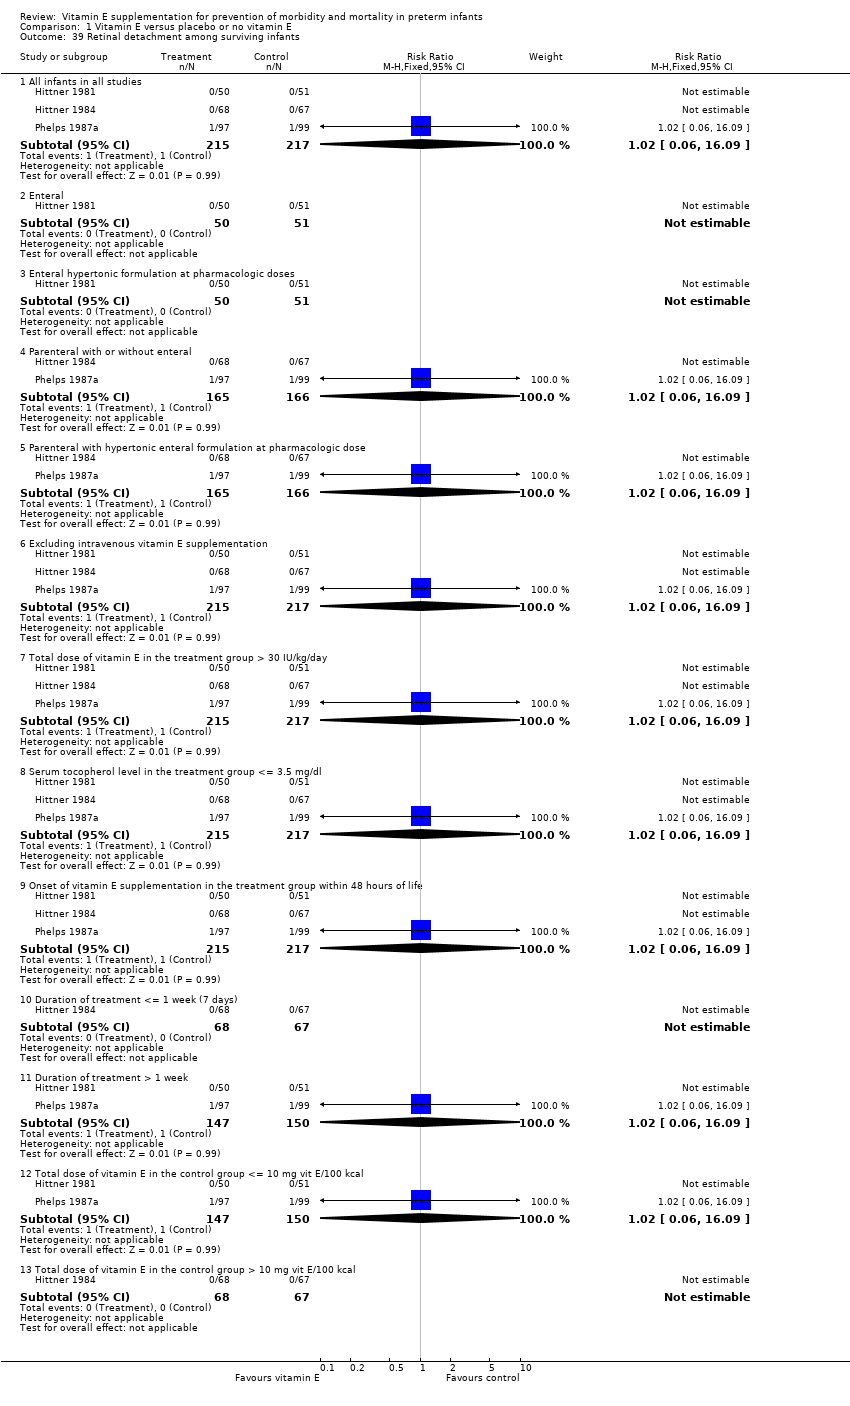
| 39 Retinal detachment among surviving infants Show forest plot | 3 | | Risk Ratio (M‐H, Fixed, 95% CI) | Subtotals only |
|
| 39.1 All infants in all studies | 3 | 432 | Risk Ratio (M‐H, Fixed, 95% CI) | 1.02 [0.06, 16.09] |
| 39.2 Enteral | 1 | 101 | Risk Ratio (M‐H, Fixed, 95% CI) | 0.0 [0.0, 0.0] |
| 39.3 Enteral hypertonic formulation at pharmacologic doses | 1 | 101 | Risk Ratio (M‐H, Fixed, 95% CI) | 0.0 [0.0, 0.0] |
| 39.4 Parenteral with or without enteral | 2 | 331 | Risk Ratio (M‐H, Fixed, 95% CI) | 1.02 [0.06, 16.09] |
| 39.5 Parenteral with hypertonic enteral formulation at pharmacologic dose | 2 | 331 | Risk Ratio (M‐H, Fixed, 95% CI) | 1.02 [0.06, 16.09] |
| 39.6 Excluding intravenous vitamin E supplementation | 3 | 432 | Risk Ratio (M‐H, Fixed, 95% CI) | 1.02 [0.06, 16.09] |
| 39.7 Total dose of vitamin E in the treatment group > 30 IU/kg/day | 3 | 432 | Risk Ratio (M‐H, Fixed, 95% CI) | 1.02 [0.06, 16.09] |
| 39.8 Serum tocopherol level in the treatment group <= 3.5 mg/dl | 3 | 432 | Risk Ratio (M‐H, Fixed, 95% CI) | 1.02 [0.06, 16.09] |
| 39.9 Onset of vitamin E supplementation in the treatment group within 48 hours of life | 3 | 432 | Risk Ratio (M‐H, Fixed, 95% CI) | 1.02 [0.06, 16.09] |
| 39.10 Duration of treatment <= 1 week (7 days) | 1 | 135 | Risk Ratio (M‐H, Fixed, 95% CI) | 0.0 [0.0, 0.0] |
| 39.11 Duration of treatment > 1 week | 2 | 297 | Risk Ratio (M‐H, Fixed, 95% CI) | 1.02 [0.06, 16.09] |
| 39.12 Total dose of vitamin E in the control group <= 10 mg vit E/100 kcal | 2 | 297 | Risk Ratio (M‐H, Fixed, 95% CI) | 1.02 [0.06, 16.09] |
| 39.13 Total dose of vitamin E in the control group > 10 mg vit E/100 kcal | 1 | 135 | Risk Ratio (M‐H, Fixed, 95% CI) | 0.0 [0.0, 0.0] |
| 40 Retinal detachment among surviving very low birth weight infants Show forest plot | 3 | | Risk Ratio (M‐H, Fixed, 95% CI) | Subtotals only |
|
| 40.1 All infants in all studies | 3 | 321 | Risk Ratio (M‐H, Fixed, 95% CI) | 1.02 [0.07, 15.84] |
| 40.2 Birth weight <= 1500 grams | 2 | 236 | Risk Ratio (M‐H, Fixed, 95% CI) | 0.0 [0.0, 0.0] |
| 40.3 Birth weight <= 1000 grams | 2 | 134 | Risk Ratio (M‐H, Fixed, 95% CI) | 1.02 [0.07, 15.84] |
| 40.4 Enteral | 1 | 101 | Risk Ratio (M‐H, Fixed, 95% CI) | 0.0 [0.0, 0.0] |
| 40.5 Enteral hypertonic formulation at pharmacologic doses | 1 | 101 | Risk Ratio (M‐H, Fixed, 95% CI) | 0.0 [0.0, 0.0] |
| 40.6 Parenteral with or without enteral | 2 | 220 | Risk Ratio (M‐H, Fixed, 95% CI) | 1.02 [0.07, 15.84] |
| 40.7 Parenteral with hypertonic enteral formulation at pharmacologic dose | 2 | 220 | Risk Ratio (M‐H, Fixed, 95% CI) | 1.02 [0.07, 15.84] |
| 40.8 Excluding intravenous vitamin E supplementation | 3 | 321 | Risk Ratio (M‐H, Fixed, 95% CI) | 1.02 [0.07, 15.84] |
| 40.9 Total dose of vitamin E in the treatment group > 30 IU/kg/day | 3 | 321 | Risk Ratio (M‐H, Fixed, 95% CI) | 1.02 [0.07, 15.84] |
| 40.10 Serum tocopherol level in the treatment group <= 3.5 mg/dl | 3 | 321 | Risk Ratio (M‐H, Fixed, 95% CI) | 1.02 [0.07, 15.84] |
| 40.11 Onset of vitamin E supplementation in the treatment group within 48 hours of life | 3 | 321 | Risk Ratio (M‐H, Fixed, 95% CI) | 1.02 [0.07, 15.84] |
| 40.12 Duration of treatment <= 1 week | 1 | 135 | Risk Ratio (M‐H, Fixed, 95% CI) | 0.0 [0.0, 0.0] |
| 40.13 Duration of treatment > 1 week | 2 | 186 | Risk Ratio (M‐H, Fixed, 95% CI) | 1.02 [0.07, 15.84] |
| 40.14 Total dose of vitamin E in the control group <= 10 mg vit E/100 kcal | 2 | 186 | Risk Ratio (M‐H, Fixed, 95% CI) | 1.02 [0.07, 15.84] |
| 40.15 Total dose of vitamin E in the control group > 10 mg vit E/100 kcal | 1 | 135 | Risk Ratio (M‐H, Fixed, 95% CI) | 0.0 [0.0, 0.0] |
| 41 Cicatricial retrolental fibroplasia, any stage, among patients examined after discharge Show forest plot | 5 | | Risk Ratio (M‐H, Fixed, 95% CI) | Subtotals only |
|
| 41.1 All infants in all studies | 5 | 1052 | Risk Ratio (M‐H, Fixed, 95% CI) | 0.82 [0.52, 1.27] |
| 41.2 Enteral | 1 | 101 | Risk Ratio (M‐H, Fixed, 95% CI) | 0.37 [0.13, 1.09] |
| 41.3 Enteral hypertonic formulation at pharmacologic doses | 1 | 101 | Risk Ratio (M‐H, Fixed, 95% CI) | 0.37 [0.13, 1.09] |
| 41.4 Parenteral with or without enteral | 4 | 951 | Risk Ratio (M‐H, Fixed, 95% CI) | 0.99 [0.60, 1.62] |
| 41.5 Parenteral with hypertonic enteral formulation at pharmacologic dose | 4 | 951 | Risk Ratio (M‐H, Fixed, 95% CI) | 0.99 [0.60, 1.62] |
| 41.6 Intravenous (with or without other routes of administration) | 2 | 778 | Risk Ratio (M‐H, Fixed, 95% CI) | 1.10 [0.55, 2.22] |
| 41.7 Excluding intravenous vitamin E supplementation | 3 | 274 | Risk Ratio (M‐H, Fixed, 95% CI) | 0.65 [0.37, 1.16] |
| 41.8 Total dose of vitamin E in the treatment group <= 30 IU/kg/day | 1 | 99 | Risk Ratio (M‐H, Fixed, 95% CI) | 0.53 [0.14, 2.01] |
| 41.9 Total dose of vitamin E in the treatment group > 30 IU/kg/day | 4 | 953 | Risk Ratio (M‐H, Fixed, 95% CI) | 0.87 [0.54, 1.39] |
| 41.10 Serum tocopherol level in the treatment group <= 3.5 mg/dl | 2 | 297 | Risk Ratio (M‐H, Fixed, 95% CI) | 0.60 [0.25, 1.44] |
| 41.11 Serum tocopherol level in the treatment group > 3.5 mg/dl | 3 | 755 | Risk Ratio (M‐H, Fixed, 95% CI) | 0.91 [0.55, 1.53] |
| 41.12 Onset of vitamin E supplementation in the treatment group within 48 hours of life | 5 | 1052 | Risk Ratio (M‐H, Fixed, 95% CI) | 0.82 [0.52, 1.27] |
| 41.13 Duration of treatment > 1 week | 4 | 470 | Risk Ratio (M‐H, Fixed, 95% CI) | 0.75 [0.43, 1.29] |
| 41.14 Total dose of vitamin E in the control group <= 10 mg vit E/100 kcal | 4 | 978 | Risk Ratio (M‐H, Fixed, 95% CI) | 0.74 [0.44, 1.24] |
| 41.15 Total dose of vitamin E in the control group > 10 mg vit E/100 kcal | 1 | 74 | Risk Ratio (M‐H, Fixed, 95% CI) | 1.13 [0.49, 2.60] |
| 42 Cicatricial retrolental fibroplasia, any stage, among very low birth weight infants examined after discharge Show forest plot | 5 | | Risk Ratio (M‐H, Fixed, 95% CI) | Subtotals only |
|
| 42.1 All infants in all studies | 5 | 858 | Risk Ratio (M‐H, Fixed, 95% CI) | 0.75 [0.48, 1.15] |
| 42.2 Birth weight <= 1500 grams | 4 | 824 | Risk Ratio (M‐H, Fixed, 95% CI) | 0.71 [0.45, 1.12] |
| 42.3 Birth weight <= 1000 grams | 3 | 82 | Risk Ratio (M‐H, Fixed, 95% CI) | 0.56 [0.26, 1.19] |
| 42.4 Enteral | 1 | 101 | Risk Ratio (M‐H, Fixed, 95% CI) | 0.37 [0.13, 1.09] |
| 42.5 Enteral hypertonic formulation at pharmacologic doses | 1 | 101 | Risk Ratio (M‐H, Fixed, 95% CI) | 0.37 [0.13, 1.09] |
| 42.6 Parenteral with or without enteral | 4 | 757 | Risk Ratio (M‐H, Fixed, 95% CI) | 0.88 [0.55, 1.43] |
| 42.7 Parenteral with hypertonic enteral formulation at pharmacologic dose | 4 | 757 | Risk Ratio (M‐H, Fixed, 95% CI) | 0.88 [0.55, 1.43] |
| 42.8 Intravenous (with or without other routes of administration) | 2 | 616 | Risk Ratio (M‐H, Fixed, 95% CI) | 1.01 [0.51, 1.99] |
| 42.9 Excluding intravenous vitamin E supplementation | 3 | 242 | Risk Ratio (M‐H, Fixed, 95% CI) | 0.59 [0.33, 1.04] |
| 42.10 Total dose of vitamin E in the treatment group <= 30 IU/kg/day | 1 | 99 | Risk Ratio (M‐H, Fixed, 95% CI) | 0.53 [0.14, 2.01] |
| 42.11 Total dose of vitamin E in the treatment group > 30 IU/kg/day | 4 | 759 | Risk Ratio (M‐H, Fixed, 95% CI) | 0.78 [0.49, 1.24] |
| 42.12 Serum tocopherol level in the treatment group <= 3.5 mg/dl | 2 | 135 | Risk Ratio (M‐H, Fixed, 95% CI) | 0.53 [0.22, 1.26] |
| 42.13 Serum tocopherol level in the treatment group > 3.5 mg/dl | 3 | 723 | Risk Ratio (M‐H, Fixed, 95% CI) | 0.85 [0.51, 1.41] |
| 42.14 Onset of vitamin E supplementation in the treatment group within 48 hours of life | 5 | 858 | Risk Ratio (M‐H, Fixed, 95% CI) | 0.75 [0.48, 1.15] |
| 42.15 Duration of treatment > 1 week | 4 | 276 | Risk Ratio (M‐H, Fixed, 95% CI) | 0.65 [0.38, 1.10] |
| 42.16 Total dose of vitamin E in the control group <= 10 mg vit E/100 kcal | 4 | 816 | Risk Ratio (M‐H, Fixed, 95% CI) | 0.70 [0.42, 1.18] |
| 42.17 Total dose of vitamin E in the control group > 10 mg vit E/100 kcal | 1 | 42 | Risk Ratio (M‐H, Fixed, 95% CI) | 0.91 [0.42, 1.96] |
| 43 Blindness from retrolental fibroplasia among very low birth weight infants examined Show forest plot | 4 | | Risk Ratio (M‐H, Fixed, 95% CI) | Subtotals only |
|
| 43.1 All infants in all studies | 4 | 467 | Risk Ratio (M‐H, Fixed, 95% CI) | 0.29 [0.10, 0.88] |
| 43.2 Birth weight <= 1500 grams | 4 | 467 | Risk Ratio (M‐H, Fixed, 95% CI) | 0.29 [0.10, 0.88] |
| 43.3 Birth weight <= 1000 grams | 2 | 48 | Risk Ratio (M‐H, Fixed, 95% CI) | 0.11 [0.01, 1.84] |
| 43.4 Enteral | 2 | 326 | Risk Ratio (M‐H, Fixed, 95% CI) | 0.34 [0.10, 1.13] |
| 43.5 Enteral hypertonic formulation at pharmacologic dose | 1 | 101 | Risk Ratio (M‐H, Fixed, 95% CI) | 0.09 [0.01, 1.63] |
| 43.6 Parenteral with or without enteral | 2 | 141 | Risk Ratio (M‐H, Fixed, 95% CI) | 0.15 [0.01, 2.86] |
| 43.7 Parenteral with hypertonic enteral formulation at pharmacologic dose | 2 | 141 | Risk Ratio (M‐H, Fixed, 95% CI) | 0.15 [0.01, 2.86] |
| 43.8 Excluding intravenous vitamin E supplementation | 4 | 467 | Risk Ratio (M‐H, Fixed, 95% CI) | 0.29 [0.10, 0.88] |
| 43.9 Total dose of vitamin E in the treatment group <= 30 IU/kg/day | 2 | 324 | Risk Ratio (M‐H, Fixed, 95% CI) | 0.43 [0.12, 1.46] |
| 43.10 Total dose of vitamin E in the treatment group > 30 IU/kg/day | 2 | 143 | Risk Ratio (M‐H, Fixed, 95% CI) | 0.09 [0.01, 1.63] |
| 43.11 Serum tocopherol level in the treatment group <= 3.5 mg/dl | 2 | 326 | Risk Ratio (M‐H, Fixed, 95% CI) | 0.34 [0.10, 1.13] |
| 43.12 Serum tocopherol level in the treatment group > 3.5 mg/dl | 2 | 141 | Risk Ratio (M‐H, Fixed, 95% CI) | 0.15 [0.01, 2.86] |
| 43.13 Onset of vitamin E supplementation in the treatment group within 48 hours of life | 4 | 467 | Risk Ratio (M‐H, Fixed, 95% CI) | 0.29 [0.10, 0.88] |
| 43.14 Duration of treatment > 1 week | 4 | 467 | Risk Ratio (M‐H, Fixed, 95% CI) | 0.29 [0.10, 0.88] |
| 43.15 Total dose of vitamin E in the control group <= 10 mg vit E/100 kcal | 3 | 425 | Risk Ratio (M‐H, Fixed, 95% CI) | 0.29 [0.10, 0.88] |
| 43.16 Total dose of vitamin E in the control group > 10 mg vit E/100 kcal | 1 | 42 | Risk Ratio (M‐H, Fixed, 95% CI) | 0.0 [0.0, 0.0] |
| 43.17 Iron supplementation > 2 mg/kg/day in neither group | 1 | 225 | Risk Ratio (M‐H, Fixed, 95% CI) | 0.62 [0.15, 2.52] |
| 43.18 PUFA >= 400 mg/100 ml milk | 1 | 225 | Risk Ratio (M‐H, Fixed, 95% CI) | 0.62 [0.15, 2.52] |
| 44 Necrotizing enterocolitis Show forest plot | 8 | | Risk Ratio (M‐H, Fixed, 95% CI) | Subtotals only |
|
| 44.1 All infants in all studies | 8 | 1443 | Risk Ratio (M‐H, Fixed, 95% CI) | 1.37 [0.96, 1.95] |
| 44.2 Enteral | 1 | 30 | Risk Ratio (M‐H, Fixed, 95% CI) | 3.0 [0.13, 68.26] |
| 44.3 Parenteral with or without enteral | 7 | 1413 | Risk Ratio (M‐H, Fixed, 95% CI) | 1.35 [0.94, 1.93] |
| 44.4 Parenteral with hypertonic enteral formulation at pharmacologic dose | 4 | 1105 | Risk Ratio (M‐H, Fixed, 95% CI) | 1.29 [0.89, 1.86] |
| 44.5 Intravenous (with or without other routes of supplementation) | 2 | 832 | Risk Ratio (M‐H, Fixed, 95% CI) | 1.44 [0.95, 2.19] |
| 44.6 Excluding intravenous vitamin E supplementation | 6 | 611 | Risk Ratio (M‐H, Fixed, 95% CI) | 1.18 [0.59, 2.35] |
| 44.7 Total dose of vitamin E in the treatment group <= 30 IU/kg/day | 4 | 434 | Risk Ratio (M‐H, Fixed, 95% CI) | 1.60 [0.66, 3.88] |
| 44.8 Total dose of vitamin E in the treatment group > 30 IU/kg/day | 3 | 979 | Risk Ratio (M‐H, Fixed, 95% CI) | 1.30 [0.88, 1.93] |
| 44.9 Serum tocopherol level in the treatment group <= 3.5 mg/dl | 5 | 625 | Risk Ratio (M‐H, Fixed, 95% CI) | 1.58 [0.65, 3.81] |
| 44.10 Serum tocopherol level in the treatment group > 3.5 mg/dl | 3 | 818 | Risk Ratio (M‐H, Fixed, 95% CI) | 1.33 [0.90, 1.95] |
| 44.11 Onset of vitamin E supplementation in the treatment group within 48 hours of life | 7 | 1413 | Risk Ratio (M‐H, Fixed, 95% CI) | 1.35 [0.94, 1.93] |
| 44.12 Onset of treatment after 48 hours of life | 1 | 30 | Risk Ratio (M‐H, Fixed, 95% CI) | 3.0 [0.13, 68.26] |
| 44.13 Duration of treatment <= 1 week | 2 | 279 | Risk Ratio (M‐H, Fixed, 95% CI) | 6.88 [0.36, 131.68] |
| 44.14 Duration of treatment > 1 week | 5 | 619 | Risk Ratio (M‐H, Fixed, 95% CI) | 0.99 [0.53, 1.83] |
| 44.15 Total dose of vitamin E in the control group <= 10 mg vit E/100 kcal | 7 | 1296 | Risk Ratio (M‐H, Fixed, 95% CI) | 1.49 [1.03, 2.16] |
| 44.16 Total dose of vitamin E in the control group > 10 mg vit E/100 kcal | 1 | 147 | Risk Ratio (M‐H, Fixed, 95% CI) | 0.51 [0.13, 1.95] |
| 44.17 Iron supplementation > 2 mg/kg/day in both groups | 1 | 30 | Risk Ratio (M‐H, Fixed, 95% CI) | 3.0 [0.13, 68.26] |
| 45 Necrotizing enterocolitis among very low birth weight infants Show forest plot | 6 | | Risk Ratio (M‐H, Fixed, 95% CI) | Subtotals only |
|
| 45.1 All infants in all studies | 6 | 962 | Risk Ratio (M‐H, Fixed, 95% CI) | 1.29 [0.90, 1.87] |
| 45.2 Birth weight <= 1500 grams | 4 | 730 | Risk Ratio (M‐H, Fixed, 95% CI) | 1.49 [0.99, 2.22] |
| 45.3 Birth weight <= 1000 grams | 2 | 232 | Risk Ratio (M‐H, Fixed, 95% CI) | 0.61 [0.23, 1.62] |
| 45.4 Enteral | 1 | 30 | Risk Ratio (M‐H, Fixed, 95% CI) | 3.0 [0.13, 68.26] |
| 45.5 Parenteral with or without enteral | 5 | 932 | Risk Ratio (M‐H, Fixed, 95% CI) | 1.27 [0.88, 1.85] |
| 45.6 Parenteral with hypertonic enteral formulation at pharmacologic dose | 4 | 903 | Risk Ratio (M‐H, Fixed, 95% CI) | 1.28 [0.88, 1.85] |
| 45.7 Intravenous (with or without other routes of supplementation) | 2 | 630 | Risk Ratio (M‐H, Fixed, 95% CI) | 1.43 [0.94, 2.19] |
| 45.8 Excluding intravenous vitamin E supplementation | 4 | 332 | Risk Ratio (M‐H, Fixed, 95% CI) | 0.96 [0.46, 2.01] |
| 45.9 Total dose of vitamin E in the treatment group <= 30 IU/kg/day | 2 | 155 | Risk Ratio (M‐H, Fixed, 95% CI) | 1.21 [0.46, 3.17] |
| 45.10 Total dose of vitamin E in the treatment group > 30 IU/kg/day | 3 | 777 | Risk Ratio (M‐H, Fixed, 95% CI) | 1.29 [0.86, 1.92] |
| 45.11 Serum tocopherol level in the treatment group <= 3.5 mg/dl | 3 | 144 | Risk Ratio (M‐H, Fixed, 95% CI) | 1.05 [0.34, 3.29] |
| 45.12 Serum tocopherol level in the treatment group > 3.5 mg/dl | 3 | 818 | Risk Ratio (M‐H, Fixed, 95% CI) | 1.33 [0.90, 1.95] |
| 45.13 Onset of vitamin E supplementation in the treatment group within 48 hours of life | 5 | 932 | Risk Ratio (M‐H, Fixed, 95% CI) | 1.27 [0.88, 1.85] |
| 45.14 Onset of treatment after 48 hours of life | 1 | 30 | Risk Ratio (M‐H, Fixed, 95% CI) | 3.0 [0.13, 68.26] |
| 45.15 Duration of treatment > 1 week | 5 | 417 | Risk Ratio (M‐H, Fixed, 95% CI) | 0.92 [0.48, 1.76] |
| 45.16 Total dose of vitamin E in the control group <= 10 mg vit E/100 kcal | 5 | 815 | Risk Ratio (M‐H, Fixed, 95% CI) | 1.41 [0.96, 2.08] |
| 45.17 Total dose of vitamin E in the control group > 10 mg vit E/100 kcal | 1 | 147 | Risk Ratio (M‐H, Fixed, 95% CI) | 0.51 [0.13, 1.95] |
| 45.18 Iron supplementation > 2 mg/kg/day in both groups | 1 | 30 | Risk Ratio (M‐H, Fixed, 95% CI) | 3.0 [0.13, 68.26] |
| 46 Necrotizing enterocolitis among very low birth weight infants treated for > 1 week Show forest plot | 5 | | Risk Ratio (M‐H, Fixed, 95% CI) | Subtotals only |
|
| 46.1 All infants in all studies | 5 | 734 | Risk Ratio (M‐H, Fixed, 95% CI) | 1.51 [0.99, 2.30] |
| 46.2 Birth weight <= 1500 grams | 4 | 649 | Risk Ratio (M‐H, Fixed, 95% CI) | 1.62 [1.04, 2.51] |
| 46.3 Birth weight <= 1000 grams | 1 | 85 | Risk Ratio (M‐H, Fixed, 95% CI) | 0.77 [0.18, 3.23] |
| 46.4 Enteral | 1 | 30 | Risk Ratio (M‐H, Fixed, 95% CI) | 3.0 [0.13, 68.26] |
| 46.5 Parenteral with or without enteral | 4 | 704 | Risk Ratio (M‐H, Fixed, 95% CI) | 1.49 [0.97, 2.28] |
| 46.6 Parenteral with hypertonic enteral formulation at pharmacologic dose | 2 | 549 | Risk Ratio (M‐H, Fixed, 95% CI) | 1.56 [0.97, 2.51] |
| 46.7 Intravenous (with or without other routes of supplementation) | 2 | 549 | Risk Ratio (M‐H, Fixed, 95% CI) | 1.56 [0.97, 2.51] |
| 46.8 Excluding intravenous vitamin E supplementation | 3 | 185 | Risk Ratio (M‐H, Fixed, 95% CI) | 1.33 [0.53, 3.32] |
| 46.9 Total dose of vitamin E in the treatment group <= 30 IU/kg/day | 2 | 155 | Risk Ratio (M‐H, Fixed, 95% CI) | 1.21 [0.46, 3.17] |
| 46.10 Total dose of vitamin E in the treatment group > 30 IU/kg/day | 2 | 549 | Risk Ratio (M‐H, Fixed, 95% CI) | 1.56 [0.97, 2.51] |
| 46.11 Serum tocopherol level in the treatment group <= 3.5 mg/dl | 3 | 144 | Risk Ratio (M‐H, Fixed, 95% CI) | 1.05 [0.34, 3.29] |
| 46.12 Serum tocopherol level in the treatment group > 3.5 mg/dl | 2 | 590 | Risk Ratio (M‐H, Fixed, 95% CI) | 1.60 [1.02, 2.52] |
| 46.13 Onset of vitamin E supplementation in the treatment group within 48 hours of life | 4 | 704 | Risk Ratio (M‐H, Fixed, 95% CI) | 1.49 [0.97, 2.28] |
| 46.14 Onset of treatment after 48 hours of life | 1 | 30 | Risk Ratio (M‐H, Fixed, 95% CI) | 3.0 [0.13, 68.26] |
| 46.15 Duration of treatment > 1 week | 4 | 270 | Risk Ratio (M‐H, Fixed, 95% CI) | 1.13 [0.53, 2.43] |
| 46.16 Total dose of vitamin E in the control group <= 10 mg vit E/100 kcal | 5 | 734 | Risk Ratio (M‐H, Fixed, 95% CI) | 1.51 [0.99, 2.30] |
| 46.17 Iron supplementation > 2 mg/kg/day in both groups | 1 | 30 | Risk Ratio (M‐H, Fixed, 95% CI) | 3.0 [0.13, 68.26] |
| 47 Necrotizing enterocolitis among survivors Show forest plot | 2 | | Risk Ratio (M‐H, Fixed, 95% CI) | Subtotals only |
|
| 47.1 All infants in all studies | 2 | 186 | Risk Ratio (M‐H, Fixed, 95% CI) | 1.31 [0.31, 5.65] |
| 47.2 Birth weight <= 1500 grams | 1 | 135 | Risk Ratio (M‐H, Fixed, 95% CI) | 1.31 [0.31, 5.65] |
| 47.3 Parenteral with or without enteral | 2 | 186 | Risk Ratio (M‐H, Fixed, 95% CI) | 1.31 [0.31, 5.65] |
| 47.4 Parenteral with hypertonic enteral formulation at pharmacologic dose | 1 | 135 | Risk Ratio (M‐H, Fixed, 95% CI) | 1.31 [0.31, 5.65] |
| 47.5 Excluding intravenous vitamin E supplementation | 2 | 186 | Risk Ratio (M‐H, Fixed, 95% CI) | 1.31 [0.31, 5.65] |
| 47.6 Total dose of vitamin E in the treatment group <= 30 IU/kg/day | 1 | 51 | Risk Ratio (M‐H, Fixed, 95% CI) | 0.0 [0.0, 0.0] |
| 47.7 Total dose of vitamin E in the treatment group > 30 IU/kg/day | 1 | 135 | Risk Ratio (M‐H, Fixed, 95% CI) | 1.31 [0.31, 5.65] |
| 47.8 Serum tocopherol level in the treatment group <= 3.5 mg/dl | 2 | 186 | Risk Ratio (M‐H, Fixed, 95% CI) | 1.31 [0.31, 5.65] |
| 47.9 Onset of vitamin E supplementation in the treatment group within 48 hours of life | 2 | 186 | Risk Ratio (M‐H, Fixed, 95% CI) | 1.31 [0.31, 5.65] |
| 47.10 Duration of treatment <= 1 week | 2 | 186 | Risk Ratio (M‐H, Fixed, 95% CI) | 1.31 [0.31, 5.65] |
| 47.11 Total dose of vitamin E in the control group <= 10 mg vit E/100 kcal | 1 | 51 | Risk Ratio (M‐H, Fixed, 95% CI) | 0.0 [0.0, 0.0] |
| 47.12 Total dose of vitamin E in the control group > 10 mg vit E/100 kcal | 1 | 135 | Risk Ratio (M‐H, Fixed, 95% CI) | 1.31 [0.31, 5.65] |
| 47.13 Iron supplementation > 2 mg/kg/day in both groups | 1 | 51 | Risk Ratio (M‐H, Fixed, 95% CI) | 0.0 [0.0, 0.0] |
| 48 Necrotizing enterocolitis among surviving very low birth weight infants Show forest plot | 1 | | Risk Ratio (M‐H, Fixed, 95% CI) | Subtotals only |
|
| 48.1 All infants in all studies | 1 | 135 | Risk Ratio (M‐H, Fixed, 95% CI) | 1.31 [0.31, 5.65] |
| 49 Serum bilirubin concentration (mg/100 ml) on day 3‐5 Show forest plot | 3 | | Mean Difference (IV, Fixed, 95% CI) | Subtotals only |
|
| 49.1 All infants in all studies | 3 | 98 | Mean Difference (IV, Fixed, 95% CI) | ‐0.30 [‐1.17, 0.57] |
| 49.2 Birth weight >= 1000 grams | 1 | 40 | Mean Difference (IV, Fixed, 95% CI) | ‐0.86 [‐2.46, 0.74] |
| 49.3 Enteral | 2 | 58 | Mean Difference (IV, Fixed, 95% CI) | ‐0.07 [‐1.10, 0.96] |
| 49.4 Parenteral with or without enteral | 1 | 40 | Mean Difference (IV, Fixed, 95% CI) | ‐0.86 [‐2.46, 0.74] |
| 49.5 Excluding intravenous | 3 | 98 | Mean Difference (IV, Fixed, 95% CI) | ‐0.30 [‐1.17, 0.57] |
| 49.6 Total dose of vitamin E in the treatment group <= 30 IU/kg/day | 2 | 70 | Mean Difference (IV, Fixed, 95% CI) | 0.50 [‐0.66, 1.66] |
| 49.7 Total dose of vitamin E in the treatment group > 30 IU/kg/day | 1 | 28 | Mean Difference (IV, Fixed, 95% CI) | ‐1.30 [‐2.60, ‐0.00] |
| 49.8 Serum tocopherol level in the treatment group <= 3.5 mg/dl | 3 | 98 | Mean Difference (IV, Fixed, 95% CI) | ‐0.30 [‐1.17, 0.57] |
| 49.9 Onset of vitamin E supplementation in the treatment group within 48 hours of life | 3 | 98 | Mean Difference (IV, Fixed, 95% CI) | ‐0.30 [‐1.17, 0.57] |
| 49.10 Duration of treatment <= 1 week | 3 | 98 | Mean Difference (IV, Fixed, 95% CI) | ‐0.30 [‐1.17, 0.57] |
| 49.11 Total dose of vitamin E in the control group <= 10 mg vit E/100 kcal | 3 | 98 | Mean Difference (IV, Fixed, 95% CI) | ‐0.30 [‐1.17, 0.57] |
| 49.12 Iron supplementation > 2 mg/kg in neither group | 2 | 70 | Mean Difference (IV, Fixed, 95% CI) | 0.50 [‐0.66, 1.66] |
| 50 Serum bilirubin concentration in very low birth weight infants Show forest plot | 2 | | Mean Difference (IV, Fixed, 95% CI) | Subtotals only |
|
| 50.1 All infants in all studies | 2 | 48 | Mean Difference (IV, Fixed, 95% CI) | ‐1.46 [‐2.58, ‐0.33] |
| 50.2 Enteral | 1 | 28 | Mean Difference (IV, Fixed, 95% CI) | ‐1.30 [‐2.60, ‐0.00] |
| 50.3 Parenteral with or without enteral | 1 | 20 | Mean Difference (IV, Fixed, 95% CI) | ‐1.93 [‐4.20, 0.34] |
| 50.4 Excluding intravenous | 2 | 48 | Mean Difference (IV, Fixed, 95% CI) | ‐1.46 [‐2.58, ‐0.33] |
| 50.5 Total dose of vitamin E in the treatment group <= 30 IU/kg/day | 1 | 20 | Mean Difference (IV, Fixed, 95% CI) | ‐1.93 [‐4.20, 0.34] |
| 50.6 Total dose of vitamin E in the treatment group > 30 IU/kg/day | 1 | 28 | Mean Difference (IV, Fixed, 95% CI) | ‐1.30 [‐2.60, ‐0.00] |
| 50.7 Serum tocopherol level in the treatment group <= 3.5 mgl/gl | 2 | 48 | Mean Difference (IV, Fixed, 95% CI) | ‐1.46 [‐2.58, ‐0.33] |
| 50.8 Onset of vitamin E supplementation in the treatment group within 48 hours of life | 2 | 68 | Mean Difference (IV, Fixed, 95% CI) | ‐1.13 [‐2.13, ‐0.12] |
| 50.9 Duration of treatment <= 1 week | 2 | 48 | Mean Difference (IV, Fixed, 95% CI) | ‐1.46 [‐2.58, ‐0.33] |
| 50.10 Total dose of vitamin E in the control group <= 10 mg vit E/100 kcal | 2 | 48 | Mean Difference (IV, Fixed, 95% CI) | ‐1.46 [‐2.58, ‐0.33] |
| 50.11 Iron supplementation > 2 mg/kg in neither group | 1 | 20 | Mean Difference (IV, Fixed, 95% CI) | ‐1.93 [‐4.20, 0.34] |
| 51 Serum bilirubin concentration on day 3‐5 in a specific group (no hemolysis, polycythemia, prior transfus Show forest plot | 1 | | Mean Difference (IV, Fixed, 95% CI) | Subtotals only |
|
| 51.1 All infants in all studies | 1 | 62 | Mean Difference (IV, Fixed, 95% CI) | 1.30 [0.20, 2.40] |
| 52 Hemoglobin concentration (g/100 ml) Show forest plot | 8 | | Mean Difference (IV, Fixed, 95% CI) | Subtotals only |
|
| 52.1 All infants in all studies | 8 | 416 | Mean Difference (IV, Fixed, 95% CI) | 0.46 [0.24, 0.69] |
| 52.2 Birth weight > 1000 grams | 2 | 162 | Mean Difference (IV, Fixed, 95% CI) | 0.49 [0.20, 0.77] |
| 52.3 Enteral | 7 | 396 | Mean Difference (IV, Fixed, 95% CI) | 0.48 [0.25, 0.71] |
| 52.4 Parenteral with or without enteral | 1 | 20 | Mean Difference (IV, Fixed, 95% CI) | ‐1.0 [‐3.21, 1.21] |
| 52.5 Excluding intravenous vitamin E supplementation | 8 | 416 | Mean Difference (IV, Fixed, 95% CI) | 0.46 [0.24, 0.69] |
| 52.6 Total dose of vitamin E in the treatment group <= 30 IU/kg/day | 5 | 338 | Mean Difference (IV, Fixed, 95% CI) | 0.52 [0.29, 0.76] |
| 52.7 Total dose of vitamin E in the treatment group >30 IU/kg/day | 2 | 48 | Mean Difference (IV, Fixed, 95% CI) | ‐0.77 [‐1.84, 0.30] |
| 52.8 Serum tocopherol level in the treatment group <= 3.5 mg/dl | 6 | 356 | Mean Difference (IV, Fixed, 95% CI) | 0.47 [0.23, 0.71] |
| 52.9 Onset of vitamin E supplementation in the treatment group within 48 hours of life | 4 | 285 | Mean Difference (IV, Fixed, 95% CI) | 0.48 [0.21, 0.75] |
| 52.10 Onset of vitamin E supplementation in the treatment group after 48 hours of life | 4 | 131 | Mean Difference (IV, Fixed, 95% CI) | 0.44 [0.02, 0.85] |
| 52.11 Duration of treatment <= 1 week | 3 | 78 | Mean Difference (IV, Fixed, 95% CI) | ‐0.56 [‐1.44, 0.33] |
| 52.12 Duration of treatment > 1 week | 5 | 338 | Mean Difference (IV, Fixed, 95% CI) | 0.54 [0.30, 0.77] |
| 52.13 Total dose of vitamin E in the control group <= 10 mg vit E/100 kcal | 8 | 416 | Mean Difference (IV, Fixed, 95% CI) | 0.46 [0.24, 0.69] |
| 52.14 Iron supplementation in both groups | 4 | 161 | Mean Difference (IV, Fixed, 95% CI) | 0.57 [0.24, 0.91] |
| 52.15 Iron supplementation in neither group | 5 | 227 | Mean Difference (IV, Fixed, 95% CI) | 0.47 [0.16, 0.78] |
| 52.16 PUFA >= 400 mg/100 ml milk | 1 | 90 | Mean Difference (IV, Fixed, 95% CI) | ‐0.30 [‐1.02, 0.42] |
| 53 Hemoglobin concentration in very low birth weight infants Show forest plot | 4 | | Mean Difference (IV, Fixed, 95% CI) | Subtotals only |
|
| 53.1 All infants in all studies | 4 | 196 | Mean Difference (IV, Fixed, 95% CI) | 0.43 [0.09, 0.77] |
| 53.2 Enteral | 4 | 196 | Mean Difference (IV, Fixed, 95% CI) | 0.43 [0.09, 0.77] |
| 53.3 Excluding intravenous vitamin E supplementation | 4 | 196 | Mean Difference (IV, Fixed, 95% CI) | 0.43 [0.09, 0.77] |
| 53.4 Total dose of vitamin E in the treatment group <= 30 IU/kg/day | 2 | 138 | Mean Difference (IV, Fixed, 95% CI) | 0.53 [0.16, 0.90] |
| 53.5 Total dose of vitamin E in the treatment group >30 IU/kg/day | 1 | 28 | Mean Difference (IV, Fixed, 95% CI) | ‐0.70 [‐1.92, 0.52] |
| 53.6 Serum tocopherol level in the treatment group <= 3.5 mg/dl | 4 | 196 | Mean Difference (IV, Fixed, 95% CI) | 0.43 [0.09, 0.77] |
| 53.7 Onset of vitamin E supplementation in the treatment group within 48 hours of life | 3 | 166 | Mean Difference (IV, Fixed, 95% CI) | 0.42 [0.07, 0.78] |
| 53.8 Onset of vitamin E supplementation in the treatment group after 48 hours of life | 1 | 30 | Mean Difference (IV, Fixed, 95% CI) | 0.57 [‐0.70, 1.84] |
| 53.9 Duration of treatment <= 1 week | 1 | 28 | Mean Difference (IV, Fixed, 95% CI) | ‐0.70 [‐1.92, 0.52] |
| 53.10 Duration of treatment > 1 week | 3 | 168 | Mean Difference (IV, Fixed, 95% CI) | 0.53 [0.17, 0.89] |
| 53.11 Total dose of vitamin E in the control group <= 10 mg vit E/100 kcal | 4 | 196 | Mean Difference (IV, Fixed, 95% CI) | 0.43 [0.09, 0.77] |
| 53.12 Iron supplementation in both groups | 2 | 100 | Mean Difference (IV, Fixed, 95% CI) | 0.67 [0.23, 1.10] |
| 53.13 Iron supplementation in neither group | 2 | 157 | Mean Difference (IV, Fixed, 95% CI) | 0.51 [0.17, 0.86] |
| 53.14 PUFA >= 400 mg/100 ml milk | 1 | 90 | Mean Difference (IV, Fixed, 95% CI) | ‐0.30 [‐1.02, 0.42] |
| 54 Reticulocyte count (%) Show forest plot | 2 | | Mean Difference (IV, Fixed, 95% CI) | Subtotals only |
|
| 54.1 All infants in all studies | 2 | 201 | Mean Difference (IV, Fixed, 95% CI) | ‐1.66 [‐2.24, ‐1.07] |
| 54.2 Enteral | 2 | 201 | Mean Difference (IV, Fixed, 95% CI) | ‐1.66 [‐2.24, ‐1.07] |
| 54.3 Excluding intravenous vitamin E supplementation | 2 | 201 | Mean Difference (IV, Fixed, 95% CI) | ‐1.66 [‐2.24, ‐1.07] |
| 54.4 Total dose of vitamin E in the treatment group <= 30 IU/kg/day | 2 | 201 | Mean Difference (IV, Fixed, 95% CI) | ‐1.66 [‐2.24, ‐1.07] |
| 54.5 Serum tocopherol level in the treatment group <= 3.5 mg/dl | 2 | 201 | Mean Difference (IV, Fixed, 95% CI) | ‐1.66 [‐2.24, ‐1.07] |
| 54.6 Onset of vitamin E supplementation in the treatment group within 48 hours of life | 2 | 201 | Mean Difference (IV, Fixed, 95% CI) | ‐1.66 [‐2.24, ‐1.07] |
| 54.7 Duration of treatment > 1 week | 2 | 201 | Mean Difference (IV, Fixed, 95% CI) | ‐1.66 [‐2.24, ‐1.07] |
| 54.8 Total dose of vitamin E in the control group <= 10 mg vit E/100 kcal | 2 | 201 | Mean Difference (IV, Fixed, 95% CI) | ‐1.66 [‐2.24, ‐1.07] |
| 54.9 Iron supplementation in both groups | 1 | 70 | Mean Difference (IV, Fixed, 95% CI) | ‐1.96 [‐2.89, ‐1.03] |
| 54.10 Iron supplementation in neither group | 2 | 131 | Mean Difference (IV, Fixed, 95% CI) | ‐1.47 [‐2.22, ‐0.72] |
| 54.11 PUFA >= 400 mg/100 ml milk | 1 | 64 | Mean Difference (IV, Fixed, 95% CI) | ‐0.30 [‐1.50, 0.90] |
| 55 Reticulocyte count (%) in very low birth weight infants Show forest plot | 1 | | Mean Difference (IV, Fixed, 95% CI) | Subtotals only |
|
| 55.1 All infants in all studies | 1 | 64 | Mean Difference (IV, Fixed, 95% CI) | ‐0.30 [‐1.50, 0.90] |
| 56 Reticulocyte count (million per liter) Show forest plot | 2 | | Mean Difference (IV, Fixed, 95% CI) | Subtotals only |
|
| 56.1 All infants in all studies | 2 | 71 | Mean Difference (IV, Fixed, 95% CI) | ‐34.02 [‐46.19, ‐21.84] |
| 56.2 Enteral | 2 | 71 | Mean Difference (IV, Fixed, 95% CI) | ‐34.02 [‐46.19, ‐21.84] |
| 56.3 Excluding intravenous vitamin E supplementation | 2 | 71 | Mean Difference (IV, Fixed, 95% CI) | ‐34.02 [‐46.19, ‐21.84] |
| 56.4 Total dose of vitamin E in the treatment group <= 30 IU/kg/day | 1 | 41 | Mean Difference (IV, Fixed, 95% CI) | ‐9.20 [‐27.36, 8.96] |
| 56.5 Serum tocopherol level in the treatment group <= 3.5 mg/dl | 2 | 71 | Mean Difference (IV, Fixed, 95% CI) | ‐34.02 [‐46.19, ‐21.84] |
| 56.6 Onset of vitamin E supplementation in the treatment group after 48 hours of life | 2 | 71 | Mean Difference (IV, Fixed, 95% CI) | ‐34.02 [‐46.19, ‐21.84] |
| 56.7 Duration of treatment > 1 week | 2 | 71 | Mean Difference (IV, Fixed, 95% CI) | ‐34.02 [‐46.19, ‐21.84] |
| 56.8 Total dose of vitamin E in the control group <= 10 mg vit E/100 kcal | 2 | 71 | Mean Difference (IV, Fixed, 95% CI) | ‐34.02 [‐46.19, ‐21.84] |
| 56.9 Iron supplementation in both groups | 2 | 71 | Mean Difference (IV, Fixed, 95% CI) | ‐34.02 [‐46.19, ‐21.84] |
| 57 Reticulocyte count (million per liter) in very low birth weight infants Show forest plot | 1 | | Mean Difference (IV, Fixed, 95% CI) | Subtotals only |
|
| 57.1 All infants in all studies | 1 | 30 | Mean Difference (IV, Fixed, 95% CI) | ‐54.27 [‐70.67, ‐37.87] |
| 58 Number of transfusions Show forest plot | 1 | | Mean Difference (IV, Fixed, 95% CI) | Subtotals only |
|
| 58.1 All infants in all studies | 1 | 30 | Mean Difference (IV, Fixed, 95% CI) | ‐0.20 [‐1.17, 0.77] |
| 59 Number of transfusions among survivors Show forest plot | 1 | | Mean Difference (IV, Fixed, 95% CI) | Subtotals only |
|
| 59.1 All infants in all studies | 1 | 135 | Mean Difference (IV, Fixed, 95% CI) | 1.20 [‐1.42, 3.82] |
| 60 Amount of blood transfused (ml/kg) among very low birth weight infants Show forest plot | 2 | | Mean Difference (IV, Fixed, 95% CI) | Subtotals only |
|
| 60.1 All infants in all studies | 2 | 454 | Mean Difference (IV, Fixed, 95% CI) | ‐0.47 [‐16.86, 15.92] |
| 60.2 Birth weight <= 1500 grams | 2 | 454 | Mean Difference (IV, Fixed, 95% CI) | ‐0.47 [‐16.86, 15.92] |
| 60.3 Enteral | 1 | 30 | Mean Difference (IV, Fixed, 95% CI) | ‐3.10 [‐20.91, 14.71] |
| 60.4 Parenteral with or without enteral | 1 | 424 | Mean Difference (IV, Fixed, 95% CI) | 14.0 [‐27.77, 55.77] |
| 60.5 Parenteral with hypertonic enteral formulation at pharmacologic dose | 1 | 424 | Mean Difference (IV, Fixed, 95% CI) | 14.0 [‐27.77, 55.77] |
| 60.6 Intravenous vitamin E supplementation | 1 | 424 | Mean Difference (IV, Fixed, 95% CI) | 14.0 [‐27.77, 55.77] |
| 60.7 Excluding intravenous supplementation | 1 | 30 | Mean Difference (IV, Fixed, 95% CI) | ‐3.10 [‐20.91, 14.71] |
| 60.8 Total dose of vitamin E in the treatment group <= 30 IU/kg/day | 1 | 30 | Mean Difference (IV, Fixed, 95% CI) | ‐3.10 [‐20.91, 14.71] |
| 60.9 Total dose of vitamin E in the treatment group > 30 IU/kg/day | 1 | 424 | Mean Difference (IV, Fixed, 95% CI) | 14.0 [‐27.77, 55.77] |
| 60.10 Serum tocopherol level in the treatment group <= 3.5 mg/dl | 1 | 30 | Mean Difference (IV, Fixed, 95% CI) | ‐3.10 [‐20.91, 14.71] |
| 60.11 Serum tocopherol level in the treatment group > 3.5 mg/dl | 1 | 424 | Mean Difference (IV, Fixed, 95% CI) | 14.0 [‐27.77, 55.77] |
| 60.12 Onset of vitamin E supplementation in the treatment group within 48 hours of life | 1 | 424 | Mean Difference (IV, Fixed, 95% CI) | 14.0 [‐27.77, 55.77] |
| 60.13 Onset of vitamin E supplementation in the treatment group after 48 hours of life | 1 | 30 | Mean Difference (IV, Fixed, 95% CI) | ‐3.10 [‐20.91, 14.71] |
| 60.14 Duration of treatment > 1 week | 1 | 30 | Mean Difference (IV, Fixed, 95% CI) | ‐3.10 [‐20.91, 14.71] |
| 60.15 Total dose of vitamin E in the control group <= 10 mg vit E/100 kcal | 2 | 454 | Mean Difference (IV, Fixed, 95% CI) | ‐0.47 [‐16.86, 15.92] |
| 60.16 Iron supplementation in both groups | 1 | 30 | Mean Difference (IV, Fixed, 95% CI) | ‐3.10 [‐20.91, 14.71] |
| 61 Amount of blood transfused (ml/kg) among surviving low birth weight infants Show forest plot | 1 | | Mean Difference (IV, Fixed, 95% CI) | Subtotals only |
|
| 61.1 All infants in all studies | 1 | 135 | Mean Difference (IV, Fixed, 95% CI) | 18.10 [‐17.14, 53.34] |
| 62 Platelet count (thousands/microliter) Show forest plot | 2 | | Mean Difference (IV, Fixed, 95% CI) | Subtotals only |
|
| 62.1 All infants in all studies | 2 | 109 | Mean Difference (IV, Fixed, 95% CI) | ‐29.52 [‐88.81, 29.76] |
| 62.2 Birth weight <= 1500 grams | 1 | 68 | Mean Difference (IV, Fixed, 95% CI) | ‐45.0 [‐114.33, 24.33] |
| 62.3 Enteral | 2 | 109 | Mean Difference (IV, Fixed, 95% CI) | ‐29.52 [‐88.81, 29.76] |
| 62.4 Excluding intravenous vitamin E supplementation\ | 2 | 109 | Mean Difference (IV, Fixed, 95% CI) | ‐29.52 [‐88.81, 29.76] |
| 62.5 Total dose of vitamin E in the treatment group <= 30 IU/kg/day | 2 | 109 | Mean Difference (IV, Fixed, 95% CI) | ‐29.52 [‐88.81, 29.76] |
| 62.6 Serum tocopherol level in the treatment group <= 3.5 mg/dl | 2 | 109 | Mean Difference (IV, Fixed, 95% CI) | ‐29.52 [‐88.81, 29.76] |
| 62.7 Onset of vitamin E supplementation in the treatment group within 48 hours of life | 1 | 68 | Mean Difference (IV, Fixed, 95% CI) | ‐45.0 [‐114.33, 24.33] |
| 62.8 Onset of therapy after 48 hours of life | 1 | 41 | Mean Difference (IV, Fixed, 95% CI) | 12.60 [‐101.78, 126.98] |
| 62.9 Duration of treatment > 1 week | 2 | 109 | Mean Difference (IV, Fixed, 95% CI) | ‐29.52 [‐88.81, 29.76] |
| 62.10 Total dose of vitamin E in the control group <= 10 mg vit E/100 kcal | 2 | 109 | Mean Difference (IV, Fixed, 95% CI) | ‐29.52 [‐88.81, 29.76] |
| 62.11 Iron supplementation > 2 mg/kg in both groups | 1 | 41 | Mean Difference (IV, Fixed, 95% CI) | 12.60 [‐101.78, 126.98] |
| 63 Prothrombin time (PT, seconds) Show forest plot | 1 | | Mean Difference (IV, Fixed, 95% CI) | Subtotals only |
|
| 63.1 All infants in all studies | 1 | 47 | Mean Difference (IV, Fixed, 95% CI) | ‐0.10 [‐0.62, 0.42] |
| 64 Partial thromboplastin time (PTT, seconds) Show forest plot | 1 | | Mean Difference (IV, Fixed, 95% CI) | Subtotals only |
|
| 64.1 All infants in all studies | 1 | 47 | Mean Difference (IV, Fixed, 95% CI) | ‐3.40 [‐12.93, 6.13] |
| 65 Fibrinogen concentration (mg/100 ml) Show forest plot | 1 | | Mean Difference (IV, Fixed, 95% CI) | Subtotals only |
|
| 65.1 All infants in all studies | 1 | 47 | Mean Difference (IV, Fixed, 95% CI) | 49.0 [‐14.47, 112.47] |
| 66 Retinal hemorrhage among very low birth weight infants examined/surviving Show forest plot | 1 | | Risk Ratio (M‐H, Fixed, 95% CI) | Subtotals only |
|
| 66.1 All infants in all studies | 1 | 232 | Risk Ratio (M‐H, Fixed, 95% CI) | 2.18 [0.97, 4.89] |
| 66.2 Birth weight <= 1000 grams | 1 | 85 | Risk Ratio (M‐H, Fixed, 95% CI) | 3.58 [1.28, 10.00] |
| 67 Reaction at site of injection Show forest plot | 2 | | Risk Ratio (M‐H, Fixed, 95% CI) | Subtotals only |
|
| 67.1 All infants in all studies | 2 | 357 | Risk Ratio (M‐H, Fixed, 95% CI) | 4.13 [0.47, 36.68] |
| 67.2 Parenteral with or without enteral | 2 | 357 | Risk Ratio (M‐H, Fixed, 95% CI) | 4.13 [0.47, 36.68] |
| 67.3 Parenteral with hypertonic enteral formulation at pharmacologic dose | 1 | 147 | Risk Ratio (M‐H, Fixed, 95% CI) | 5.07 [0.25, 103.77] |
| 67.4 Excluding intravenous vitamin E supplementation | 2 | 357 | Risk Ratio (M‐H, Fixed, 95% CI) | 4.13 [0.47, 36.68] |
| 67.5 Total dose of vitamin E in the treatment group <= 30 IU/kg/day | 1 | 210 | Risk Ratio (M‐H, Fixed, 95% CI) | 3.17 [0.13, 77.05] |
| 67.6 Total dose of vitamin E in the treatment group > 30 IU/kg/day | 1 | 147 | Risk Ratio (M‐H, Fixed, 95% CI) | 5.07 [0.25, 103.77] |
| 67.7 Serum tocopherol level in the treatment group <= 3.5 mg/dl | 1 | 210 | Risk Ratio (M‐H, Fixed, 95% CI) | 3.17 [0.13, 77.05] |
| 67.8 Serum tocopherol level in the treatment group > 3.5 mg/dl | 1 | 147 | Risk Ratio (M‐H, Fixed, 95% CI) | 5.07 [0.25, 103.77] |
| 67.9 Onset of vitamin E supplementation in the treatment group within 48 hours of life | 2 | 357 | Risk Ratio (M‐H, Fixed, 95% CI) | 4.13 [0.47, 36.68] |
| 67.10 Duration of treatment <= 1 week | 1 | 210 | Risk Ratio (M‐H, Fixed, 95% CI) | 3.17 [0.13, 77.05] |
| 67.11 Duration of treatment > 1 week | 1 | 147 | Risk Ratio (M‐H, Fixed, 95% CI) | 5.07 [0.25, 103.77] |
| 68 Reaction at site of injection in very low birth weight infants Show forest plot | 1 | | Risk Ratio (M‐H, Fixed, 95% CI) | Subtotals only |
|
| 68.1 All infants in all studies | 1 | 147 | Risk Ratio (M‐H, Fixed, 95% CI) | 5.07 [0.25, 103.77] |
| 68.2 Birth weight <= 1000 grams | 1 | 147 | Risk Ratio (M‐H, Fixed, 95% CI) | 5.07 [0.25, 103.77] |