| Author | Results | Comments |
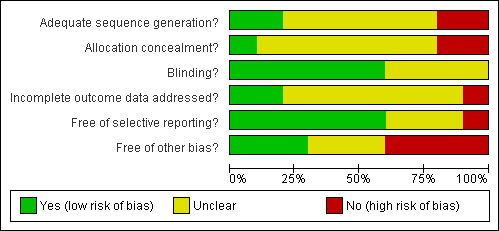
| Clark et. al (1998) | A significant difference (T(2.50;p:<.05) was found between total no. of aggressive behaviours between music (M‐65.6) and no music (M‐121.6). For separate behaviours only for hitting (T 2.30; p:<0.5). Length of bathing: no difference between music and no music. | ‐ please note that the risk of bias in this study is uncertain (see figure 2), so please interpret the reported results with caution. ‐The total number of events for each behaviour is calculated for each treatment group. This is the sum of events over 10 episodes for all 18 patients when receiving music treatment and then when receiving no music. The analysis appears to be related to the difference between these two means, but the exact analysis is not described.
‐ This is a crossover trial and the analysis should be based on the difference between each patient's assessment on treatment and then on no treatment. The standard deviation of the differences is required. It is not stated that this has been done.
‐The assessment is in the form of counts and these usually need to be transformed before analysis, but this does not appear to have been done. |
| Gerdner (2000) | Freq. of agitated behaviours was significantly less both during and after individualised music. No significant difference between baseline and first 20 minutes of classical minutes. Significant decrease did occur in the final 10 minutes. Both types of music were more effective than baseline, with more effect for individualised music. | ‐ please note that the risk of bias in this study is uncertain (see figure 2), so please interpret the reported results with caution. It seems that the data have not been analysed correctly:
1. The data from the two groups were analysed as though there were two independent groups of 39 patients.
2. Baseline is considered a level of the treatment factor which is incorrect
3. There are several measurements on each patient and these correlated measurements cannot be analysed as though they were independent. |
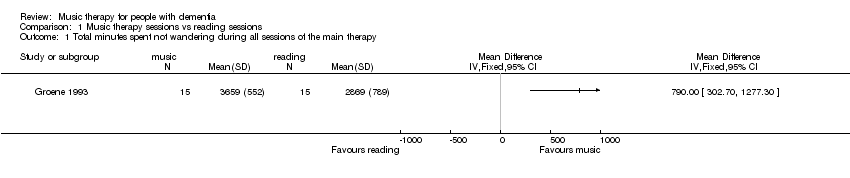
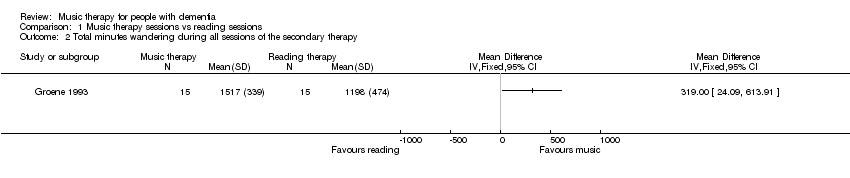
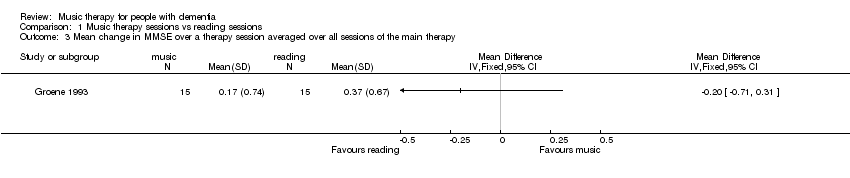
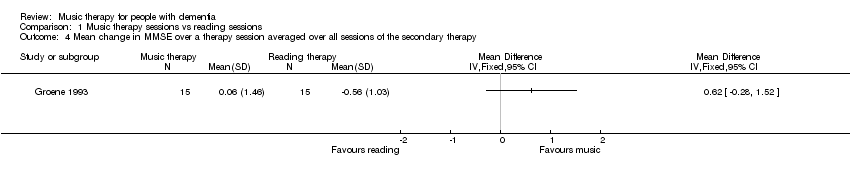
| Groene (1993) | Significant difference in mean seating/proximity time in favour of music over the reading treatment (p<.001). No significant effects or interactions in seating/proximity behavior for the factors sex, age, or months on site at the facility. No significant differences in wandering behavior were revealed between the mostly music and mostly reading group. There was a significant difference between the mean wandering scores during the 5 music sessions versus the 2 reading sessions of the mostly music group in favour of the music sessions (t(14)=2.25, p<0,41. No significant difference in pre and posttest of MMSE. | ‐ please note that the risk of bias in this study is uncertain (see figure 2), so please interpret the reported results with caution.‐No washout period, which could have diluted the effect. The effect for the music sessions alone: Music therapy 3658.73 (552) reading therapy 2869.33 (789) t=3.2 p<0.002.
‐The intervention consisted of one session (15 minutes) per day for 7 days. The days were not consecutive and occurred over 15 weeks. The sessions were either 5 music followed by 2 reading or 5 reading followed by 2 music.
‐Other outcomes measures are questionable, e.g. the distance walked during the session, and assessing effects on the MMSE over a period of 15 minutes. |
| Raglio (2008) | There was a significant decrease in the global NPI scores in the experimental group in comparison with the control group (interaction time x group: F=5.06, p=0.002). Differences were significant at after 8 weeks (F=9.85; p=0.003); after 16 weeks (F=21.21; p=0<0.001) and after 20 weeks (F=12.65; p=0.0007). There were no changes in MMSE scores in both the experimental group and the control group. The Barthel Index score significantly decreased over time in both the experimental (59 to 52) as in the control group (51 to 46); F=8.91; p=0.001) | ‐ the changes in the NPI scores were presented for the separate items, without standard deviation ‐ no details were provided for the Barthel Index score, no standard deviation. |
| Raglio (n.d) | There was a significant decrease over time in the global NPI scores in both groups (F=9.06, p<0.001), a significant difference between groups (F=4.84, p < 0,5) with a larger reduction of behavioural disturbances in the experimental group at the end of the treatment (T1) (t=‐2,58; p<0.001; Cohen's d=0,63). In analysis of single NPI item scores it shows that delusions, agitation and apathy significantly improved in the experimental group and not in the control group. In both groups depression, anxiety and irritability significantly improved. Abberant motor activity improved in the control group and not in the experimental group. Post hoc analysis showed that the main improvements were found at T1 (end of treatment) and persisted over time at the follow up (T2). The patients communicative and relational skills did not improve from baseline to the end of the treatment in the experimental group. | ‐ please note that the risk of bias in this study is uncertain (see figure 2), so please interpret the reported results with caution. ‐ No data is presented on the Mini Mental State Examination (MMSE) or the Barthel Index, only for the baseline scores and not T1 (end of treatment) and T2 (1 month after the last wash out). ‐ It is not clear from the article how changes in communicative and relational skills were measured except from the statement that a specific observational scheme was used. No data is presented. ‐ criteria for randomisation were not standardized. ‐ baseline NPI scores differed slightly (T= ‐ 1.49; p=0,14) between exp. (20.2) and control group (28.7), possibly affecting the comparability of the two groups. |
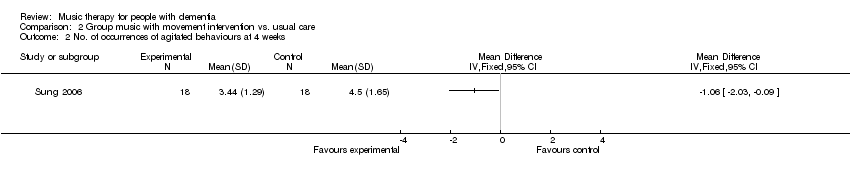
| Sung (2006) | The mean number of agitated behaviours was significantly decreased following a group music program with movement interventions, by 1.17 at week 2 (of 4 weeks) and further decreased by 0.5 at week 4, also significantly lower in comparison to the control group. The mean decrease of the total period of 4 weeks amounted to 1.67 less agitated behaviours compared to a decrease of 0.22 for those patients receiving no intervention, other than care as usual. Changes in occurrence over the 4‐week time frame were significantly different between experimental and control group (ANOVA, F=15.03, p< .001) | ‐ no t‐test statistic provided for the decrease with 1.17 points at week 2 in the article; ‐The timeframe of observations in this study is not entirely clear from the article. The CMAI was modified to make observations for 60 minutes, with a 30 minute intervention. It was not specified at what precise moments the observations were conducted, with preceding or continuing observations for additional 30 minutes (?) or how the 10 minute intervals were handled during analysis, with respect to the intervention and missing data. |
| Svansdottir (2006) | For the total BEHAVE‐AD scores no significant changes were noted after 6 weeks (p=0.3 for the music therapy group and p>0.5 for the control group). For the single subscale 'activity disturbances', a significant lower score was found for the experimental group (p=.02) in comparison to the control group (p>.05) There was no decrease in symptoms rated in other single subscales of the BEHAVE‐AD, nor for the therapy group or the control group. For three of the seven categories combined of the BEHAVE‐AD (activity disturbances, agressivness and anxiety), there was a significant reduction in symptoms in the therapy group (p<.01) but not for the control group (p=0.5). At the follow‐up measurement, the benefits of music therapy had disappeared 4 weeks after the last session according to all ratings. | ‐ please note that the risk of bias in this study is uncertain (see figure 2), so please interpret the reported results with caution.‐ no baseline characteristics are presented, unclear how many men and females participated, nor their age or their average GDS score. ‐ not clear if groups were different or similar at baseline assessment scores on the BEHAVE‐AD ‐ insufficient details on statistical tests ‐ only average mean scores are presented and no standard deviation scores |