Musicoterapia para personas con demencia
References
Referencias de los estudios incluidos en esta revisión
Referencias de los estudios excluidos de esta revisión
Referencias de los estudios en espera de evaluación
Referencias adicionales
Referencias de otras versiones publicadas de esta revisión
Characteristics of studies
Characteristics of included studies [ordered by study ID]
Jump to:
| Methods | RCT (crossover 2 weeks + 2 weeks) | |
| Participants | Country: USA | |
| Interventions | (1) Music therapy (group sessions , twice a week for 30 minutes) | |
| Outcomes | Cognition: MMSE | |
| Notes | All participants had been receiving music therapy sessions for a minimum of 3 months prior to entering the study. | |
| Risk of bias | ||
| Bias | Authors' judgement | Support for judgement |
| Adequate sequence generation? | Low risk | Quote: "Condition order was counterbalanced between participants, with music sessions given first to half of the subjects (selected randomly) and conversation first to the remainder." |
| Allocation concealment? | Unclear risk | No information provided. |
| Blinding? | Low risk | Blinding of the outcome assessors was assured. Quote: "Three independent analysts who were blind to the subjects' condition (e.g., order of treatment as well as mental status and performance during testing) listened to the tape while reading the transcription and assigned |
| Incomplete outcome data addressed? | High risk | Quote: "Twenty‐six participants (18 female, 8 male, mean age 81) were recruited for this study." "Analyses were restricted to 20 participants who completed at least the first subtest of the WAB (spontaneous speech)" "Of the 20 participants in the preceding analyses, 19 also completed the first section of the auditory verbal comprehension subscale of the WAB (yes/no questions)." "A one‐factor ANOVA on MMSE before and 2 weeks posttreatment on 18 subjects who were available at posttest demonstrated no significant change during the course of the study ( p > .I)." |
| Free of selective reporting? | Low risk | The study protocol is not available, however the report seems to include all expected outcomes, as is described in the methods section. |
| Free of other bias? | Unclear risk | It appears that all quantitative results were inadequately presented. The description of the analysis makes no mention of how the cross‐over design was handled. It appears to have been ignored in the analysis and the people in each group seem to have been treated as different people. |
| Methods | RCT (crossover 2 weeks + 2 weeks) | |
| Participants | Country : USA | |
| Interventions | (1) Favorite music during bathing | |
| Outcomes | Behaviour | |
| Notes | ||
| Risk of bias | ||
| Bias | Authors' judgement | Support for judgement |
| Adequate sequence generation? | Unclear risk | Quote: "the director of social services or her assistant identified prospective participants". "After being enrolled in the study, participants were randomly scheduled for observation during bath time under either a control (no music) condition or an experimental condition". No further information is provided on the allocation sequence. |
| Allocation concealment? | Unclear risk | No information provided. |
| Blinding? | Unclear risk | No information provided. |
| Incomplete outcome data addressed? | Unclear risk | No information provided. |
| Free of selective reporting? | Low risk | The study protocol is not available, however the report seems to include all expected outcomes, as is described in the methods section. |
| Free of other bias? | High risk | Note: The authors report in the article on the effects of the extreme intrasubject and intersubject variability characteristic of this population in this study, which implies a unit of analysis problem. Quote: "For example, one subject was responsible for 408 and 84 occurrences of yelling behavior in the no music and music conditions, respectively." |
| Methods | RCT (crossover 6 weeks treatment + 2 weeks washout + 6 weeks treatment) | |
| Participants | Country: USA | |
| Interventions | (1) Individualized music | |
| Outcomes | Behaviour (agitation) as assessed with the Cohen‐Mansfield Agitation Inventory (CMAI) | |
| Notes | Groups were stratified by age, gender and degree of cognitive impairment | |
| Risk of bias | ||
| Bias | Authors' judgement | Support for judgement |
| Adequate sequence generation? | Unclear risk | No information provided. |
| Allocation concealment? | Unclear risk | No information provided. |
| Blinding? | Unclear risk | No information provided. |
| Incomplete outcome data addressed? | Low risk | No missing outcome data. |
| Free of selective reporting? | High risk | The study protocol is not available, however the report seems to include all expected outcomes, as is described in the methods section, although based on incorrect analyses. |
| Free of other bias? | High risk | The analyses described are not the correct analyses for the data. Each individual assessment for each patient was entered into the analysis creating a file of thousands of observations, which was then analysed taking no account of the correlation between observations belonging to one patient. The cross‐over nature of the design was ignored after a statistical test was said to show that order of treatment was not significant. Count data usually require a transformation before analysis but there is no evidence that this was investigated. Consequently the results cannot be accepted. |
| Methods | RCT 15 week parallel group trial | |
| Participants | Country: USA | |
| Interventions | 1) Reading‐Music therapy | |
| Outcomes | Wandering behaviour assessed by seating/proximity duration. | |
| Notes | ||
| Risk of bias | ||
| Bias | Authors' judgement | Support for judgement |
| Adequate sequence generation? | Unclear risk | Quote: "Participants were randomly assigned to either mostly music attention or mostly reading attention groups" No further information was provided on the sequence generation. |
| Allocation concealment? | Unclear risk | No information provided. |
| Blinding? | Unclear risk | No information provided on blinding, the researcher and nursing staff recorded the wandering behavior. |
| Incomplete outcome data addressed? | Unclear risk | No information provided on missing data. |
| Free of selective reporting? | Unclear risk | The speed of wandering was not reported in this review because it seemed to be an irrelevant outcome measure. |
| Free of other bias? | High risk | We have assumed that there were 15 patients in each group, but the group sizes were not reported. It is possible that the nature of the intervention biased the results. The music therapy appeared to be far more active as the patients were engaged in the music therapy, the reading therapy mostly passive as the patients listened to somebody reading aloud. Therefore there could have been a far greater opportunity for the patients to wander during the reading therapy. This was not discussed in the report. Bias could also have been introduced by changing the control therapy for one patient, and by trying to implement the therapy just before each patient's supposed most agitated time of day. |
| Methods | RCT parallel group trial; total duration | |
| Participants | Country: France | |
| Interventions | 1) Individual receptive music therapy method | |
| Outcomes | 1) level of anxiety (Hamilton Scale) 2) level of depression (Geriatric Depression Scale) 3) Minimal Mental State Score (MMSE) | |
| Notes | ||
| Risk of bias | ||
| Bias | Authors' judgement | Support for judgement |
| Adequate sequence generation? | Unclear risk | Probably Yes, but no details provided. “The study design corresponded to a randomised, controlled, comparative, single‐centre study, with the results evaluated under blind conditions.” and “The patients were allocated to the different groups by randomisation at the end of the inclusion visit”. |
| Allocation concealment? | Unclear risk | No details provided. |
| Blinding? | Low risk | Patients and care givers not blinded, outcome assessor blinded: ”The results obtained at D0, W4, W8, W16 and W24 were collected by an independent neuropsychologist assessor (D.L.), not belonging to the care team and unaware of the type of intervention.” |
| Incomplete outcome data addressed? | Unclear risk | Unclear whether drop‐outs have caused bias. "Two patients were prematurely withdrawn from the study in the intervention group: 1 between W8 and W16 owing to an intercurrent event not related to the study (life‐threatening situation, hospitalisation), and the second died between W16 and W24. Four patients were withdrawn from the study in the control group: 1 between W4 and W8 due to dropping out, 1 between W4 and W8 owing to an intercurrent event not related to the study (hospitalisation), 1 patient died between W4 and W8, and the last patient dropped out between W16 and W24.” |
| Free of selective reporting? | Low risk | All outcomes were presented. |
| Free of other bias? | Low risk | Baseline imbalances don’t appear to have caused bias. |
| Methods | RCT (parallel) | |
| Participants | Country: USA | |
| Interventions | (1) Big band music listening and playing along | |
| Outcomes | Cognition, social skills and emotional well‐being as assessed with | |
| Notes | ||
| Risk of bias | ||
| Bias | Authors' judgement | Support for judgement |
| Adequate sequence generation? | High risk | Quote "The patients were non‐systematically separated into three groups of equal size" |
| Allocation concealment? | High risk | Quote " To assure equal representation by gender, the random division was implemented first with the female and then with the male patients" Note: no further information provided on the method to conceal the allocation sequence. |
| Blinding? | Unclear risk | No information was provided on blinding of the outcome assessors. |
| Incomplete outcome data addressed? | Unclear risk | No information provided. |
| Free of selective reporting? | Unclear risk | Not enough detail was reported about the outcome measures. |
| Free of other bias? | High risk | We were unable to reproduce the results. No statistical tests were reported for the between‐group comparisons, only for the within‐group. |
| Methods | RCT (parallel) | |
| Participants | Country: Italy N=59 (? female, ? male not described); residents from 3 nursing homes Mean age/age range experimental group: 84.4 (73‐95) Mean age/age range control group: 85.8 (74‐94) Diagnosis of dementia: all diagnosed with dementia (DSM‐IV; MMSE ≤ 22/30; CDR ≥2/5) | |
| Interventions | 1) music therapy (30 sessions; 30 min per session) 2) personalized care and entertainment activities | |
| Outcomes | Behavioral and psychological symptoms of dementia (BPSD); multidimensional assessment with the mini‐mental state examination (MMSE); Barthel Index, Neuropsychiatric Inventory (NPI) | |
| Notes | ||
| Risk of bias | ||
| Bias | Authors' judgement | Support for judgement |
| Adequate sequence generation? | High risk | The patients were assigned to experimental or control group using non‐standardized randomisation criteria. |
| Allocation concealment? | High risk | The patients were assigned to experimental or control group using non‐standardized randomisation criteria. Fifty‐nine patients were therefore enrolled and listed in alphabetical order. The patients corresponding to odd numbers (n=30) were assigned to the experimental, whereas the others (n=29) to the control group. |
| Blinding? | Low risk | Outcomes assessment was blinded. Quote: "The MMSE, the Barthel Index and NPI scales were administered |
| Incomplete outcome data addressed? | Unclear risk | No information provided in the article. |
| Free of selective reporting? | Low risk | The study protocol is not available, however the report seems to include all expected outcomes, as is described in the methods section. |
| Free of other bias? | Low risk | the study appears to be free of other sources of bias |
| Methods | RCT (parallel); | |
| Participants | Country: Italy N=60 (55 female, 5 male); residents from 5 nursing homes Mean age/age range experimental group: 85.4 (74‐99) Mean age/age range control group: 84.6 (69‐96) Diagnosis of dementia of the Alzheimer type, vascular dementia or mixed dementia (DSM‐IV; MMSE ≤ 18/30; CDR ≥25) | |
| Interventions | 1) All patients in the experimental and control groups received standard care (i.e., educational and entertainment activities such as reading a newspaper, performing physical activities, etc.). 2) The experimental group received 3 cycles of 12 music therapy sessions each, 3 times a week. Each session included a group of 3 patients and lasted 30 minutes. Each cycle of treatment was followed by 1 month of wash‐out period while the standard care activities continued over time. The total duration was of 6 months. | |
| Outcomes | Mini Mental State Examination (MMSE) Barthel Index Neuropsychiatric Inventory (NPI). | |
| Notes | ||
| Risk of bias | ||
| Bias | Authors' judgement | Support for judgement |
| Adequate sequence generation? | Unclear risk | Probably Yes, but no details provided “ Sixty patients from 5 nursing homes ?.. were eligible and were randomly assigned to experimental or control group.” |
| Allocation concealment? | Unclear risk | No details provided. |
| Blinding? | Low risk | Patients and care givers not blinded, outcome assessor blinded: “The assessments were made by NH healthcare assistants who were blinded to the aim of the study.” |
| Incomplete outcome data addressed? | Low risk | drop‐outs did not appear to have caused bias. “During the study 7 patients dropped out, 3 in the experimental and 4 in the control group. The drops‐out were due to death (n=5), transfer to acute hospital because of hip fracture (n=1) and transfer to another NH (n=1).” |
| Free of selective reporting? | Unclear risk | Changes in Barthel Index scores and MMSE were not presented. In addition, “The patients’ communicative and relational skills did not improve from baseline to the end of the treatment in the experimental group (data not shown).” |
| Free of other bias? | Low risk | Baseline imbalances do not appear to have caused bias. |
| Methods | RCT (parallel) | |
| Participants | Country: Taiwan N=36 (10 female, 26 male); residents in a residential care facility Mean age: 77.6 (SD=8,4) Diagnosis of dementia: all diagnosed with dementia (DSM‐IV); Global Deterioration Scale (GDS) score of 3‐6 (moderate to severe dementia) | |
| Interventions | 1) group music with movement intervention, twice a week for 4 weeks. 2) standard care as usual | |
| Outcomes | Agitation assessed with a modified Cohen‐Mansfield Agitation Inventory (CMAI) | |
| Notes | ||
| Risk of bias | ||
| Bias | Authors' judgement | Support for judgement |
| Adequate sequence generation? | Low risk | Quote: "A randomised controlled trial was used. Participants were randomly assigned to either the experimental or control group using permuted block randomization." |
| Allocation concealment? | Low risk | Quote: "Assignments were concealed in sealed envelopes and the randomisation was performed by an external person so that the researchers were unaware of the order of assignment and block size." |
| Blinding? | Low risk | Review authors do not believe this will introduce bias in research studies involving dementia and music therapy. |
| Incomplete outcome data addressed? | Unclear risk | No information provided. |
| Free of selective reporting? | Low risk | the report includes all expected outcomes. |
| Free of other bias? | Unclear risk | The timeframe of observations in this study is not clear. The CMAI was modified to make observations for 60 minutes, with a 30 minute intervention. It was not specified at what precise moment the observations were conducted or how the 10 minute intervals were handled during analysis. |
| Methods | RCT (parallel) | |
| Participants | Country: Iceland N=38 (? female, ? male); residents in two nursing homes and two psychogeriatric wards Age range: 71‐87 (recruited sample, N=48) Diagnosis of dementia: all diagnosed with Alzheimers disease (ICD‐10); Global Deterioration Scale (GDS) score of 5‐7 (moderate to severe dementia) | |
| Interventions | 1) group music therapy (3‐4 patients), 3 times a week (6 weeks), 30 minutes per session 2) standard care as usual | |
| Outcomes | Behavioral and psychological symptoms of dementia (BPSD) assessed with the Behavior Pathology in Alzheimer's disease Rating Scale (BEHAVE‐AD) | |
| Notes | No clear baseline characteristics presented | |
| Risk of bias | ||
| Bias | Authors' judgement | Support for judgement |
| Adequate sequence generation? | Unclear risk | No information provided. |
| Allocation concealment? | Unclear risk | Quote"...The 46 remaining patients were then randomised to a music therapy group or a control group, with 23 individuals in each group." |
| Blinding? | Low risk | The outcome assessors were blinded. Quote: "Two nurses were trained in using the BEHAVE‐AD scale and they were blinded to the therapy used. The nurses were not part of the staff of the wards." |
| Incomplete outcome data addressed? | Unclear risk | No information provided. |
| Free of selective reporting? | Low risk | The study protocol is not available, however the report seems to include all expected outcomes, as is described in the methods section, although based on incorrect analyses. |
| Free of other bias? | Unclear risk | No clear baseline characteristics presented. |
Characteristics of excluded studies [ordered by study ID]
Jump to:
| Study | Reason for exclusion |
| RCT, no music therapy intervention. A small proportion of the study sample followed individualised music as an intervention (n=35). A non‐significant improvement was found on the total CMAI score. | |
| RCT, crossover, 8 weeks, comparison of group music therapy to video presentation on cognition (MMSE score). Patients participated in less than 5 music therapy sessions. | |
| RCT, Demented patients were excluded in this study, focus on healthy older adults (effects of individualized piano instruction on executive functioning and working memory) | |
| Not clear if patients were randomised. Patients participated in less than 5 sessions. | |
| RCT, crossover, comparing audiotapes with stimulated family presence to audiotapes with preferred music and a neutral placebo tape to reduce agitation. Less than 5 sessions in each group in which was listened to preferred music. | |
| RCT, patients were not demented but depressed older people. | |
| RCT, comparison of favourite music and hand massage, less then five sessions | |
| RCT, no music therapy, the study involved dance‐ and movement therapeutic methods. | |
| RCT, comparison of live interactive music, passive pre‐recorded music or silence for 30 minutes in a single session. Less than 5 sessions. | |
| RCt, no music therapy: a theatrically based intervention was given to 122 older adults who took lessons twice a week for 4 weeks. | |
| RCT, patients were not demented. | |
| RCT, music was part of physiotherapy. | |
| RCT, patients participated in less than 5 sessions. | |
| RCT, not clear whether patients were diagnosed with dementia. | |
| RCT, single test moment, music as cue to facilitate performance on a category fluency task. No therapeutic intervention. | |
| RCT, no music therapy, but music based exercises | |
| RCT, not clear whether patients were diagnosed with dementia. |
Data and analyses
| Outcome or subgroup title | No. of studies | No. of participants | Statistical method | Effect size |
| 1 Total minutes spent not wandering during all sessions of the main therapy Show forest plot | 1 | Mean Difference (IV, Fixed, 95% CI) | Totals not selected | |
| Analysis 1.1 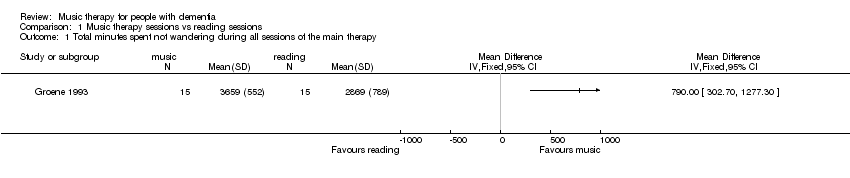 Comparison 1 Music therapy sessions vs reading sessions, Outcome 1 Total minutes spent not wandering during all sessions of the main therapy. | ||||
| 2 Total minutes wandering during all sessions of the secondary therapy Show forest plot | 1 | Mean Difference (IV, Fixed, 95% CI) | Totals not selected | |
| Analysis 1.2 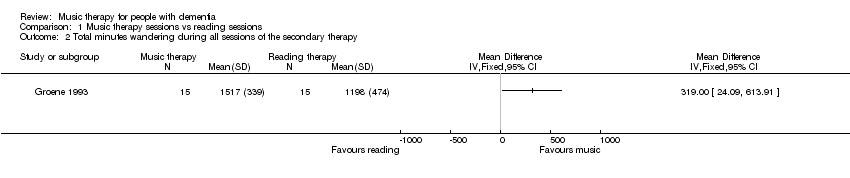 Comparison 1 Music therapy sessions vs reading sessions, Outcome 2 Total minutes wandering during all sessions of the secondary therapy. | ||||
| 3 Mean change in MMSE over a therapy session averaged over all sessions of the main therapy Show forest plot | 1 | Mean Difference (IV, Fixed, 95% CI) | Totals not selected | |
| Analysis 1.3 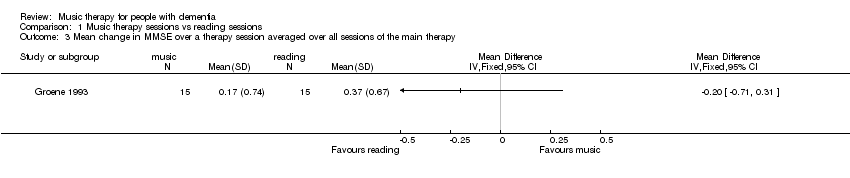 Comparison 1 Music therapy sessions vs reading sessions, Outcome 3 Mean change in MMSE over a therapy session averaged over all sessions of the main therapy. | ||||
| 4 Mean change in MMSE over a therapy session averaged over all sessions of the secondary therapy Show forest plot | 1 | Mean Difference (IV, Fixed, 95% CI) | Totals not selected | |
| Analysis 1.4 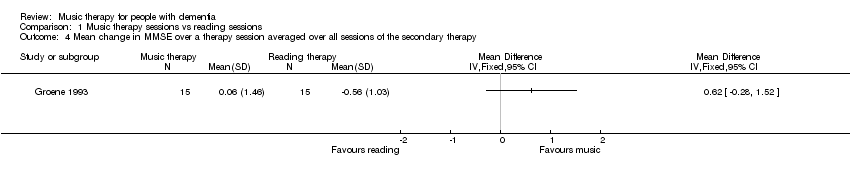 Comparison 1 Music therapy sessions vs reading sessions, Outcome 4 Mean change in MMSE over a therapy session averaged over all sessions of the secondary therapy. | ||||
| Outcome or subgroup title | No. of studies | No. of participants | Statistical method | Effect size |
| 1 No. of occurrences of agitated behaviours at 2 weeks Show forest plot | 1 | Mean Difference (IV, Fixed, 95% CI) | Totals not selected | |
| Analysis 2.1  Comparison 2 Group music with movement intervention vs. usual care, Outcome 1 No. of occurrences of agitated behaviours at 2 weeks. | ||||
| 2 No. of occurrences of agitated behaviours at 4 weeks Show forest plot | 1 | Mean Difference (IV, Fixed, 95% CI) | Totals not selected | |
| Analysis 2.2 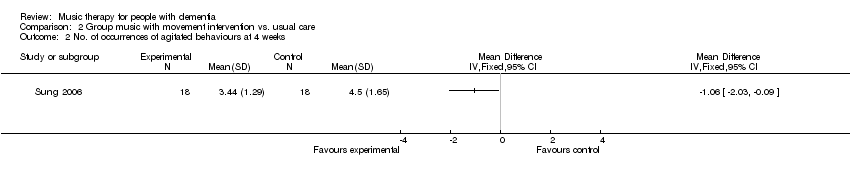 Comparison 2 Group music with movement intervention vs. usual care, Outcome 2 No. of occurrences of agitated behaviours at 4 weeks. | ||||
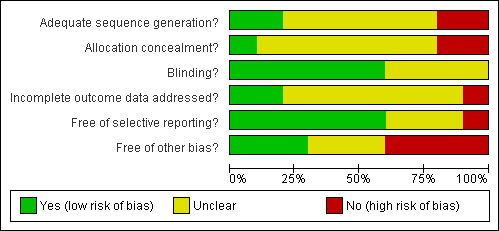
Methodological quality graph: review authors' judgements about each methodological quality item presented as percentages across all included studies.

Methodological quality summary: review authors' judgements about each methodological quality item for each included study.
Comparison 1 Music therapy sessions vs reading sessions, Outcome 1 Total minutes spent not wandering during all sessions of the main therapy.
Comparison 1 Music therapy sessions vs reading sessions, Outcome 2 Total minutes wandering during all sessions of the secondary therapy.
Comparison 1 Music therapy sessions vs reading sessions, Outcome 3 Mean change in MMSE over a therapy session averaged over all sessions of the main therapy.
Comparison 1 Music therapy sessions vs reading sessions, Outcome 4 Mean change in MMSE over a therapy session averaged over all sessions of the secondary therapy.
Comparison 2 Group music with movement intervention vs. usual care, Outcome 1 No. of occurrences of agitated behaviours at 2 weeks.
Comparison 2 Group music with movement intervention vs. usual care, Outcome 2 No. of occurrences of agitated behaviours at 4 weeks.
| Author | Results | Comments |
| Clark et. al (1998) | A significant difference (T(2.50;p:<.05) was found between total no. of aggressive behaviours between music (M‐65.6) and no music (M‐121.6). For separate behaviours only for hitting (T 2.30; p:<0.5). Length of bathing: no difference between music and no music. | ‐ please note that the risk of bias in this study is uncertain (see figure 2), so please interpret the reported results with caution. ‐The total number of events for each behaviour is calculated for each treatment group. This is the sum of events over 10 episodes for all 18 patients when receiving music treatment and then when receiving no music. The analysis appears to be related to the difference between these two means, but the exact analysis is not described. |
| Gerdner (2000) | Freq. of agitated behaviours was significantly less both during and after individualised music. No significant difference between baseline and first 20 minutes of classical minutes. Significant decrease did occur in the final 10 minutes. Both types of music were more effective than baseline, with more effect for individualised music. | ‐ please note that the risk of bias in this study is uncertain (see figure 2), so please interpret the reported results with caution. It seems that the data have not been analysed correctly: |
| Groene (1993) | Significant difference in mean seating/proximity time in favour of music over the reading treatment (p<.001). No significant effects or interactions in seating/proximity behavior for the factors sex, age, or months on site at the facility. No significant differences in wandering behavior were revealed between the mostly music and mostly reading group. There was a significant difference between the mean wandering scores during the 5 music sessions versus the 2 reading sessions of the mostly music group in favour of the music sessions (t(14)=2.25, p<0,41. No significant difference in pre and posttest of MMSE. | ‐ please note that the risk of bias in this study is uncertain (see figure 2), so please interpret the reported results with caution.‐No washout period, which could have diluted the effect. The effect for the music sessions alone: Music therapy 3658.73 (552) reading therapy 2869.33 (789) t=3.2 p<0.002. |
| Raglio (2008) | There was a significant decrease in the global NPI scores in the experimental group in comparison with the control group (interaction time x group: F=5.06, p=0.002). Differences were significant at after 8 weeks (F=9.85; p=0.003); after 16 weeks (F=21.21; p=0<0.001) and after 20 weeks (F=12.65; p=0.0007). There were no changes in MMSE scores in both the experimental group and the control group. The Barthel Index score significantly decreased over time in both the experimental (59 to 52) as in the control group (51 to 46); F=8.91; p=0.001) | ‐ the changes in the NPI scores were presented for the separate items, without standard deviation ‐ no details were provided for the Barthel Index score, no standard deviation. |
| Raglio (n.d) | There was a significant decrease over time in the global NPI scores in both groups (F=9.06, p<0.001), a significant difference between groups (F=4.84, p < 0,5) with a larger reduction of behavioural disturbances in the experimental group at the end of the treatment (T1) (t=‐2,58; p<0.001; Cohen's d=0,63). In analysis of single NPI item scores it shows that delusions, agitation and apathy significantly improved in the experimental group and not in the control group. In both groups depression, anxiety and irritability significantly improved. Abberant motor activity improved in the control group and not in the experimental group. Post hoc analysis showed that the main improvements were found at T1 (end of treatment) and persisted over time at the follow up (T2). The patients communicative and relational skills did not improve from baseline to the end of the treatment in the experimental group. | ‐ please note that the risk of bias in this study is uncertain (see figure 2), so please interpret the reported results with caution. ‐ No data is presented on the Mini Mental State Examination (MMSE) or the Barthel Index, only for the baseline scores and not T1 (end of treatment) and T2 (1 month after the last wash out). ‐ It is not clear from the article how changes in communicative and relational skills were measured except from the statement that a specific observational scheme was used. No data is presented. ‐ criteria for randomisation were not standardized. ‐ baseline NPI scores differed slightly (T= ‐ 1.49; p=0,14) between exp. (20.2) and control group (28.7), possibly affecting the comparability of the two groups. |
| Sung (2006) | The mean number of agitated behaviours was significantly decreased following a group music program with movement interventions, by 1.17 at week 2 (of 4 weeks) and further decreased by 0.5 at week 4, also significantly lower in comparison to the control group. The mean decrease of the total period of 4 weeks amounted to 1.67 less agitated behaviours compared to a decrease of 0.22 for those patients receiving no intervention, other than care as usual. Changes in occurrence over the 4‐week time frame were significantly different between experimental and control group (ANOVA, F=15.03, p< .001) | ‐ no t‐test statistic provided for the decrease with 1.17 points at week 2 in the article; ‐The timeframe of observations in this study is not entirely clear from the article. The CMAI was modified to make observations for 60 minutes, with a 30 minute intervention. It was not specified at what precise moments the observations were conducted, with preceding or continuing observations for additional 30 minutes (?) or how the 10 minute intervals were handled during analysis, with respect to the intervention and missing data. |
| Svansdottir (2006) | For the total BEHAVE‐AD scores no significant changes were noted after 6 weeks (p=0.3 for the music therapy group and p>0.5 for the control group). For the single subscale 'activity disturbances', a significant lower score was found for the experimental group (p=.02) in comparison to the control group (p>.05) There was no decrease in symptoms rated in other single subscales of the BEHAVE‐AD, nor for the therapy group or the control group. For three of the seven categories combined of the BEHAVE‐AD (activity disturbances, agressivness and anxiety), there was a significant reduction in symptoms in the therapy group (p<.01) but not for the control group (p=0.5). At the follow‐up measurement, the benefits of music therapy had disappeared 4 weeks after the last session according to all ratings. | ‐ please note that the risk of bias in this study is uncertain (see figure 2), so please interpret the reported results with caution.‐ no baseline characteristics are presented, unclear how many men and females participated, nor their age or their average GDS score. ‐ not clear if groups were different or similar at baseline assessment scores on the BEHAVE‐AD ‐ insufficient details on statistical tests ‐ only average mean scores are presented and no standard deviation scores |
| Author | Results | Comments |
| Brotons/Koger (2000) | Significant main effects for condition (n‐20): Music versus Conversation: F(1,19)=7.4, p=0.1Speech versus fluency F(1.19)=10.581, p=.004 with performance better in music relative to conversation and fluency relative to content. No significant interaction effect: Performance during music was better than conversation for both speech content and fluency. (p=.09). No difference on subscale auditory verbal comprehension (n‐19; p=>.1). No difference on MMSE before/after 2 weeks posttreatment. No significance overall aphasia quotient: (n‐10; p>.1). | There was no mention of how the cross‐over design was dealt with during analysis. Dependency in data seems to be ignored. |
| Author | Results | Comments |
| Lord (1993) | Analysis of variance showed that the music group was more alert, happier and had higher recall of past personal history than patients in other two groups. | ‐ please note that the risk of bias in this study is uncertain (see figure 2), so please interpret the reported results with caution. ‐The article reports that the number of correct answers for each of the 3 groups was summed for baseline and post treatment, and then a one‐way analysis of variance conducted. We are not told how the data were analysed, whether the baseline was used as a covariate. Table 1 analysis of variance, although showing significant differences between the 3 therapies does not make sense. The degrees of freedom within groups are not correct for a start. To interpret this table we need far more information. Even if we believe the results in table 2, the paired comparisons, all we can deduce is that the treatments were different. They may be different in the level of participation in the therapies, but that does not tell us whether the therapy brought any benefit.The article reports that the number of correct answers for each of the 3 groups was summed for baseline and post treatment, and then a one‐way analysis of variance conducted. No information on how the data were analysed, whether the baseline was used as a covariate. Table 1 analysis of variance, although showing significant differences between the 3 therapies does not seem valid. For example, the degrees of freedom within groups are not correct. To interpret this table far more information is required. Even if the results in table 2 are accepted, all that can be deduced is that the treatments were different. They may be different in the level of participation in the therapies, but that does not explain whether the therapy itself brought any benefit. |
| Guétin (2009) | Anxiety: Anova with repeated measures (D0, W4, W8 and W16) showed a significant difference (p<0.001) in the Hamilton Scale score. At baseline, the anxiety level score was comparable: 22 ( ± 5.3) music therapy group and 21.1 ( ± 5.6) control group. This level decreased further in the music therapy group at W16, 8.4 ( ± 3.7) versus 20.8 ( ±6.2) for the control group. The changes between D0 and W16/ W24 were significantly different between the 2 groups (p < 0.001), with lower anxiety levels for the experimental group. Depression: ANOVA with repeated measures, with adjustment to the GDS score at D0, showed a significant difference between the 2 groups (p = 0.001) at W16 (end of treatment) The overall changes were not significant over time, each group progressed in a different manner during follow‐up (significant time/group interaction p = 0.0095). At W16, scores improved with 7.7 ( ± 4.6) points, i.e. 47.1% in the music therapy group; mean depression score of 16.7 ( ±6.2). In the control group scores improved with 0.2 ( ±4.4) points, i.e. 1.7%, mean depression score of 11.8 ( ± 7.4). At week 24 (follow‐up) the depression score was 12.5 ( ± 6.4) in the music therapy group and 12.1 ( ± 7.6) in the control group and differed significantly from D0 (p=0.03). MMSE: no significant differences between D0 and W16, both in experimental as control group. | ‐ please note that the risk of bias in this study is uncertain (see figure 2), so please interpret the reported results with caution. ‐ the precise intervention offered in the control condition is not clearly described, it is only stated that they participated in "sessions involving rest and reading". |
| active group music therapy | individual listening | ||
| Brotons/Koger (2000) | Language skills Significant main effects for condition (n‐20): Music versus Conversation: F(1,19)=7.4, p=0.1Speech versus fluency F(1.19)=10.581, p=.004 with performance better in music relative to conversation and fluency relative to content. No significant interaction effect: Performance during music was better than conversation for both speech content and fluency. (p=.09). No difference on subscale auditory verbal comprehension (n‐19; p=>.1). No difference on MMSE before/after 2 weeks posttreatment. No significance overall aphasia quotient: (n‐10; p>.1). | Clark et. al (1998) | Agitation A significant difference (T(2.50;p:<.05) was found between total no. of aggressive behaviours between music (M‐65.6) and no music (M‐121.6). For separate behaviours only for hitting (T 2.30; p:<0.5). Length of bathing: no difference between music and no music. |
| Gerdner (2000) | Agitation Freq. of agitated behaviours was significantly less both during and after individualised music. No significant difference between baseline and first 20 minutes of classical minutes. Significant decrease did occur in the final 10 minutes. Both types of music were more effective than baseline, with more effect for individualised music. | Gerdner (2000) | Agitation Freq. of agitated behaviours was significantly less both during and after individualised music. No significant difference between baseline and first 20 minutes of classical minutes. Significant decrease did occur in the final 10 minutes. Both types of music were more effective than baseline, with more effect for individualised music. |
| Groene (1993) | AgitationSignificant difference in mean seating/proximity time in favor of music over the reading treatment (p<.001). No significant effects or interactions in seating/proximity behavior for the factors sex, age, or months on site at the facility. No significant differences in wandering behavior were revealed between the mostly music and mostly reading group. There was a significant difference between the mean wandering scores during the 5 music sessions versus the 2 reading sessions of the mostly music group in favour of the music sessions (t(14)=2.25, p<0,41. No significant difference in pre and posttest of MMSE. | Guétin (2009) | Anxiety: Anova with repeated measures (D0, W4, W8 and W16) showed a significant difference (p<0.001) in the Hamilton Scale score. At baseline, the anxiety level score was comparable: 22 ( ± 5.3) music therapy group and 21.1 ( ± 5.6) control group. This level decreased further in the music therapy group at W16, 8.4 ( ± 3.7) versus 20.8 ( ±6.2) for the control group. The changes between D0 and W16/ W24 were significantly different between the 2 groups (p < 0.001), with lower anxiety levels for the experimental group. Depression: ANOVA with repeated measures, with adjustment to the GDS score at D0, showed a significant difference between the 2 groups (p = 0.001) at W16 (end of treatment) The overall changes were not significant over time, each group progressed in a different manner during follow‐up (significant time/group interaction p = 0.0095). At W16, scores improved with 7.7 ( ± 4.6) points, i.e. 47.1% in the music therapy group; mean depression score of 16.7 ( ±6.2). In the control group scores improved with 0.2 ( ±4.4) points, i.e. 1.7%, mean depression score of 11.8 ( ± 7.4). At week 24 (follow‐up) the depression score was 12.5 ( ± 6.4) in the music therapy group and 12.1 ( ± 7.6) in the control group and differed significantly from D0 (p=0.03). MMSE: no significant differences between D0 and W16, both in experimental as control group. |
| Raglio (2008) | Agitation There was a significant decrease in the global NPI scores in the experimental group in comparison with the control group (interaction time x group: F=5.06, p=0.002). Differences were significant at after 8 weeks (F=9.85; p=0.003); after 16 weeks (F=21.21; p=0<0.001) and after 20 weeks (F=12.65; p=0.0007). There were no changes in MMSE scores in both the experimental group and the control group. The Barthel Index score significantly decreased over time in both the experimental (59 to 52) as in the control group (51 to 46); F=8.91; p=0.001) | ||
| Raglio (n.d) | Agitation There was a significant decrease over time in the global NPI scores in both groups (F=9.06, p<0.001), a significant difference between groups (F=4.84, p < 0,5) with a larger reduction of behavioural disturbances in the experimental group at the end of the treatment (T1) (t=‐2,58; p<0.001; Cohen's d=0,63). In analysis of single NPI item scores it shows that delusions, agitation and apathy significantly improved in the experimental group and not in the control group. In both groups depression, anxiety and irritability significantly improved. Abberant motor activity improved in the control group and not in the experimental group. Post hoc analysis showed that the main improvements were found at T1 (end of treatment) and persisted over time at the follow up (T2). The patients communicative and relational skills did not improve from baseline to the end of the treatment in the experimental group. | ||
| Sung (2006) | Agitation The mean number of agitated behaviours was significantly decreased following a group music program with movement interventions, by 1.17 at week 2 (of 4 weeks) and further decreased by 0.5 at week 4, also significantly lower in comparison to the control group. The mean decrease of the total period of 4 weeks amounted to 1.67 less agitated behaviours compared to a decrease of 0.22 for those patients receiving no intervention, other than care as usual. Changes in occurrence over the 4‐week time frame were significantly different between experimental and control group (ANOVA, F=15.03, p< .001) | ||
| Svansdottir (2006) | Agitation For the total BEHAVE‐AD scores no significant changes were noted after 6 weeks (p=0.3 for the music therapy group and p>0.5 for the control group). For the single subscale 'activity disturbances', a significant lower score was found for the experimental group (p=.02) in comparison to the control group (p>.05) There was no decrease in symptoms rated in other single subscales of the BEHAVE‐AD, nor for the therapy group or the control group. For three of the seven categories combined of the BEHAVE‐AD (activity disturbances, agressivness and anxiety), there was a significant reduction in symptoms in the therapy group (p<.01) but not for the control group (p=0.5). At the follow‐up measurement, the benefits of music therapy had disappeared 4 weeks after the last session according to all ratings. | ||
| Lord (1993) | Social/emotional functioning Analysis of variance showed that the music group was more alert, happier and had higher recall of past personal history than patients in other two groups. |
| Outcome or subgroup title | No. of studies | No. of participants | Statistical method | Effect size |
| 1 Total minutes spent not wandering during all sessions of the main therapy Show forest plot | 1 | Mean Difference (IV, Fixed, 95% CI) | Totals not selected | |
| 2 Total minutes wandering during all sessions of the secondary therapy Show forest plot | 1 | Mean Difference (IV, Fixed, 95% CI) | Totals not selected | |
| 3 Mean change in MMSE over a therapy session averaged over all sessions of the main therapy Show forest plot | 1 | Mean Difference (IV, Fixed, 95% CI) | Totals not selected | |
| 4 Mean change in MMSE over a therapy session averaged over all sessions of the secondary therapy Show forest plot | 1 | Mean Difference (IV, Fixed, 95% CI) | Totals not selected | |
| Outcome or subgroup title | No. of studies | No. of participants | Statistical method | Effect size |
| 1 No. of occurrences of agitated behaviours at 2 weeks Show forest plot | 1 | Mean Difference (IV, Fixed, 95% CI) | Totals not selected | |
| 2 No. of occurrences of agitated behaviours at 4 weeks Show forest plot | 1 | Mean Difference (IV, Fixed, 95% CI) | Totals not selected | |