| 1 Disability ‐ Lawton IADL Show forest plot | 2 | | Mean Difference (IV, Fixed, 95% CI) | Subtotals only |
|
| 1.1 During usual care | 0 | 0 | Mean Difference (IV, Fixed, 95% CI) | 0.0 [0.0, 0.0] |
| 1.2 After usual care | 2 | 113 | Mean Difference (IV, Fixed, 95% CI) | 0.83 [‐0.51, 2.17] |
| 2 Disability ‐ Barthel ADL Show forest plot | 2 | | Mean Difference (IV, Random, 95% CI) | Subtotals only |
|
| 2.1 During usual care | 0 | 0 | Mean Difference (IV, Random, 95% CI) | 0.0 [0.0, 0.0] |
| 2.2 After usual care | 2 | 113 | Mean Difference (IV, Random, 95% CI) | 2.87 [‐1.37, 7.12] |
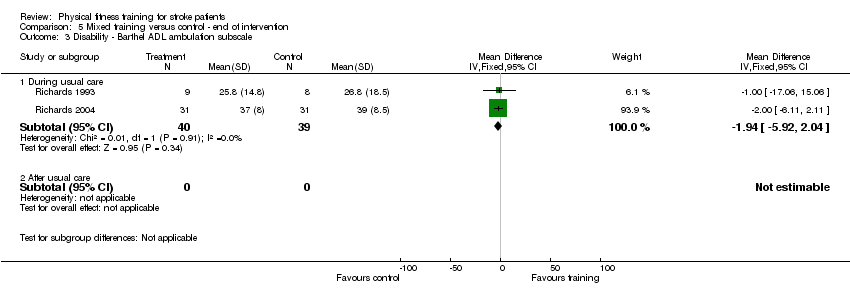
| 3 Disability ‐ Barthel ADL ambulation subscale Show forest plot | 2 | | Mean Difference (IV, Fixed, 95% CI) | Subtotals only |
|
| 3.1 During usual care | 2 | 79 | Mean Difference (IV, Fixed, 95% CI) | ‐1.94 [‐5.92, 2.04] |
| 3.2 After usual care | 0 | 0 | Mean Difference (IV, Fixed, 95% CI) | 0.0 [0.0, 0.0] |
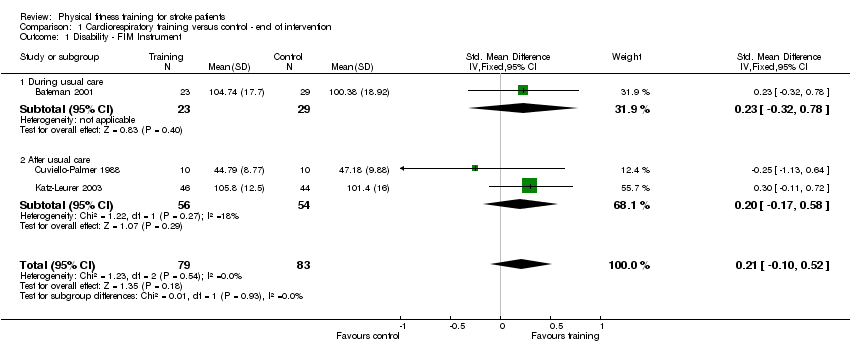
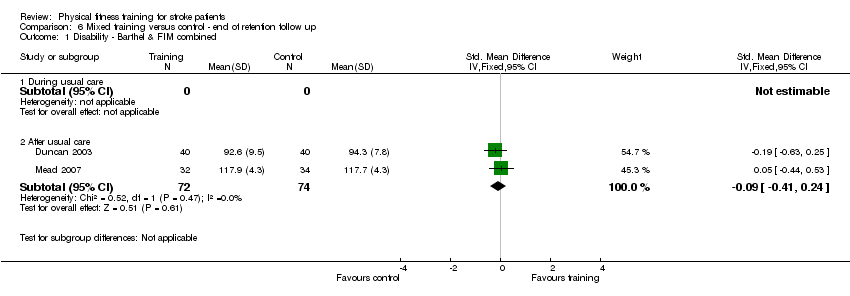
| 4 Disability ‐ Barthel & FIM Instrument Show forest plot | 3 | 179 | Std. Mean Difference (IV, Fixed, 95% CI) | 0.27 [‐0.02, 0.57] |
|
| 4.1 During usual care | 0 | 0 | Std. Mean Difference (IV, Fixed, 95% CI) | 0.0 [0.0, 0.0] |
| 4.2 After usual care | 3 | 179 | Std. Mean Difference (IV, Fixed, 95% CI) | 0.27 [‐0.02, 0.57] |
| 5 Physical fitness ‐ strength, ankle dorsiflexion* Show forest plot | 2 | | Std. Mean Difference (IV, Random, 95% CI) | Subtotals only |
|
| 5.1 During usual care | 0 | 0 | Std. Mean Difference (IV, Random, 95% CI) | 0.0 [0.0, 0.0] |
| 5.2 After usual care | 2 | 148 | Std. Mean Difference (IV, Random, 95% CI) | 0.80 [‐0.82, 2.41] |
| 6 Physical fitness ‐ strength, knee extension* Show forest plot | 2 | | Std. Mean Difference (IV, Fixed, 95% CI) | Subtotals only |
|
| 6.1 During usual care | 0 | 0 | Std. Mean Difference (IV, Fixed, 95% CI) | 0.0 [0.0, 0.0] |
| 6.2 After usual care | 2 | 148 | Std. Mean Difference (IV, Fixed, 95% CI) | 0.34 [0.02, 0.67] |
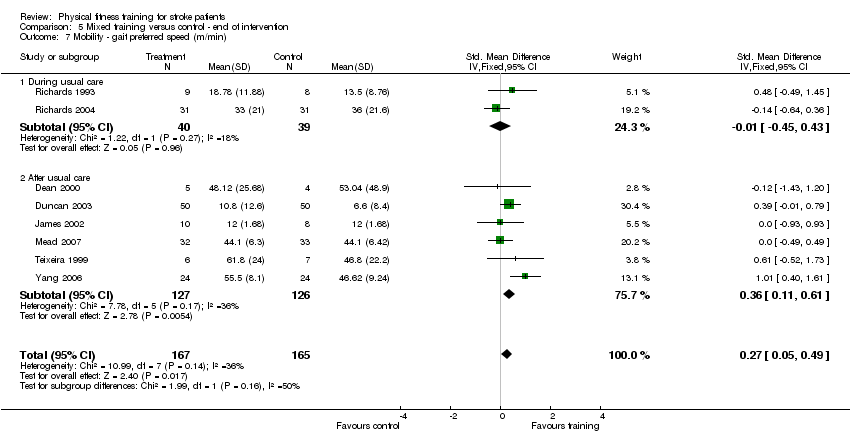
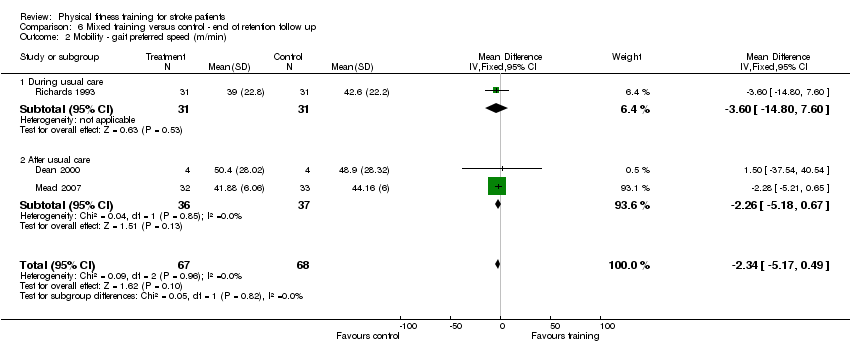
| 7 Mobility ‐ gait preferred speed (m/min) Show forest plot | 8 | 332 | Std. Mean Difference (IV, Fixed, 95% CI) | 0.27 [0.05, 0.49] |
|
| 7.1 During usual care | 2 | 79 | Std. Mean Difference (IV, Fixed, 95% CI) | ‐0.01 [‐0.45, 0.43] |
| 7.2 After usual care | 6 | 253 | Std. Mean Difference (IV, Fixed, 95% CI) | 0.36 [0.11, 0.61] |
| 8 Mobility ‐ gait preferred speed (m/min); subgroup: therapy time Show forest plot | 8 | 332 | Std. Mean Difference (IV, Fixed, 95% CI) | 0.27 [0.05, 0.49] |
|
| 8.1 Confounded | 5 | 196 | Std. Mean Difference (IV, Fixed, 95% CI) | 0.51 [0.23, 0.80] |
| 8.2 Unconfounded | 3 | 136 | Std. Mean Difference (IV, Fixed, 95% CI) | ‐0.07 [‐0.41, 0.27] |
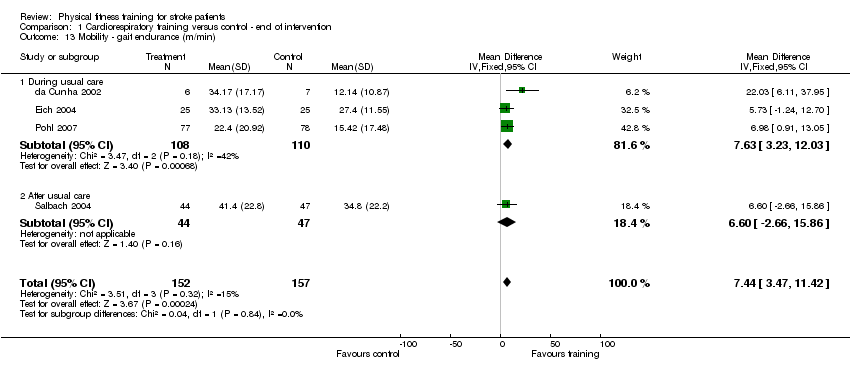
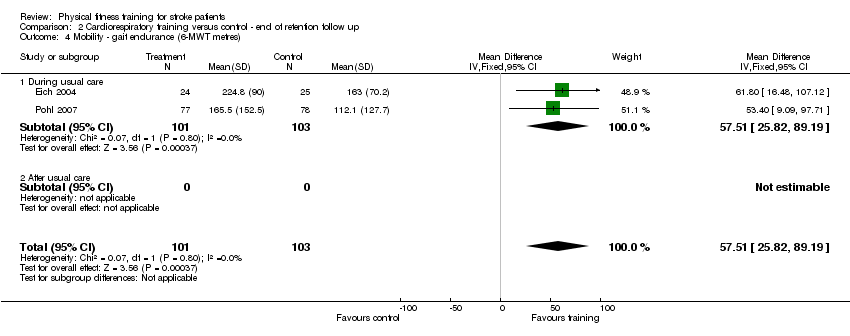
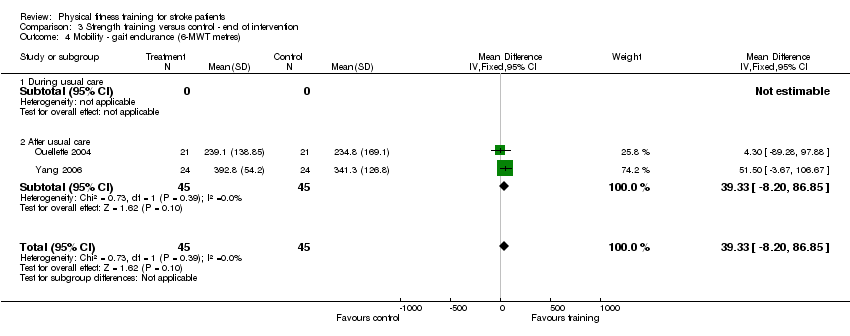
| 9 Mobility ‐ gait endurance (6 MWT metres) Show forest plot | 4 | 177 | Std. Mean Difference (IV, Fixed, 95% CI) | 0.39 [0.09, 0.69] |
|
| 9.1 During usual care | 0 | 0 | Std. Mean Difference (IV, Fixed, 95% CI) | 0.0 [0.0, 0.0] |
| 9.2 After usual care | 4 | 177 | Std. Mean Difference (IV, Fixed, 95% CI) | 0.39 [0.09, 0.69] |
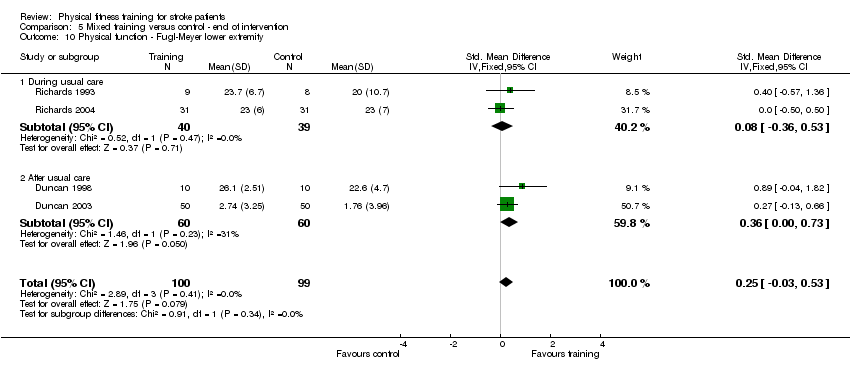
| 10 Physical function ‐ Fugl‐Meyer lower extremity Show forest plot | 4 | 199 | Std. Mean Difference (IV, Fixed, 95% CI) | 0.25 [‐0.03, 0.53] |
|
| 10.1 During usual care | 2 | 79 | Std. Mean Difference (IV, Fixed, 95% CI) | 0.08 [‐0.36, 0.53] |
| 10.2 After usual care | 2 | 120 | Std. Mean Difference (IV, Fixed, 95% CI) | 0.36 [0.00, 0.73] |
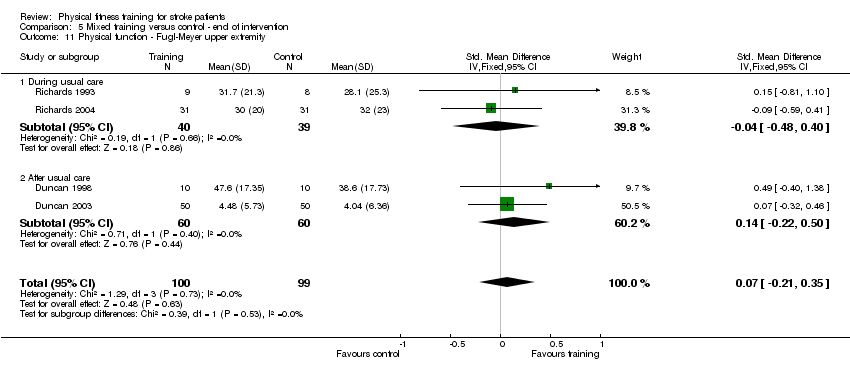
| 11 Physical function ‐ Fugl‐Meyer upper extremity Show forest plot | 4 | 199 | Std. Mean Difference (IV, Fixed, 95% CI) | 0.07 [‐0.21, 0.35] |
|
| 11.1 During usual care | 2 | 79 | Std. Mean Difference (IV, Fixed, 95% CI) | ‐0.04 [‐0.48, 0.40] |
| 11.2 After usual care | 2 | 120 | Std. Mean Difference (IV, Fixed, 95% CI) | 0.14 [‐0.22, 0.50] |
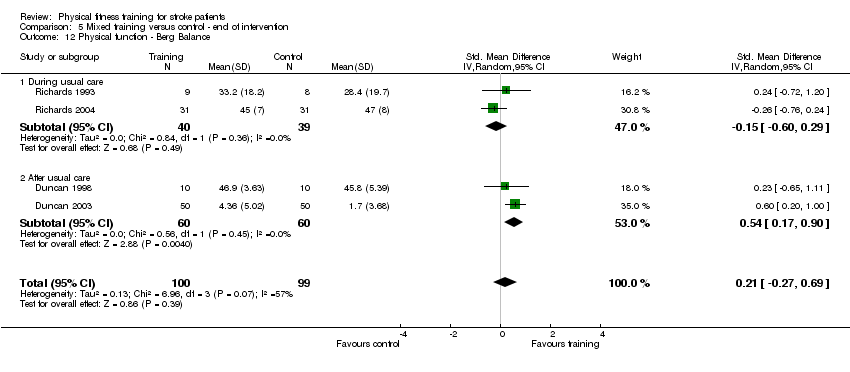
| 12 Physical function ‐ Berg Balance Show forest plot | 4 | 199 | Std. Mean Difference (IV, Random, 95% CI) | 0.21 [‐0.27, 0.69] |
|
| 12.1 During usual care | 2 | 79 | Std. Mean Difference (IV, Random, 95% CI) | ‐0.15 [‐0.60, 0.29] |
| 12.2 After usual care | 2 | 120 | Std. Mean Difference (IV, Random, 95% CI) | 0.54 [0.17, 0.90] |
| 13 Physical function ‐ functional reach Show forest plot | 2 | | Std. Mean Difference (IV, Fixed, 95% CI) | Subtotals only |
|
| 13.1 During usual care | 0 | 0 | Std. Mean Difference (IV, Fixed, 95% CI) | 0.0 [0.0, 0.0] |
| 13.2 After usual care | 2 | 166 | Std. Mean Difference (IV, Fixed, 95% CI) | 0.13 [‐0.18, 0.43] |
| 14 Physical function ‐ timed up and go (sec) Show forest plot | 4 | 185 | Mean Difference (IV, Fixed, 95% CI) | ‐1.14 [‐2.06, ‐0.22] |
|
| 14.1 During usual care | 1 | 62 | Mean Difference (IV, Fixed, 95% CI) | ‐2.0 [‐11.24, 7.24] |
| 14.2 After usual care | 3 | 123 | Mean Difference (IV, Fixed, 95% CI) | ‐1.13 [‐2.05, ‐0.21] |
| 15 Physical function ‐ timed up and go (sec); sensitivity analysis: excluding Yang 2006 Show forest plot | 3 | 137 | Mean Difference (IV, Fixed, 95% CI) | ‐1.16 [‐2.93, 0.62] |
|
| 15.1 During usual care | 1 | 62 | Mean Difference (IV, Fixed, 95% CI) | ‐2.0 [‐11.24, 7.24] |
| 15.2 After usual care | 2 | 75 | Mean Difference (IV, Fixed, 95% CI) | ‐1.12 [‐2.93, 0.69] |
| 16 Health related QoL ‐ SF‐36 role physical Show forest plot | 3 | 178 | Std. Mean Difference (IV, Fixed, 95% CI) | 0.56 [0.26, 0.86] |
|
| 16.1 During usual care | 0 | 0 | Std. Mean Difference (IV, Fixed, 95% CI) | 0.0 [0.0, 0.0] |
| 16.2 After usual care | 3 | 178 | Std. Mean Difference (IV, Fixed, 95% CI) | 0.56 [0.26, 0.86] |
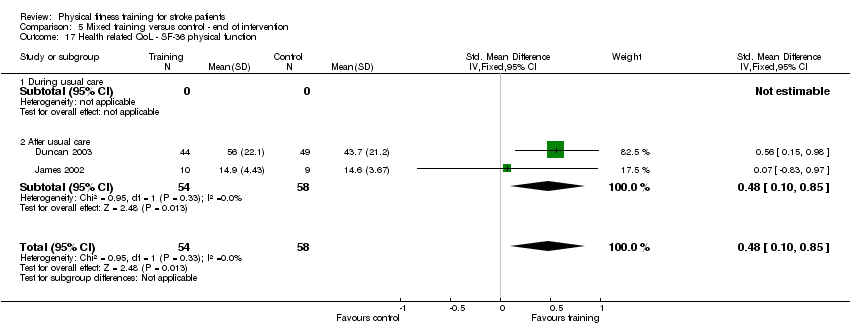
| 17 Health related QoL ‐ SF‐36 physical function Show forest plot | 2 | 112 | Std. Mean Difference (IV, Fixed, 95% CI) | 0.48 [0.10, 0.85] |
|
| 17.1 During usual care | 0 | 0 | Std. Mean Difference (IV, Fixed, 95% CI) | 0.0 [0.0, 0.0] |
| 17.2 After usual care | 2 | 112 | Std. Mean Difference (IV, Fixed, 95% CI) | 0.48 [0.10, 0.85] |
| 18 Health related QoL ‐ SF‐36 social function Show forest plot | 2 | 112 | Std. Mean Difference (IV, Random, 95% CI) | 0.48 [‐0.22, 1.17] |
|
| 18.1 During usual care | 0 | 0 | Std. Mean Difference (IV, Random, 95% CI) | 0.0 [0.0, 0.0] |
| 18.2 After usual care | 2 | 112 | Std. Mean Difference (IV, Random, 95% CI) | 0.48 [‐0.22, 1.17] |
| 19 Mobility ‐ Community Ambulation Speed (> 0.8 m/sec) Show forest plot | 2 | 165 | Odds Ratio (M‐H, Fixed, 95% CI) | 1.31 [0.70, 2.44] |
|
| 19.1 During usual care | 0 | 0 | Odds Ratio (M‐H, Fixed, 95% CI) | 0.0 [0.0, 0.0] |
| 19.2 After usual care | 2 | 165 | Odds Ratio (M‐H, Fixed, 95% CI) | 1.31 [0.70, 2.44] |