Tratamiento intervencionista versus expectante para la preeclampsia grave entre las semanas 24 y 34 de embarazo
Appendices
Appendix 1. Search strategy
CENTRAL (The Cochrane LIbrary 2006, Issue 2)
#1 MeSH descriptor Pregnancy explode all trees in MeSH products
#2 MeSH descriptor Pregnancy Complications explode all trees in MeSH products
#3 preeclamp* in All Fields in all products
#4 pre‐eclamp* in All Fields in all products
#5 pre next eclamp* in All Fields in all products
#6 eclamp* in All Fields in all products
#7 hypertens* in All Fields in all products
#8 #1 or #2
#9 #3 or #4 or #5 or #6 or #7
#10 aggressive near management in All Fields in all products
#11 early near delivery in All Fields in all products
#12 expectant near management in All Fields in all products
#13 delayed near delivery in All Fields in all products
#14 #10 or #11 or #12 or #13
#15 #8 and #9 and #14
Appendix 2. Methods used to assess trials included in previous versions of this review
The following methods were used to assess Odendaal 1990 and Sibai 1994.
Two review authors assessed potentially eligible trials for their suitability for inclusion in the review. Decisions regarding inclusion were made separately and results compared. Any disagreement was resolved through discussion. Data were extracted by two authors using an agreed format, and again discrepancies resolved through discussion. If agreement could not be reached that item was excluded until further information was available from the trialists. Data were entered by one author, and double checked by the other.
Validity of each included trial was assessed according to the criteria outlined in the Cochrane Reviewers' Handbook (Higgins 2005). Trials were assessed with a grade allocated to each trial on the basis of allocation concealment: A (adequate), B (unclear), or C (clearly inadequate). Where the method of allocation concealment was unclear, attempts were made to contact authors to provide further details. Quasi‐randomised designs, such as alternate allocation and use of record numbers, were excluded.
Blinding and completeness of follow‐up were assessed for each outcome using the following criteria:
For completeness of follow‐up:
A. less than 3% of participants excluded;
B. 3% to 9.9% of participants excluded;
C. 10% to 19.9% of participants excluded.
Excluded: if not possible to present the data by intention to treat or if more than 20% of participants were excluded.
For blinding of assessment of outcome:
A. double blind;
B. single blind;
C. no blinding or blinding not mentioned.
Excluded: no blinding and the outcome very subjective.
Statistical analyses were carried out using the Review Manager software (RevMan 2000) with results presented as summary relative risk, risk difference and number needed to treat. Tests of heterogeneity between trials were applied to assess the significance of any differences between trials and possible causes of any heterogeneity were explored.
Wherever possible, subgroup analyses for the main outcomes were performed by gestation at trial entry (24 to 28 weeks and 29 to 34 weeks), severity of pre‐eclampsia (HELLP syndrome or imminent eclampsia and neither of these).

'Risk of bias' graph: review authors' judgements about each risk of bias item presented as percentages across all included studies.
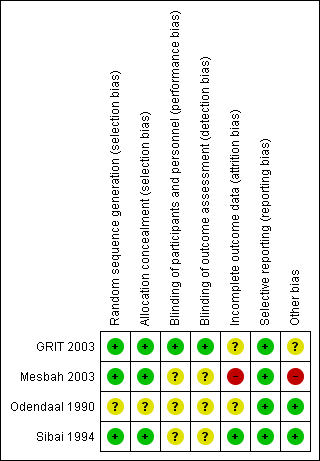
'Risk of bias' summary: review authors' judgements about each risk of bias item for each included study.

Comparison 1 Interventionist care versus expectant (delayed delivery) care for severe pre‐eclampsia, Outcome 1 Eclampsia.

Comparison 1 Interventionist care versus expectant (delayed delivery) care for severe pre‐eclampsia, Outcome 2 HELLP syndrome.
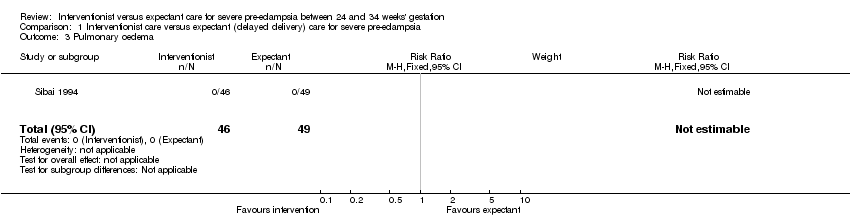
Comparison 1 Interventionist care versus expectant (delayed delivery) care for severe pre‐eclampsia, Outcome 3 Pulmonary oedema.

Comparison 1 Interventionist care versus expectant (delayed delivery) care for severe pre‐eclampsia, Outcome 4 Death of the baby (all stillbirths, neonatal and infant deaths).
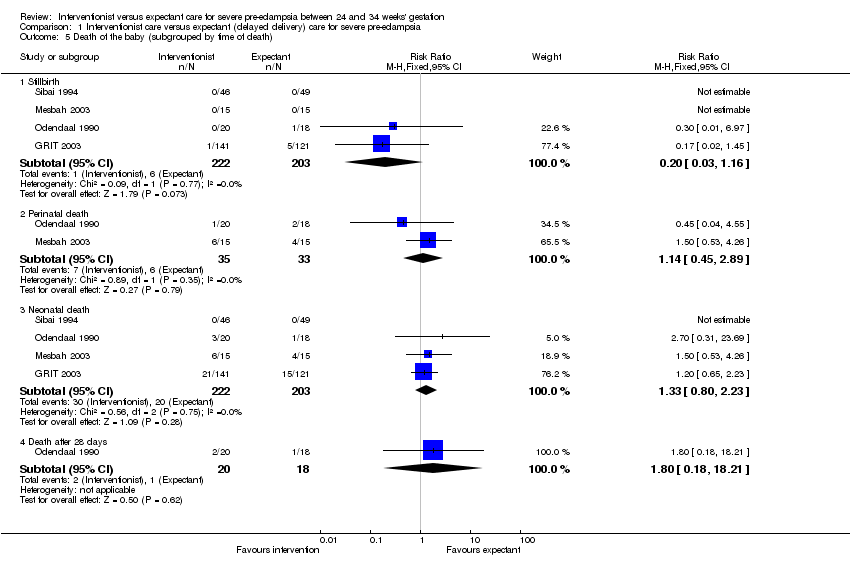
Comparison 1 Interventionist care versus expectant (delayed delivery) care for severe pre‐eclampsia, Outcome 5 Death of the baby (subgrouped by time of death).
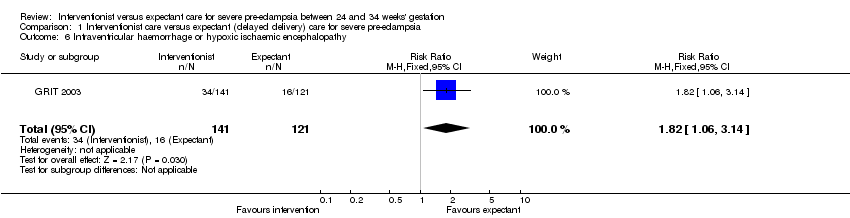
Comparison 1 Interventionist care versus expectant (delayed delivery) care for severe pre‐eclampsia, Outcome 6 Intraventricular haemorrhage or hypoxic ischaemic encephalopathy.
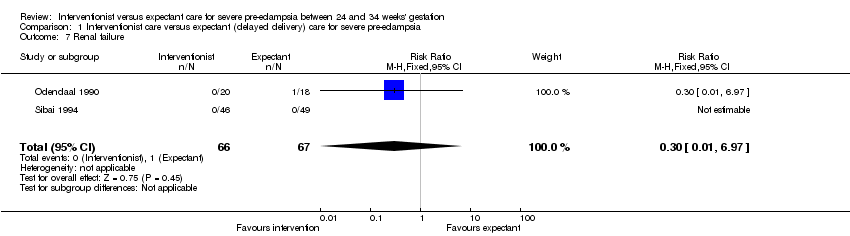
Comparison 1 Interventionist care versus expectant (delayed delivery) care for severe pre‐eclampsia, Outcome 7 Renal failure.

Comparison 1 Interventionist care versus expectant (delayed delivery) care for severe pre‐eclampsia, Outcome 8 Caesarean section.
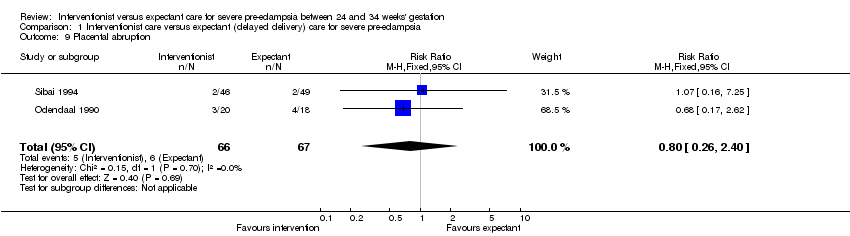
Comparison 1 Interventionist care versus expectant (delayed delivery) care for severe pre‐eclampsia, Outcome 9 Placental abruption.

Comparison 1 Interventionist care versus expectant (delayed delivery) care for severe pre‐eclampsia, Outcome 10 Low Apgar score at five minutes (< 7 at five minutes).

Comparison 1 Interventionist care versus expectant (delayed delivery) care for severe pre‐eclampsia, Outcome 11 Neonatal seizures.

Comparison 1 Interventionist care versus expectant (delayed delivery) care for severe pre‐eclampsia, Outcome 12 Hyaline membrane disease.

Comparison 1 Interventionist care versus expectant (delayed delivery) care for severe pre‐eclampsia, Outcome 13 Necrotising enterocolitis.
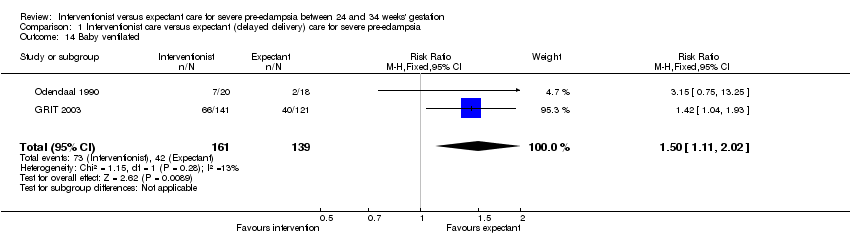
Comparison 1 Interventionist care versus expectant (delayed delivery) care for severe pre‐eclampsia, Outcome 14 Baby ventilated.

Comparison 1 Interventionist care versus expectant (delayed delivery) care for severe pre‐eclampsia, Outcome 15 Measures of long‐term growth & development (cerebral palsy).

Comparison 1 Interventionist care versus expectant (delayed delivery) care for severe pre‐eclampsia, Outcome 16 Measures of long‐term growth & development (poor hearing/hearing aid).
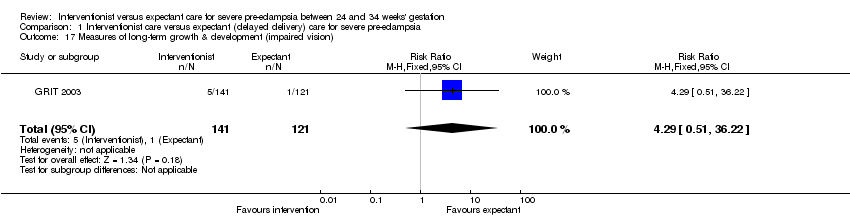
Comparison 1 Interventionist care versus expectant (delayed delivery) care for severe pre‐eclampsia, Outcome 17 Measures of long‐term growth & development (impaired vision).

Comparison 1 Interventionist care versus expectant (delayed delivery) care for severe pre‐eclampsia, Outcome 18 Small‐for‐gestational age.

Comparison 1 Interventionist care versus expectant (delayed delivery) care for severe pre‐eclampsia, Outcome 19 Gestation at birth (days).
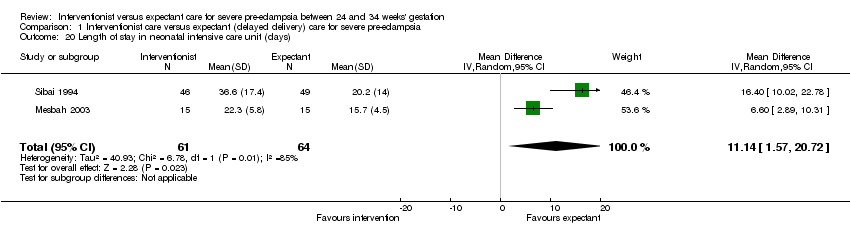
Comparison 1 Interventionist care versus expectant (delayed delivery) care for severe pre‐eclampsia, Outcome 20 Length of stay in neonatal intensive care unit (days).

Comparison 1 Interventionist care versus expectant (delayed delivery) care for severe pre‐eclampsia, Outcome 21 Admission to neonatal intensive care unit.
| Outcome or subgroup title | No. of studies | No. of participants | Statistical method | Effect size |
| 1 Eclampsia Show forest plot | 1 | 95 | Risk Ratio (M‐H, Fixed, 95% CI) | 0.0 [0.0, 0.0] |
| 2 HELLP syndrome Show forest plot | 1 | 95 | Risk Ratio (M‐H, Fixed, 95% CI) | 0.53 [0.05, 5.68] |
| 3 Pulmonary oedema Show forest plot | 1 | 95 | Risk Ratio (M‐H, Fixed, 95% CI) | 0.0 [0.0, 0.0] |
| 4 Death of the baby (all stillbirths, neonatal and infant deaths) Show forest plot | 4 | 425 | Risk Ratio (M‐H, Fixed, 95% CI) | 1.08 [0.69, 1.71] |
| 5 Death of the baby (subgrouped by time of death) Show forest plot | 4 | Risk Ratio (M‐H, Fixed, 95% CI) | Subtotals only | |
| 5.1 Stillbirth | 4 | 425 | Risk Ratio (M‐H, Fixed, 95% CI) | 0.20 [0.03, 1.16] |
| 5.2 Perinatal death | 2 | 68 | Risk Ratio (M‐H, Fixed, 95% CI) | 1.14 [0.45, 2.89] |
| 5.3 Neonatal death | 4 | 425 | Risk Ratio (M‐H, Fixed, 95% CI) | 1.33 [0.80, 2.23] |
| 5.4 Death after 28 days | 1 | 38 | Risk Ratio (M‐H, Fixed, 95% CI) | 1.8 [0.18, 18.21] |
| 6 Intraventricular haemorrhage or hypoxic ischaemic encephalopathy Show forest plot | 1 | 262 | Risk Ratio (M‐H, Fixed, 95% CI) | 1.82 [1.06, 3.14] |
| 7 Renal failure Show forest plot | 2 | 133 | Risk Ratio (M‐H, Fixed, 95% CI) | 0.30 [0.01, 6.97] |
| 8 Caesarean section Show forest plot | 4 | 425 | Risk Ratio (M‐H, Fixed, 95% CI) | 1.09 [1.01, 1.18] |
| 9 Placental abruption Show forest plot | 2 | 133 | Risk Ratio (M‐H, Fixed, 95% CI) | 0.80 [0.26, 2.40] |
| 10 Low Apgar score at five minutes (< 7 at five minutes) Show forest plot | 1 | 262 | Risk Ratio (M‐H, Fixed, 95% CI) | 1.48 [0.87, 2.50] |
| 11 Neonatal seizures Show forest plot | 1 | 262 | Risk Ratio (M‐H, Fixed, 95% CI) | 2.57 [0.27, 24.43] |
| 12 Hyaline membrane disease Show forest plot | 2 | 133 | Risk Ratio (M‐H, Fixed, 95% CI) | 2.30 [1.39, 3.81] |
| 13 Necrotising enterocolitis Show forest plot | 3 | 395 | Risk Ratio (M‐H, Fixed, 95% CI) | 2.10 [0.93, 4.79] |
| 14 Baby ventilated Show forest plot | 2 | 300 | Risk Ratio (M‐H, Fixed, 95% CI) | 1.50 [1.11, 2.02] |
| 15 Measures of long‐term growth & development (cerebral palsy) Show forest plot | 1 | 262 | Risk Ratio (M‐H, Fixed, 95% CI) | 6.01 [0.75, 48.14] |
| 16 Measures of long‐term growth & development (poor hearing/hearing aid) Show forest plot | 1 | 262 | Risk Ratio (M‐H, Fixed, 95% CI) | 0.34 [0.07, 1.74] |
| 17 Measures of long‐term growth & development (impaired vision) Show forest plot | 1 | 262 | Risk Ratio (M‐H, Fixed, 95% CI) | 4.29 [0.51, 36.22] |
| 18 Small‐for‐gestational age Show forest plot | 2 | 125 | Risk Ratio (M‐H, Fixed, 95% CI) | 0.30 [0.14, 0.65] |
| 19 Gestation at birth (days) Show forest plot | 4 | 425 | Mean Difference (IV, Random, 95% CI) | ‐9.91 [‐16.37, ‐3.45] |
| 20 Length of stay in neonatal intensive care unit (days) Show forest plot | 2 | 125 | Mean Difference (IV, Random, 95% CI) | 11.14 [1.57, 20.72] |
| 21 Admission to neonatal intensive care unit Show forest plot | 2 | 125 | Risk Ratio (M‐H, Fixed, 95% CI) | 1.35 [1.16, 1.58] |