Tracción para el dolor lumbar con o sin ciática
Appendices
Appendix 1. Search strategy
MEDLINE (Ovid) (1966 to August 2013)
-
randomized controlled trial.pt.
-
controlled clinical trial.pt.
-
randomized.ab.
-
placebo.ab,ti.
-
drug therapy.fs.
-
randomly.ab,ti.
-
trial.ab,ti.
-
groups.ab,ti.
-
or/1‐8
-
(animals not (humans and animals)).sh.
-
9 not 10
-
dorsalgia.ti,ab.
-
exp Back Pain/
-
backache.ti,ab.
-
exp Low Back Pain/
-
(lumbar adj pain).ti,ab.
-
coccyx.ti,ab.
-
coccydynia.ti,ab.
-
sciatica.ti,ab.
-
sciatic neuropathy/
-
spondylosis.ti,ab.
-
lumbago.ti,ab.
-
or/12‐22
-
exp Spine/
-
discitis.ti,ab.
-
exp Spinal Diseases/
-
(disc adj degeneration).ti,ab.
-
(disc adj prolapse).ti,ab.
-
(disc adj herniation).ti,ab.
-
spinal fusion.sh.
-
spinal neoplasms.sh.
-
(facet adj joints).ti,ab.
-
intervertebral disk.sh.
-
intervertebral disc.sh.
-
Intervertebral Disc Displacement.sh.
-
postlaminectomy.ti,ab.
-
arachnoiditis.ti,ab.
-
(failed adj back).ti,ab.
-
or/24‐38
-
23 or 39
-
11 and 40
-
exp Traction/
-
exp "Physical Therapy (Specialty)"/
-
42 or 43
-
exp Fractures, Bone/
-
44 not 45
-
11 and 41 and 46
EMBASE Ovid (1980 to August 2013)
-
Clinical Article/
-
exp Clinical Study/
-
Clinical Trial/
-
Controlled Study/
-
Randomized Controlled Trial/
-
Major Clinical Study/
-
Double Blind Procedure/
-
Multicenter Study/
-
Single Blind Procedure/
-
Phase 3 Clinical Trial/
-
Phase 4 Clinical Trial/
-
crossover procedure/
-
placebo/
-
or/1‐13
-
allocat$.mp.
-
assign$.mp.
-
blind$.mp.
-
(clinic$ adj25 (study or trial)).mp.
-
compar$.mp.
-
control$.mp.
-
cross?over.mp.
-
factorial$.mp.
-
follow?up.mp.
-
placebo$.mp.
-
prospectiv$.mp.
-
random$.mp.
-
((singl$ or doubl$ or trebl$ or tripl$) adj25 (blind$ or mask$)).mp.
-
trial.mp.
-
(versus or vs).mp.
-
or/15‐29
-
14 and 30
-
human/
-
Nonhuman/
-
exp ANIMAL/
-
Animal Experiment/
-
33 or 34 or 35
-
32 not 36
-
31 not 36
-
37 and 38
-
38 or 39
-
dorsalgia.mp.
-
back pain.mp.
-
exp LOW BACK PAIN/
-
exp BACKACHE/
-
(lumbar adj pain).mp.
-
coccyx.mp.
-
coccydynia.mp.
-
sciatica.mp.
-
exp ISCHIALGIA/
-
spondylosis.mp.
-
lumbago.mp.
-
or/41‐50
-
exp SPINE/
-
discitis.mp.
-
exp Spine Disease/
-
(disc adj degeneration).mp.
-
(disc adj prolapse).mp.
-
(disc adj herniation).mp.
-
spinal fusion.mp.
-
spinal neoplasms.mp.
-
(facet adj joints).mp.
-
intervertebral disk.mp.
-
postlaminectomy.mp.
-
arachnoiditis.mp.
-
(failed adj back).mp.
-
or/53‐65
-
52 or 66
-
40 and 67
-
exp traction therapy/
-
exp fracture/
-
69 not 70
-
68 and 71
CENTRAL (The Cochrane Library, 2012 Issue 8)
-
MeSH descriptor Back Pain explode all trees
-
dorsalgia
-
backache
-
MeSH descriptor Low Back Pain explode all trees
-
(lumbar next pain) or (coccyx) or (coccydynia) or (sciatica) or (spondylosis)
-
MeSH descriptor Sciatica explode all trees
-
MeSH descriptor Spine explode all trees
-
MeSH descriptor Spinal Diseases explode all trees
-
(lumbago) or (discitis) or (disc near degeneration) or (disc near prolapse) or (disc near herniation)
-
spinal fusion
-
facet near joints
-
MeSH descriptor Intervertebral Disk explode all trees
-
postlaminectomy
-
arachnoiditis
-
failed near back
-
MeSH descriptor Cauda Equina explode all trees
-
lumbar near vertebra*
-
spinal near stenosis
-
slipped near (disc* or disk*)
-
degenerat* near (disc* or disk*)
-
stenosis near (spine or root or spinal)
-
displace* near (disc* or disk*)
-
prolap* near (disc* or disk*)
-
(#1 OR #2 OR #3 OR #4 OR #5 OR #6 OR #7 OR #8 OR #9 OR #10 OR #11 OR #12 OR #13 OR #14 OR #15 OR #16 OR #17 OR #18 OR #19 OR #20 OR #21 OR #22 OR #23)
-
MeSH descriptor Traction explode all trees
-
MeSH descriptor Physical Therapy (Specialty) explode all trees
-
(#25 OR #26)
-
MeSH descriptor Fractures, Bone explode all trees
-
(#27 AND NOT #28)
-
(#24 AND #29)
CINAHL (Ebsco) (January 2006 to August 2013)
S53 S49 and S52
S52 S50 NOT S51
S51 (MH "Fractures+")
S50 (MH "Traction") OR "traction"
S49 S47 or S48
S48 S35 or S43 or S47
S47 S44 or S45 or S46
S46 "lumbago"
S45 (MH "Spondylolisthesis") OR (MH "Spondylolysis")
S44 (MH "Thoracic Vertebrae")
S43 S36 or S37 or S38 or S39 or S40 or S41 or S42
S42 lumbar N2 vertebra
S41 (MH "Lumbar Vertebrae")
S40 "coccydynia"
S39 "coccyx"
S38 "sciatica"
S37 (MH "Sciatica")
S36 (MH "Coccyx")
S35 S29 or S30 or S31 or S32 or S33 or S34
S34 lumbar N5 pain
S33 lumbar W1 pain
S32 "backache"
S31 (MH "Low Back Pain")
S30 (MH "Back Pain+")
S29 "dorsalgia"
S28 S26 NOT S27
S27 (MH "Animals")
S26 S7 or S12 or S19 or S25
S25 S20 or S21 or S22 or S23 or S24
S24 volunteer*
S23 prospectiv*
S22 control*
S21 followup stud*
S20 follow‐up stud*
S19 S13 or S14 or S15 or S16 or S17 or S18
S18 (MH "Prospective Studies+")
S17 (MH "Evaluation Research+")
S16 (MH "Comparative Studies")
S15 latin square
S14 (MH "Study Design+")
S13 (MH "Random Sample")
S12 S8 or S9 or S10 or S11
S11 random*
S10 placebo*
S9 (MH "Placebos")
S8 (MH "Placebo Effect")
S7 S1 or S2 or S3 or S4 or S5 or S6
S6 triple‐blind
S5 single‐blind
S4 double‐blind
S3 clinical W3 trial
S2 "randomi?ed controlled trial*"
S1 (MH "Clinical Trials+")
Appendix 2. Criteria for assessing risk of bias for internal validity
Random sequence generation (selection bias)
Selection bias (biased allocation to interventions) due to inadequate generation of a randomized sequence
There is a low risk of selection bias if the investigators describe a random component in the sequence generation process such as: referring to a random number table, using a computer random number generator, coin tossing, shuffling cards or envelopes, throwing dice, drawing of lots, minimization (minimization may be implemented without a random element, and this is considered to be equivalent to being random).
There is a high risk of selection bias if the investigators describe a non‐random component in the sequence generation process, such as: sequence generated by odd or even date of birth, date (or day) of admission, hospital or clinic record number; or allocation by judgement of the clinician, preference of the participant, results of a laboratory test or a series of tests, or availability of the intervention.
Allocation concealment (selection bias)
Selection bias (biased allocation to interventions) due to inadequate concealment of allocations prior to assignment
There is a low risk of selection bias if the participants and investigators enrolling participants could not foresee assignment because one of the following, or an equivalent method, was used to conceal allocation: central allocation (including telephone, web‐based and pharmacy‐controlled randomization); sequentially numbered drug containers of identical appearance; or sequentially numbered, opaque, sealed envelopes.
There is a high risk of bias if participants or investigators enrolling participants could possibly foresee assignments and thus introduce selection bias, such as allocation based on: using an open random allocation schedule (e.g. a list of random numbers); assignment envelopes were used without appropriate safeguards (e.g. if envelopes were unsealed or non‐opaque or not sequentially numbered); alternation or rotation; date of birth; case record number; or other explicitly unconcealed procedures.
Blinding of participants
Performance bias due to knowledge of the allocated interventions by participants during the study
There is a low risk of performance bias if blinding of participants was ensured and it was unlikely that the blinding could have been broken; or if there was no blinding or incomplete blinding, but the review authors judge that the outcome is not likely to be influenced by lack of blinding.
Blinding of personnel/care providers (performance bias)
Performance bias due to knowledge of the allocated interventions by personnel/care providers during the study
There is a low risk of performance bias if blinding of personnel was ensured and it was unlikely that the blinding could have been broken; or if there was no blinding or incomplete blinding, but the review authors judge that the outcome is not likely to be influenced by lack of blinding.
Blinding of outcome assessor (detection bias)
Detection bias due to knowledge of the allocated interventions by outcome assessors
There is low risk of detection bias if the blinding of the outcome assessment was ensured and it was unlikely that the blinding could have been broken; or if there was no blinding or incomplete blinding, but the review authors judge that the outcome is not likely to be influenced by lack of blinding, or:
-
for participant‐reported outcomes in which the participant was the outcome assessor (e.g. pain, disability): there is a low risk of bias for outcome assessors if there is a low risk of bias for participant blinding (Boutron 2005);
-
for outcome criteria that are clinical or therapeutic events that will be determined by the interaction between participants and care providers (e.g. co‐interventions, length of hospitalization, treatment failure), in which the care provider is the outcome assessor: there is a low risk of bias for outcome assessors if there is a low risk of bias for care providers (Boutron 2005);
-
for outcome criteria that are assessed from data from medical forms: there is a low risk of bias if the treatment or adverse effects of the treatment could not be noticed in the extracted data (Boutron 2005).
Incomplete outcome data (attrition bias)
Attrition bias due to amount, nature or handling of incomplete outcome data
There is a low risk of attrition bias if there were no missing outcome data; reasons for missing outcome data were unlikely to be related to the true outcome (for survival data, censoring unlikely to be introducing bias); missing outcome data were balanced in numbers, with similar reasons for missing data across groups; for dichotomous outcome data, the proportion of missing outcomes compared with the observed event risk was not enough to have a clinically relevant impact on the intervention effect estimate; for continuous outcome data, the plausible effect size (difference in means or standardized difference in means) among missing outcomes was not enough to have a clinically relevant impact on observed effect size, or missing data were imputed using appropriate methods (if dropouts are very large, imputation using even 'acceptable' methods may still suggest a high risk of bias) (Van Tulder 2003). The percentage of withdrawals and dropouts should not exceed 20% for short‐term follow‐up and 30% for long‐term follow‐up and should not lead to substantial bias (these percentages are commonly used but arbitrary, not supported by literature) (Van Tulder 2003).
Selective Reporting (reporting bias)
Reporting bias due to selective outcome reporting
There is low risk of reporting bias if the study protocol is available and all of the study's prespecified (primary and secondary) outcomes that are of interest in the review have been reported in the prespecified way, or if the study protocol is not available but it is clear that the published reports include all expected outcomes, including those that were prespecified (convincing text of this nature may be uncommon).
There is a high risk of reporting bias if not all of the study's prespecified primary outcomes have been reported; one or more primary outcomes is reported using measurements, analysis methods or subsets of the data (e.g. subscales) that were not prespecified; one or more reported primary outcomes were not prespecified (unless clear justification for their reporting is provided, such as an unexpected adverse effect); one or more outcomes of interest in the review are reported incompletely so that they cannot be entered in a meta‐analysis; the study report fails to include results for a key outcome that would be expected to have been reported for such a study.
Group similarity at baseline (selection bias)
Bias due to dissimilarity at baseline for the most important prognostic indicators.
There is low risk of bias if groups are similar at baseline for demographic factors, value of main outcome measure(s), and important prognostic factors (examples in the field of back and neck pain are duration and severity of complaints, vocational status, percentage of participants with neurological symptoms) (Van Tulder 2003).
Co‐interventions (performance bias)
Bias because co‐interventions were different across groups
There is low risk of bias if there were no co‐interventions or they were similar between the index and control groups (Van Tulder 2003).
Compliance (performance bias)
Bias due to inappropriate compliance with interventions across groups
There is low risk of bias if compliance with the interventions was acceptable, based on the reported intensity/dosage, duration, number and frequency for both the index and control intervention(s). For single‐session interventions (e.g. surgery), this item is irrelevant (Van Tulder 2003).
Intention‐to‐treat‐analysis
There is low risk of bias if all randomized participants were reported/analysed in the group to which they were allocated by randomization.
Timing of outcome assessments (detection bias)
Bias because important outcomes were not measured at the same time across groups
There is low risk of bias if all important outcome assessments for all intervention groups were measured at the same time (Van Tulder 2003).
Other bias
Bias due to problems not covered elsewhere in the table
There is a low risk of bias if the study appears to be free of other sources of bias not addressed elsewhere (e.g. study funding).

Risk of bias summary: review authors' judgements about each risk of bias item for each included study.
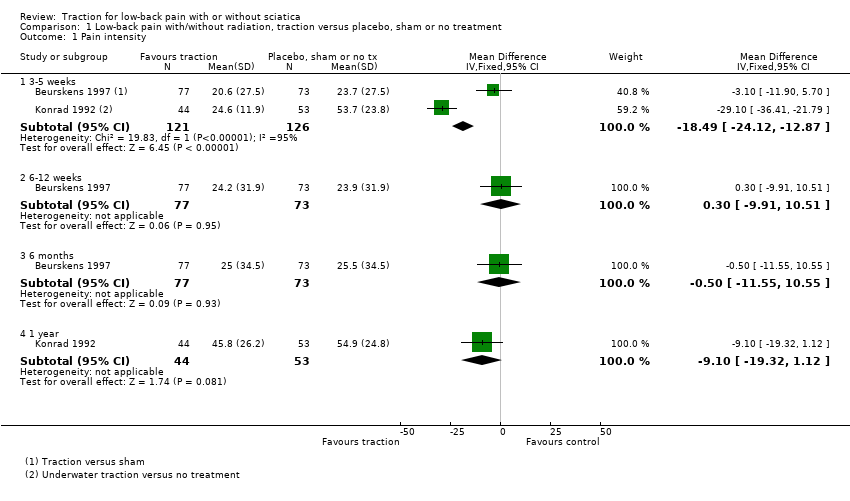
Comparison 1 Low‐back pain with/without radiation, traction versus placebo, sham or no treatment, Outcome 1 Pain intensity.

Comparison 1 Low‐back pain with/without radiation, traction versus placebo, sham or no treatment, Outcome 2 Functional status.

Comparison 1 Low‐back pain with/without radiation, traction versus placebo, sham or no treatment, Outcome 3 Global improvement.

Comparison 1 Low‐back pain with/without radiation, traction versus placebo, sham or no treatment, Outcome 4 Return to work (days).
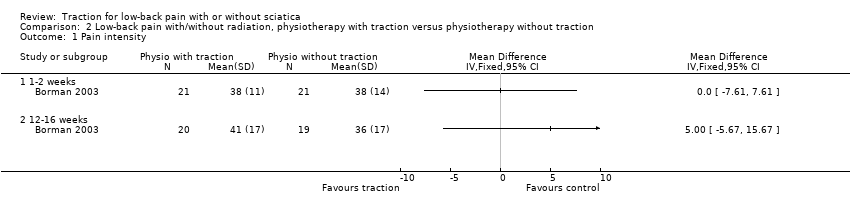
Comparison 2 Low‐back pain with/without radiation, physiotherapy with traction versus physiotherapy without traction, Outcome 1 Pain intensity.

Comparison 2 Low‐back pain with/without radiation, physiotherapy with traction versus physiotherapy without traction, Outcome 2 Functional status.

Comparison 2 Low‐back pain with/without radiation, physiotherapy with traction versus physiotherapy without traction, Outcome 3 Global improvement.
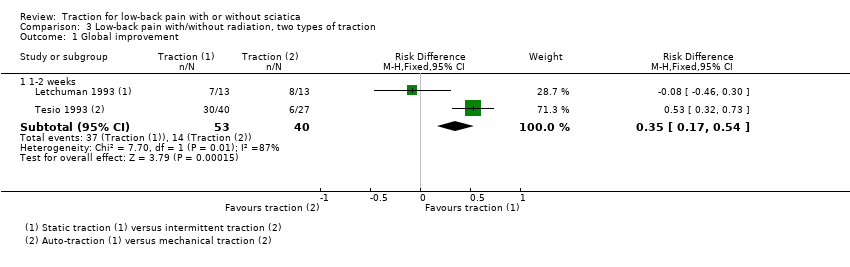
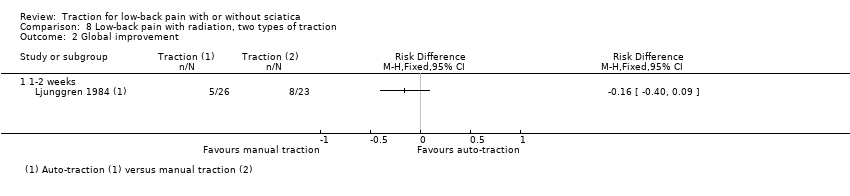
Comparison 3 Low‐back pain with/without radiation, two types of traction, Outcome 1 Global improvement.

Comparison 4 Low‐back pain with/without radiation, traction versus other treatment, Outcome 1 Pain intensity.
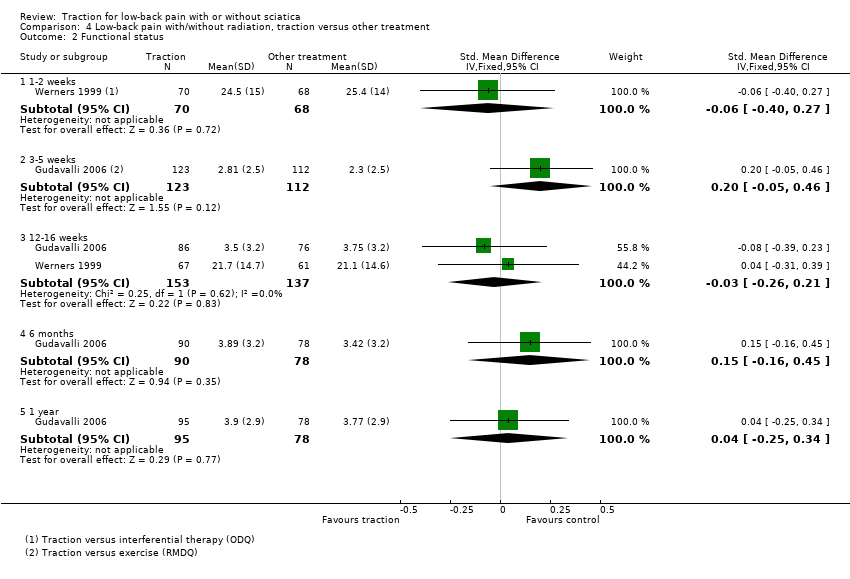
Comparison 4 Low‐back pain with/without radiation, traction versus other treatment, Outcome 2 Functional status.

Comparison 4 Low‐back pain with/without radiation, traction versus other treatment, Outcome 3 Global improvement.

Comparison 5 Low‐back pain with radiation, traction versus placebo, sham or no treatment, Outcome 1 Pain intensity.

Comparison 5 Low‐back pain with radiation, traction versus placebo, sham or no treatment, Outcome 2 Global improvement.

Comparison 5 Low‐back pain with radiation, traction versus placebo, sham or no treatment, Outcome 3 Return to work.

Comparison 6 Low‐back with radiation, physiotherapy with traction versus physiotherapy without traction, Outcome 1 Pain intensity.

Comparison 6 Low‐back with radiation, physiotherapy with traction versus physiotherapy without traction, Outcome 2 Functional status.

Comparison 6 Low‐back with radiation, physiotherapy with traction versus physiotherapy without traction, Outcome 3 Global improvement.
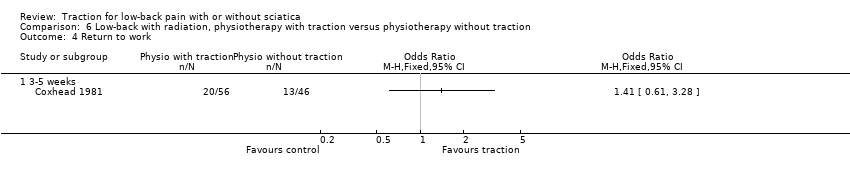
Comparison 6 Low‐back with radiation, physiotherapy with traction versus physiotherapy without traction, Outcome 4 Return to work.

Comparison 7 Low‐back pain with radiation, traction versus other treatment, Outcome 1 Pain intensity.
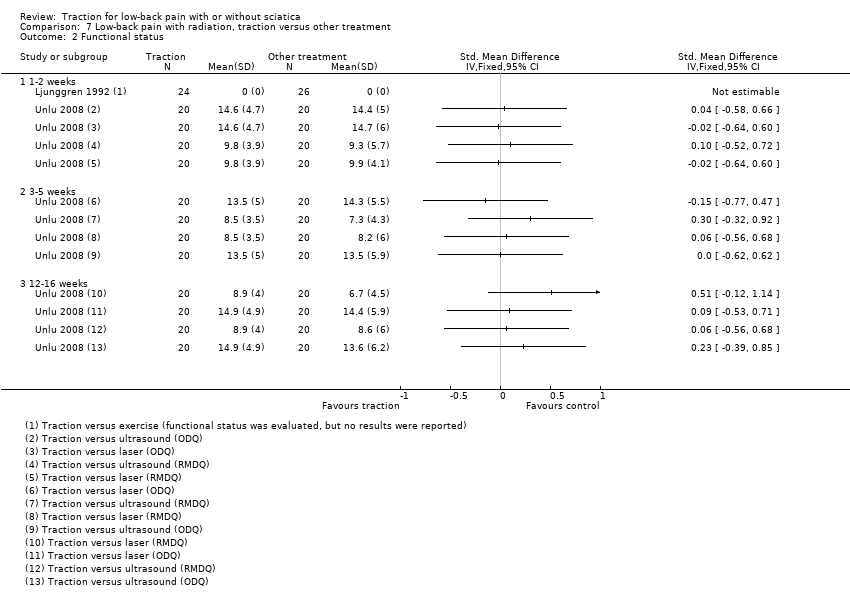
Comparison 7 Low‐back pain with radiation, traction versus other treatment, Outcome 2 Functional status.
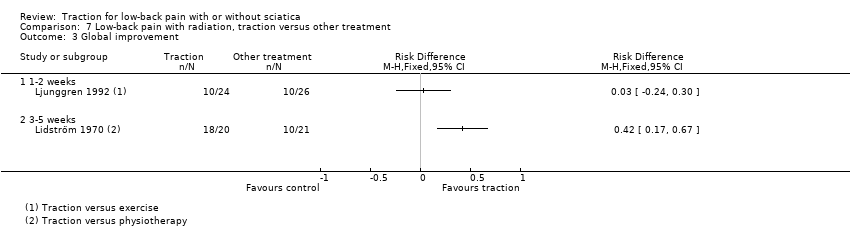
Comparison 7 Low‐back pain with radiation, traction versus other treatment, Outcome 3 Global improvement.
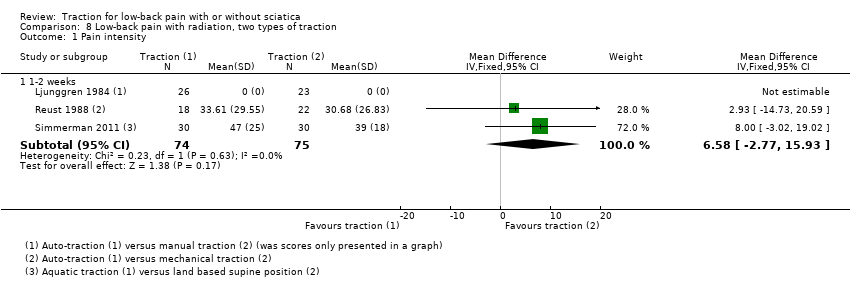
Comparison 8 Low‐back pain with radiation, two types of traction, Outcome 1 Pain intensity.
Comparison 8 Low‐back pain with radiation, two types of traction, Outcome 2 Global improvement.
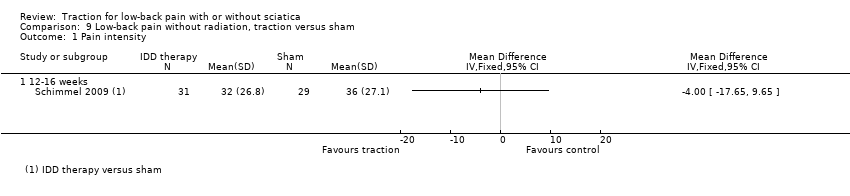
Comparison 9 Low‐back pain without radiation, traction versus sham, Outcome 1 Pain intensity.
| Traction compared with placebo, sham or no treatment for people with low‐back pain with and without sciatica | |||
| Patient or population: people with low‐back pain with and without sciatica Settings: diverse Intervention: traction Comparison: placebo, sham or no treatment | |||
| Outcomes | Effects | No of Participants | Quality of the evidence |
| Pain intensity VAS (0‐100 mm). Follow‐up 12‐16 weeks. | 1 trial showed that there was no difference in pain intensity between the 2 groups (MD ‐4, 95% CI ‐17.7 to 9.7). | 60 (1) | ⊕⊕⊕⊝
Imprecision (< 400 participants) |
| Functional status Oswestry Disability Index or Roland Morris Disability Questionnaire. Follow‐up 12‐16 weeks. | Not measured. |
|
|
| Global improvement Follow‐up 12‐16 weeks. | 1 trial showed that there was no difference in global improvement between the 2 groups (RD 0.06, 95% CI ‐0.16 to 0.28). | 81 (1) | ⊕⊕⊕⊝
Imprecision (< 300 participants) |
| Return to work Follow‐up 12‐16 weeks. | Not measured. | ||
| Adverse effects | 1 trial reported aggravation of neurological signs in 28% of the traction group, 20% of the light traction group and 20% of the placebo group. | ||
| CI: confidence interval; MD: mean difference; RD: risk difference; VAS: visual analogue scale. | |||
| GRADE Working Group grades of evidence | |||
| Note. Each 'Summary of findings' table presents evidence for a specific comparison and a set of prespecified outcomes. Therefore, the information presented in the tables is limited by the comparisons and outcomes reported in the included studies. | |||
| Physiotherapy with traction compared with physiotherapy without traction for people with low‐back pain with and without sciatica | |||
| Patient or population: people with low‐back pain with and without sciatica Settings: physical medicine and rehabilitation outpatient clinic of a larger hospital Intervention: physiotherapy with traction Comparison: physiotherapy without traction | |||
| Outcomes | Effects | No of Participants | Quality of the evidence |
| Pain intensity VAS (0‐100 mm). Follow‐up 12‐16 weeks. | 1 trial showed that there was no difference in pain intensity between the 2 groups (MD 5, 95% CI ‐5.7 to 15.7) in favour of the control group. | 39 (1) | ⊕⊕⊝⊝
Study design (high risk of bias) Imprecision (< 400 participants) |
| Functional status Oswestry Disability Index or Roland Morris Disability Questionnaire. Follow‐up 12‐16 weeks. | 2 trials showed that there was no difference in functional status between the 2 groups (SMD from 0.36 (95% CI ‐0.27 to 1.00) to 0.43 (95% CI ‐0.30 to 1.16)). | 69 (2) | ⊕⊕⊝⊝
Study design (high risk of bias) Imprecision (< 400 participants) |
| Global improvement Follow‐up 12‐16 weeks. | 1 trial showed no difference in global improvement, another trial did show a clinically significant difference in global improvement (RD 0.53, 95% CI 0.28 to 0.79). | 220 (2) | ⊕⊕⊝⊝
Study design (high risk of bias) Imprecision (< 300 participants) |
| Return to work Follow‐up 12‐16 weeks. | Not measured. |
|
|
| Adverse effects | 1 study reported that 25% of the physiotherapy with traction group and 37% of the physiotherapy without traction group felt worse at 3 months' follow‐up. |
|
|
| CI: confidence interval; MD: mean difference; RD: risk difference. | |||
| GRADE Working Group grades of evidence | |||
| Traction compared with another type of traction for people with low‐back pain with and without sciatica | |||
| Patient or population: people with low‐back pain with and without sciatica Settings: diverse Intervention: traction Comparison: another type of traction | |||
| Outcomes | Effects | No of Participants | Quality of the evidence |
| Pain intensity VAS (0‐100 mm). Follow‐up 12‐16 weeks. | Not measured. | ||
| Functional status Oswestry Disability Index or Roland Morris Disability Questionnaire. Follow‐up 12‐16 weeks. | Not measured. |
|
|
| Global improvement Follow‐up 12‐16 weeks. | Not measured. |
|
|
| Return to work Follow‐up 12‐16 weeks. | Not measured. |
|
|
| Adverse effects | 1 trial reported increased pain in 31% of the static traction group and 15% of the intermittent traction group. |
|
|
| VAS: visual analogue scale. | |||
| GRADE Working Group grades of evidence | |||
| Traction compared with any other treatment for people with low‐back pain with and without sciatica | |||
| Patient or population: people with low‐back pain with and without sciatica Settings: diverse Intervention: traction Comparison: other treatment | |||
| Outcomes | Effects | No of participants | Quality of the evidence |
| Pain intensity VAS (0‐100 mm). Follow‐up 12‐16 weeks. | 3 trials, of which 1 compared traction with 2 other types of treatment, showed no difference greater than 5 points on the VAS scale between the 2 groups (MD ‐2.90 (95% CI ‐8.53 to 2.93) to 4.50 (95% CI ‐0.45 to 9.45). | 304 (3) | ⊕⊕⊕⊝
Imprecision (< 400 participants) |
| Functional status Oswestry Disability Index or Roland Morris Disability Questionnaire. Follow‐up 12‐16 weeks. | 3 trials, of which 1 compared traction to 2 other types of treatment and used 2 types of questionnaires to assess functional status, showed no difference between the 2 groups (SMD ‐0.08 (95% CI ‐0.39 to 0.23) to 0.51 (95% CI ‐0.12 to 1.14)). | 350 (3) | ⊕⊕⊕⊝
Imprecision (< 400 participants) |
| Global improvement Follow‐up 12‐16 weeks. | 1 trial showed no difference in global improvement (RD 0.05, 95% CI ‐0.1 to 0.2). | 42 (1) | ⊕⊕⊝⊝
Study design (high risk of bias) Imprecision (< 300 participants) |
| Return to work Follow‐up 12‐16 weeks. | Not measured. | ||
| Adverse effects | 1 trial reported temporary deterioration of low‐back pain in 17% of the traction group and 15% of the exercise group. | ||
| MD: mean difference; RD: risk difference; SMD: standardized mean difference. | |||
| GRADE Working Group grades of evidence | |||
| Author | Participants | Interventions | Outcomes | Effect size | Benefits/harms |
| + | + | + | ‐ | ‐ | |
| + | + | + | ‐ | ‐ | |
| + | + | + | ‐ | ‐ | |
| + | ‐ | + | ‐ | ‐ | |
| + | + | + | ‐ | ‐ | |
| + | + | + | ‐ | ‐ | |
| + | + | + | ? | ‐ | |
| + | + | + | ‐ | ‐ | |
| + | ? | + | ‐ | ‐ | |
| + | + | + | ‐ | ‐ | |
| ‐ | + | + | ‐ | ‐ | |
| + | + | + | ? | ‐ | |
| + | + | + | + | + | |
| + | + | + | ‐ | ‐ | |
| + | + | + | ‐ | ‐ | |
| + | + | + | ‐ | ‐ | |
| + | + | + | ‐ | ‐ | |
| + | + | + | ‐ | ‐ | |
| + | + | + | ‐ | ‐ | |
| ‐ | + | + | ‐ | ‐ | |
| + | + | + | ‐ | ‐ | |
| + | + | + | + | ? | |
| + | + | + | ‐ | ‐ | |
| + | + | + | ‐ | ‐ | |
| + | + | + | ? | ‐ | |
| + | + | + | ‐ | ‐ | |
| + | + | + | ‐ | ‐ | |
| + | + | + | ‐ | ‐ | |
| ‐ | + | + | ‐ | ‐ | |
| Weber 1984 (1) | ‐ | + | + | ‐ | ‐ |
| Weber 1984 (2) | ‐ | + | + | ‐ | ‐ |
| + | + | + | ‐ | ‐ | |
| +: yes; ‐: no; ?: unknown. | |||||
| Outcome or subgroup title | No. of studies | No. of participants | Statistical method | Effect size |
| 1 Pain intensity Show forest plot | 2 | Mean Difference (IV, Fixed, 95% CI) | Subtotals only | |
| 1.1 3‐5 weeks | 2 | 247 | Mean Difference (IV, Fixed, 95% CI) | ‐18.49 [‐24.12, ‐12.87] |
| 1.2 6‐12 weeks | 1 | 150 | Mean Difference (IV, Fixed, 95% CI) | 0.30 [‐9.91, 10.51] |
| 1.3 6 months | 1 | 150 | Mean Difference (IV, Fixed, 95% CI) | ‐0.5 [‐11.55, 10.55] |
| 1.4 1 year | 1 | 97 | Mean Difference (IV, Fixed, 95% CI) | ‐9.10 [‐19.32, 1.12] |
| 2 Functional status Show forest plot | 1 | Mean Difference (IV, Fixed, 95% CI) | Totals not selected | |
| 2.1 3‐5 weeks | 1 | Mean Difference (IV, Fixed, 95% CI) | 0.0 [0.0, 0.0] | |
| 2.2 6‐12 weeks | 1 | Mean Difference (IV, Fixed, 95% CI) | 0.0 [0.0, 0.0] | |
| 2.3 6 months | 1 | Mean Difference (IV, Fixed, 95% CI) | 0.0 [0.0, 0.0] | |
| 3 Global improvement Show forest plot | 2 | Risk Difference (M‐H, Fixed, 95% CI) | Subtotals only | |
| 3.1 3‐5 weeks | 2 | 175 | Risk Difference (M‐H, Fixed, 95% CI) | ‐0.03 [‐0.17, 0.12] |
| 3.2 6‐12 weeks | 2 | 175 | Risk Difference (M‐H, Fixed, 95% CI) | 0.03 [‐0.12, 0.18] |
| 3.3 6 months | 1 | 150 | Risk Difference (M‐H, Fixed, 95% CI) | 0.02 [‐0.14, 0.18] |
| 4 Return to work (days) Show forest plot | 1 | Mean Difference (IV, Fixed, 95% CI) | Totals not selected | |
| 4.1 3‐5 weeks | 1 | Mean Difference (IV, Fixed, 95% CI) | 0.0 [0.0, 0.0] | |
| 4.2 6‐12 weeks | 1 | Mean Difference (IV, Fixed, 95% CI) | 0.0 [0.0, 0.0] | |
| 4.3 6 months | 1 | Mean Difference (IV, Fixed, 95% CI) | 0.0 [0.0, 0.0] | |
| Outcome or subgroup title | No. of studies | No. of participants | Statistical method | Effect size |
| 1 Pain intensity Show forest plot | 1 | Mean Difference (IV, Fixed, 95% CI) | Totals not selected | |
| 1.1 1‐2 weeks | 1 | Mean Difference (IV, Fixed, 95% CI) | 0.0 [0.0, 0.0] | |
| 1.2 12‐16 weeks | 1 | Mean Difference (IV, Fixed, 95% CI) | 0.0 [0.0, 0.0] | |
| 2 Functional status Show forest plot | 1 | Mean Difference (IV, Fixed, 95% CI) | Totals not selected | |
| 2.1 1‐2 weeks | 1 | Mean Difference (IV, Fixed, 95% CI) | 0.0 [0.0, 0.0] | |
| 2.2 12‐16 weeks | 1 | Mean Difference (IV, Fixed, 95% CI) | 0.0 [0.0, 0.0] | |
| 3 Global improvement Show forest plot | 1 | Risk Difference (M‐H, Fixed, 95% CI) | Totals not selected | |
| 3.1 1‐2 weeks | 1 | Risk Difference (M‐H, Fixed, 95% CI) | 0.0 [0.0, 0.0] | |
| 3.2 12‐16 weeks | 1 | Risk Difference (M‐H, Fixed, 95% CI) | 0.0 [0.0, 0.0] | |
| Outcome or subgroup title | No. of studies | No. of participants | Statistical method | Effect size |
| 1 Global improvement Show forest plot | 2 | Risk Difference (M‐H, Fixed, 95% CI) | Subtotals only | |
| 1.1 1‐2 weeks | 2 | 93 | Risk Difference (M‐H, Fixed, 95% CI) | 0.35 [0.17, 0.54] |
| Outcome or subgroup title | No. of studies | No. of participants | Statistical method | Effect size |
| 1 Pain intensity Show forest plot | 4 | Mean Difference (IV, Fixed, 95% CI) | Totals not selected | |
| 1.1 1‐2 weeks | 2 | Mean Difference (IV, Fixed, 95% CI) | 0.0 [0.0, 0.0] | |
| 1.2 3‐5 weeks | 2 | Mean Difference (IV, Fixed, 95% CI) | 0.0 [0.0, 0.0] | |
| 1.3 12‐16 weeks | 2 | Mean Difference (IV, Fixed, 95% CI) | 0.0 [0.0, 0.0] | |
| 1.4 6 months | 1 | Mean Difference (IV, Fixed, 95% CI) | 0.0 [0.0, 0.0] | |
| 1.5 1 year | 2 | Mean Difference (IV, Fixed, 95% CI) | 0.0 [0.0, 0.0] | |
| 2 Functional status Show forest plot | 2 | Std. Mean Difference (IV, Fixed, 95% CI) | Subtotals only | |
| 2.1 1‐2 weeks | 1 | 138 | Std. Mean Difference (IV, Fixed, 95% CI) | ‐0.06 [‐0.40, 0.27] |
| 2.2 3‐5 weeks | 1 | 235 | Std. Mean Difference (IV, Fixed, 95% CI) | 0.20 [‐0.05, 0.46] |
| 2.3 12‐16 weeks | 2 | 290 | Std. Mean Difference (IV, Fixed, 95% CI) | ‐0.03 [‐0.26, 0.21] |
| 2.4 6 months | 1 | 168 | Std. Mean Difference (IV, Fixed, 95% CI) | 0.15 [‐0.16, 0.45] |
| 2.5 1 year | 1 | 173 | Std. Mean Difference (IV, Fixed, 95% CI) | 0.04 [‐0.25, 0.34] |
| 3 Global improvement Show forest plot | 3 | Risk Difference (M‐H, Fixed, 95% CI) | Totals not selected | |
| 3.1 1‐2 weeks | 2 | Risk Difference (M‐H, Fixed, 95% CI) | 0.0 [0.0, 0.0] | |
| 3.2 3‐5 weeks | 2 | Risk Difference (M‐H, Fixed, 95% CI) | 0.0 [0.0, 0.0] | |
| 3.3 12‐16 weeks | 1 | Risk Difference (M‐H, Fixed, 95% CI) | 0.0 [0.0, 0.0] | |
| Outcome or subgroup title | No. of studies | No. of participants | Statistical method | Effect size |
| 1 Pain intensity Show forest plot | 2 | Mean Difference (IV, Fixed, 95% CI) | Subtotals only | |
| 1.1 1‐2 weeks | 2 | 79 | Mean Difference (IV, Fixed, 95% CI) | 2.93 [‐14.73, 20.59] |
| 1.2 3‐5 weeks | 1 | 39 | Mean Difference (IV, Fixed, 95% CI) | 0.0 [0.0, 0.0] |
| 2 Global improvement Show forest plot | 5 | Risk Difference (M‐H, Fixed, 95% CI) | Subtotals only | |
| 2.1 1‐2 weeks | 4 | 398 | Risk Difference (M‐H, Fixed, 95% CI) | 0.13 [0.04, 0.22] |
| 2.2 3‐5 weeks | 2 | 123 | Risk Difference (M‐H, Fixed, 95% CI) | 0.27 [0.12, 0.43] |
| 2.3 12‐16 weeks | 1 | 81 | Risk Difference (M‐H, Fixed, 95% CI) | 0.06 [‐0.16, 0.28] |
| 3 Return to work Show forest plot | 1 | Risk Difference (M‐H, Fixed, 95% CI) | Subtotals only | |
| 3.1 2 years | 1 | 39 | Risk Difference (M‐H, Fixed, 95% CI) | 0.15 [‐0.15, 0.45] |
| Outcome or subgroup title | No. of studies | No. of participants | Statistical method | Effect size |
| 1 Pain intensity Show forest plot | 2 | Mean Difference (IV, Fixed, 95% CI) | Subtotals only | |
| 1.1 1‐2 weeks | 2 | 110 | Mean Difference (IV, Fixed, 95% CI) | ‐7.96 [‐16.53, 0.61] |
| 1.2 6 weeks | 1 | 64 | Mean Difference (IV, Fixed, 95% CI) | 2.0 [‐10.02, 14.02] |
| 2 Functional status Show forest plot | 2 | Std. Mean Difference (IV, Fixed, 95% CI) | Subtotals only | |
| 2.1 1‐2 weeks | 2 | 94 | Std. Mean Difference (IV, Fixed, 95% CI) | ‐0.08 [‐0.49, 0.32] |
| 2.2 6‐12 weeks | 1 | 64 | Std. Mean Difference (IV, Fixed, 95% CI) | 0.14 [‐0.35, 0.63] |
| 2.3 12‐16 weeks | 1 | 30 | Std. Mean Difference (IV, Fixed, 95% CI) | 0.43 [‐0.30, 1.16] |
| 2.4 6 months | 1 | 30 | Std. Mean Difference (IV, Fixed, 95% CI) | 0.18 [‐0.54, 0.90] |
| 3 Global improvement Show forest plot | 3 | Risk Difference (M‐H, Fixed, 95% CI) | Totals not selected | |
| 3.1 1‐2 weeks | 1 | Risk Difference (M‐H, Fixed, 95% CI) | 0.0 [0.0, 0.0] | |
| 3.2 3‐5 weeks | 1 | Risk Difference (M‐H, Fixed, 95% CI) | 0.0 [0.0, 0.0] | |
| 3.3 6 weeks | 1 | Risk Difference (M‐H, Fixed, 95% CI) | 0.0 [0.0, 0.0] | |
| 3.4 12‐16 weeks | 1 | Risk Difference (M‐H, Fixed, 95% CI) | 0.0 [0.0, 0.0] | |
| 4 Return to work Show forest plot | 1 | Odds Ratio (M‐H, Fixed, 95% CI) | Totals not selected | |
| 4.1 3‐5 weeks | 1 | Odds Ratio (M‐H, Fixed, 95% CI) | 0.0 [0.0, 0.0] | |
| Outcome or subgroup title | No. of studies | No. of participants | Statistical method | Effect size |
| 1 Pain intensity Show forest plot | 2 | Mean Difference (IV, Fixed, 95% CI) | Totals not selected | |
| 1.1 1‐2 weeks | 2 | Mean Difference (IV, Fixed, 95% CI) | 0.0 [0.0, 0.0] | |
| 1.2 3‐5 weeks | 1 | Mean Difference (IV, Fixed, 95% CI) | 0.0 [0.0, 0.0] | |
| 1.3 12‐16 weeks | 1 | Mean Difference (IV, Fixed, 95% CI) | 0.0 [0.0, 0.0] | |
| 2 Functional status Show forest plot | 2 | Std. Mean Difference (IV, Fixed, 95% CI) | Totals not selected | |
| 2.1 1‐2 weeks | 2 | Std. Mean Difference (IV, Fixed, 95% CI) | 0.0 [0.0, 0.0] | |
| 2.2 3‐5 weeks | 1 | Std. Mean Difference (IV, Fixed, 95% CI) | 0.0 [0.0, 0.0] | |
| 2.3 12‐16 weeks | 1 | Std. Mean Difference (IV, Fixed, 95% CI) | 0.0 [0.0, 0.0] | |
| 3 Global improvement Show forest plot | 2 | Risk Difference (M‐H, Fixed, 95% CI) | Totals not selected | |
| 3.1 1‐2 weeks | 1 | Risk Difference (M‐H, Fixed, 95% CI) | 0.0 [0.0, 0.0] | |
| 3.2 3‐5 weeks | 1 | Risk Difference (M‐H, Fixed, 95% CI) | 0.0 [0.0, 0.0] | |
| Outcome or subgroup title | No. of studies | No. of participants | Statistical method | Effect size |
| 1 Pain intensity Show forest plot | 3 | Mean Difference (IV, Fixed, 95% CI) | Subtotals only | |
| 1.1 1‐2 weeks | 3 | 149 | Mean Difference (IV, Fixed, 95% CI) | 6.58 [‐2.77, 15.93] |
| 2 Global improvement Show forest plot | 1 | Risk Difference (M‐H, Fixed, 95% CI) | Totals not selected | |
| 2.1 1‐2 weeks | 1 | Risk Difference (M‐H, Fixed, 95% CI) | 0.0 [0.0, 0.0] | |
| Outcome or subgroup title | No. of studies | No. of participants | Statistical method | Effect size |
| 1 Pain intensity Show forest plot | 1 | Mean Difference (IV, Fixed, 95% CI) | Totals not selected | |
| 1.1 12‐16 weeks | 1 | Mean Difference (IV, Fixed, 95% CI) | 0.0 [0.0, 0.0] | |