Preventing occupational stress in healthcare workers
References
References to studies included in this review
References to studies excluded from this review
References to studies awaiting assessment
References to ongoing studies
Additional references
References to other published versions of this review
Characteristics of studies
Characteristics of included studies [ordered by study ID]
| Methods | RCT, Canada | |
| Participants | Physicians at 5 medical ICUs in academic medical hospitals in USA. Age 41 ± 6 years, Sex 76% men, Experience 8 ± ‐6 years. N = 39 | |
| Interventions | Experimental: Interrupted work schedule (IS) in which the weekends were taken over by someone else; | |
| Outcomes | Burnout (on a scale from 5 ‐ 25) based on 5 questions similar to the MBI EE‐scale from the National Study of the Changing Workforce, a survey of United States workers performed by the Families and Work Institute, and formerly by the U.S. Department of Labor; also Job distress (on a scale from 6 ‐ 30) was measured but we did not use that scale. | |
| Notes | ||
| Risk of bias | ||
| Bias | Authors' judgement | Support for judgement |
| Random sequence generation (selection bias) | Unclear risk | "Sites were randomized between CS‐IS‐CS and IS‐CS‐IS patterns" |
| Allocation concealment (selection bias) | Unclear risk | Not reported |
| Blinding (performance bias and detection bias) | High risk | Not possible |
| Incomplete outcome data (attrition bias) | High risk | 2 units dropped out after randomisation and the authors made no attempt to account for this |
| Selective reporting (reporting bias) | Low risk | There was no difference between Methods and Results. |
| Other bias | High risk | There were many more physicians in one of the intervention arms. |
| Methods | Cross‐over study, USA | |
| Participants | 112 randomly selected staff of a retirement community | |
| Interventions | 1) Experimental: Recreational music‐making: 6 consecutive weekly 1‐hour sessions of playing drums and percussion instruments with Clavinova accompaniment (typically to a familiar tune) and non‐verbal expression (by playing the drums) in direct response to questions that were intended to inspire deep thought, contemplation and mutual respect. | |
| Outcomes | MBI, POMS | |
| Notes | ||
| Risk of bias | ||
| Bias | Authors' judgement | Support for judgement |
| Random sequence generation (selection bias) | Unclear risk | "All subjects were randomly assigned to Group A or Group B (mean 10.6 subjects/group) based upon the crossover design." (p.3) |
| Allocation concealment (selection bias) | Unclear risk | Not reported |
| Blinding (performance bias and detection bias) | High risk | Not possible |
| Incomplete outcome data (attrition bias) | High risk | Reasons for not completing the study reported but not separately for the 2 groups. |
| Selective reporting (reporting bias) | High risk | All outcomes reported but no report about cross‐over interim analysis or use of proper t‐tests |
| Other bias | Unclear risk | We did not find any indications of other sources of bias. |
| Methods | Controlled clinical trial, Canada | |
| Participants | "The study population was composed of all care‐providing personnel in the experimental (n = 674) and control hospitals (n = 894), both of which offer general and specialised short‐term care. The population included all healthcare professionals in direct contact with patients (nurses and beneficiary attendants)." (p. 480). Of these, 467 participants remained at follow‐up (247 in the intervention group and 220 in the control group). | |
| Interventions | "The intervention was defined as changes undertaken by the hospital to reduce adverse psychosocial factors in the workplace. Solutions proposed by the intervention team and adopted by the nursing department as well as any other objective change introduced with the explicit goal (or actual consequence) of improving one of the four targeted psychosocial factors were considered part of the intervention." (p. 480) | |
| Outcomes | Client burnout, work burnout, personal burnout and psychological distress. In addition, the authors measured several intermediary outcomes such as psychological demands and decision latitude. | |
| Notes | ||
| Risk of bias | ||
| Bias | Authors' judgement | Support for judgement |
| Random sequence generation (selection bias) | High risk | "This research used a before‐and‐after quasi‐experimental design with a control group." (p. 480) |
| Allocation concealment (selection bias) | High risk | There was no allocation concealment. |
| Blinding (performance bias and detection bias) | High risk | Not possible |
| Incomplete outcome data (attrition bias) | Unclear risk | Not reported |
| Selective reporting (reporting bias) | Low risk | All the measured outcomes were reported. |
| Other bias | Unclear risk | "It is difficult to identify which aspect of the intervention was responsible for the outcomes observed. In fact, even if the qualitative part of the study allowed to gather detailed information on what changes were made, still the design of the study was not experimental and as in most intervention research, changes in the workplace were beyond the researchers’ control." (pp. 483 ‐ 4) |
| Methods | RCT, USA | |
| Participants | Nurses with at least 6 months full‐time bedside nursing in a hospital setting. Those who regularly receive massage therapy on their own as well as anyone with medical reasons for not being able to have chair massage were excluded. | |
| Interventions | 1) Experimental: Massage: application to the back, neck, shoulders, arms and hands. Techniques used were effleurage, petrissage, friction, vibration and compression. One 30‐minute session per person over 4 days | |
| Outcomes | The Perceived Stress Scale | |
| Notes | ||
| Risk of bias | ||
| Bias | Authors' judgement | Support for judgement |
| Random sequence generation (selection bias) | Unclear risk | Not reported. |
| Allocation concealment (selection bias) | Low risk | "Sample size was 82 participants, randomly assigned to the massage group or the control group per a randomization schedule developed by a biostatistician who worked for the hospital but was not on the study team" (p. 337) |
| Blinding (performance bias and detection bias) | High risk | Not possible |
| Incomplete outcome data (attrition bias) | High risk | "A total of 60 follow‐up surveys were completed, a 73% return rate" (p.339) |
| Selective reporting (reporting bias) | Low risk | There was only one outcome measured and reported. |
| Other bias | Unclear risk | We did not find any indications of other sources of bias. |
| Methods | RCT, UK | |
| Participants | 53 mental health nurses from 2 hospitals | |
| Interventions | 1) Experimental: Social support intervention: 5 consecutive weekly sessions of a minimum of 2 hours of group exercises underlining the importance of social support as key coping strategy when dealing with stress. | |
| Outcomes | The DeVilliers Carson Leary Stress Scale, The General Health Questionnaire (GHQ‐28), The MBI | |
| Notes | ||
| Risk of bias | ||
| Bias | Authors' judgement | Support for judgement |
| Random sequence generation (selection bias) | Unclear risk | "After allocation using sealed envelopes with random permuted blocks..." (p.33) |
| Allocation concealment (selection bias) | Low risk | "After allocation using sealed envelopes with random permuted blocks..." (p.33) |
| Blinding (performance bias and detection bias) | High risk | Not possible, self report |
| Incomplete outcome data (attrition bias) | High risk | "Attrition rates were similar in both conditions, at around 30%." (p. 31). Intention‐to‐treat analysis was not used. |
| Selective reporting (reporting bias) | Unclear risk | "...the Minnesota Job Satisfaction scale (Weiss et al., 1967) and the Cooper Coping Skills scale (Cooper et al., 1988b) were administered at Time 1 and Time 2." (p. 34) The results of these 2 outcomes were not reported. |
| Other bias | Unclear risk | We did not find any indications of other sources of bias. |
| Methods | RCT, USA | |
| Participants | 25 nurses, pastoral care, respiratory therapy and social work personnel | |
| Interventions | 1) Experimental: Mindfulness‐based stress reduction programme: 8‐week program with approximately 2.5 hours teaching per week and homework practice with audiotapes for six days a week. Group sessions included teaching on topics such as communication skills, stress reactivity and self‐compassion and experiential exercises to help participants integrate these concepts. | |
| Outcomes | MBI, Brief Symptom Inventory | |
| Notes | ||
| Risk of bias | ||
| Bias | Authors' judgement | Support for judgement |
| Random sequence generation (selection bias) | Unclear risk | "Participants were then randomly assigned to the treatment group or the wait‐list control group." (p.27) |
| Allocation concealment (selection bias) | Unclear risk | Not reported. |
| Blinding (performance bias and detection bias) | High risk | Not possible, self report |
| Incomplete outcome data (attrition bias) | High risk | 2/14 in the treatment group did not return completed inventories and were not taken into consideration in the analyses. |
| Selective reporting (reporting bias) | Low risk | All outcomes reported. |
| Other bias | Unclear risk | We did not find any indications of other sources of bias. |
| Methods | RCT, Belgium | |
| Participants | 115 oncology nurses | |
| Interventions | 1) Experimental: Psychological Training Program: 3 weeks of training (each week including 5 consecutive days) and 1 week for the consecutive 3 months. Programme included 30‐hour theoretical information and 75 hours of role‐playing and experiential exchanges. The programme was designed to decrease nurses' professional stress levels, to improve nurses' attitudes and communication skills. | |
| Outcomes | Nursing Stress Scale | |
| Notes | ||
| Risk of bias | ||
| Bias | Authors' judgement | Support for judgement |
| Random sequence generation (selection bias) | Unclear risk | Every time 20 nurses were enrolled, the nurses were randomly allocated to a training group (TG) or to a control group (CG). |
| Allocation concealment (selection bias) | Unclear risk | Not reported. |
| Blinding (performance bias and detection bias) | High risk | Not possible, self report |
| Incomplete outcome data (attrition bias) | Low risk | Only 1 participant dropped out of the intervention group and none from the control group. |
| Selective reporting (reporting bias) | Low risk | All outcomes reported. |
| Other bias | Unclear risk | We did not find any indications of other sources of bias. |
| Methods | RCT, UK | |
| Participants | 20 forensic mental health nurses | |
| Interventions | 1) Experimental:Psychosocial Intervention Training: 20 days of training with the aim to improve nurses' knowledge about serious mental illness and attitude towards patients and thus decrease subjective burnout. Training duration 6 months. The training helps clinicians to conceptualise their patients' problems within a more empathic framework and trains them in the skills to intervene effectively. Thus self efficacy may increase and jobs may be perceived as more rewarding. | |
| Outcomes | MBI directly after training | |
| Notes | ||
| Risk of bias | ||
| Bias | Authors' judgement | Support for judgement |
| Random sequence generation (selection bias) | Unclear risk | "The 20 staff who volunteered for the PSI training were randomly allocated to either the experimental PSI training group (n=10) or a waiting list control group (n=10). The sample was stratified by ward, sex and day/night duty, thus subjects in each group represented all grades of staff and all wards." (p. 473) |
| Allocation concealment (selection bias) | Unclear risk | Not reported. |
| Blinding (performance bias and detection bias) | High risk | Not possible, self report |
| Incomplete outcome data (attrition bias) | Unclear risk | Presumably all participants completed all measurements as no data reported on dropouts. |
| Selective reporting (reporting bias) | Low risk | All outcomes reported. |
| Other bias | Unclear risk | We did not find any indications of other sources of bias. |
| Methods | RCT, Netherlands | |
| Participants | 99 nursing assistants | |
| Interventions | 1) Experimental: Integrated emotion‐oriented care: Basic training course of 2 days with an intermediary period of 2 weeks for homework (for all staff members on intervention wards) addressing staff members' own experience, phases of ego‐experience of the demented residents and the application of (non‐)verbal empathic skills Advanced course of 7 days spread out over 7 ‐ 8 months for 5 people from each intervention ward and an Adviser course of 10 days over 9 months for 1 person from each intervention ward. | |
| Outcomes | The Organization and Stress Scale | |
| Notes | ||
| Risk of bias | ||
| Bias | Authors' judgement | Support for judgement |
| Random sequence generation (selection bias) | Unclear risk | "A pretest‐posttest control group design with matched groups (randomized clinical trial) was used" (p. 331) |
| Allocation concealment (selection bias) | Unclear risk | Not reported. |
| Blinding (performance bias and detection bias) | High risk | Not possible, self report |
| Incomplete outcome data (attrition bias) | High risk | "During the experimental period 25 nursing assistants dropped out due to: illness (11), pregnancy (2), and transfer (9). In three cases questionnaires were missing. Data analysis was carried out on 99 'complete' cases. Drop‐out did not differ between the groups..." (p. 333) |
| Selective reporting (reporting bias) | High risk | For nursing assistants results consist of covariance analyses that were not prespecified. |
| Other bias | Unclear risk | We did not any indications of other sources of bias. |
| Methods | RCT, UK | |
| Participants | 138 NHS employees who had contact with patients. 30% were nurses, 37% were care assistants, 20% were psychologists, speech therapists, physiotherapists or social workers, and 3% were doctors. The rest (10%) were administrative staff. | |
| Interventions | 1) Experimental 1: Cognitive therapy techniques training: participants attended 3 weekly 3½‐hour workshops. Participants in both intervention groups received didactic teaching in the concepts of stress and burnout and the physical and mental signs of stress. The cognitive groups also received teaching and practice in the cognitive model, identification of negative automatic thoughts, thought challenging, beliefs and attitudes, positive self talk, distraction and relaxation using imagery. These were packaged together as all involve the employment of cognitive strategies to influence thinking, emotions and well‐being. N = 57 | |
| Outcomes | The Mental Health Professional Stress Scale, The General Health Questionnaire (GHQ‐12), Ways of Coping Scale, Support Questionnaire | |
| Notes | ||
| Risk of bias | ||
| Bias | Authors' judgement | Support for judgement |
| Random sequence generation (selection bias) | High risk | "Random assignment of staff to various groups was not always feasible due to organizational constraints, staff availability and some participants requesting early intervention. Some staff were assigned to groups (and hence condition) according to their work location." (p. 141) |
| Allocation concealment (selection bias) | Unclear risk | "Randomization was achieved by putting 16 proposed courses into a hat (8 cognitive and 8 coping) and drawing them out one by one. The order in which they came out determined the order in which they were delivered."... "In the event 14 courses ran and it was fortunate that courses 15 and 16 would have been one of each condition, coping and cognitive. Date and venue thus determined the condition, and participants did not know which course they were allocated to until they arrived." (p. 141) |
| Blinding (performance bias and detection bias) | High risk | Not possible, self report |
| Incomplete outcome data (attrition bias) | Low risk | "To assess for attrition bias, comparisons were made between those participants who dropped out of the study and those who were retained on factors thought to bias the results. Independent t tests and chi‐squared tests showed no significant differences between those who dropped out of the study and those who remained." (p. 145) |
| Selective reporting (reporting bias) | Unclear risk | "Table III. Means and standard deviations and significance levels using one‐way ANOVA for all variables where significant differences were found." (p. 146) |
| Other bias | Unclear risk | We did not find any indications of other sources of bias. |
| Methods | RCT, Iran | |
| Participants | 45 male and female nurses with B. Sc. of nursing, who exclusively worked in emergency or acute, chronic, or specialised male and female wards of psychiatry, and who scored less than 150 on the Holms and Rahe stress scale. 66.7% were married, 73.3% were on rotating shifts, and 55.4% were in the age range of 25 ‐ 30. | |
| Interventions | 1) Experimental: Communication skills training for 6 hours over 3 weeks 2) Control: No intervention | |
| Outcomes | A stress questionnaire designed by the researcher. The questionnaire was based on Tuft‐Anderson’s questionnaire, psychiatric nurses occupational stress scale (PNOSS), and an opinion poll of some nurses working in psychiatry wards about the sources of their stress. " To determine the validity of the questionnaire designed by the researcher, it was revised and approved by five faculty members of psychiatric nursing, one PhD of nursing, three psychiatric nurses, two psychiatrists, and six psychologists." (p. 397) "The questionnaire consisted of 34 questions, on a four point scale, ranging from 0 to 3, in which 0 implied no stress, 1 mild stress, 2 moderate stress, and 3 high stress. Thus, the highest and the lowest possible scores of the questionnaire were 102 and zero, respectively. The questionnaire covered six fields; nine items on coping with threatening cases, four items on shortage of resources, nine items on personnel conflicts, five items on planning issues, four items on working load, and three items on un‐preparedness for the occupational stress of psychiatric wards. Obtaining scores equal to or less than 30 was interpreted as low stress, while stress score of 40‐62, and 63 and above indicated moderate and high stress, respectively." (p. 397) | |
| Notes | ||
| Risk of bias | ||
| Bias | Authors' judgement | Support for judgement |
| Random sequence generation (selection bias) | Unclear risk | "the participants were randomly assigned to two groups; experiment and control. According to the random number table, of the 23 participants in the experiment group, four (17.4%) and 19 (82.6%) were from Noor and Farabi hospitals, respectively, while of the 22 participants in the control group, 10 (45.5%) and 12 (54.5%) were from Noor and Farabi hospitals, respectively." (p. 397) |
| Allocation concealment (selection bias) | Unclear risk | Not reported |
| Blinding (performance bias and detection bias) | High risk | Not possible, self report |
| Incomplete outcome data (attrition bias) | Unclear risk | The authors do not report about participants dropping out. |
| Selective reporting (reporting bias) | Unclear risk | The authors report the results of their stress questionnaire only as group means and t‐test P values. |
| Other bias | High risk | The only outcome measure the authors used was of their own devising and it was validated only by revision and approval by colleagues. |
| Methods | RCT, USA | |
| Participants | 50 employees of the Denver Veterans Affairs Medical Center | |
| Interventions | 1) Experimental: Qigong exercise: participants assigned to the exercise group attended a 1‐hour, noon qigong class twice weekly and were asked to practice independently for 30 minutes on non‐class days with the aid of a DVD demonstrating the instructor performing the exercises. Classes were taught by a senior apprentice in qigong with over 17 years’ experience in qigong. In addition, participants were provided a manual that outlined the acupuncture meridians and the rationale for the exercises. During class sessions, participants practised movements until they experienced a sensation of stretching or pressure in the targeted acupuncture points. The qigong movements were synchronised with specific breathing patterns, and participants were instructed to inhale and exhale fully at a comfortable rate, with a target respiratory rate of 6 breaths or fewer per minute. | |
| Outcomes | Perceived Stress Scale | |
| Notes | ||
| Risk of bias | ||
| Bias | Authors' judgement | Support for judgement |
| Random sequence generation (selection bias) | Low risk | "Fifty (50) subjects, 39 females and 11 males, were matched for gender and then randomized (25 in each treatment group) through the use of computer‐generated numbers (SYSTAT12.0 for Windows, Cranes Software, 2007, Bangalore, India)." (p. 940) |
| Allocation concealment (selection bias) | Unclear risk | Not reported |
| Blinding (performance bias and detection bias) | High risk | Not possible, self‐report |
| Incomplete outcome data (attrition bias) | High risk | "There were no significant differences in numbers of withdrawals between study groups" (p.940) This statement seems counterfactual as the intervention group lost 36% and the control group lost 16% of their participants before follow‐up. In the intervention group 5 (25%) stopped attending and in the control group one participant started mindfulness training. ITT analysis was not used. |
| Selective reporting (reporting bias) | High risk | Authors only report change values. |
| Other bias | Unclear risk | We did not find any indications of other sources of bias. |
| Methods | Cluster‐RCT, Netherlands | |
| Participants | Nurses on wards of an academic hospital were screened for work and health problems: Experimental: 29 wards, 591 participants of which 151 screened positive Control: 28 wards, 561 participants of which 161 screened positive. Experimental: 17% Control 22% men, > 45 years age Experimental 51% Control 46%, > 10 years of experience Experimental 51% Control 41% | |
| Interventions | 1) Experimental: All who screened positive were referred to Occupational Health Physician (OHP). Participants who were screened as positive were invited for a face‐to‐face preventive consultation with their occupational physician. The consultation was voluntary, and workers could reschedule or cancel it if they wished. Supervisors were not informed about the screening results or about the invitation for and content of the preventive consultation of any employee. The 7‐step protocol for OHPs closely followed occupational physicians’ care as usual for consultations initiated by the employee in contrast to the compulsory consultation in the context of absenteeism. Occupational physicians received 3 hours of training from the researchers on the use of the protocol. (CBT) 2) Control: Waiting list: In the control arm. Participants filled out the baseline questionnaire; however, results of the screening‐questionnaires were not to be reported back to participants, and no further interventions were advised at baseline. As compensation, participants in the control arm received their personal screening results together with a tailored choice for a self‐help EMH intervention six months after baseline. | |
| Outcomes | The study's primary outcome was help‐seeking behaviour; we used secondary outcomes: distress from the Dutch 4DKL, anxiety and depression from Brief Symptom Inventory | |
| Notes | We got the following data for the distress scale of the 4DKL at 6 months follow‐up for the group who screened positive from author K Nieuwenhuijsen: Experimental: N = 86 6.24 ± 6.52 Control: N = 116 6.82 ± 6.57 | |
| Risk of bias | ||
| Bias | Authors' judgement | Support for judgement |
| Random sequence generation (selection bias) | Low risk | " Randomization was performed at the ward level (n = 86). Randomization sequences with a block size of three were generated with Nquery Advisor (Statistical Solutions, Ltd, Cork, Ireland) by one researcher (K.N.) who was not involved in the recruitment" |
| Allocation concealment (selection bias) | Unclear risk | Not blinded |
| Blinding (performance bias and detection bias) | High risk | Providers not blinded, outcome self‐reported measures of stress |
| Incomplete outcome data (attrition bias) | High risk | At 3 months lost to follow‐up: Experimental 37% / Control 30%; at 6 months Experimental 46% / Contr 34% |
| Selective reporting (reporting bias) | Low risk | All outcomes reported that were announced in protocol |
| Other bias | High risk | Compliance very low: 34% of those invited visited their OHP |
| Methods | RCT, Turkey | |
| Participants | " All of the nurses (n = 227) were invited to complete the Maslach Burnout Inventory (MBI) developed by Maslach & Jackson (1981). Those who completed the questionnaire and received a score on emotional exhaustion higher than the median score for all nurses were invited to participate in the burnout reduction intervention." (p. 487) 108 nurses were randomised to one of three conditions. | |
| Interventions | 1) Coping training (N = 36) "The group that received coping training consisted of two groups, each group consisting of 18 people. In the first week, the concept of stress was explained to the nurses, and coping methods used by the nurses in stressful conditions were discussed. In the second session, basic communication skills on the stress level were discussed. In the third session, cognitive coping methods were presented theoretically. In the fourth session, cognitive distortions found among nurses and methods for coping with these distortions were discussed. In the fifth session, the problem‐solving method was theoretically explained to the nurses. In the sixth session, stressful situations that the nurses encounter were discussed and resolved by means of the problem solving method. In the seventh session, problems that the nurses had difficulty coping with were discussed by utilizing the skills learned during the course of the programme." (p. 488) 2) Support group (N = 36) "...the support group consisted of three groups, each group consisting of 12 people. The nurses talked about the most frequently encountered stressors in the workplace and expressed their feelings towards their jobs. At the beginning of each session, the nurses expressed their feelings related to difficult situations at the workplace. Then, a problem chosen by the nurses was attempted to be solved by using reflective cycle steps. Researchers provided information when needed. Possible solution methods were discussed in the groups, and the nurses were advised to use these methods in their daily lives. The nurses shared their difficult and favourable times and also exchanged recommendations with each other." (p. 488) 3) Control: No intervention (N = 36) | |
| Outcomes | MBI | |
| Notes | ||
| Risk of bias | ||
| Bias | Authors' judgement | Support for judgement |
| Random sequence generation (selection bias) | Low risk | "Random allocation was concealed by using a system of sequentially numbered, opaque, sealed envelopes containing the computer‐generated random allocation, which had been drawn up by a statistician. During the randomization, the researchers and the participants did not know the groups to which they would be allocated." (p. 487) |
| Allocation concealment (selection bias) | Low risk | See above |
| Blinding (performance bias and detection bias) | High risk | "No blinding was applied to the participants and the researchers." (p. 487) |
| Incomplete outcome data (attrition bias) | Low risk | "Intention‐to‐treat analysis was used because of sample loss." (p. 487) |
| Selective reporting (reporting bias) | Low risk | The authors only measured and adequately reported results of the MBI. |
| Other bias | Unclear risk | We did not find any indications of other sources of bias. |
| Methods | RCT, Norway | |
| Participants | 32 nurses working at 2 psychiatric hospitals | |
| Interventions | 1) Experimental: Full‐body massage: 6 consecutive weekly 90‐minute full‐body aromatherapy massages. | |
| Outcomes | Cooper's Job Stress Questionnaire | |
| Notes | ||
| Risk of bias | ||
| Bias | Authors' judgement | Support for judgement |
| Random sequence generation (selection bias) | Unclear risk | "Thirty‐five subjects registered for the study and were randomised by drawing numbers, to either a treatment group (n = 18) or a control group." (p. 91) |
| Allocation concealment (selection bias) | Unclear risk | Not reported. |
| Blinding (performance bias and detection bias) | High risk | Not reported, self‐report blinding not possible |
| Incomplete outcome data (attrition bias) | Unclear risk | "Three persons dropped out from the control group, two moved to other parts of Norway and one went on vacation" (p. 91) |
| Selective reporting (reporting bias) | Low risk | There was only one outcome measure and its results were reported |
| Other bias | Unclear risk | We did not find any indications of other sources of bias |
| Methods | RCT, USA | |
| Participants | 1375 direct care staff and home managers | |
| Interventions | 1) Experimental: Caregiver support programme (CSP): 6 4 ‐ 5‐hour group training sessions for the house manager and 1 direct care staff person from each intervention group home (train the trainer approach) of participatory problem‐solving skills, influencing decision making and how to mobilise support from others at work. | |
| Outcomes | Social support, Organisational climate, SCL‐90‐R, Confidence in coping ability | |
| Notes | The study results are reported only as regression coefficients and thereby could not be entered into meta‐analysis. | |
| Risk of bias | ||
| Bias | Authors' judgement | Support for judgement |
| Random sequence generation (selection bias) | High risk | "Half of the group homes within each participating agency were then randomly assigned to receive the CSP (the experimental group), and the other half did not (the control group). If an agency had an odd number of homes, the extra home was assigned to the experimental group." (p. 338) |
| Allocation concealment (selection bias) | Unclear risk | Not reported |
| Blinding (performance bias and detection bias) | High risk | Not possible, self report |
| Incomplete outcome data (attrition bias) | Low risk | "Employees who were randomized into the experimental group but who had no exposure to the CSP were included in the analyses as members of the experimental group." (p. 342) |
| Selective reporting (reporting bias) | Unclear risk | Results reported only as regression coefficients |
| Other bias | Unclear risk | We did not find any indications of other sources of bias. |
| Methods | cluster‐RCT, Denmark | |
| Participants | 210 eldercare workers | |
| Interventions | 1) Experimental 1: Stress Management Intervention: The SMI was developed to address the work stress in health care with particular attention to prevention of burnout and development of strategies for stress management. Training occurred over 20 weeks, with group sessions every 2 weeks, and each session lasting 2 hours. Between sessions, the participants were given assignments concerning implementation of the programme in daily practice. | |
| Outcomes | MBI (results not reported in article but obtained directly from author) | |
| Notes | ||
| Risk of bias | ||
| Bias | Authors' judgement | Support for judgement |
| Random sequence generation (selection bias) | Unclear risk | "Randomization was performed at group level because the intervention programs were meant to involve the employee as a group during education and implementation. The assignment to the different intervention programs was balanced to secure representation of all 3 programs in each of the wards." (p.1762) |
| Allocation concealment (selection bias) | Unclear risk | Not reported. |
| Blinding (performance bias and detection bias) | High risk | Not possible, self report |
| Incomplete outcome data (attrition bias) | High risk | "We observed no differences in age and number of years occupied in health care and mean intensity of LBP during the past year between participants who remained in the study and participants who dropped out." (p.1762) |
| Selective reporting (reporting bias) | High risk | Results data for the MBI, Setterlind's Stress Scores and rating of social support were not reported because they were not statistically significantly different between groups. "...[N]o significant changes were found in either of the intervention arms in ... the Maslach Burnout Inventory, the Setterlind stress scores, or the rating of social support (data not shown)" (p. 1765) |
| Other bias | Unclear risk | We did not find any indications of other sources of bias. |
| Methods | RCT, UK | |
| Participants | 79 student nurses reporting significant levels of affective distress at screen | |
| Interventions | 1) Experimental: Multi‐modal stress management: 6 2‐hour sessions about coping skills: self monitoring of distress symptoms, use of problem‐solving strategies to change situations, situational reappraisal, time‐ and self‐management skills, relaxation skills and applying all this in real‐life settings. The presentation of an element of a 6‐session relaxation intervention completed each session. The aim of the relaxation programme was to enable the student to relax in a non‐threatening situation in 30 seconds and for the student to generalise this "applied relaxation" coping skill in real‐life situations. Relaxation techniques taught were: progressive muscle relaxation, release‐only relaxation, rapid relaxation, autogenic relaxation and meditation. In addition, strategies described as having an interface/organisational focus were included. using participant experience as a focus, problem solving in a group setting centred on the reduction of work‐family stress, the facilitation of an increase in perceived influence and maximisation of awareness and uptake of available organisational supports. | |
| Outcomes | Derogatis Stress profile, Beck & Srivastava Stress Inventory, GHQ, STAI, BDI, ways of coping, absenteeism | |
| Notes | ||
| Risk of bias | ||
| Bias | Authors' judgement | Support for judgement |
| Random sequence generation (selection bias) | Low risk | "Students were randomly allocated to experimental and control groups. Odd and even integers read from random number tables were used to assign experimental and control group membership respectively." (p. 692) |
| Allocation concealment (selection bias) | Unclear risk | Not reported. |
| Blinding (performance bias and detection bias) | High risk | Not possible, self report |
| Incomplete outcome data (attrition bias) | High risk | "This [Attrition from the stress management intervention] was low and comparable between groups with only 6 and 7% of control and experimental participants leaving the study by 3 month follow‐up. Data from students who attended 4 sessions and provided three complete sets of data at times 1‐3, we included in the analytic procedures employed." (p. 693) |
| Selective reporting (reporting bias) | Low risk | All outcomes reported |
| Other bias | Unclear risk | We did not find any indications of other sources of bias. |
| Methods | Cluster‐RCT, Netherlands | |
| Participants | Nurses on wards of an academic hospital were screened for work and health problems: Experimental: 29 wards, 579 participants of which 139 screened positive Control: 29 wards, 561 participants of which 161 screened positive. Experimental 17% Control 22% men, > 45 years age Experimental 51% Control 46%, > 10 years of experience Experimental 51% Control 41% | |
| Interventions | 1) Experimental: Participants received personalised feedback on their screening results immediately after filling out the baseline questionnaire, both onscreen and in an e‐mail. The personalised feedback was followed by an invitation for a tailored offer of self‐help EMH interventions, on the basis of an algorithm based on the specific symptoms and the work‐relatedness of the symptoms. Participants were mostly offered a choice of 2 ‐ 3 EMH interventions to leave room for personal preferences. Participants who screened negative on all mental health complaints were invited to follow an EMH intervention aimed at enhancing and retaining their mental fitness. The EMH interventions are self‐help interventions on the Internet aimed at reducing specific mental health complaints or enhancing well‐being. The interventions are mainly based on the principles of cognitive behavioural therapy and combine a variety of aspects, e.g. providing information and advice, weekly assignments, the option of keeping a diary and a forum to get in contact with others who have similar complaints. The EMH interventions were developed as stand‐alone interventions by the Trimbos Institute (CBT) 2) Control: Waiting list: In the control arm. Participants filled out the baseline questionnaire; however, results of the screening questionnaires were not to be reported back to participants, and no further interventions were advised at baseline. As compensation, participants in the control arm received their personal screening results together with a tailored choice for a self‐help e‐mental health intervention six months after baseline. | |
| Outcomes | The study used work‐functioning as the primary outcome: we used the distress part of the Dutch 4DKL as stress outcome; anxiety and depression were also measured but not reported | |
| Notes | We got the following data from author S. Ketelaar: Distress measure with 4DKL at 6 months follow‐up for the group who screened positive: Experimental: N = 52 6.06 ± 6.54; Control: N = 116 6.82 ± 6.5.7 | |
| Risk of bias | ||
| Bias | Authors' judgement | Support for judgement |
| Random sequence generation (selection bias) | Low risk | In order to guarantee allocation concealment, randomisation was performed by 1 researcher (KN) who was not involved in the practical recruitment of employees, using the computer software program Nquery Advisor with a block size of 3. |
| Allocation concealment (selection bias) | Unclear risk | see above |
| Blinding (performance bias and detection bias) | High risk | Providers and participants not blinded; outcome self‐reported stress |
| Incomplete outcome data (attrition bias) | High risk | Experimental: 80/178 = 44% lost to follow‐up; Control: 71/211 = 34% lost to follow‐up |
| Selective reporting (reporting bias) | High risk | Anxiety and Depression not reported |
| Other bias | High risk | Compliance with the intervention was extremely low |
| Methods | RCT of individuals, USA | |
| Participants | Personnell of a surgical intensive care unit of a large university hospital (n = 32); 69% nurses, 88% women, age average 44 yrs, experience 12 ± 10 yrs | |
| Interventions | 1) Experimental: A pragmatic low‐dose mindfullness‐based worksite intervention, on‐site 1 hour before shift change during 8 weeks 2) Control: waiting list control | |
| Outcomes | Depression Anxiety Stress Scale (DASS‐21) and salivary alpha‐amylase; work satisfaction | |
| Notes | Based on abstract only | |
| Risk of bias | ||
| Bias | Authors' judgement | Support for judgement |
| Random sequence generation (selection bias) | Unclear risk | "..were randomized to intervention or wait‐list control groups, stratified by gender.." |
| Allocation concealment (selection bias) | Unclear risk | Not reported |
| Blinding (performance bias and detection bias) | High risk | Not possible, self report |
| Incomplete outcome data (attrition bias) | Unclear risk | Not reported |
| Selective reporting (reporting bias) | Unclear risk | Not reported |
| Other bias | Unclear risk | Based on abstract only |
| Methods | RCT, Brazil | |
| Participants | 75 nurses at the Teaching Hospital of the University of São Paulo. "In order to define the sample of participants, the authors used the Stress Inventory or Stress Symptoms List – SSL. This instrument was applied to all subjects who agreed to participate in the study (N=109); however, only subjects who achieved mean (29 to 60 points), high (61 to 120 points) or very high (>120 points) scores were included in the sample; 75 of them completed the study. As for the distribution of the participants, 22 subjects were placed in the Control Group, 27 in the Needles Group and 26 in the Seeds Group." (p. 88) "The inclusion criteria were: belonging to the nursing team; voluntary participation in the study with avaiability to attend the sessions; obtaining a minimum SSL score at mean, high and very high stress level; not being pregnant. The authors excluded from the sample all the subjects who went on vacation or medical leave after the | |
| Interventions | 1) Experimental 1: Auriculotherapy (form of acupuncture performed on the ears) with needles (n = 27) 2) Experimental 2: Auriculotherapy with seeds (n = 26) 3) Control: No intervention(n = 22) "The intervention groups received eight sessions (one session a week), with duration of 5 to 10 minutes each session, on the Shenmen, Kidney and Brainstem points. The first two points have calmative properties and the kidney point has energetic function. After the location of the reactive points with a point locator, the ear auricle was hygienized with cotton and ethyl alcohol 70% and, then, semi‐permanent needles were applied or seeds were fixed with adhesive plaster, according to the intervention group. In the group of auriculo therapy with seeds, mustard seeds were used and the participants were instructed to stimulate them three times a day, for 15 times, with moderate pressure. The volunteers were instructed to remove the needles or seeds 24 hours before the session and, in case there was any discomfort, itching or signs of allergy, they should remove them before that." (p. 88) | |
| Outcomes | Stress Symptoms List | |
| Notes | ||
| Risk of bias | ||
| Bias | Authors' judgement | Support for judgement |
| Random sequence generation (selection bias) | Unclear risk | "This randomized controlled clinical experiment was performed with three groups..." (p. 88) |
| Allocation concealment (selection bias) | Unclear risk | Not reported |
| Blinding (performance bias and detection bias) | High risk | Blinding was not possible |
| Incomplete outcome data (attrition bias) | High risk | "...there was a loss of 34 subjects during the study. Seven professionals went on vacation after the beginning of the study and two on medical leave; 12 missed the session because they had forgotten it, due to traffic problems or the difficulty to reschedule it and seven did not show up for the first session. One participant gave up due to adverse effects, in this case, nightmares, and five exclusions were due to low score (1), not belonging to the nursing team (3), and not filling out properly the questionnaires (1)." (p. 89) The authors do not report how the dropouts were distributed among the study groups. |
| Selective reporting (reporting bias) | High risk | The authors present data separately for participants who had had high SSL scores to begin with in table 2 but not at all for participants with a moderate SSL score. |
| Other bias | Unclear risk | We did not find any indications of other sources of bias. |
| Methods | RCT, Hong Kong | |
| Participants | 38 nurses. "All ED nurses who met the following inclusion criteria were invited to participate in the MEDI program: (a) currently employed ED nurse and (b) Cantonese‐English speaking" (p. 20) "Exclusionary criteria were as follows: (a) substantial drug or alcohol abuse problems, (b) current suicidal ideation, (c) the presence of psychotic symptoms, or (d) currently taking psychiatric medication." (p. 20) | |
| Interventions | 1) Experimental: MEDI intervention (n = 18) "The MEDI program is a combination of four crucial components: to pay attention to each moment with non‐judgemental manner (Mindfulness), to regulate intense emotions (Emotion regulation), to tolerate emotional distress when change is sluggish or implausible (Distress toleration) and to be more efficient in resolving interpersonal conflicts (Interpersonal effectiveness)." (p. 13) "...the MEDI program, which included four sessions, 1.5h each concerning mindfulness, emotion regulation, distress tolerance, and interpersonal effectiveness." (p. 24) 2) Control: No intervention (n = 20) | |
| Outcomes | MPSS‐R consisting of 4 subscales; OS = Occupational Stress, JD = Job Dissatisfaction, NPA = Negative patient attitude and SS = Somatic Stress. | |
| Notes | ||
| Risk of bias | ||
| Bias | Authors' judgement | Support for judgement |
| Random sequence generation (selection bias) | Low risk | "...two groups were formed: (a) MEDI treatment (n=18) and (b) no treatment control (n=20) based on each participant blindly drawing a number from an envelope (1 = MEDI group and 2 = control condition)." (p. 32) |
| Allocation concealment (selection bias) | Unclear risk | Authors do not report if allocation was concealed |
| Blinding (performance bias and detection bias) | High risk | Blinding of participants (also outcome assessors of self‐report measures) and intervention providers was not possible. |
| Incomplete outcome data (attrition bias) | High risk | Participants were "[e]xcluded from analysis due to drop out". (p. 32) |
| Selective reporting (reporting bias) | Low risk | All measured outcomes were reported. |
| Other bias | High risk | The dropout rate was 50% of the original sample (12/18 in intervention group and 7/20 in control group). |
| Methods | Cross‐over study, Taiwan | |
| Participants | 54 newly‐employed nurses who had been in their job for less than one year. "The 54 participants were all female with a mean age of 23.4 (SD = 2.46). Only one participant was married. The majority were registered nurses (n = 49, 90.7%), with no past clinical experience (n = 42, 77.8%) and most had graduated from junior college (n = 40, 74.1%)." (p. 2419) "To qualify for participation in the study, participants were required to: (1) have normal hearing without the use of any hearing aid; 2) have been employed full‐time as a nurse for <1 year; (3) be between 20 and 40 years of age; (4) have a self‐rated VAS 0‐10 stress score of ≥6 and (5) weigh between 45 and 70 kg." (p. 2416) "Exclusion criteria included: (1) current or past abnormalities in endocrinology or metabolism (Lavie et al. 2009); (2) pregnancy; (3) chronic organic disease; (4) medicine, alcohol or tobacco use; (5) those who have experienced a major stressful event in the past 6 months (The Social Readjustment Rating Scale) (Holmes & Rahe 1967); and (6) those receiving physical training (Schulz et al. 2004)." (p. 2416) | |
| Interventions | "Interventions consisted of an alternating music and chair rest or chair rest and music sequence" (p. 2416) The procedure took one hour and 20 minutes to complete. It started with 30 minutes listening to music whilst seated, followed by a 20‐minute washout during which participants "...were asked to get up and move around while the researcher made conversation with the participant based on a standardized chatting guideline about the daily leisure activities and interests participants had outlined beforehand" and finally participants rested whilst seated for another 30 minutes. Half the participants were randomised to receive the interventions the other way round. | |
| Outcomes | Self‐perceived stress on a 10 cm VAS, Heart rate, mean arterial pressure and finger temperature. | |
| Notes | Authors could not be traced for inquiries | |
| Risk of bias | ||
| Bias | Authors' judgement | Support for judgement |
| Random sequence generation (selection bias) | Unclear risk | "A randomized controlled crossover clinical trial was used to examine the effectiveness of music on stress reduction." (p. 2416) |
| Allocation concealment (selection bias) | Unclear risk | Not reported. |
| Blinding (performance bias and detection bias) | High risk | Not reported but not possible. |
| Incomplete outcome data (attrition bias) | Low risk | Apparently there were no dropouts so all data are accounted for. |
| Selective reporting (reporting bias) | Low risk | All the measured outcomes were reported. |
| Other bias | High risk | The cross‐over design may be a source of bias. It is impossible to say if a 20‐minute washout is enough. |
| Methods | Cluster‐RCT, Netherlands | |
| Participants | 664 staff members of 29 oncology wards of 18 general hospitals. Participants were physicians, nurses and radiotherapy assistants. | |
| Interventions | 1) Experimental: Take Care! stress management training: 6 monthly 3‐hour sessions about 1) working mechanisms of job stress and feedback on work situation survey 2) emergence and preservation of unwanted collective behaviour 3) communication 4) building a social support network 5) balancing job‐related investments and outcomes. Participants formed teams that collectively designed, implemented, evaluated and reformulated plans of action to cope with most important stressors in their work situation. | |
| Outcomes | MBI, Social support scale, Participation in decision making scale, Job control scale, Quantitative job demands scale and Emotional job demands scale | |
| Notes | ||
| Risk of bias | ||
| Bias | Authors' judgement | Support for judgement |
| Random sequence generation (selection bias) | Unclear risk | "Nine experimental wards were randomly selected from the total number of 29 wards participating in this study; the remaining 20 wards served as controls" (p. 215) |
| Allocation concealment (selection bias) | Unclear risk | Not reported. |
| Blinding (performance bias and detection bias) | High risk | Not possible, self report |
| Incomplete outcome data (attrition bias) | Low risk | "An analysis of the dropout pattern ... revealed that panel attrition was the dominant pattern, with a group of 54 respondents who were missing at T2 but returned at T3. Given this pattern, we created a variable indicating whether a person was missing at T2 but not at T1 and T3. Next, we performed a multivariate analysis of variance to check whether this specific group differed from the remaining participants... No significant differences emerged... which suggests that panel attrition was not selective." (p. 217) |
| Selective reporting (reporting bias) | Low risk | All outcomes reported |
| Other bias | Unclear risk | We did not find any indications of other sources of bias. |
| Methods | RCT, Taiwan | |
| Participants | 60 hospital nurses suffering from either: insomnia, headache or gastrointestinal discomfort | |
| Interventions | 1) Experimental: Assertiveness training: 6 2‐hour sessions on Monday, Wednesday and Friday at 2pm ‐ 4pm on t2consecutive weeks. The contents of sessions included the concept of beliefs and negative self‐statements, building a positive belief system, applying assertion to clinical settings and developing group and self‐reinforcement support systems. | |
| Outcomes | Perceived Stress Scale, Rathus Assertiveness Schedule | |
| Notes | ||
| Risk of bias | ||
| Bias | Authors' judgement | Support for judgement |
| Random sequence generation (selection bias) | Unclear risk | "Subjects were randomly assigned to one of two treatments: assertiveness training (AT) or alternate treatment control (ATC), which served as a control and contained updated knowledge of new computer technology for in patient settings." (p. 419) |
| Allocation concealment (selection bias) | Low risk | "Subjects admitted to the study agreed to random treatment assignment and a 2‐month commitment to the study. However, the subjects did not know whether they would receive treatment or control procedures during that time." (p. 425) |
| Blinding (performance bias and detection bias) | High risk | Not possible, self report |
| Incomplete outcome data (attrition bias) | High risk | "Of the respondents who initially chose to participate, three did not complete the study and were not included in the data analysis due to their failure to attend all sessions, failure to complete the questionnaire, or decision to leave hospital employment." (p. 425) |
| Selective reporting (reporting bias) | Low risk | All outcomes reported |
| Other bias | Unclear risk | We did not find any indications of other sources of bias. |
| Methods | Controlled Clinical Trial, Canada | |
| Participants | "At Time 1, 1,173 health care workers in three district health authorities in Nova Scotia and two hospitals in Ontario completed a survey (n 262 in the intervention units and n 911 in the contrast units). Participants were predominantly female (n 1,009, 86.0%; male: n 139, 11.8%; 25 not responding), with an average age of 42.54 years (SD 10.12). Their employment status varied, including full‐time (n 833, 71.0%), part‐time (n 232, 19.8%), casual (n 85, 7.2%), and temporary (n 8, 0.7%) employment, with 15 not responding. The occupational categories with the highest response rates included registered nurses (RNs; n 607, 51.7%), registered psychiatric nurses (RPNs; n 74, 6.3%), ward clerks (n 52, 4.4%), physicians (n 46, 3.9%) and licensed practical nurses (LPNs; n 42, 3.6%). They worked in their current hospital for varying lengths: fewer than 6 months (25, 2.1%), 6–24 months (68, 5.8%), 2–5 years (247, 21.1%), 6–10 years (207, 17.6%), 11–15 years (124, 10.6%), 16–20 years (151, 12.9%), 21–30 years (190, 16.2%), and more than 30 years (50, 4.3%), with 111 not responding. At Time 2, 907 health care workers completed the survey (n 181 in intervention units; n 726 in contrast units), for a response rate of 28.6%. Four hundred seventy‐two participants completed surveys both at Time 1 and Time 2. At Time 2, participants were predominantly female (n 793, 87.4%; male: n 96, 10.6%, 18 not responding), with an average age of 42.27 years (SD 10.60). Their employment status varied, including full‐time (n 645, 71.0%), part‐time (n 177, 19.6%), casual (n 56, 6.1%), and temporary (n 13; 1.4%) employment, with 16 not responding. The occupational categories with the highest response rates included RNs (n 464, 51.3%), physicians (n 43, 4.8%), ward clerks (n 43, 4.8%), RPNs (n 41, 4.5%), and LPNs (n 33, 3.7%). They worked in their current hospital for varying lengths: fewer than 6 months (16, 1.8%), 6–24 months (78, 8.6%), 2–5 years (137, 15.2%), 6–10 years (133, 14.7%), 11–15 years (70, 7.7%), 16–20 years (101, 11.2%), 21–30 years (160, 17.7%), and more than 30 years (44, 4.9%), with 168 not responding. Employees who described their position as temporary (Time 1, n 8; Time 2, n 13) were dropped from the analysis." (p. 1262) | |
| Interventions | 1) Experimental: CREW intervention The CREW (Civility, Respect and Engagement at Work) intervention consisted of an introductory period, six months of weekly meetings led by a facilitator "CREW is a process designed to enhance civility among colleagues within the USA VHA. Employees met with coworkers on their units on a weekly or biweekly basis to work on effective interpersonal interactions at work. Trained facilitators assist these groups by providing guidance on the basis of their expertise in group facilitation and knowledge of effective work group communication." 2) Control: No intervention | |
| Outcomes | The Emotional Exhaustion and Cynicism subscales of the MBI‐General Survey | |
| Notes | ||
| Risk of bias | ||
| Bias | Authors' judgement | Support for judgement |
| Random sequence generation (selection bias) | High risk | Not randomised |
| Allocation concealment (selection bias) | High risk | Not concealed |
| Blinding (performance bias and detection bias) | High risk | Not blinded, not possible, self report |
| Incomplete outcome data (attrition bias) | High risk | The authors are not at all concerned with the fact that only 40% of participants that responded at time 1 (pre‐intervention) did so again at time 2 (post‐intervention) |
| Selective reporting (reporting bias) | Low risk | The authors report results for all outcomes listed in the Methods section. |
| Other bias | Unclear risk | We did not find any indications of other sources of bias. |
| Methods | RCT, Canada | |
| Participants | 40 staff physicians practising in an urban tertiary care centre "We excluded potential participants who screened positive for major depression with the 9‐item Patient Health Questionnaire (PHQ‐9) depression scale and referred them to the provincial physician wellness support program." (p. 155) | |
| Interventions | 1) Experimental: Biofeedback‐based stress management (n = 21). "Participants allocated to the intervention group received a brochure describing the provincial physician wellness support program; were given a biofeedback device and participated in an individual training session to learn the quick coherence technique and how to use the device, with an offer of optional follow‐up instruction; and were given a prescription to use the stress management tool during study days 0 to 28 for 5 minutes at least three times daily. A research assistant contacted each participant in the intervention group twice weekly to measure stress and well‐being, heart rate and blood pressure; to document their adherence to using the stress management tool; and to record a 3‐minute biofeedback session using the emWavePC software." (p. 156) "Participants allocated to the control group received the same brochure describing the provincial physician wellness support program and were contacted twice "The biofeedback‐based stress management tool used in our study consisted of a combination of rhythmic breathing, self‐generated positive emotion and a biofeedback device to reinforce positive physiological change when dealing with stress." (p. 155) 2) Control: (n = 19) Brochure only | |
| Outcomes | Perceived stress measured on "...a multiple‐item scale developed by the research team and intended to measure global perceptions of stress and also to capture occupation‐specific stress that is particularly relevant to physicians" The survey included 15 items from the Perceived Stress Scale and 25 selected items from the Personal and Organizational Quality Assessment–Revised (POQA‐R) questionnaire. | |
| Notes | ||
| Risk of bias | ||
| Bias | Authors' judgement | Support for judgement |
| Random sequence generation (selection bias) | Low risk | "We used a computer program to generate a random allocation sequence for assigning participants to either the control or the intervention group, with stratification by sex to ensure parity within groups." (p. 155) |
| Allocation concealment (selection bias) | Low risk | "Participants’ allocation to the control or intervention group was concealed until after the research assistant and/or the co‐investigators had confirmed eligibility criteria and received informed consent." (p. 155) |
| Blinding (performance bias and detection bias) | High risk | "Given the nature of the intervention and the outcome measures, the study was not blinded." (p. 155) |
| Incomplete outcome data (attrition bias) | High risk | "We limited calculation of mean change in stress score to participants for whom data were complete, as this value was calculated by subtracting, for each participant, the score on day 0 from the score on day 28, and then reporting the mean of these differences." (p. 157) |
| Selective reporting (reporting bias) | Low risk | All outcomes listed in Methods were reported. |
| Other bias | Unclear risk | We did not find any indications of other sources of bias. |
| Methods | Controlled Clinical Trial, Taiwan | |
| Participants | 49 junior nursing students engaged in a medical‐surgical rotation from a university. "The experimental groups consisted of mentor and mentee students; each mentor was paired with one mentee. The mentors were recruited students who had received medical–surgical experience before entering university. They also have a junior college nursing certification and a Registered Nursing license (n = 17). The mentees (n = 17) have had no prior medical–surgical clinical practice experience. The control groups consisted only of students who had no medical or surgical clinical practice experience (n = 32). The control group and experimental group were assigned in two different clinical settings at different time in order to minimize within‐group influence and its interference with the research." (p. 205) | |
| Interventions | 1) Experimental: Peer mentoring intervention, 3 days per week for 4 weeks (n = 17). "The mentors were selected from the mentee’s class. The mentors were all informed in advance about the aim and process of this study. They were volunteers and were requested to be motivated, self‐confident, enthusiastic and open, especially when dealing with mentees. They were supposed to be the role models for their mentee when taking care of patients or interacting with the clinical teacher and medical staff. The mentor also played a psychosocial role, for example, listening to the mentees’ complaints,sharing their pre clinical practice experience and generally giving all‐round support." (p. 205) "Mentors were coached and supervised by the clinical teacher to make sure of the accuracy and reliability of their knowledge when they first practiced their nursing skills on an actual patient. After that, mentors could assist mentees in some basic and non‐intervened nursing skills, such as naso‐gastric tube care and mouth care, which had been taught in school lectures. Mentors and mentees could also learn to understand each other’s patients through communicating with the patients and discussing with the medical staff. They were able to converse with each other at least once a week during the rotation. In addition, after work, they gave support through correspondence, over the telephone or e‐mail." (p. 205) 2) Control: (n = 32) No intervention | |
| Outcomes | The Perceived Stress Scale (PSS) Total score | |
| Notes | ||
| Risk of bias | ||
| Bias | Authors' judgement | Support for judgement |
| Random sequence generation (selection bias) | High risk | "The control group and experimental group were assigned in two different clinical settings at different time in order to minimize within‐group influence and its interference with the research." (p. 205) |
| Allocation concealment (selection bias) | High risk | Allocation was not concealed. |
| Blinding (performance bias and detection bias) | High risk | Not possible, self report |
| Incomplete outcome data (attrition bias) | Low risk | Apparently none of the participants dropped out. |
| Selective reporting (reporting bias) | Unclear risk | The study recruited 34 students in the experimental group (17 mentors and 17 mentees) but the authors report outcome data only for 17 of these, presumably the mentees. |
| Other bias | High risk | The authors state that "… gender will be a confounding variable in this study" (206) |
| Methods | Cluster‐randomised cross‐over non‐inferiority trial, USA | |
| Participants | 62 hospital physicians | |
| Interventions | 1) Experimental: 2‐week hypothesised to be least stressful | |
| Outcomes | Burnout was measured with a questionnaire that contained: "...8 items from Minimizing Error, Maximizing Outcomes...and 4 items from the short version of the Perceived Stress Scale. Emotional exhaustion... was measured using 9 items from the Maslach Burnout Inventory Human Services Survey and a single‐item measure from the National Job Burnout Survey that uses a personal definition of burnout." (p. 2201) We used the MBI emotional exhaustion scale. The study´s primary outcome was patient re‐hospitalisation. | |
| Notes | The authors kindly provided the continuous outcomes for the MBI scale. We used the data at physician level not at work schedule level. | |
| Risk of bias | ||
| Bias | Authors' judgement | Support for judgement |
| Random sequence generation (selection bias) | Low risk | "After dividing each attending physician’s year‐long service commitment into 4‐week segments, we used a computerized random‐number generator to block randomize these 4‐week segments (as single 4‐week or paired 2‐week rotations) using block sizes of 2, the number of rotation types." (eAppendix) |
| Allocation concealment (selection bias) | High risk | Not concealed |
| Blinding (performance bias and detection bias) | High risk | "Attending physicians were not blinded to their rotation assignments because the year long rotation schedule was distributed 3 months before the study commenced. Attending physicians, trainees, and patients were, nonetheless, blinded to the study hypothesis." (p. 2200‐2201) |
| Incomplete outcome data (attrition bias) | Low risk | There were very little missing data. "A severity assessment from a 2‐week rotation was missing from one attending physician who had completed 5 other assessments after 2‐week rotations." |
| Selective reporting (reporting bias) | Low risk | All outcomes listed in the Methods section were reported. |
| Other bias | Unclear risk | We did not find any indications of other sources of bias. |
| Methods | Cluster‐RCT, Sweden | |
| Participants | 26 health care personnel in a geriatric hospital | |
| Interventions | 1) Experimental: Support and advice from a psychologist: 1 hour every second week for 20 weeks regarding knowledge about stressors, relaxation techniques, life style factors and physiological, cognitive, emotional and behavioural stress reactions. Participants were encouraged to alter reaction patterns and to discuss and test new alternative patterns and enhance own work conditions and increase self control over work processes. | |
| Outcomes | A structured made‐to‐measure stress questionnaire | |
| Notes | ||
| Risk of bias | ||
| Bias | Authors' judgement | Support for judgement |
| Random sequence generation (selection bias) | Unclear risk | "The wards were randomly allocated to be either intervention (I) or control (C) ward" (p. 80) |
| Allocation concealment (selection bias) | Unclear risk | Not reported. |
| Blinding (performance bias and detection bias) | High risk | Not possible, self report |
| Incomplete outcome data (attrition bias) | Low risk | "There were no dropouts during the study period" (p. 81) |
| Selective reporting (reporting bias) | Low risk | All outcomes reported. |
| Other bias | Unclear risk | We did not find any indications of other sources of bias. |
| Methods | RCT, Canada | |
| Participants | 30 nurses and nurse aides working in a large urban geriatric teaching hospital | |
| Interventions | 1) Experimental: Mindfulness‐based stress reduction programme: 4 30‐minute group sessions including didactic section and experiential exercises. Participants also received a CD or audiocassette of guided exercises and a manual with the help of which they were instructed to practise for at least 10 minutes per day 5 days per week. | |
| Outcomes | MBI, Smith Relaxation Dispositions Inventory | |
| Notes | ||
| Risk of bias | ||
| Bias | Authors' judgement | Support for judgement |
| Random sequence generation (selection bias) | High risk | "Nurses and nurse aides were recruited from long‐term and complex continuing care units in a large urban geriatric teaching hospital and randomly assigned to intervention or wait‐list control groups. Because the study was conducted during the summer, however, several exceptions were made to accommodate participants' vacation schedules and additional control participants were recruited." (p. 106) |
| Allocation concealment (selection bias) | Unclear risk | Not reported. |
| Blinding (performance bias and detection bias) | High risk | Not possible, self report |
| Incomplete outcome data (attrition bias) | Unclear risk | It is unclear if any participants dropped out |
| Selective reporting (reporting bias) | Low risk | All outcomes reported |
| Other bias | Unclear risk | We did not find any indications of other sources of bias. |
| Methods | RCT, Argentina | |
| Participants | 74 hospital paediatric resident physicians. " A total of 81% were female; the mean age was 27.3±1.4 years; 57% were working in inpatient areas, 35% in the outpatient clinic, and 8% in the intensive care unit." " A comparison of the characteristics of both groups (experimental and control) revealed no significant | |
| Interventions | 1) Experimental: Self‐care workshop intervention (n = 37). "The experimental group received a brief intervention consisting of two 2.5‐hour workshops directed by mental health professionals, which covered repercussions of 2) Control: (n = 37) No intervention | |
| Outcomes | MBI | |
| Notes | It is unclear why 43 (37%) out of the available 117 resident physicians did not participate in the study. | |
| Risk of bias | ||
| Bias | Authors' judgement | Support for judgement |
| Random sequence generation (selection bias) | Unclear risk | "After administration of the questionnaire, subjects were randomly assigned to one of the two study groups." (p. 494) |
| Allocation concealment (selection bias) | Unclear risk | Not reported. |
| Blinding (performance bias and detection bias) | High risk | Participants could not be blinded regarding group allocation. Also as outcome measurement was by self report, there was no blinding |
| Incomplete outcome data (attrition bias) | Low risk | Apparently no participants were lost to follow‐up |
| Selective reporting (reporting bias) | High risk | The authors do not report standard deviations with the mean MBI subscale scores. |
| Other bias | Unclear risk | It is unclear if these 74 were all the participants or only those that could be followed up. |
| Methods | RCT, USA | |
| Participants | 20 nurses working at a tertiary care centre | |
| Interventions | 1) Experimental: AMMA therapy: 4 weekly 45‐minute treatments consisting of circular digital pressure along particular Chinese energy channels on the head, chest, arms, hands, feet, abdomen, legs and back. "It is performed while the practitioner is using intent to remove blockages from the energy channels, as well as pressure on designated "points" or areas of the body." (p. 20) | |
| Outcomes | VAS of anxiety, blood pressure, heart rate, pulse oximetry, skin temperature | |
| Notes | ||
| Risk of bias | ||
| Bias | Authors' judgement | Support for judgement |
| Random sequence generation (selection bias) | Unclear risk | "The first 30 names of eligible participants were randomly and equally divided into control (receiving mock treatments) and experimental (receiving authentic AMMA treatment) groups." (p. 19) |
| Allocation concealment (selection bias) | Unclear risk | Not reported |
| Blinding (performance bias and detection bias) | High risk | Not possible, self report |
| Incomplete outcome data (attrition bias) | High risk | "Three participants from each group withdrew from the study before receiving treatments. One control group practitioner withdrew from the study as it began and the four participants in that group were unable to reschedule with another practitioner." (p. 19) |
| Selective reporting (reporting bias) | Low risk | All outcomes reported |
| Other bias | Unclear risk | We did not find any indications of other sources of bias. |
| Methods | RCT,Netherlands | |
| Participants | 161 psychiatric nurses in long‐stay settings | |
| Interventions | 1) Experimental: Support and advice given by nurse managers or quality care co‐ordinators: Participants were assigned to patients as primary nurses and given advice by nurse managers or quality care co‐ordinators and they followed a training programme about communication skills over a year. | |
| Outcomes | MBI | |
| Notes | ||
| Risk of bias | ||
| Bias | Authors' judgement | Support for judgement |
| Random sequence generation (selection bias) | High risk | "Random sampling was used to select 492 nurses to complete the questionnaires." (p. 696) |
| Allocation concealment (selection bias) | Unclear risk | Not reported |
| Blinding (performance bias and detection bias) | High risk | Not possible, self report |
| Incomplete outcome data (attrition bias) | High risk | "Two main problems were encountered in this study, namely a high drop‐out rate largely due to job turnover among nurses, and the imitation of the intervention by the control group." (p. 697) A total of 51.6% of the participants dropped out during the study |
| Selective reporting (reporting bias) | Low risk | All outcomes reported |
| Other bias | Unclear risk | We did not find any indications of other sources of bias |
| Methods | RCT with individual participants, USA | |
| Participants | Paediatric oncology staff (50% nurses, 20% physicians); Experimental 23 Control 24; Men: Experimental 30% Control 8%; Age: not reported; stated to be equal; Experience: > 10 yrs Experimental 48% Control 46% | |
| Interventions | 1) Experimental: 8 weeks of didactic and experiential mindfulness education via a structured, skills‐training course delivered in a group setting at their hospital. The course included 1 initial 6‐hour session; 6 weekly 1‐hour follow‐up sessions; and a final 3‐hour wrap‐up session (15 hours total class time) 2) Control: No intervention | |
| Outcomes | MBI; Percieved Stress Scale | |
| Notes | Authors provided extra data: SDs of MBI at follow‐up: Experimental: EE: 7.67; DP: 3.54; PA 3.69 Control: EE: 6.39; DP: 4.59; PA: 5.27 | |
| Risk of bias | ||
| Bias | Authors' judgement | Support for judgement |
| Random sequence generation (selection bias) | Low risk | Using a computer‐generated random numbers schema in blocks of 10 |
| Allocation concealment (selection bias) | Unclear risk | Participants were stratified according to their respective professions and randomised to a mindfulness‐based course (intervention) or no intervention (control) |
| Blinding (performance bias and detection bias) | High risk | Study not blinded, outcome self report |
| Incomplete outcome data (attrition bias) | Low risk | All participants reported outcomes |
| Selective reporting (reporting bias) | Low risk | All outcomes stated in the Methods reported |
| Other bias | Unclear risk | We did not find any indications of other sources of bias. |
| Methods | RCT with individual participants in parallel groups, Australia | |
| Participants | Nurses and assistant nurses in dementia care; 100% women; Age 49 yrs ± 11 yrs; > 10 yrs experience 10%; Experimental n = 9 Control n = 10 | |
| Interventions | 1) Experimental: The intervention was a foot massage delivered by 1 of 2 research assistants trained by an expert certified therapist in the massage technique. In each session, participants received a standardised 5‐minute massage on each foot (10‐minute in total), involving the application of light pressure with long, gliding, rhythmical strokes of the entire foot and ankle, and toe and ankle rotation, flexion and extension [16 ‐ 19]. Unscented Sorbolene (8 ‐ 10 mls) was applied as a lubricant for the massage. 2 ) Control: In the silent resting control sessions participants sat silently with their eyes closed and legs slightly elevated on a beanbag for 10 minutes. A trained research assistant stayed outside the room for the 10‐min period. The purpose of the silent resting condition was to help isolate whether any observed effects were because of the foot massage specifically, or because the participant received special attention and had the opportunity to be away from the work environment for a quiet time. | |
| Outcomes | Profile of Mood States‐ Bipolar (POMS‐Bipolar); systolic and diastolic blood pressure | |
| Notes | ||
| Risk of bias | ||
| Bias | Authors' judgement | Support for judgement |
| Random sequence generation (selection bias) | Low risk | "used a computer program to undertake the permuted‐block randomization process, with block sizes set at six" |
| Allocation concealment (selection bias) | Unclear risk | Not reported |
| Blinding (performance bias and detection bias) | High risk | Provider and participants not blinded. Outcome self‐reported |
| Incomplete outcome data (attrition bias) | Low risk | All participant‐outcome data reported |
| Selective reporting (reporting bias) | Low risk | No protocol, but all outcomes from Method section reported |
| Other bias | Unclear risk | We did not find any indications of other sources of bias |
| Methods | RCT, USA | |
| Participants | 12 respiratory therapists | |
| Interventions | 1) Experimental: Stress management programme: 8 weekly group sessions on average 60 minutes and a manual containing homework assignments to be completed between sessions. Topics covered were deep muscle relaxation, cognitive‐behavioural exercises to identify and examine stressful situations, replacing negative thoughts and emotions with adaptive rational cognitions, effective communication skills, social support networks and problem‐solving skills, physical fitness, nutrition and weight management and maintenance of behaviour change. | |
| Outcomes | MBI, C‐H Inventory of Phys Symptoms, The Hassles Scale, The Uplifts Scale | |
| Notes | ||
| Risk of bias | ||
| Bias | Authors' judgement | Support for judgement |
| Random sequence generation (selection bias) | Unclear risk | "The 12 participating employees were randomly assigned to one of two conditions: 6 to an 8‐week stress management programme and 6 to a wait‐list control group." (p. 120) |
| Allocation concealment (selection bias) | Unclear risk | Not reported |
| Blinding (performance bias and detection bias) | High risk | Not possible, self report |
| Incomplete outcome data (attrition bias) | Low risk | There were no dropouts because of small sample size |
| Selective reporting (reporting bias) | Low risk | All outcomes reported |
| Other bias | Unclear risk | We did not find any indications of other sources of bias |
| Methods | RCT, USA | |
| Participants | 58 staff members (64% nurses, 12% physicians and 24% other) of a large hospital | |
| Interventions | 1) Experimental: Eight‐Point Program Spiritual Skills Training: 8 weekly 2‐hour training sessions about meditation skills (passage meditation, mantram repetition, slowing down, focused attention, training the senses, putting others first, spiritual association and inspirational reading). | |
| Outcomes | Perceived Stress Scale, MBI, Medical Outcomes Study | |
| Notes | ||
| Risk of bias | ||
| Bias | Authors' judgement | Support for judgement |
| Random sequence generation (selection bias) | Low risk | Details of randomisation were provided in a separate supplement to the article: "While participants were completing pretests, individuals were randomly assigned to treatment (n = 30) or wait‐list control (n = 31). Computer pre‐generated 1:1 random assignment tables had been prepared by the lead investigator for each potential number of registering participants, up to 60, for each session (precise number of registrants could not be anticipated). At each session, as participants completed pretests, their consent forms were rapidly assembled in an arbitrary order and given sequential numbers by the lead investigator or the main instructor. The total number of received consent forms dictated the appropriate random assignment table, which dictated how to separate the numbered consent forms into two groups." (p. S4) |
| Allocation concealment (selection bias) | High risk | "Immediately following pretest, participants were informed of their group assignment. One or two weeks later, those in the treatment condition began the eight week training, meeting together in one large group." (p. S4) |
| Blinding (performance bias and detection bias) | High risk | Not possible, self report |
| Incomplete outcome data (attrition bias) | Low risk | "Selected characteristics of the 58 final participants included in the intention‐to‐treat analysis are displayed in Table 1" (p. 715) |
| Selective reporting (reporting bias) | Low risk | All outcomes reported |
| Other bias | Unclear risk | We did not find any indications of other sources of bias |
| Methods | RCT, USA | |
| Participants | 14 registered or licensed practical female nurses aged 49 years and older who were currently employed at an academic medical centre full‐time or part‐time in a staff nurse position that involved lifting patients. | |
| Interventions | 1) Experimental: Tai Chi: onsite Tai Chi classes once a week and to practise on their own for 10 minutes each day at least 4 days per week for 15 weeks. Each Tai Chi class lasted 45 minutes, with 10 minutes of breathing exercises, followed by 30 minutes of Tai Chi practice, and ended with 5 minutes of visualisation and cool‐down exercises. | |
| Outcomes | Nursing Stress Scale, Perceived Stress Scale | |
| Notes | ||
| Risk of bias | ||
| Bias | Authors' judgement | Support for judgement |
| Random sequence generation (selection bias) | Unclear risk | Not reported. |
| Allocation concealment (selection bias) | Unclear risk | Not reported. |
| Blinding (performance bias and detection bias) | High risk | Not possible, self report |
| Incomplete outcome data (attrition bias) | High risk | 3/14 participants dropped out. No imputation of data |
| Selective reporting (reporting bias) | High risk | Only change values were reported |
| Other bias | Unclear risk | We did not find any indications of other sources of bias |
| Methods | RCT, Sweden | |
| Participants | 131 healthcare workers who scored above the 75th percentile on the exhaustion dimension of the Oldenburg Burnout Inventory | |
| Interventions | 1) Experimental: Reflecting peer‐support group: 10 2‐hour weekly sessions where participants discussed and reflected with colleagues about work‐related stress and burnout, provided mutual support for each other, compared experiences and set individual goals to find out alternative ways to handle perceived stressful situations. The sessions started with a short 10‐minute guided relaxation. | |
| Outcomes | The General Nordic Questionnaire for Psychological and Social Factors at Work (QPS Nordic), Oldenburg Burnout Inventory, The Hospital Anxiety and Depression Scale, The Short Form Health Survey (SF‐36) | |
| Notes | ||
| Risk of bias | ||
| Bias | Authors' judgement | Support for judgement |
| Random sequence generation (selection bias) | Low risk | "The randomization procedure was performed by a statistician using the Statistical Analysis Software, version 8.2." (p. 508) |
| Allocation concealment (selection bias) | Unclear risk | Not reported |
| Blinding (performance bias and detection bias) | High risk | Not possible, self report |
| Incomplete outcome data (attrition bias) | High risk | Altogether 27% of participants dropped out during follow‐up and the reasons for the control group participants leaving were not known |
| Selective reporting (reporting bias) | Low risk | All outcomes reported |
| Other bias | Unclear risk | We did not find any indications of other sources of bias |
| Methods | Cluster‐randomised trial, UK | |
| Participants | 98 care staff in residential nursing homes | |
| Interventions | 1) Experimental: Developing knowledge and skills and individual programme planning: 7 hour‐long seminars over a period of 6 months about the theoretical basis of organic and functional disorders experienced in old age and approaches to care and activities in residential settings. The second part of the training schedule consisted of weekly visits to intervention homes by an experienced psychiatric nurse who trained staff in behavioural management of residents by developing individual care programmes for them. | |
| Outcomes | The Occupational Stress Indicator, GHQ | |
| Notes | Measurements were completed at baseline and immediately following the 6‐month intervention. We accounted for the design effect (participants randomised in clusters but analysed as individuals) by dividing the number of participants by the calculated design effect of 1.143. | |
| Risk of bias | ||
| Bias | Authors' judgement | Support for judgement |
| Random sequence generation (selection bias) | Unclear risk | "Ten residential care homes and two nursing homes participated in the study and were matched into pairs according to size and accreditation status. One of each pair of homes was then randomised to one of two groups by computer." (p. 3) |
| Allocation concealment (selection bias) | Unclear risk | Not reported |
| Blinding (performance bias and detection bias) | High risk | Not possible, self report |
| Incomplete outcome data (attrition bias) | Low risk | "There was no survivor effect due to staff attrition on any of the measures completed; missing data were replaced by the last known assessment carried forward." (p. 5) |
| Selective reporting (reporting bias) | Low risk | All outcomes reported |
| Other bias | Unclear risk | We did not find any indications of other sources of bias |
| Methods | RCT, Belgium and France | |
| Participants | 72 oncology nurses | |
| Interventions | 1) Experimental: a 24‐h Psychological Training Program: 8 3‐hour sessions weekly in groups of 6 participants about issues related to patient care, healthcare professionals' problems and family care. Each session began with a case presentation (75 mins) and was followed by a role‐playing exercise with videotaped feedback (75 mins). The role‐playing exercises were themed: information during the diagnostic phase, pain control, support during chemotherapy, euthanasia request, healthcare professional‐family collusion and family problems. The last session included a presentation of theoretical information and and assessment of the programme. | |
| Outcomes | The Nursing Stress Scale | |
| Notes | ||
| Risk of bias | ||
| Bias | Authors' judgement | Support for judgement |
| Random sequence generation (selection bias) | Unclear risk | "A randomised group design was used in which nurse candidates for a P.T.P [psychological training program] were allocated to a P.T.P. group or to a 4‐month waiting list group. Subjects were randomised separately in the different institutions in order to allocate 6 subjects to the training program and 6 subjects to the waiting list in each consecutive group of 12 eligible subjects in an institution. (p. 1858) |
| Allocation concealment (selection bias) | Low risk | "The randomised interventions were indicated by opening a sealed envelope once subjects satisfied the inclusion criteria of the study" (p. 1858) |
| Blinding (performance bias and detection bias) | High risk | Not possible, self report |
| Incomplete outcome data (attrition bias) | High risk | "After initial contact one subject was unable to continue participation in the training. Two subjects belonging to the waiting list group and one to the trained group refused to participate in the role‐playing exercise. These subjects were excluded from the data analysis." (p. 1860) |
| Selective reporting (reporting bias) | Low risk | All outcomes reported |
| Other bias | Unclear risk | We did not find any indications of other sources of bias |
| Methods | RCT, UK | |
| Participants | 42 nurses working in a low‐secure mental health unit (LSU). Inclusion criteria: working on the LSU for a minimum of 35 hours and having direct contact with service users. Exclusion criteria: having been previously trained in Psychosocial Intervention. "A total of 79 nursing staff worked on the LSU. Forty‐two (58%) volunteered to participate in the study and provided informed consent. Of the remaining 37 staff, none actively refused but eight were on sick leave, 23 were unable to be released by their managers to attend the training and six were excluded as they had previously been trained in PSI." (p. 61) "There were no significant differences at baseline between the experimental and control groups in terms of age, gender, clinical area or qualification." (p. 62) | |
| Interventions | 1) Experimental: Psychosocial intervention training (12 qualified and 10 unqualified nurses). "Nurses allocated to the experimental group attended a PSI [Psychosocial Intervention] training programme which was delivered in a meeting room within the LSU. As the learning outcomes for qualified and unqualified staff were different, they were trained on separate courses. The training programme for qualified staff consisted of 16 half‐day sessions delivered over 8 months. The content covered a broad range of PSI including cognitive behavioural approaches for managing symptoms..." " The training for unqualified staff was delivered in 8 half‐day sessions and focused on understanding symptom related behaviours, relationship formation and helping services users to cope with symptoms..." "Teaching sessions were supplemented by small group supervision..." (p. 61) 2) Control: No intervention control (9 qualified and 11 unqualified nurses) | |
| Outcomes | The MBI | |
| Notes | From reference list: Doyle 2007 ‐ check for inclusion | |
| Risk of bias | ||
| Bias | Authors' judgement | Support for judgement |
| Random sequence generation (selection bias) | Unclear risk | "A randomized controlled design was adopted with nurses who volunteered to participate being allocated to either the experimental PSI training group or a waiting list control group." (p. 60) |
| Allocation concealment (selection bias) | Unclear risk | Not reported if group allocation was concealed |
| Blinding (performance bias and detection bias) | High risk | Participants could not be blinded regarding group allocation. Also as outcome measurement was by self report, there was no blinding |
| Incomplete outcome data (attrition bias) | Low risk | Apparently no participants were lost to follow‐up |
| Selective reporting (reporting bias) | Low risk | The authors report all results for outcome measures listed in the Methods section |
| Other bias | Unclear risk | We did not find any indications of other sources of bias |
| Methods | RCT, UK | |
| Participants | 62 health service workers | |
| Interventions | 1) Experimental: Stress Management Training (SMT): 6 weekly 2‐hour sessions of didactic learning, practice of techniques, group exercises and discussion. Topics covered were: nature, signs, causes and symptoms of stress, progressive muscular relaxation, relationship difficulties at home and work, assertiveness techniques, cognitive appraisal and reappraisal, time‐management and goal‐setting skills and emotions and seeking social support. | |
| Outcomes | General Health Questionnaire (GHQ‐12) used to obtain a score labelled psychological distress | |
| Notes | ||
| Risk of bias | ||
| Bias | Authors' judgement | Support for judgement |
| Random sequence generation (selection bias) | Unclear risk | "The main features of the overall study design include random allocation of groups to receive SMT either immediately or after a waiting period." (p. 329) |
| Allocation concealment (selection bias) | Unclear risk | Not reported |
| Blinding (performance bias and detection bias) | High risk | Not possible, self report |
| Incomplete outcome data (attrition bias) | High risk | Only the data for those participants (62/92) who had completed the full set of assessment questionnaires were used in the analyses |
| Selective reporting (reporting bias) | Low risk | All outcomes reported |
| Other bias | Unclear risk | We did not find any indications of other sources of bias |
| Methods | Controlled before‐and‐after study, USA | |
| Participants | ICU nurses, Experimental n = 27 (out of 70) Control n = 11 (out of 65), age, experience, gender not reported | |
| Interventions | 1) Experimental: Introduction of tele‐medicine: remote access to more patients by 1 physician and 1 nurse tele‐ICU, 11 week experiment 2) Control: no intervention | |
| Outcomes | Safety attitudes Questionnaire contains questions about burn out such as 'I feel burnout by my work' | |
| Notes | ||
| Risk of bias | ||
| Bias | Authors' judgement | Support for judgement |
| Random sequence generation (selection bias) | High risk | Not randomised |
| Allocation concealment (selection bias) | High risk | No allocation concealment |
| Blinding (performance bias and detection bias) | High risk | No blinding of providers or participants; outcome self‐reported |
| Incomplete outcome data (attrition bias) | Unclear risk | Small number of all staff participated in questionnaires |
| Selective reporting (reporting bias) | Unclear risk | All outcomes that were in the Methods section are reported |
| Other bias | Unclear risk | We did not find any indications of other sources of bias |
| Methods | RCT, USA | |
| Participants | 108 healthcare professionals (42 nurses, 24 hospital/clinical staff, 10 physicians/surgeons, 15 administrators, 9 psychologists/counselors/social workers and 8 health educators) | |
| Interventions | 1) Experimental 1: Stress management/adaptive coping training: 6 weekly 90‐minute sessions. Purpose of sessions was to develop problem‐focused strategies when addressing problems that generally have solutions and emotion‐focused strategies when solutions are not available. Participants practised employing these strategies in small groups (6 ‐ 8 people) on real‐life problems faced recently in the work environment. | |
| Outcomes | MBI, Stress Assessment Inventory, State‐Trait Anxiety Inventory | |
| Notes | ||
| Risk of bias | ||
| Bias | Authors' judgement | Support for judgement |
| Random sequence generation (selection bias) | Unclear risk | "Of those willing, approximately 40% (N=126) were randomly selected and assigned to 3 groups..." (p. 606) |
| Allocation concealment (selection bias) | Unclear risk | Not reported |
| Blinding (performance bias and detection bias) | High risk | Not possible, self report |
| Incomplete outcome data (attrition bias) | High risk | No imputation used or last observation carried forward |
| Selective reporting (reporting bias) | Low risk | Only MBI measured and reported at each follow‐up point but the author explained when contacted that this was always the plan. |
| Other bias | Unclear risk | We did not find any indications of other sources of bias |
| Methods | RCT with individual participants, Portugal | |
| Participants | Physiotherapists scoring more than 26 on Emotional Exhaustion subscale of MBI out of 106 screened with MBI, and not familiar with Qigong; Experimental n = 8 Control n = 8 | |
| Interventions | 1) Experimental: Qigong exercise: posture, breathing and mind focus; classes 20 min/day 1 week; self treatment 2X / day 2 weeks, total 3 weeks 2) Control: Waiting list for 3 weeks; after that they got the treatment as well | |
| Outcomes | MBI | |
| Notes | ||
| Risk of bias | ||
| Bias | Authors' judgement | Support for judgement |
| Random sequence generation (selection bias) | Unclear risk | "the design was a prospective randomized controlled study" |
| Allocation concealment (selection bias) | Unclear risk | "the design was a prospective randomized controlled study" |
| Blinding (performance bias and detection bias) | High risk | Providers and participants not blinded; outcome self‐reported |
| Incomplete outcome data (attrition bias) | Unclear risk | Outcomes for all participants reported |
| Selective reporting (reporting bias) | Unclear risk | Baseline data not reported for the RCT group only |
| Other bias | Unclear risk | We did not find any indications of other sources of bias |
| Methods | RCT with individual participants, USA | |
| Participants | Resident surgeons in various specialties, Experimental n = ? Control n = ?, n = 35 total | |
| Interventions | 1) Experimental: Reading about challenges that seniors had faced as part of the training programme 2) Control: Reading about ethical issues that seniors had faced | |
| Outcomes | Burn‐out | |
| Notes | Author did not respond to inquiries | |
| Risk of bias | ||
| Bias | Authors' judgement | Support for judgement |
| Random sequence generation (selection bias) | Unclear risk | "We utilized a randomized, controlled trial.." |
| Allocation concealment (selection bias) | Unclear risk | Not reported |
| Blinding (performance bias and detection bias) | Unclear risk | Not reported |
| Incomplete outcome data (attrition bias) | Unclear risk | Not reported |
| Selective reporting (reporting bias) | Unclear risk | Not clear if these were all outcomes |
| Other bias | Unclear risk | Abstract only with information missing; authors have not replied to inquiries |
| Methods | Cluster‐randomised trial, Netherlands | |
| Participants | 300 professional caregivers in homes for elderly persons | |
| Interventions | 1) Experimental: Emotion‐oriented care training, clinical lessons and supervision meetings: 1‐hour clinical lesson, 6‐day training programme with 4 days at a 2‐week interval and last 2 days at a 4‐week interval. The participants were taught about the dementia syndrome and various care models for communicating with elderly people with dementia (e.g. reality orientation, validation and reminiscence), inequality of the resident‐caregiver relation, understanding the residents' perception of the environment and the attitude and (non‐)verbal communication of staff towards the resident. Intervention homes also received 3 half‐day supervision meetings to support the implementation of emotion‐oriented care. | |
| Outcomes | MBI, Job satisfaction | |
| Notes | ||
| Risk of bias | ||
| Bias | Authors' judgement | Support for judgement |
| Random sequence generation (selection bias) | Unclear risk | "Randomization was performed on the level of homes. ...within each pair, one home was randomly assigned to the intervention or control group, and the home was assigned to the alternate state." (p. S51) |
| Allocation concealment (selection bias) | Unclear risk | Not reported |
| Blinding (performance bias and detection bias) | High risk | Not possible, self report |
| Incomplete outcome data (attrition bias) | Low risk | "Missing values on items that were part of a scale or subscale were replaced according to the "mean value of valid subtests" principle (i.e. replacement by the mean value calculated from the valid item scores of the [sub‐] scale obtained for the same subject at the same time point). This replacement strategy was only used if less than 25% of the items of a scale or subscale had missing values." (p. S52) |
| Selective reporting (reporting bias) | Low risk | All outcomes reported |
| Other bias | Unclear risk | We did not find any indications of other sources of bias |
| Methods | RCT, USA | |
| Participants | 38 healthcare professionals including physicians, nurses, social workers, physical therapists and psychologists | |
| Interventions | 1) Experimental: Mindfulness‐Based Stress Reduction programme: 8 weekly 2‐hour training sessions about employing the techniques involved in sitting meditation, body scan, hatha yoga, 3‐minute breathing space (a "minimeditation") and a "loving kindness" meditation. | |
| Outcomes | MBI, Perceived Stress Scale, Brief Symptom Inventory | |
| Notes | ||
| Risk of bias | ||
| Bias | Authors' judgement | Support for judgement |
| Random sequence generation (selection bias) | Unclear risk | "Participants were randomly assigned to an 8‐week MBSR group or a wait‐list control group." (p. 167) |
| Allocation concealment (selection bias) | Unclear risk | Not reported |
| Blinding (performance bias and detection bias) | Unclear risk | Not possible, self report |
| Incomplete outcome data (attrition bias) | High risk | "Owing to the pilot nature of this study and the small sample size, we did not perform intention‐to‐treat analyses but compared only those participants who did not drop out" (p. 169) |
| Selective reporting (reporting bias) | Low risk | All outcomes reported |
| Other bias | Unclear risk | We did not find any indications of other sources of bias |
| Methods | RCT, USA | |
| Participants | 40 physicians working at Mayo Clinic Rochester "Inclusion criteria were: (1) being a faculty member of the DOM and (2) being able and willing to participate. Exclusion criteria were: (1) recent (within the past 6 months) psychotic episode or (2) clinically significant acute unstable neurological, psychiatric, hepatic, renal, cardiovascular, or respiratory disease that prevented participation in the study." (p. 859) "Mean age of the participants in the active arm (46.8 ± 8.3 years) was comparable to the control arm (50.2 ± 5.7 years). Gender distribution was comparable across the two arms (55% vs 50% males in the active and control arm, respectively)." (p. 859) | |
| Interventions | 1) Experimental: Stress Management and Resiliency Training (SMART) programme (n = 20). "The study intervention was a single 90‐min session training in the SMART program. The SMART program has been adapted from Attention and Interpretation Therapy (AIT). AIT is a structured therapy developed at the Mayo Clinic to decrease stress and enhance resilience. AIT addresses two aspects of human experience, attention and interpretation." "AIT guides learners to delay judgment and pay greater attention to the novelty of the world. Complementing attention training is instruction to help participants direct their interpretations away from fixed prejudices toward a more flexible disposition while cultivating skills such as gratitude, compassion, acceptance, forgiveness, and higher meaning." " Participants were also offered an optional 30–60 min follow‐up session depending on individual needs. (p. 859) 2) Control: No intervention control (n = 20) | |
| Outcomes | Perceived Stress Scale, Smith Anxiety Scale | |
| Notes | ||
| Risk of bias | ||
| Bias | Authors' judgement | Support for judgement |
| Random sequence generation (selection bias) | Unclear risk | "After obtaining the informed consent, physicians were randomly assigned to one of two groups ‐ an active arm or a wait‐list control arm." (p. 859) |
| Allocation concealment (selection bias) | Unclear risk | The authors do not report if they concealed allocation |
| Blinding (performance bias and detection bias) | High risk | Participants could not be blinded regarding group allocation. Also as outcome measurement was by self report, there was no blinding |
| Incomplete outcome data (attrition bias) | Low risk | Apparently there were no dropouts |
| Selective reporting (reporting bias) | Low risk | The authors report all results for outcome measures listed in the Methods section. |
| Other bias | High risk | "Eight participants (all in the control arm) declined to participate after randomization and prior to filling out any assessments because of scheduling issues" (p. 860) |
| Methods | RCT, Australia | |
| Participants | 40 trained hospital nurses who complained being overstressed | |
| Interventions | 1) Experimental: Ego‐enhancement training: 1 50‐minute session and 3 20‐minute sessions 1 week apart of training in the techniques of: physical relaxation, mental calmness, disposing of "rubbish", removal of a barrier and enjoyment of a special place. | |
| Outcomes | Stress Profile | |
| Notes | ||
| Risk of bias | ||
| Bias | Authors' judgement | Support for judgement |
| Random sequence generation (selection bias) | Unclear risk | "In the first stage of the experiment the nurses were matched on their Profile scores, one member of each pair being allocated at random to either a non‐treatment control group or an experimental group experiencing four treatment sessions" (p. 318) |
| Allocation concealment (selection bias) | Unclear risk | Not reported |
| Blinding (performance bias and detection bias) | High risk | Not possible, self report |
| Incomplete outcome data (attrition bias) | Unclear risk | It is unclear if any participants dropped out |
| Selective reporting (reporting bias) | Low risk | Only 1 outcome measure used and reported |
| Other bias | Unclear risk | We did not find any indications of other sources of bias |
| Methods | RCT, Taiwan | |
| Participants | 137 nurses | |
| Interventions | 1) Experimental: Training about stress at work, relaxation, breathing, imagery and meditation: 1 90‐minute session in each of 2 weeks and 1 follow‐up session in the 5th week. Training covered: sources of stress at work, relaxation as a coping method and meditation including breathing exercise and imagery that emphasised the underlying cognitive process of meditation. | |
| Outcomes | Nurse Stress Checklist, Chinese General Health Questionnaire | |
| Notes | ||
| Risk of bias | ||
| Bias | Authors' judgement | Support for judgement |
| Random sequence generation (selection bias) | Low risk | "For each unit, a coin was thrown to select which nurse from this unit would be assigned to either the experimental or control group." (p. 56) |
| Allocation concealment (selection bias) | Unclear risk | Not reported |
| Blinding (performance bias and detection bias) | High risk | Not possible, self report |
| Incomplete outcome data (attrition bias) | Unclear risk | It is unclear if any participants dropped out |
| Selective reporting (reporting bias) | Low risk | All outcomes reported |
| Other bias | Unclear risk | We did not find any indications of other sources of bias |
| Methods | Cluster‐RCT of hospital wards, Japan | |
| Participants | Nurses (n = 434) in 24 units in 2 general hospitals ; Experimental: 11 units with 183 nurses; Control: 13 units with 218 nurses; Gender: all women; Age: Experimental: 33 yrs ± 10 yrs; Control: 32 yrs ± 9 yrs Experience: Experimental: 11 yrs ± 8 yrs; Control: 10 yrs ± 9 yrs | |
| Interventions | 1) Experimental: Participatory psychosocial work environment improvement programme with varying elements over 6 months per unit; first 3 months development, last 3 months implementation 2) Control: No intervention | |
| Outcomes | CES‐Depression, Job Content Questionnaire, Effort Reward Imbalance‐Questionnaire | |
| Notes | ||
| Risk of bias | ||
| Bias | Authors' judgement | Support for judgement |
| Random sequence generation (selection bias) | Unclear risk | Randomisation of the intervention group and the wait list control group was conducted at the unit level after stratification by hospital and department nature (outpatient/inpatient) and carried out by a person who was not involved in the intervention or evaluation |
| Allocation concealment (selection bias) | Unclear risk | See above; not reported |
| Blinding (performance bias and detection bias) | High risk | Providers and participants not blinded; outcome self‐reported |
| Incomplete outcome data (attrition bias) | Low risk | Experimental: 168/183 = 91% follow‐up; Control: 193/218 = 89% follow‐up |
| Selective reporting (reporting bias) | Low risk | No protocol but all outcomes from Methods reported |
| Other bias | Unclear risk | We did not find any indications of other sources of bias |
| Methods | Cross‐over study, Canada | |
| Participants | 14 nurses in a burn treatment unit | |
| Interventions | 1) Experimental: Cognitive‐behavioural stress management training: 3 individual 1‐hour sessions over a period of 5 ‐ 8 days with a minimum of 2 days and a maximum of 5 days between sessions. Topics covered in the 1st session were: a conceptualisation of stress, situational stressors, psychological appraisal and physiological arousal. This was followed by training in relaxation and deep breathing. In the 2nd session participants were taught cognitive strategies for reducing stress (e.g. thought stopping, attention diversion and engaging in coping self‐statements). In the 3rd session the trainer modelled the use of stress management techniques in a role‐played burn treatment situation. Participants were also given a 4‐page outline of stress management techniques to read. | |
| Outcomes | STAI | |
| Notes | ||
| Risk of bias | ||
| Bias | Authors' judgement | Support for judgement |
| Random sequence generation (selection bias) | Unclear risk | "Subjects were randomly assigned to one of two groups." (p. 115) |
| Allocation concealment (selection bias) | Unclear risk | Not reported |
| Blinding (performance bias and detection bias) | High risk | Not possible, self report |
| Incomplete outcome data (attrition bias) | Low risk | "One nurse chose not to attend the third session of stress management training, but all fourteen subjects were involved in data collection procedures throughout the forty‐three day study period." (p. 114) |
| Selective reporting (reporting bias) | Low risk | All outcomes reported |
| Other bias | Unclear risk | We did not find any indications of other sources of bias |
| Methods | RCT, USA | |
| Participants | 60 acute care hospital nurses | |
| Interventions | 1) Experimental: 4 weeks of Stress Inoculation (SI) training divided as: i) Education‐only group (Ed) weekly 30‐minute sessions of information about anxiety, stress and coping skills and practice of self‐monitoring of stress producing events (n = 12) | |
| Outcomes | MBI (used frequency and intensity separately for each subscale); we used Emotional Exhaustion intensity scores. Job‐Related Tension Index, Life Satisfaction Index, STAI, Rathus Assertiveness Schedule, systolic and diastolic blood pressure | |
| Notes | Results are only presented for the group including CS (n = 24) versus education plus no‐intervention (n = 24) | |
| Risk of bias | ||
| Bias | Authors' judgement | Support for judgement |
| Random sequence generation (selection bias) | Unclear risk | "...60 registered nurses... were stratified on the basis of work shift and randomly assigned to 1 of 6 counselors and one of five treatment conditions." (p. 212) |
| Allocation concealment (selection bias) | Unclear risk | Not reported |
| Blinding (performance bias and detection bias) | High risk | Not possible, self report |
| Incomplete outcome data (attrition bias) | Low risk | "No subject attrition occurred at posttesting." (p. 213) |
| Selective reporting (reporting bias) | Low risk | All outcomes reported |
| Other bias | Unclear risk | We did not find any indications of other sources of bias |
| Methods | RCT, Japan | |
| Participants | 60 shift work nurses | |
| Interventions | 1) Experimental: Web‐based career identity training: 1 60‐minute training session that covered the definition of career identity, cognition of participants' own career identity, characteristics of nurses' career identity and career goal management and planning. | |
| Outcomes | Brief Job Stress Questionnaire | |
| Notes | ||
| Risk of bias | ||
| Bias | Authors' judgement | Support for judgement |
| Random sequence generation (selection bias) | Unclear risk | "The 60 participants were randomly allocated into the intervention and control groups by the hospital" (p. 191) |
| Allocation concealment (selection bias) | Unclear risk | Not reported |
| Blinding (performance bias and detection bias) | High risk | Not possible, self report |
| Incomplete outcome data (attrition bias) | High risk | 60 nurses were randomised to intervention and control and after 3 weeks at post‐intervention measurement only 36 (60%) remained |
| Selective reporting (reporting bias) | Low risk | All outcomes reported |
| Other bias | Unclear risk | We did not find any indications of other sources of bias |
| Methods | RCT, Iran | |
| Participants | 76 nursing students "The study population included all male and female nursing students who were studying in Isfahan Nursing and Midwifery university in 2010‐2011, in the second and third years (third, fourth, fifth and sixth semesters). 72 [sic] students were randomly assigned to two groups using the list of students studying in the second and third year in 2010‐2011 and based on the odd and even numbers." (p. 210) "The groups were heterogeneous in terms of gender..." (p. 210) | |
| Interventions | 1) Experimental: Stress management training (n = 38). "[F]irst group (n=38) trained stress management training program (8 two hours sessions, twice a week). And second group (n = 38) did not received [sic] training." (p. 210) The stress management program consisted of: information about stress, gradual muscle relaxation and its implementation with mental imagery, consequences and physical symptoms of stress, relaxation and imagery and training and diaphragm breathing practices, linking thoughts and emotions and familiarity with cognitive errors, discussion about relaxation exercises and replacement of logical thoughts and personal stress management program. 2) Control: no intervention (n = 38) | |
| Outcomes | DASS‐42: Depression, Anxiety and Stress Scale | |
| Notes | ||
| Risk of bias | ||
| Bias | Authors' judgement | Support for judgement |
| Random sequence generation (selection bias) | High risk | "...students were randomly assigned to two groups using the list of students studying in the second and third year in 2010‐2011 and based on the odd |
| Allocation concealment (selection bias) | Unclear risk | Not reported if group allocation was concealed |
| Blinding (performance bias and detection bias) | High risk | Participants could not be blinded regarding group allocation. Also as outcome measurement was by self report, there was no blinding |
| Incomplete outcome data (attrition bias) | Unclear risk | It is difficult to tell if some participants were lost to follow‐up or not as the authors give three separate numbers for the amount of participants. "This study was a parallel ‐group randomized quasi‐experimental trial...on 68 Bs nursing students.", " 72 students were randomly assigned..." and "Finally seventy‐six subjects elected among them." (p. 210) |
| Selective reporting (reporting bias) | Low risk | The study had only one outcome and its results are all reported |
| Other bias | Unclear risk | We did not find any indications of other sources of bias |
| Methods | RCT, China | |
| Participants | 65 nurse managers | |
| Interventions | 1) Experimental 1: Cognitive relaxation: participants were asked to imagine the relaxation of different muscle groups. | |
| Outcomes | C‐STAI, C‐GHQ | |
| Notes | ||
| Risk of bias | ||
| Bias | Authors' judgement | Support for judgement |
| Random sequence generation (selection bias) | Unclear risk | "Of the 65 participants, 35 were randomly assigned to the experimental condition and the remaining 30 were put to the control condition. Subsequently, the 35 subjects assigned to the experimental condition were randomly allocated to the stretch‐release relaxation (n = 17) and cognitive relaxation (n = 18) groups." (p. 256) |
| Allocation concealment (selection bias) | Unclear risk | Not reported |
| Blinding (performance bias and detection bias) | High risk | Not possible, self report |
| Incomplete outcome data (attrition bias) | Low risk | "All participants including the TC [test control] group were assessed again in a follow‐up session after 1 month." (p. 258) We assume this means that there were no dropouts |
| Selective reporting (reporting bias) | Low risk | All outcomes reported |
| Other bias | Unclear risk | We did not find any indications of other sources of bias |
4DKL: De Vierdimensionale Klachtenlijst (Four Dimensional Symptom Questionnaire ‐ 4DSQ)
BDI: Beck Depression Inventory
DP: Depersonalisation
EE: Emotional Exhaustion
EMH: e‐mental health
GHQ: General health questionnaire
ICU: intensive care unit
LSU: low‐secure unit
MBI: Maslach burnout inventory
MPSS‐R: Medical Personnel Stress Survey‐Revised
PA: Personal Accomplishment (lack of)
POMS: Profile of Mood States
RCT: randomised controlled trial
SCL‐90‐R: Symptom Checklist 90 Revised
STAI: State‐trait anxiety inventory
VAS: visual analogue scale
Characteristics of excluded studies [ordered by study ID]
| Study | Reason for exclusion |
| The study is uncontrolled. | |
| The intervention is primarily aimed at demented patients at a care home and not the staff caring for them, although the effects were measured also for the latter. | |
| The study does not employ a primary outcome measure of stress or burnout. | |
| The study is uncontrolled. | |
| The study is uncontrolled. | |
| The study does not employ a primary outcome measure of stress or burnout. | |
| The study is non‐randomised by design and the intervention is directed at persons or the person/work interface. | |
| There is no intervention aimed at preventing or treating stress or burnout. | |
| There is no intervention aimed at preventing or treating stress or burnout. | |
| The study is uncontrolled. | |
| The study is uncontrolled. | |
| The study is uncontrolled. | |
| The study is uncontrolled. | |
| The study is uncontrolled. | |
| There is no intervention aimed at preventing or treating stress or burnout. | |
| The study is uncontrolled. | |
| Participants were diagnosed with burnout. | |
| Participants were diagnosed with burnout. | |
| The participants of the study are not healthcare personnel or nursing students with clinical duties. | |
| The study is non‐randomised by design. | |
| The study is non‐randomised by design. In the first wave all participants received intervention. In the second wave half were randomised to receive a booster session. | |
| The study is uncontrolled. | |
| The study is non‐randomised by design. | |
| The study is uncontrolled. | |
| The study is non‐randomised by design. | |
| The study is non‐randomised by design and the intervention is directed at persons or the person/work interface. | |
| The study is non‐randomised by design. | |
| The study is non‐randomised by design. | |
| The study is non‐randomised by design. | |
| The participants are nursing students but do not have clinical duties. | |
| There is no intervention aimed at preventing or treating stress or burnout. | |
| The study is uncontrolled. | |
| The study is non‐randomised by design. | |
| The study is non‐randomised by design. | |
| The study is uncontrolled. | |
| The study is non‐randomised by design. The measurements in the comparison group were done a year later than in the intervention group. | |
| The study does not employ a primary outcome measure of stress or burnout. | |
| The study is uncontrolled. | |
| The study is non‐randomised by design. | |
| The study is uncontrolled. | |
| The study is non‐randomised by design and the intervention is directed at persons or the person/work interface. | |
| The study is non‐randomised by design. | |
| The study is non‐randomised by design. | |
| The study is uncontrolled. | |
| The study is uncontrolled. | |
| The participants were victims of assault and deemed not healthy as per inclusion criteria. | |
| The study is non‐randomised by design. | |
| The study is non‐randomised by design. | |
| The study is non‐randomised by design. | |
| The study is uncontrolled. | |
| The study is non‐randomised by design. | |
| The study is uncontrolled. | |
| The study is non‐randomised by design and the intervention is directed at persons or the person/work interface. | |
| The study is uncontrolled. | |
| The study does not employ a primary outcome measure of stress or burnout. | |
| The study is non‐randomised by design. | |
| The study is uncontrolled. | |
| There is no intervention aimed at preventing or treating stress or burnout. The article only presents the design of an intervention and not an assessment of its implementation. | |
| The participants are nursing students but do not have clinical duties. | |
| The study does not employ a primary outcome measure of stress or burnout. | |
| The study is non‐randomised by design. | |
| The study is uncontrolled. | |
| The study is uncontrolled. | |
| The study is non‐randomised by design. | |
| The participants are nursing students but do not have clinical duties. | |
| The study does not employ a primary outcome measure of stress or burnout. | |
| The study is uncontrolled. | |
| The study does not employ a primary outcome measure of stress or burnout. | |
| The study is non‐randomised by design. | |
| The study is non‐randomised by design. | |
| The study does not employ a primary outcome measure of stress or burnout. | |
| The study does not employ a primary outcome measure of stress or burnout. | |
| The study is uncontrolled. | |
| There is no intervention aimed at preventing or treating stress or burnout. | |
| The study is uncontrolled. | |
| The study is uncontrolled. | |
| The study is non‐randomised by design. | |
| The study is non‐randomised by design and the intervention is directed at persons or the person/work interface. | |
| The study is non‐randomised by design and the intervention is directed at persons or the person/work interface. |
Characteristics of studies awaiting assessment [ordered by study ID]
| Methods | Comparative study |
| Participants | Nurses |
| Interventions | Imagery? |
| Outcomes | MBI |
| Notes | in Persian awaiting translation |
| Methods | RCT |
| Participants | nurses |
| Interventions | CBT |
| Outcomes | |
| Notes | dissertation |
CBT: Cognitive behavioural training
MBI: Maslach burnout inventory
Characteristics of ongoing studies [ordered by study ID]
| Trial name or title | ClinicalTrials.gov Identifier: NCT01870154 |
| Methods | RCT |
| Participants | Primary care health professionals |
| Interventions | Education about burnout |
| Outcomes | MBI‐EE |
| Starting date | ? |
| Contact information | Gomez‐Gascon, Tomas |
| Notes | Spain |
| Trial name or title | DISCovery |
| Methods | Controlled before‐and‐after study |
| Participants | Health Care Workers |
| Interventions | Organisational changes |
| Outcomes | MBI among many others |
| Starting date | |
| Contact information | |
| Notes |
| Trial name or title | Direct Project |
| Methods | Controlled before‐and‐after study |
| Participants | 8 wards with nursing home staff |
| Interventions | Interventions to increase job resources and recovery opportunities and performance outcomes in nursing homes |
| Outcomes | Job‐related health, well‐being, |
| Starting date | 2010? |
| Contact information | |
| Notes | Netherlands |
EE: emotional exhaustion
MBI: Maslach burnout inventory
Data and analyses
| Outcome or subgroup title | No. of studies | No. of participants | Statistical method | Effect size |
| 1 Any Stress‐related Outcome (follow‐up up to 1 month) Show forest plot | 7 | 332 | Std. Mean Difference (IV, Random, 95% CI) | ‐0.27 [‐0.66, 0.13] |
| Analysis 1.1  Comparison 1 Cognitive‐behavioural intervention vs no Intervention (SMD), Outcome 1 Any Stress‐related Outcome (follow‐up up to 1 month). | ||||
| 1.1 Cognitive‐behavioural intervention only vs. no intervention | 4 | 248 | Std. Mean Difference (IV, Random, 95% CI) | ‐0.25 [‐0.60, 0.11] |
| 1.2 Cognitive‐behavioural intervention and relaxation vs. no intervention | 3 | 84 | Std. Mean Difference (IV, Random, 95% CI) | ‐0.45 [‐1.61, 0.70] |
| 2 Any Stress‐related Outcome (follow‐up 1 ‐ 6 months) Show forest plot | 8 | 549 | Std. Mean Difference (IV, Random, 95% CI) | ‐0.38 [‐0.59, ‐0.16] |
| Analysis 1.2 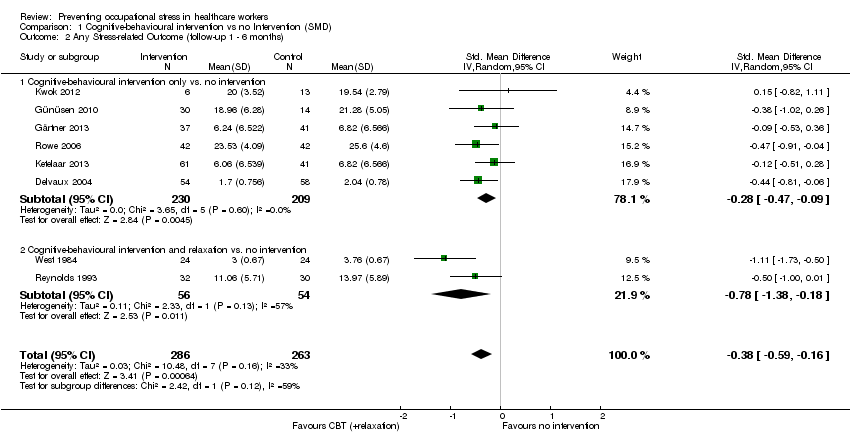 Comparison 1 Cognitive‐behavioural intervention vs no Intervention (SMD), Outcome 2 Any Stress‐related Outcome (follow‐up 1 ‐ 6 months). | ||||
| 2.1 Cognitive‐behavioural intervention only vs. no intervention | 6 | 439 | Std. Mean Difference (IV, Random, 95% CI) | ‐0.28 [‐0.47, ‐0.09] |
| 2.2 Cognitive‐behavioural intervention and relaxation vs. no intervention | 2 | 110 | Std. Mean Difference (IV, Random, 95% CI) | ‐0.78 [‐1.38, ‐0.18] |
| 3 Any Stress‐related Outcome (follow‐up more than 6 months) Show forest plot | 2 | 157 | Std. Mean Difference (IV, Fixed, 95% CI) | ‐1.04 [‐1.37, ‐0.70] |
| Analysis 1.3  Comparison 1 Cognitive‐behavioural intervention vs no Intervention (SMD), Outcome 3 Any Stress‐related Outcome (follow‐up more than 6 months). | ||||
| 3.1 Cognitive‐behavioural intervention with or without relaxation vs. no intervention | 2 | 157 | Std. Mean Difference (IV, Fixed, 95% CI) | ‐1.04 [‐1.37, ‐0.70] |
| 4 State‐Trait Anxiety Inventory (follow‐up up to 1 month) Show forest plot | 3 | Mean Difference (IV, Random, 95% CI) | Subtotals only | |
| Analysis 1.4 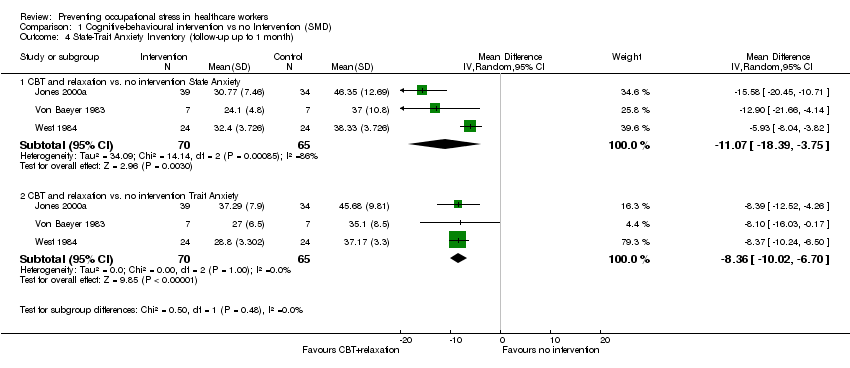 Comparison 1 Cognitive‐behavioural intervention vs no Intervention (SMD), Outcome 4 State‐Trait Anxiety Inventory (follow‐up up to 1 month). | ||||
| 4.1 CBT and relaxation vs. no intervention State Anxiety | 3 | 135 | Mean Difference (IV, Random, 95% CI) | ‐11.07 [‐18.39, ‐3.75] |
| 4.2 CBT and relaxation vs. no intervention Trait Anxiety | 3 | 135 | Mean Difference (IV, Random, 95% CI) | ‐8.36 [‐10.02, ‐6.70] |
| 5 State‐Trait Anxiety Inventory (follow‐up 1 ‐ 6 months) Show forest plot | 1 | Mean Difference (IV, Fixed, 95% CI) | Totals not selected | |
| Analysis 1.5  Comparison 1 Cognitive‐behavioural intervention vs no Intervention (SMD), Outcome 5 State‐Trait Anxiety Inventory (follow‐up 1 ‐ 6 months). | ||||
| 5.1 CBT and relaxation vs. no intervention State Anxiety | 1 | Mean Difference (IV, Fixed, 95% CI) | 0.0 [0.0, 0.0] | |
| 5.2 CBT and relaxation vs. no intervention Trait Anxiety | 1 | Mean Difference (IV, Fixed, 95% CI) | 0.0 [0.0, 0.0] | |
| 6 General Health Questionnaire (follow‐up up to 1 month) Show forest plot | 1 | Mean Difference (IV, Fixed, 95% CI) | Totals not selected | |
| Analysis 1.6  Comparison 1 Cognitive‐behavioural intervention vs no Intervention (SMD), Outcome 6 General Health Questionnaire (follow‐up up to 1 month). | ||||
| 6.1 CBT and relaxation vs. no intervention | 1 | Mean Difference (IV, Fixed, 95% CI) | 0.0 [0.0, 0.0] | |
| Outcome or subgroup title | No. of studies | No. of participants | Statistical method | Effect size |
| 1 Any stress scale (follow‐up 1 ‐ 6 months) Show forest plot | 2 | 83 | Std. Mean Difference (IV, Random, 95% CI) | ‐0.54 [‐1.16, 0.08] |
| Analysis 2.1  Comparison 2 Cognitive‐behavioural intervention vs. non‐stress management intervention (SMD), Outcome 1 Any stress scale (follow‐up 1 ‐ 6 months). | ||||
| 2 Any stress scale (follow‐up more than 6 months) Show forest plot | 1 | Std. Mean Difference (IV, Random, 95% CI) | Totals not selected | |
| Analysis 2.2 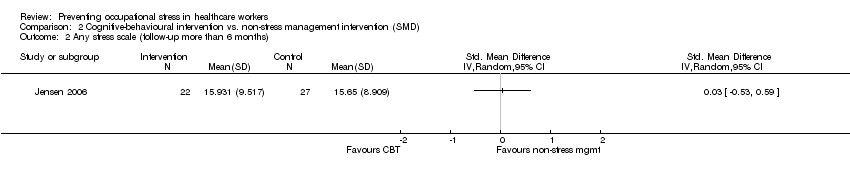 Comparison 2 Cognitive‐behavioural intervention vs. non‐stress management intervention (SMD), Outcome 2 Any stress scale (follow‐up more than 6 months). | ||||
| 3 Anxiety (follow‐up 1 ‐ 6 months) Show forest plot | 1 | Mean Difference (IV, Fixed, 95% CI) | Totals not selected | |
| Analysis 2.3  Comparison 2 Cognitive‐behavioural intervention vs. non‐stress management intervention (SMD), Outcome 3 Anxiety (follow‐up 1 ‐ 6 months). | ||||
| 3.1 CBT vs. passive support by a psychologist | 1 | Mean Difference (IV, Fixed, 95% CI) | 0.0 [0.0, 0.0] | |
| Outcome or subgroup title | No. of studies | No. of participants | Statistical method | Effect size |
| 1 Any stress outcome (follow‐up up to 1 month) Show forest plot | 4 | 97 | Std. Mean Difference (IV, Random, 95% CI) | ‐0.48 [‐0.89, ‐0.08] |
| Analysis 3.1  Comparison 3 Relaxation vs. no intervention (SMD), Outcome 1 Any stress outcome (follow‐up up to 1 month). | ||||
| 1.1 Physical relaxation (follow‐up up to 1 month) | 4 | 97 | Std. Mean Difference (IV, Random, 95% CI) | ‐0.48 [‐0.89, ‐0.08] |
| 2 Any stress outcome (follow‐up 1 ‐ 6 months) Show forest plot | 12 | 521 | Std. Mean Difference (IV, Random, 95% CI) | ‐0.49 [‐0.78, ‐0.21] |
| Analysis 3.2 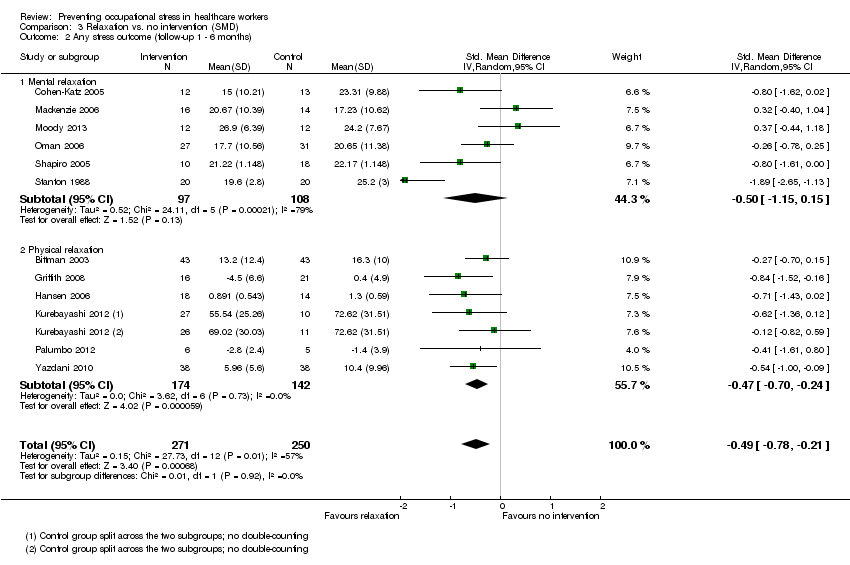 Comparison 3 Relaxation vs. no intervention (SMD), Outcome 2 Any stress outcome (follow‐up 1 ‐ 6 months). | ||||
| 2.1 Mental relaxation | 6 | 205 | Std. Mean Difference (IV, Random, 95% CI) | ‐0.50 [‐1.15, 0.15] |
| 2.2 Physical relaxation | 6 | 316 | Std. Mean Difference (IV, Random, 95% CI) | ‐0.47 [‐0.70, ‐0.24] |
| 3 Any stress outcome (follow‐up more than 6 months) Show forest plot | 1 | Std. Mean Difference (IV, Fixed, 95% CI) | Totals not selected | |
| Analysis 3.3  Comparison 3 Relaxation vs. no intervention (SMD), Outcome 3 Any stress outcome (follow‐up more than 6 months). | ||||
| 3.1 Mental relaxation | 1 | Std. Mean Difference (IV, Fixed, 95% CI) | 0.0 [0.0, 0.0] | |
| 4 State Anxiety (follow‐up 1 ‐ 6 months) Show forest plot | 1 | 66 | Mean Difference (IV, Fixed, 95% CI) | ‐7.79 [‐11.24, ‐4.34] |
| Analysis 3.4 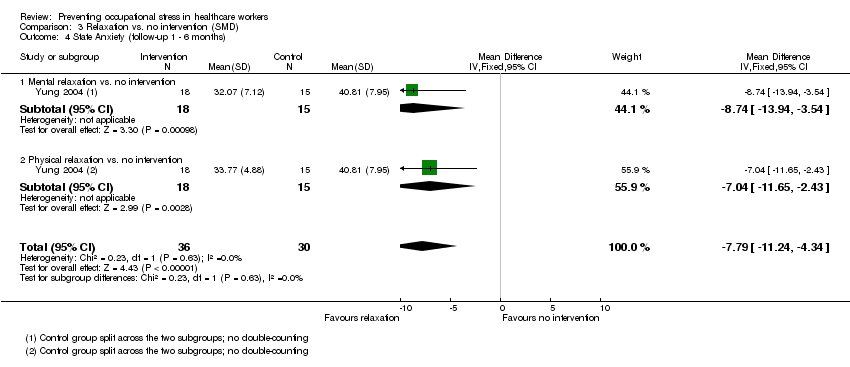 Comparison 3 Relaxation vs. no intervention (SMD), Outcome 4 State Anxiety (follow‐up 1 ‐ 6 months). | ||||
| 4.1 Mental relaxation vs. no intervention | 1 | 33 | Mean Difference (IV, Fixed, 95% CI) | ‐8.74 [‐13.94, ‐3.54] |
| 4.2 Physical relaxation vs. no intervention | 1 | 33 | Mean Difference (IV, Fixed, 95% CI) | ‐7.04 [‐11.65, ‐2.43] |
| 5 Trait Anxiety (follow‐up 1 ‐ 6 months) Show forest plot | 1 | 66 | Mean Difference (IV, Fixed, 95% CI) | ‐1.09 [‐4.53, 2.36] |
| Analysis 3.5  Comparison 3 Relaxation vs. no intervention (SMD), Outcome 5 Trait Anxiety (follow‐up 1 ‐ 6 months). | ||||
| 5.1 Mental relaxation vs. no intervention | 1 | 33 | Mean Difference (IV, Fixed, 95% CI) | ‐2.41 [‐6.93, 2.11] |
| 5.2 Physical relaxation vs. no intervention | 1 | 33 | Mean Difference (IV, Fixed, 95% CI) | 0.75 [‐4.58, 6.08] |
| 6 General Health (follow‐up 1 ‐ 6 months) Show forest plot | 2 | Mean Difference (IV, Fixed, 95% CI) | Subtotals only | |
| Analysis 3.6  Comparison 3 Relaxation vs. no intervention (SMD), Outcome 6 General Health (follow‐up 1 ‐ 6 months). | ||||
| 6.1 Mental relaxation vs. no intervention | 1 | 33 | Mean Difference (IV, Fixed, 95% CI) | ‐7.10 [‐11.39, ‐2.81] |
| 6.2 Physical relaxation vs. no intervention | 2 | 70 | Mean Difference (IV, Fixed, 95% CI) | ‐3.22 [‐6.53, 0.08] |
| Outcome or subgroup title | No. of studies | No. of participants | Statistical method | Effect size |
| 1 Any stress outcome Show forest plot | 4 | Std. Mean Difference (IV, Fixed, 95% CI) | Totals not selected | |
| Analysis 4.1  Comparison 4 Relaxation vs. other intervention (SMD), Outcome 1 Any stress outcome. | ||||
| 1.1 Mental relaxation training vs. training on theory analysis (follow‐up 1 ‐ 6 months) | 1 | Std. Mean Difference (IV, Fixed, 95% CI) | 0.0 [0.0, 0.0] | |
| 1.2 Mental relaxation vs. relaxing in a chair (follow‐up to 1 month) | 1 | Std. Mean Difference (IV, Fixed, 95% CI) | 0.0 [0.0, 0.0] | |
| 1.3 Physical relaxation vs. break (follow‐up to 1 month) | 2 | Std. Mean Difference (IV, Fixed, 95% CI) | 0.0 [0.0, 0.0] | |
| 2 Any anxiety outcome Show forest plot | 1 | Std. Mean Difference (IV, Random, 95% CI) | Totals not selected | |
| Analysis 4.2  Comparison 4 Relaxation vs. other intervention (SMD), Outcome 2 Any anxiety outcome. | ||||
| 2.1 AMMA touch therapy vs. touch therapy without intent (follow‐up to 1 month) | 1 | Std. Mean Difference (IV, Random, 95% CI) | 0.0 [0.0, 0.0] | |
| 3 General Health Questionnaire Show forest plot | 1 | Std. Mean Difference (IV, Fixed, 95% CI) | Totals not selected | |
| Analysis 4.3 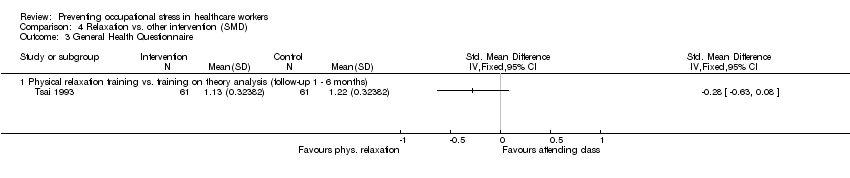 Comparison 4 Relaxation vs. other intervention (SMD), Outcome 3 General Health Questionnaire. | ||||
| 3.1 Physical relaxation training vs. training on theory analysis (follow‐up 1 ‐ 6 months) | 1 | Std. Mean Difference (IV, Fixed, 95% CI) | 0.0 [0.0, 0.0] | |
| Outcome or subgroup title | No. of studies | No. of participants | Statistical method | Effect size |
| 1 Any stress‐related outcome (follow‐up up to 1 month) Show forest plot | 3 | Std. Mean Difference (IV, Fixed, 95% CI) | Totals not selected | |
| Analysis 5.1  Comparison 5 Organisational intervention vs. no intervention (SMD), Outcome 1 Any stress‐related outcome (follow‐up up to 1 month). | ||||
| 1.1 Support | 1 | Std. Mean Difference (IV, Fixed, 95% CI) | 0.0 [0.0, 0.0] | |
| 1.2 Communication skills | 1 | Std. Mean Difference (IV, Fixed, 95% CI) | 0.0 [0.0, 0.0] | |
| 1.3 Special Care RCTs | 1 | Std. Mean Difference (IV, Fixed, 95% CI) | 0.0 [0.0, 0.0] | |
| 2 Any stress‐related outcome RCTs (follow‐up 1 ‐ 6 months) Show forest plot | 5 | Std. Mean Difference (IV, Fixed, 95% CI) | Subtotals only | |
| Analysis 5.2 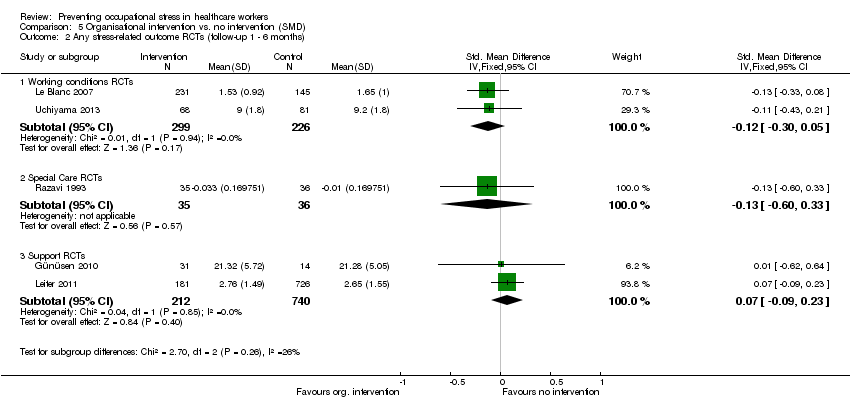 Comparison 5 Organisational intervention vs. no intervention (SMD), Outcome 2 Any stress‐related outcome RCTs (follow‐up 1 ‐ 6 months). | ||||
| 2.1 Working conditions RCTs | 2 | 525 | Std. Mean Difference (IV, Fixed, 95% CI) | ‐0.12 [‐0.30, 0.05] |
| 2.2 Special Care RCTs | 1 | 71 | Std. Mean Difference (IV, Fixed, 95% CI) | ‐0.13 [‐0.60, 0.33] |
| 2.3 Support RCTs | 2 | 952 | Std. Mean Difference (IV, Fixed, 95% CI) | 0.07 [‐0.09, 0.23] |
| 3 Any stress‐related outcome (follow‐up more than 6 months) Show forest plot | 4 | Std. Mean Difference (IV, Fixed, 95% CI) | Totals not selected | |
| Analysis 5.3 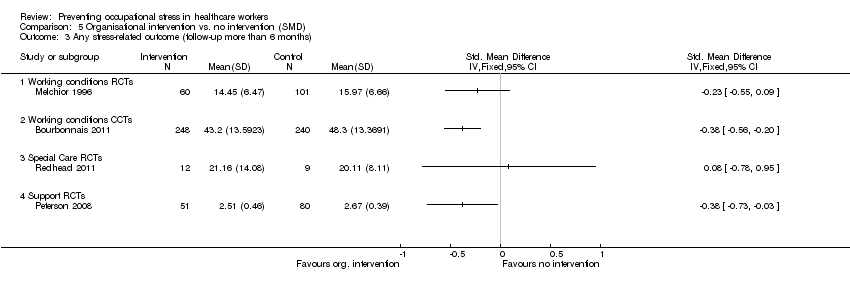 Comparison 5 Organisational intervention vs. no intervention (SMD), Outcome 3 Any stress‐related outcome (follow‐up more than 6 months). | ||||
| 3.1 Working conditions RCTs | 1 | Std. Mean Difference (IV, Fixed, 95% CI) | 0.0 [0.0, 0.0] | |
| 3.2 Working conditions CCTs | 1 | Std. Mean Difference (IV, Fixed, 95% CI) | 0.0 [0.0, 0.0] | |
| 3.3 Special Care RCTs | 1 | Std. Mean Difference (IV, Fixed, 95% CI) | 0.0 [0.0, 0.0] | |
| 3.4 Support RCTs | 1 | Std. Mean Difference (IV, Fixed, 95% CI) | 0.0 [0.0, 0.0] | |
| 4 General Health Questionnaire total score (follow‐up more than 6 months) Show forest plot | 1 | Mean Difference (IV, Fixed, 95% CI) | Totals not selected | |
| Analysis 5.4  Comparison 5 Organisational intervention vs. no intervention (SMD), Outcome 4 General Health Questionnaire total score (follow‐up more than 6 months). | ||||
| Outcome or subgroup title | No. of studies | No. of participants | Statistical method | Effect size |
| 1 Any stress‐related outcome (follow‐up up to 1 month) Show forest plot | 1 | Std. Mean Difference (IV, Fixed, 95% CI) | Totals not selected | |
| Analysis 6.1  Comparison 6 Organisational intervention vs. other intervention (SMD), Outcome 1 Any stress‐related outcome (follow‐up up to 1 month). | ||||
| 1.1 Special care vs. usual training and support RCTs | 1 | Std. Mean Difference (IV, Fixed, 95% CI) | 0.0 [0.0, 0.0] | |
| 2 Any stress‐related outcome (follow‐up 1 ‐ 6 months) Show forest plot | 1 | Std. Mean Difference (IV, Fixed, 95% CI) | Totals not selected | |
| Analysis 6.2 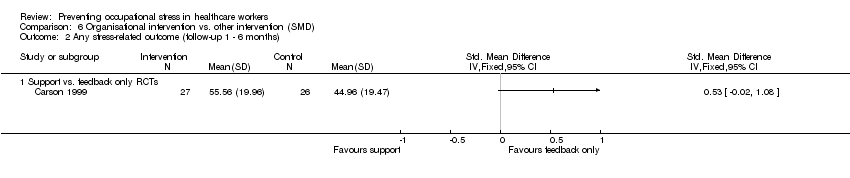 Comparison 6 Organisational intervention vs. other intervention (SMD), Outcome 2 Any stress‐related outcome (follow‐up 1 ‐ 6 months). | ||||
| 2.1 Support vs. feedback only RCTs | 1 | Std. Mean Difference (IV, Fixed, 95% CI) | 0.0 [0.0, 0.0] | |
| 3 Any stress‐related outcome (follow‐up more than 6 months) Show forest plot | 2 | Std. Mean Difference (IV, Fixed, 95% CI) | Subtotals only | |
| Analysis 6.3  Comparison 6 Organisational intervention vs. other intervention (SMD), Outcome 3 Any stress‐related outcome (follow‐up more than 6 months). | ||||
| 3.1 Shorter vs longer working schedules RCTs | 2 | 180 | Std. Mean Difference (IV, Fixed, 95% CI) | ‐0.55 [‐0.84, ‐0.25] |
| 4 General Health Questionnaire (total score) Show forest plot | 2 | Mean Difference (IV, Fixed, 95% CI) | Totals not selected | |
| Analysis 6.4 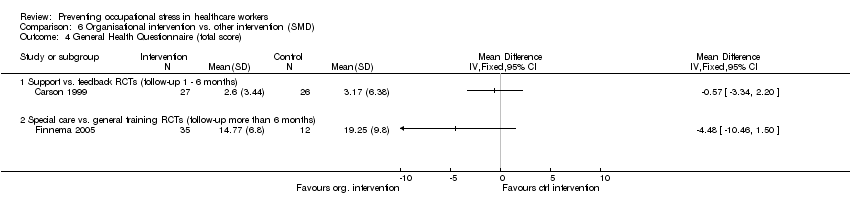 Comparison 6 Organisational intervention vs. other intervention (SMD), Outcome 4 General Health Questionnaire (total score). | ||||
| 4.1 Support vs. feedback RCTs (follow‐up 1 ‐ 6 months) | 1 | Mean Difference (IV, Fixed, 95% CI) | 0.0 [0.0, 0.0] | |
| 4.2 Special care vs. general training RCTs (follow‐up more than 6 months) | 1 | Mean Difference (IV, Fixed, 95% CI) | 0.0 [0.0, 0.0] | |
| Outcome or subgroup title | No. of studies | No. of participants | Statistical method | Effect size |
| 1 Maslach Burnout Inventory (follow‐up up to 1 month) Show forest plot | 2 | Mean Difference (IV, Fixed, 95% CI) | Subtotals only | |
| Analysis 7.1 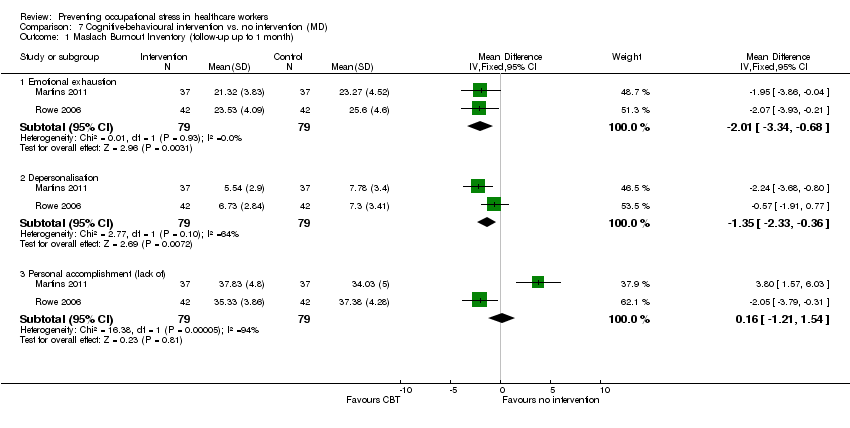 Comparison 7 Cognitive‐behavioural intervention vs. no intervention (MD), Outcome 1 Maslach Burnout Inventory (follow‐up up to 1 month). | ||||
| 1.1 Emotional exhaustion | 2 | 158 | Mean Difference (IV, Fixed, 95% CI) | ‐2.01 [‐3.34, ‐0.68] |
| 1.2 Depersonalisation | 2 | 158 | Mean Difference (IV, Fixed, 95% CI) | ‐1.35 [‐2.33, ‐0.36] |
| 1.3 Personal accomplishment (lack of) | 2 | 158 | Mean Difference (IV, Fixed, 95% CI) | 0.16 [‐1.21, 1.54] |
| 2 Maslach Burnout Inventory (follow‐up 1 to 6 months) Show forest plot | 2 | Mean Difference (IV, Fixed, 95% CI) | Subtotals only | |
| Analysis 7.2 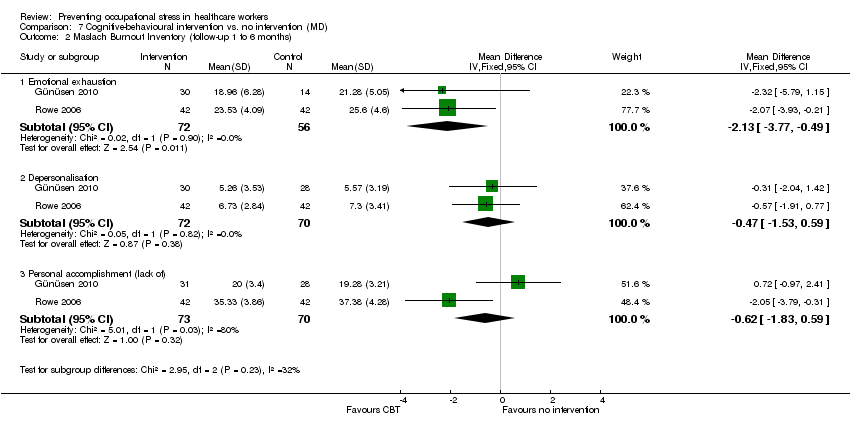 Comparison 7 Cognitive‐behavioural intervention vs. no intervention (MD), Outcome 2 Maslach Burnout Inventory (follow‐up 1 to 6 months). | ||||
| 2.1 Emotional exhaustion | 2 | 128 | Mean Difference (IV, Fixed, 95% CI) | ‐2.13 [‐3.77, ‐0.49] |
| 2.2 Depersonalisation | 2 | 142 | Mean Difference (IV, Fixed, 95% CI) | ‐0.47 [‐1.53, 0.59] |
| 2.3 Personal accomplishment (lack of) | 2 | 143 | Mean Difference (IV, Fixed, 95% CI) | ‐0.62 [‐1.83, 0.59] |
| Outcome or subgroup title | No. of studies | No. of participants | Statistical method | Effect size |
| 1 Maslach Burnout Inventory (follow‐up up to 1 month) Show forest plot | 2 | Mean Difference (IV, Fixed, 95% CI) | Totals not selected | |
| Analysis 8.1 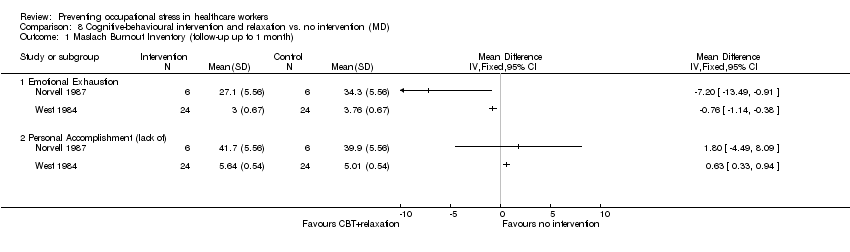 Comparison 8 Cognitive‐behavioural intervention and relaxation vs. no intervention (MD), Outcome 1 Maslach Burnout Inventory (follow‐up up to 1 month). | ||||
| 1.1 Emotional Exhaustion | 2 | Mean Difference (IV, Fixed, 95% CI) | 0.0 [0.0, 0.0] | |
| 1.2 Personal Accomplishment (lack of) | 2 | Mean Difference (IV, Fixed, 95% CI) | 0.0 [0.0, 0.0] | |
| Outcome or subgroup title | No. of studies | No. of participants | Statistical method | Effect size |
| 1 Maslach Burnout Inventory (follow‐up more than 6 months) Show forest plot | 1 | Mean Difference (IV, Fixed, 95% CI) | Totals not selected | |
| Analysis 9.1  Comparison 9 Cognitive‐behavioural intervention vs. other intervention (MD), Outcome 1 Maslach Burnout Inventory (follow‐up more than 6 months). | ||||
| 1.1 Emotional Exhaustion | 1 | Mean Difference (IV, Fixed, 95% CI) | 0.0 [0.0, 0.0] | |
| 1.2 Depersonalisation | 1 | Mean Difference (IV, Fixed, 95% CI) | 0.0 [0.0, 0.0] | |
| 1.3 Personal Accomplishment (lack of) | 1 | Mean Difference (IV, Fixed, 95% CI) | 0.0 [0.0, 0.0] | |
| Outcome or subgroup title | No. of studies | No. of participants | Statistical method | Effect size |
| 1 Maslach Burnout Inventory (follow‐up 1 ‐ 6 months) Show forest plot | 4 | Mean Difference (IV, Random, 95% CI) | Subtotals only | |
| Analysis 10.1 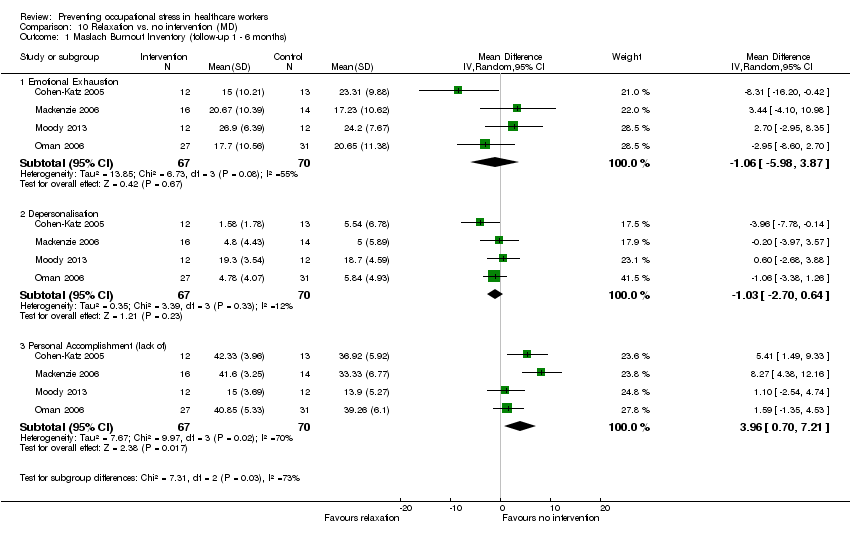 Comparison 10 Relaxation vs. no intervention (MD), Outcome 1 Maslach Burnout Inventory (follow‐up 1 ‐ 6 months). | ||||
| 1.1 Emotional Exhaustion | 4 | 137 | Mean Difference (IV, Random, 95% CI) | ‐1.06 [‐5.98, 3.87] |
| 1.2 Depersonalisation | 4 | 137 | Mean Difference (IV, Random, 95% CI) | ‐1.03 [‐2.70, 0.64] |
| 1.3 Personal Accomplishment (lack of) | 4 | 137 | Mean Difference (IV, Random, 95% CI) | 3.96 [0.70, 7.21] |
| Outcome or subgroup title | No. of studies | No. of participants | Statistical method | Effect size |
| 1 Maslach Burnout Inventory (follow‐up less than 1 month) Show forest plot | 1 | Std. Mean Difference (IV, Fixed, 95% CI) | Totals not selected | |
| Analysis 11.1  Comparison 11 Organisational intervention vs. no intervention (MD), Outcome 1 Maslach Burnout Inventory (follow‐up less than 1 month). | ||||
| 1.1 Emotional exhaustion | 1 | Std. Mean Difference (IV, Fixed, 95% CI) | 0.0 [0.0, 0.0] | |
| 1.2 Depersonalisation/ Disengagement | 1 | Std. Mean Difference (IV, Fixed, 95% CI) | 0.0 [0.0, 0.0] | |
| 1.3 Personal Accomplishment (lack of) | 1 | Std. Mean Difference (IV, Fixed, 95% CI) | 0.0 [0.0, 0.0] | |
| 2 Maslach Burnout Inventory (follow‐up 1 ‐ 6 months) Show forest plot | 2 | Std. Mean Difference (IV, Fixed, 95% CI) | Totals not selected | |
| Analysis 11.2  Comparison 11 Organisational intervention vs. no intervention (MD), Outcome 2 Maslach Burnout Inventory (follow‐up 1 ‐ 6 months). | ||||
| 2.1 Emotional exhaustion | 2 | Std. Mean Difference (IV, Fixed, 95% CI) | 0.0 [0.0, 0.0] | |
| 2.2 Depersonalisation | 2 | Std. Mean Difference (IV, Fixed, 95% CI) | 0.0 [0.0, 0.0] | |
| 3 Maslach Burnout Inventory or Oldenburg Burnout Inventory (follow‐up more than 6 months) Show forest plot | 3 | Std. Mean Difference (IV, Fixed, 95% CI) | Subtotals only | |
| Analysis 11.3 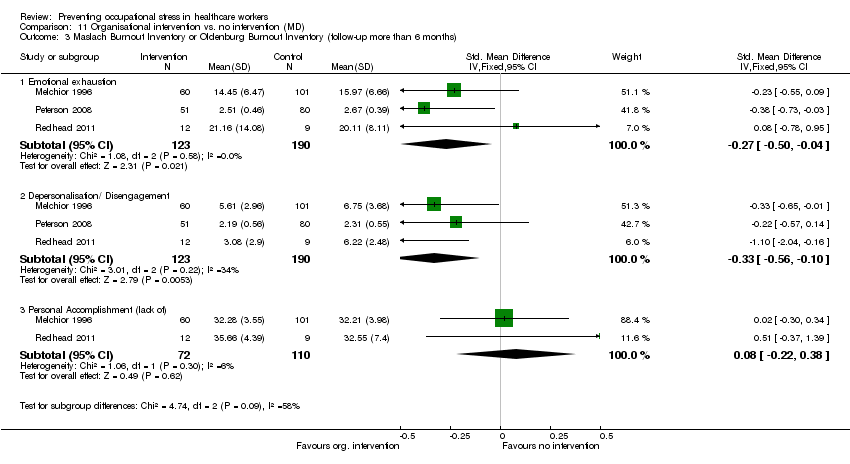 Comparison 11 Organisational intervention vs. no intervention (MD), Outcome 3 Maslach Burnout Inventory or Oldenburg Burnout Inventory (follow‐up more than 6 months). | ||||
| 3.1 Emotional exhaustion | 3 | 313 | Std. Mean Difference (IV, Fixed, 95% CI) | ‐0.27 [‐0.50, ‐0.04] |
| 3.2 Depersonalisation/ Disengagement | 3 | 313 | Std. Mean Difference (IV, Fixed, 95% CI) | ‐0.33 [‐0.56, ‐0.10] |
| 3.3 Personal Accomplishment (lack of) | 2 | 182 | Std. Mean Difference (IV, Fixed, 95% CI) | 0.08 [‐0.22, 0.38] |
| Outcome or subgroup title | No. of studies | No. of participants | Statistical method | Effect size |
| 1 Maslach Burnout Inventory (follow‐up 1 ‐ 6 months) Show forest plot | 1 | Mean Difference (IV, Fixed, 95% CI) | Totals not selected | |
| Analysis 12.1  Comparison 12 Organisational intervention vs. other intervention (MD), Outcome 1 Maslach Burnout Inventory (follow‐up 1 ‐ 6 months). | ||||
| 1.1 Emotional Exhaustion | 1 | Mean Difference (IV, Fixed, 95% CI) | 0.0 [0.0, 0.0] | |
| 1.2 Depersonalisation | 1 | Mean Difference (IV, Fixed, 95% CI) | 0.0 [0.0, 0.0] | |
| 1.3 Personal Accomplishment (lack of) | 1 | Mean Difference (IV, Fixed, 95% CI) | 0.0 [0.0, 0.0] | |
| Outcome or subgroup title | No. of studies | No. of participants | Statistical method | Effect size |
| 1 Any Stress‐related Outcome (follow‐up up to 1 month) Show forest plot | 7 | 332 | Std. Mean Difference (IV, Random, 95% CI) | ‐0.27 [‐0.66, 0.13] |
| Analysis 13.1 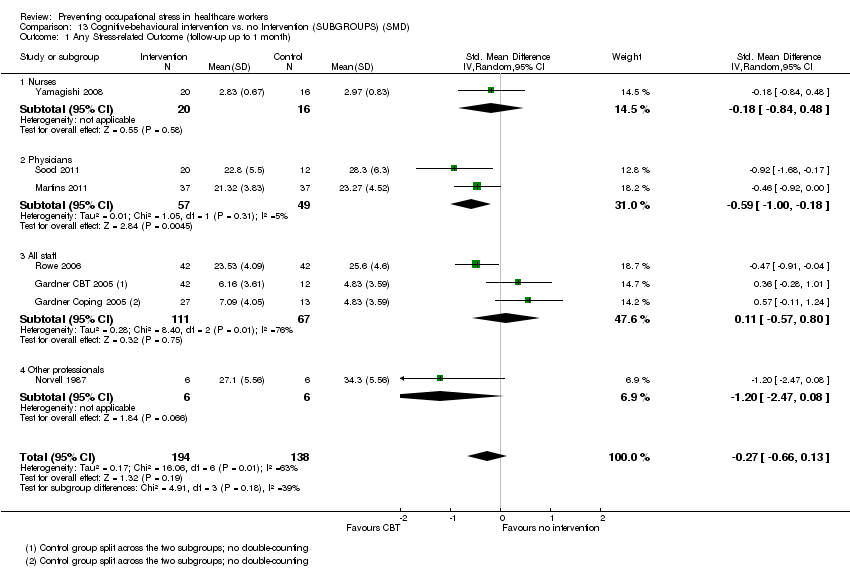 Comparison 13 Cognitive‐behavioural intervention vs. no Intervention (SUBGROUPS) (SMD), Outcome 1 Any Stress‐related Outcome (follow‐up up to 1 month). | ||||
| 1.1 Nurses | 1 | 36 | Std. Mean Difference (IV, Random, 95% CI) | ‐0.18 [‐0.84, 0.48] |
| 1.2 Physicians | 2 | 106 | Std. Mean Difference (IV, Random, 95% CI) | ‐0.59 [‐1.00, ‐0.18] |
| 1.3 All staff | 3 | 178 | Std. Mean Difference (IV, Random, 95% CI) | 0.11 [‐0.57, 0.80] |
| 1.4 Other professionals | 1 | 12 | Std. Mean Difference (IV, Random, 95% CI) | ‐1.20 [‐2.47, 0.08] |
| 2 Any Stress‐related Outcome (follow‐up 1 ‐ 6 months) Show forest plot | 8 | 549 | Std. Mean Difference (IV, Random, 95% CI) | ‐0.38 [‐0.59, ‐0.16] |
| Analysis 13.2 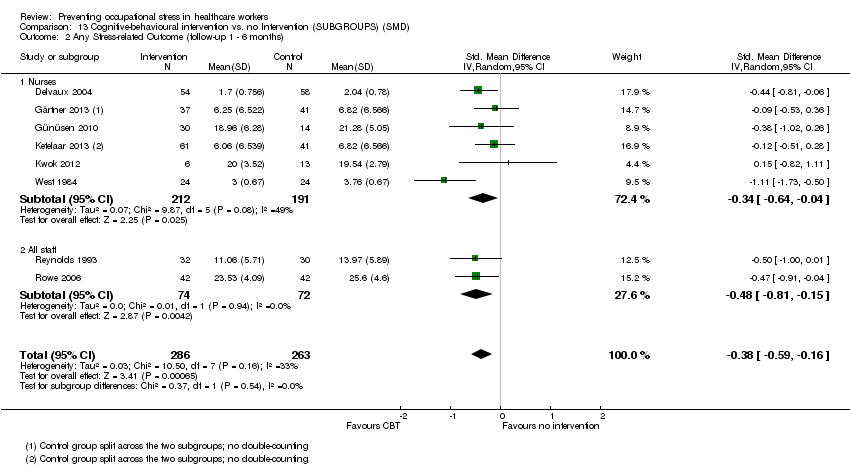 Comparison 13 Cognitive‐behavioural intervention vs. no Intervention (SUBGROUPS) (SMD), Outcome 2 Any Stress‐related Outcome (follow‐up 1 ‐ 6 months). | ||||
| 2.1 Nurses | 6 | 403 | Std. Mean Difference (IV, Random, 95% CI) | ‐0.34 [‐0.64, ‐0.04] |
| 2.2 All staff | 2 | 146 | Std. Mean Difference (IV, Random, 95% CI) | ‐0.48 [‐0.81, ‐0.15] |
| Outcome or subgroup title | No. of studies | No. of participants | Statistical method | Effect size |
| 1 Any stress outcome (follow‐up to 1 month) Show forest plot | 4 | 97 | Std. Mean Difference (IV, Fixed, 95% CI) | ‐0.48 [‐0.89, ‐0.08] |
| Analysis 14.1 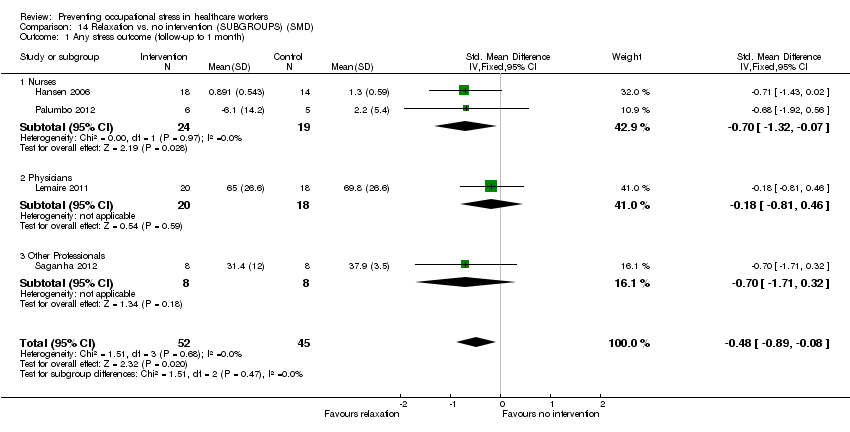 Comparison 14 Relaxation vs. no intervention (SUBGROUPS) (SMD), Outcome 1 Any stress outcome (follow‐up to 1 month). | ||||
| 1.1 Nurses | 2 | 43 | Std. Mean Difference (IV, Fixed, 95% CI) | ‐0.70 [‐1.32, ‐0.07] |
| 1.2 Physicians | 1 | 38 | Std. Mean Difference (IV, Fixed, 95% CI) | ‐0.18 [‐0.81, 0.46] |
| 1.3 Other Professionals | 1 | 16 | Std. Mean Difference (IV, Fixed, 95% CI) | ‐0.70 [‐1.71, 0.32] |
| 2 Any stress outcome (follow‐up 1 ‐ 6 months) Show forest plot | 12 | 521 | Std. Mean Difference (IV, Random, 95% CI) | ‐0.49 [‐0.78, ‐0.21] |
| Analysis 14.2 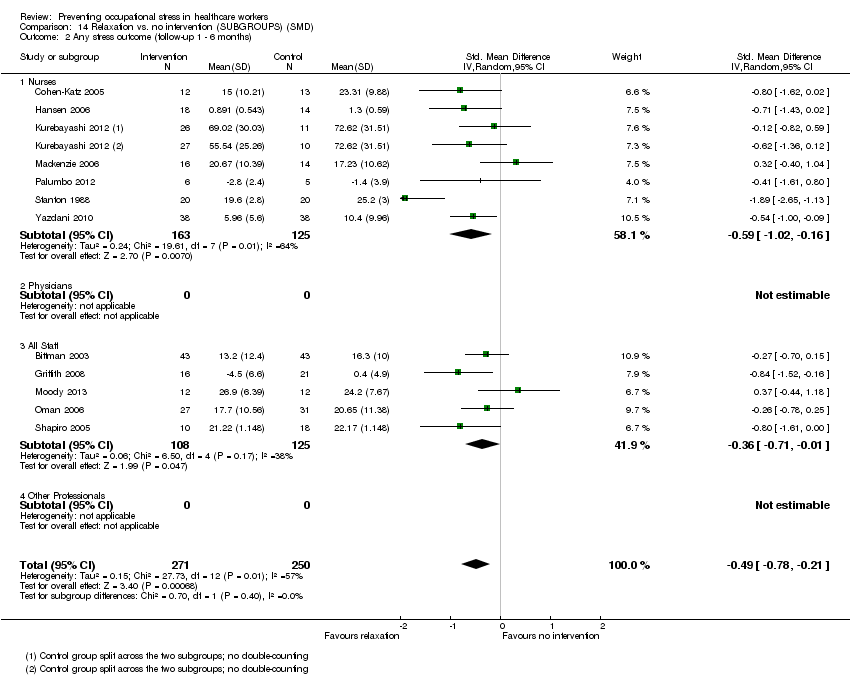 Comparison 14 Relaxation vs. no intervention (SUBGROUPS) (SMD), Outcome 2 Any stress outcome (follow‐up 1 ‐ 6 months). | ||||
| 2.1 Nurses | 7 | 288 | Std. Mean Difference (IV, Random, 95% CI) | ‐0.59 [‐1.02, ‐0.16] |
| 2.2 Physicians | 0 | 0 | Std. Mean Difference (IV, Random, 95% CI) | 0.0 [0.0, 0.0] |
| 2.3 All Staff | 5 | 233 | Std. Mean Difference (IV, Random, 95% CI) | ‐0.36 [‐0.71, ‐0.01] |
| 2.4 Other Professionals | 0 | 0 | Std. Mean Difference (IV, Random, 95% CI) | 0.0 [0.0, 0.0] |
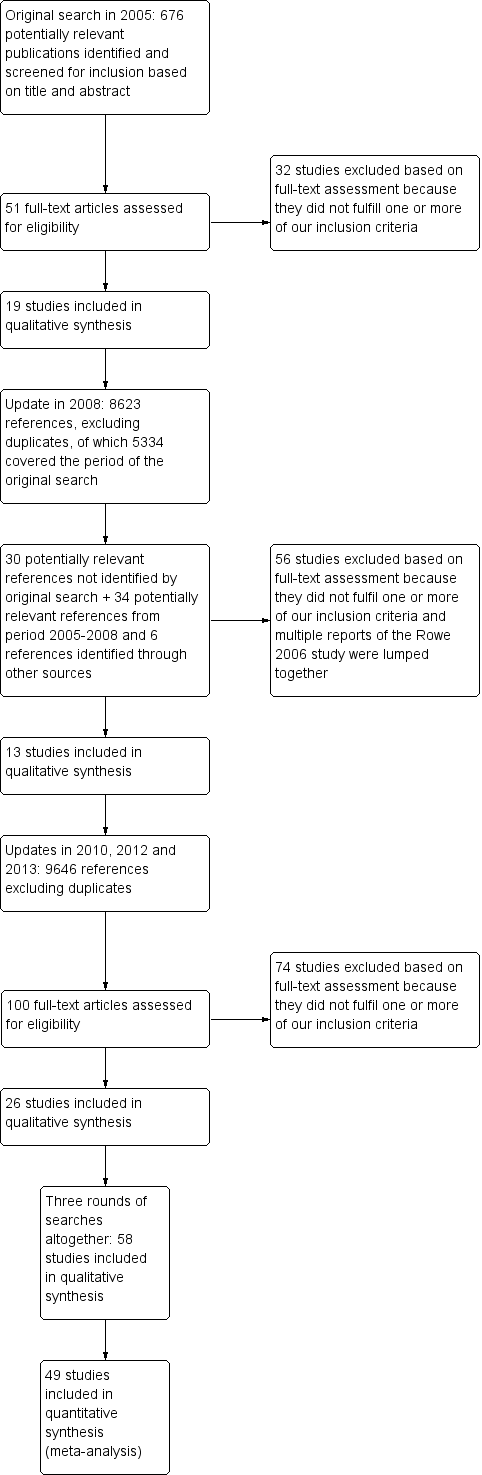
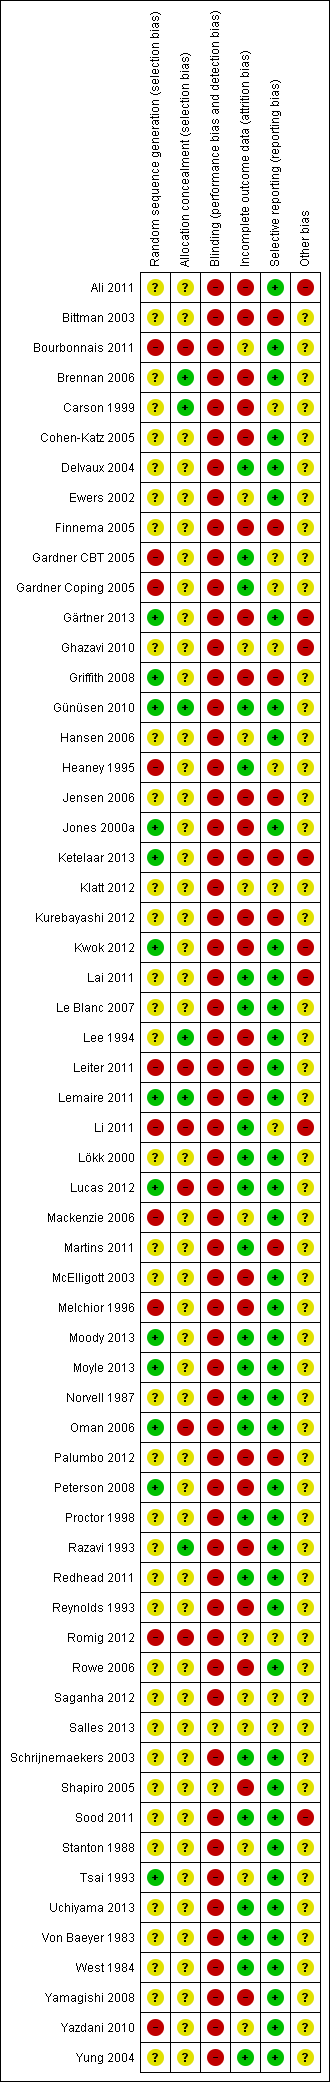
Risk of bias summary: review authors' judgements about each risk of bias item for each included study.

Funnel plot of comparison: 1 Cognitive‐behavioural intervention vs no Intervention (SMD), outcome: 1.1 Any Stress‐related Outcome (follow‐up up to 1 month).

Funnel plot of comparison: 1 Cognitive‐behavioural intervention vs no Intervention (SMD), outcome: 1.2 Any Stress‐related Outcome (follow‐up 1 ‐ 6 months).

Funnel plot of comparison: 3 Relaxation vs. no intervention (SMD), outcome: 3.2 Any stress outcome (follow‐up 1 ‐ 6 months).
Comparison 1 Cognitive‐behavioural intervention vs no Intervention (SMD), Outcome 1 Any Stress‐related Outcome (follow‐up up to 1 month).
Comparison 1 Cognitive‐behavioural intervention vs no Intervention (SMD), Outcome 2 Any Stress‐related Outcome (follow‐up 1 ‐ 6 months).
Comparison 1 Cognitive‐behavioural intervention vs no Intervention (SMD), Outcome 3 Any Stress‐related Outcome (follow‐up more than 6 months).
Comparison 1 Cognitive‐behavioural intervention vs no Intervention (SMD), Outcome 4 State‐Trait Anxiety Inventory (follow‐up up to 1 month).
Comparison 1 Cognitive‐behavioural intervention vs no Intervention (SMD), Outcome 5 State‐Trait Anxiety Inventory (follow‐up 1 ‐ 6 months).
Comparison 1 Cognitive‐behavioural intervention vs no Intervention (SMD), Outcome 6 General Health Questionnaire (follow‐up up to 1 month).
Comparison 2 Cognitive‐behavioural intervention vs. non‐stress management intervention (SMD), Outcome 1 Any stress scale (follow‐up 1 ‐ 6 months).
Comparison 2 Cognitive‐behavioural intervention vs. non‐stress management intervention (SMD), Outcome 2 Any stress scale (follow‐up more than 6 months).
Comparison 2 Cognitive‐behavioural intervention vs. non‐stress management intervention (SMD), Outcome 3 Anxiety (follow‐up 1 ‐ 6 months).
Comparison 3 Relaxation vs. no intervention (SMD), Outcome 1 Any stress outcome (follow‐up up to 1 month).
Comparison 3 Relaxation vs. no intervention (SMD), Outcome 2 Any stress outcome (follow‐up 1 ‐ 6 months).
Comparison 3 Relaxation vs. no intervention (SMD), Outcome 3 Any stress outcome (follow‐up more than 6 months).
Comparison 3 Relaxation vs. no intervention (SMD), Outcome 4 State Anxiety (follow‐up 1 ‐ 6 months).
Comparison 3 Relaxation vs. no intervention (SMD), Outcome 5 Trait Anxiety (follow‐up 1 ‐ 6 months).
Comparison 3 Relaxation vs. no intervention (SMD), Outcome 6 General Health (follow‐up 1 ‐ 6 months).
Comparison 4 Relaxation vs. other intervention (SMD), Outcome 1 Any stress outcome.
Comparison 4 Relaxation vs. other intervention (SMD), Outcome 2 Any anxiety outcome.
Comparison 4 Relaxation vs. other intervention (SMD), Outcome 3 General Health Questionnaire.
Comparison 5 Organisational intervention vs. no intervention (SMD), Outcome 1 Any stress‐related outcome (follow‐up up to 1 month).
Comparison 5 Organisational intervention vs. no intervention (SMD), Outcome 2 Any stress‐related outcome RCTs (follow‐up 1 ‐ 6 months).
Comparison 5 Organisational intervention vs. no intervention (SMD), Outcome 3 Any stress‐related outcome (follow‐up more than 6 months).
Comparison 5 Organisational intervention vs. no intervention (SMD), Outcome 4 General Health Questionnaire total score (follow‐up more than 6 months).
Comparison 6 Organisational intervention vs. other intervention (SMD), Outcome 1 Any stress‐related outcome (follow‐up up to 1 month).
Comparison 6 Organisational intervention vs. other intervention (SMD), Outcome 2 Any stress‐related outcome (follow‐up 1 ‐ 6 months).
Comparison 6 Organisational intervention vs. other intervention (SMD), Outcome 3 Any stress‐related outcome (follow‐up more than 6 months).
Comparison 6 Organisational intervention vs. other intervention (SMD), Outcome 4 General Health Questionnaire (total score).
Comparison 7 Cognitive‐behavioural intervention vs. no intervention (MD), Outcome 1 Maslach Burnout Inventory (follow‐up up to 1 month).
Comparison 7 Cognitive‐behavioural intervention vs. no intervention (MD), Outcome 2 Maslach Burnout Inventory (follow‐up 1 to 6 months).
Comparison 8 Cognitive‐behavioural intervention and relaxation vs. no intervention (MD), Outcome 1 Maslach Burnout Inventory (follow‐up up to 1 month).
Comparison 9 Cognitive‐behavioural intervention vs. other intervention (MD), Outcome 1 Maslach Burnout Inventory (follow‐up more than 6 months).
Comparison 10 Relaxation vs. no intervention (MD), Outcome 1 Maslach Burnout Inventory (follow‐up 1 ‐ 6 months).
Comparison 11 Organisational intervention vs. no intervention (MD), Outcome 1 Maslach Burnout Inventory (follow‐up less than 1 month).
Comparison 11 Organisational intervention vs. no intervention (MD), Outcome 2 Maslach Burnout Inventory (follow‐up 1 ‐ 6 months).
Comparison 11 Organisational intervention vs. no intervention (MD), Outcome 3 Maslach Burnout Inventory or Oldenburg Burnout Inventory (follow‐up more than 6 months).
Comparison 12 Organisational intervention vs. other intervention (MD), Outcome 1 Maslach Burnout Inventory (follow‐up 1 ‐ 6 months).
Comparison 13 Cognitive‐behavioural intervention vs. no Intervention (SUBGROUPS) (SMD), Outcome 1 Any Stress‐related Outcome (follow‐up up to 1 month).
Comparison 13 Cognitive‐behavioural intervention vs. no Intervention (SUBGROUPS) (SMD), Outcome 2 Any Stress‐related Outcome (follow‐up 1 ‐ 6 months).
Comparison 14 Relaxation vs. no intervention (SUBGROUPS) (SMD), Outcome 1 Any stress outcome (follow‐up to 1 month).
Comparison 14 Relaxation vs. no intervention (SUBGROUPS) (SMD), Outcome 2 Any stress outcome (follow‐up 1 ‐ 6 months).
| Cognitive‐behavioural intervention compared to no Intervention for reducing stress | ||||||
| Patient or population: Healthcare workers | ||||||
| Outcomes | Illustrative comparative risks* (95% CI) | Relative effect | No of Participants | Quality of the evidence | Comments | |
| Assumed risk | Corresponding risk | |||||
| No Intervention | Cognitive‐behavioural intervention | |||||
| Stress 1 Month | The median stress level across all control groups across all follow‐up times was 24.33 points on the Emotional Exhaustion subscale of the Maslach Burnout Inventory¹ | The mean stress level at 1 month in the intervention groups was 1.22 points lower (2.98 lower to 0.59 higher). | SMD ‐0.27 (‐0.66 to 0.13) | 332 | ⊕⊕⊝⊝ | This meta‐analysis was back transformed to the EE subscale of the MBI by using the median SD of the EE scale across control groups. |
| Stress 1 ‐ 6 months | The median stress level across all control groups across all follow‐up times was 24.33 points on the Emotional Exhaustion subscale of the Maslach Burnout Inventory¹ | The mean stress at 1 ‐ 6 months in the intervention groups was 1.83 points lower (0.77 to 2.85 lower). | SMD ‐0.38 (‐0.59 to ‐0.16) | 549 | ⊕⊕⊝⊝ low²,³ | This meta‐analysis was back transformed to the EE subscale of the MBI by using the median SD of the EE scale across control groups. |
| Stress > 6 months | The median stress level across all control groups across all follow‐up times was 24.33 points on the Emotional Exhaustion subscale of the Maslach Burnout Inventory¹ | The mean stress at more than 6 months in the intervention groups was 11.34 points lower (4.47 to 14.94 lower) | SMD ‐1.04 (‐1.37 to ‐0.70) | 157 | ⊕⊕⊝⊝ low²,³ | This meta‐analysis was back transformed to the EE subscale of the MBI by using the median SD of the EE scale across control groups. |
| *The basis for the assumed risk (e.g. the median control group risk across studies) is provided in footnotes. The corresponding risk (and its 95% confidence interval) is based on the assumed risk in the comparison group and the relative effect of the intervention (and its 95% CI). | ||||||
| GRADE Working Group grades of evidence | ||||||
| 1 This was the median from the control groups of all studies that measured the effect of CBT vs. no intervention on Emotional Exhaustion with the same scale. | ||||||
| Relaxation compared to no intervention (SMD) for | ||||||
| Patient or population: Healthcare workers | ||||||
| Outcomes | Illustrative comparative risks* (95% CI) | Relative effect | No of Participants | Quality of the evidence | Comments | |
| Assumed risk | Corresponding risk | |||||
| no intervention (SMD) | Relaxation | |||||
| Stress 1 month | The median stress level across all control groups across all follow‐up times was 22.17 points on the Emotional Exhaustion subscale of the Maslach Burnout Inventory¹ | The mean stress at 1 month in the intervention groups was 2.14 points lower (0.36 to 3.96 lower). | SMD ‐0.48 (‐0.89 to ‐0.08) | 97 | ⊕⊕⊝⊝ low | This meta‐analysis was back transformed to the EE subscale of the MBI by using the median SD of the EE scale across control groups. |
| Stress 1 ‐ 6 months | The median stress level across all control groups across all follow‐up times was 22.17 points on the Emotional Exhaustion subscale of the Maslach Burnout Inventory¹ | The mean stress at 1 ‐ 6 months in the intervention groups was 4.84 points lower (2.37 to 6.92 lower). | SMD ‐0.49 (‐0.78 to ‐0.21) | 521 | ⊕⊕⊕⊝ moderate | This meta‐analysis was back transformed to the EE subscale of the MBI by using the median SD of the EE scale across control groups. |
| Stress > 6 months | The median stress level across all control groups across all follow‐up times was 22.17 points on the Emotional Exhaustion subscale of the Maslach Burnout Inventory¹ | The mean stress at > 6 months in the intervention groups was 5.67 points lower (3.39 to 7.95 lower). | SMD ‐1.89 (‐2.65 to ‐1.13) | 40 | ⊕⊕⊝⊝ low | This result was back transformed to the EE subscale of the MBI by using the median SD of the EE scale across control groups. |
| *The basis for the assumed risk (e.g. the median control group risk across studies) is provided in footnotes. The corresponding risk (and its 95% confidence interval) is based on the assumed risk in the comparison group and the relative effect of the intervention (and its 95% CI). | ||||||
| GRADE Working Group grades of evidence | ||||||
| 1 This was the median from the control groups of all studies that measured the effect of relaxation vs. no intervention on Emotional Exhaustion with the same scale. | ||||||
| Comparison | Risk of Bias | Inconsistency | Indirectness | Imprecision | Publication Bias | Level of Evidence |
| CBT vs no intervention 1 mo follow‐up | 5 out of 6 studies high risk of bias: 1 level down | I² = 64%: no downgrading | No | 332 participants No downgrading | Yes in funnel plot: 1 level down | Low Quality |
| CBT vs no intervention 1 ‐ 6 mo follow‐up | 5 out of 8 studies high risk of bias: 1 level down | I² = 54%: no downgrading | No | 549 participants No downgrading | Yes in funnel plot: 1 level down | Low Quality |
| CBT vs no intervention > 6 months follow‐up | 2 studies high risk of bias: 1 level down | I² = 38%: no downgrading | No | 157 participants 1 level down | Not apparent | Low Quality |
| Relaxation vs no intervention 1 mo follow‐up | 3 out 4 studies high risk of bias: 1 level down | I² = 0%: no downgrading | No | 97 participants 1 level down | Not apparent | Low Quality |
| Relaxation vs no intervention 1 ‐ 6 mo follow‐up | 10 out of 13 studies high risk of bias: 1 level down | I² = 57%: no downgrading | No | 521 participants no downgrading | Not apparent | Moderate Quality |
| Relaxation vs no intervention > 6 mo follow‐up | 1 study: no downgrading | N/A | No | 40 participants 2 levels down | Not apparent | Low Quality |
| Outcome or subgroup title | No. of studies | No. of participants | Statistical method | Effect size |
| 1 Any Stress‐related Outcome (follow‐up up to 1 month) Show forest plot | 7 | 332 | Std. Mean Difference (IV, Random, 95% CI) | ‐0.27 [‐0.66, 0.13] |
| 1.1 Cognitive‐behavioural intervention only vs. no intervention | 4 | 248 | Std. Mean Difference (IV, Random, 95% CI) | ‐0.25 [‐0.60, 0.11] |
| 1.2 Cognitive‐behavioural intervention and relaxation vs. no intervention | 3 | 84 | Std. Mean Difference (IV, Random, 95% CI) | ‐0.45 [‐1.61, 0.70] |
| 2 Any Stress‐related Outcome (follow‐up 1 ‐ 6 months) Show forest plot | 8 | 549 | Std. Mean Difference (IV, Random, 95% CI) | ‐0.38 [‐0.59, ‐0.16] |
| 2.1 Cognitive‐behavioural intervention only vs. no intervention | 6 | 439 | Std. Mean Difference (IV, Random, 95% CI) | ‐0.28 [‐0.47, ‐0.09] |
| 2.2 Cognitive‐behavioural intervention and relaxation vs. no intervention | 2 | 110 | Std. Mean Difference (IV, Random, 95% CI) | ‐0.78 [‐1.38, ‐0.18] |
| 3 Any Stress‐related Outcome (follow‐up more than 6 months) Show forest plot | 2 | 157 | Std. Mean Difference (IV, Fixed, 95% CI) | ‐1.04 [‐1.37, ‐0.70] |
| 3.1 Cognitive‐behavioural intervention with or without relaxation vs. no intervention | 2 | 157 | Std. Mean Difference (IV, Fixed, 95% CI) | ‐1.04 [‐1.37, ‐0.70] |
| 4 State‐Trait Anxiety Inventory (follow‐up up to 1 month) Show forest plot | 3 | Mean Difference (IV, Random, 95% CI) | Subtotals only | |
| 4.1 CBT and relaxation vs. no intervention State Anxiety | 3 | 135 | Mean Difference (IV, Random, 95% CI) | ‐11.07 [‐18.39, ‐3.75] |
| 4.2 CBT and relaxation vs. no intervention Trait Anxiety | 3 | 135 | Mean Difference (IV, Random, 95% CI) | ‐8.36 [‐10.02, ‐6.70] |
| 5 State‐Trait Anxiety Inventory (follow‐up 1 ‐ 6 months) Show forest plot | 1 | Mean Difference (IV, Fixed, 95% CI) | Totals not selected | |
| 5.1 CBT and relaxation vs. no intervention State Anxiety | 1 | Mean Difference (IV, Fixed, 95% CI) | 0.0 [0.0, 0.0] | |
| 5.2 CBT and relaxation vs. no intervention Trait Anxiety | 1 | Mean Difference (IV, Fixed, 95% CI) | 0.0 [0.0, 0.0] | |
| 6 General Health Questionnaire (follow‐up up to 1 month) Show forest plot | 1 | Mean Difference (IV, Fixed, 95% CI) | Totals not selected | |
| 6.1 CBT and relaxation vs. no intervention | 1 | Mean Difference (IV, Fixed, 95% CI) | 0.0 [0.0, 0.0] | |
| Outcome or subgroup title | No. of studies | No. of participants | Statistical method | Effect size |
| 1 Any stress scale (follow‐up 1 ‐ 6 months) Show forest plot | 2 | 83 | Std. Mean Difference (IV, Random, 95% CI) | ‐0.54 [‐1.16, 0.08] |
| 2 Any stress scale (follow‐up more than 6 months) Show forest plot | 1 | Std. Mean Difference (IV, Random, 95% CI) | Totals not selected | |
| 3 Anxiety (follow‐up 1 ‐ 6 months) Show forest plot | 1 | Mean Difference (IV, Fixed, 95% CI) | Totals not selected | |
| 3.1 CBT vs. passive support by a psychologist | 1 | Mean Difference (IV, Fixed, 95% CI) | 0.0 [0.0, 0.0] | |
| Outcome or subgroup title | No. of studies | No. of participants | Statistical method | Effect size |
| 1 Any stress outcome (follow‐up up to 1 month) Show forest plot | 4 | 97 | Std. Mean Difference (IV, Random, 95% CI) | ‐0.48 [‐0.89, ‐0.08] |
| 1.1 Physical relaxation (follow‐up up to 1 month) | 4 | 97 | Std. Mean Difference (IV, Random, 95% CI) | ‐0.48 [‐0.89, ‐0.08] |
| 2 Any stress outcome (follow‐up 1 ‐ 6 months) Show forest plot | 12 | 521 | Std. Mean Difference (IV, Random, 95% CI) | ‐0.49 [‐0.78, ‐0.21] |
| 2.1 Mental relaxation | 6 | 205 | Std. Mean Difference (IV, Random, 95% CI) | ‐0.50 [‐1.15, 0.15] |
| 2.2 Physical relaxation | 6 | 316 | Std. Mean Difference (IV, Random, 95% CI) | ‐0.47 [‐0.70, ‐0.24] |
| 3 Any stress outcome (follow‐up more than 6 months) Show forest plot | 1 | Std. Mean Difference (IV, Fixed, 95% CI) | Totals not selected | |
| 3.1 Mental relaxation | 1 | Std. Mean Difference (IV, Fixed, 95% CI) | 0.0 [0.0, 0.0] | |
| 4 State Anxiety (follow‐up 1 ‐ 6 months) Show forest plot | 1 | 66 | Mean Difference (IV, Fixed, 95% CI) | ‐7.79 [‐11.24, ‐4.34] |
| 4.1 Mental relaxation vs. no intervention | 1 | 33 | Mean Difference (IV, Fixed, 95% CI) | ‐8.74 [‐13.94, ‐3.54] |
| 4.2 Physical relaxation vs. no intervention | 1 | 33 | Mean Difference (IV, Fixed, 95% CI) | ‐7.04 [‐11.65, ‐2.43] |
| 5 Trait Anxiety (follow‐up 1 ‐ 6 months) Show forest plot | 1 | 66 | Mean Difference (IV, Fixed, 95% CI) | ‐1.09 [‐4.53, 2.36] |
| 5.1 Mental relaxation vs. no intervention | 1 | 33 | Mean Difference (IV, Fixed, 95% CI) | ‐2.41 [‐6.93, 2.11] |
| 5.2 Physical relaxation vs. no intervention | 1 | 33 | Mean Difference (IV, Fixed, 95% CI) | 0.75 [‐4.58, 6.08] |
| 6 General Health (follow‐up 1 ‐ 6 months) Show forest plot | 2 | Mean Difference (IV, Fixed, 95% CI) | Subtotals only | |
| 6.1 Mental relaxation vs. no intervention | 1 | 33 | Mean Difference (IV, Fixed, 95% CI) | ‐7.10 [‐11.39, ‐2.81] |
| 6.2 Physical relaxation vs. no intervention | 2 | 70 | Mean Difference (IV, Fixed, 95% CI) | ‐3.22 [‐6.53, 0.08] |
| Outcome or subgroup title | No. of studies | No. of participants | Statistical method | Effect size |
| 1 Any stress outcome Show forest plot | 4 | Std. Mean Difference (IV, Fixed, 95% CI) | Totals not selected | |
| 1.1 Mental relaxation training vs. training on theory analysis (follow‐up 1 ‐ 6 months) | 1 | Std. Mean Difference (IV, Fixed, 95% CI) | 0.0 [0.0, 0.0] | |
| 1.2 Mental relaxation vs. relaxing in a chair (follow‐up to 1 month) | 1 | Std. Mean Difference (IV, Fixed, 95% CI) | 0.0 [0.0, 0.0] | |
| 1.3 Physical relaxation vs. break (follow‐up to 1 month) | 2 | Std. Mean Difference (IV, Fixed, 95% CI) | 0.0 [0.0, 0.0] | |
| 2 Any anxiety outcome Show forest plot | 1 | Std. Mean Difference (IV, Random, 95% CI) | Totals not selected | |
| 2.1 AMMA touch therapy vs. touch therapy without intent (follow‐up to 1 month) | 1 | Std. Mean Difference (IV, Random, 95% CI) | 0.0 [0.0, 0.0] | |
| 3 General Health Questionnaire Show forest plot | 1 | Std. Mean Difference (IV, Fixed, 95% CI) | Totals not selected | |
| 3.1 Physical relaxation training vs. training on theory analysis (follow‐up 1 ‐ 6 months) | 1 | Std. Mean Difference (IV, Fixed, 95% CI) | 0.0 [0.0, 0.0] | |
| Outcome or subgroup title | No. of studies | No. of participants | Statistical method | Effect size |
| 1 Any stress‐related outcome (follow‐up up to 1 month) Show forest plot | 3 | Std. Mean Difference (IV, Fixed, 95% CI) | Totals not selected | |
| 1.1 Support | 1 | Std. Mean Difference (IV, Fixed, 95% CI) | 0.0 [0.0, 0.0] | |
| 1.2 Communication skills | 1 | Std. Mean Difference (IV, Fixed, 95% CI) | 0.0 [0.0, 0.0] | |
| 1.3 Special Care RCTs | 1 | Std. Mean Difference (IV, Fixed, 95% CI) | 0.0 [0.0, 0.0] | |
| 2 Any stress‐related outcome RCTs (follow‐up 1 ‐ 6 months) Show forest plot | 5 | Std. Mean Difference (IV, Fixed, 95% CI) | Subtotals only | |
| 2.1 Working conditions RCTs | 2 | 525 | Std. Mean Difference (IV, Fixed, 95% CI) | ‐0.12 [‐0.30, 0.05] |
| 2.2 Special Care RCTs | 1 | 71 | Std. Mean Difference (IV, Fixed, 95% CI) | ‐0.13 [‐0.60, 0.33] |
| 2.3 Support RCTs | 2 | 952 | Std. Mean Difference (IV, Fixed, 95% CI) | 0.07 [‐0.09, 0.23] |
| 3 Any stress‐related outcome (follow‐up more than 6 months) Show forest plot | 4 | Std. Mean Difference (IV, Fixed, 95% CI) | Totals not selected | |
| 3.1 Working conditions RCTs | 1 | Std. Mean Difference (IV, Fixed, 95% CI) | 0.0 [0.0, 0.0] | |
| 3.2 Working conditions CCTs | 1 | Std. Mean Difference (IV, Fixed, 95% CI) | 0.0 [0.0, 0.0] | |
| 3.3 Special Care RCTs | 1 | Std. Mean Difference (IV, Fixed, 95% CI) | 0.0 [0.0, 0.0] | |
| 3.4 Support RCTs | 1 | Std. Mean Difference (IV, Fixed, 95% CI) | 0.0 [0.0, 0.0] | |
| 4 General Health Questionnaire total score (follow‐up more than 6 months) Show forest plot | 1 | Mean Difference (IV, Fixed, 95% CI) | Totals not selected | |
| Outcome or subgroup title | No. of studies | No. of participants | Statistical method | Effect size |
| 1 Any stress‐related outcome (follow‐up up to 1 month) Show forest plot | 1 | Std. Mean Difference (IV, Fixed, 95% CI) | Totals not selected | |
| 1.1 Special care vs. usual training and support RCTs | 1 | Std. Mean Difference (IV, Fixed, 95% CI) | 0.0 [0.0, 0.0] | |
| 2 Any stress‐related outcome (follow‐up 1 ‐ 6 months) Show forest plot | 1 | Std. Mean Difference (IV, Fixed, 95% CI) | Totals not selected | |
| 2.1 Support vs. feedback only RCTs | 1 | Std. Mean Difference (IV, Fixed, 95% CI) | 0.0 [0.0, 0.0] | |
| 3 Any stress‐related outcome (follow‐up more than 6 months) Show forest plot | 2 | Std. Mean Difference (IV, Fixed, 95% CI) | Subtotals only | |
| 3.1 Shorter vs longer working schedules RCTs | 2 | 180 | Std. Mean Difference (IV, Fixed, 95% CI) | ‐0.55 [‐0.84, ‐0.25] |
| 4 General Health Questionnaire (total score) Show forest plot | 2 | Mean Difference (IV, Fixed, 95% CI) | Totals not selected | |
| 4.1 Support vs. feedback RCTs (follow‐up 1 ‐ 6 months) | 1 | Mean Difference (IV, Fixed, 95% CI) | 0.0 [0.0, 0.0] | |
| 4.2 Special care vs. general training RCTs (follow‐up more than 6 months) | 1 | Mean Difference (IV, Fixed, 95% CI) | 0.0 [0.0, 0.0] | |
| Outcome or subgroup title | No. of studies | No. of participants | Statistical method | Effect size |
| 1 Maslach Burnout Inventory (follow‐up up to 1 month) Show forest plot | 2 | Mean Difference (IV, Fixed, 95% CI) | Subtotals only | |
| 1.1 Emotional exhaustion | 2 | 158 | Mean Difference (IV, Fixed, 95% CI) | ‐2.01 [‐3.34, ‐0.68] |
| 1.2 Depersonalisation | 2 | 158 | Mean Difference (IV, Fixed, 95% CI) | ‐1.35 [‐2.33, ‐0.36] |
| 1.3 Personal accomplishment (lack of) | 2 | 158 | Mean Difference (IV, Fixed, 95% CI) | 0.16 [‐1.21, 1.54] |
| 2 Maslach Burnout Inventory (follow‐up 1 to 6 months) Show forest plot | 2 | Mean Difference (IV, Fixed, 95% CI) | Subtotals only | |
| 2.1 Emotional exhaustion | 2 | 128 | Mean Difference (IV, Fixed, 95% CI) | ‐2.13 [‐3.77, ‐0.49] |
| 2.2 Depersonalisation | 2 | 142 | Mean Difference (IV, Fixed, 95% CI) | ‐0.47 [‐1.53, 0.59] |
| 2.3 Personal accomplishment (lack of) | 2 | 143 | Mean Difference (IV, Fixed, 95% CI) | ‐0.62 [‐1.83, 0.59] |
| Outcome or subgroup title | No. of studies | No. of participants | Statistical method | Effect size |
| 1 Maslach Burnout Inventory (follow‐up up to 1 month) Show forest plot | 2 | Mean Difference (IV, Fixed, 95% CI) | Totals not selected | |
| 1.1 Emotional Exhaustion | 2 | Mean Difference (IV, Fixed, 95% CI) | 0.0 [0.0, 0.0] | |
| 1.2 Personal Accomplishment (lack of) | 2 | Mean Difference (IV, Fixed, 95% CI) | 0.0 [0.0, 0.0] | |
| Outcome or subgroup title | No. of studies | No. of participants | Statistical method | Effect size |
| 1 Maslach Burnout Inventory (follow‐up more than 6 months) Show forest plot | 1 | Mean Difference (IV, Fixed, 95% CI) | Totals not selected | |
| 1.1 Emotional Exhaustion | 1 | Mean Difference (IV, Fixed, 95% CI) | 0.0 [0.0, 0.0] | |
| 1.2 Depersonalisation | 1 | Mean Difference (IV, Fixed, 95% CI) | 0.0 [0.0, 0.0] | |
| 1.3 Personal Accomplishment (lack of) | 1 | Mean Difference (IV, Fixed, 95% CI) | 0.0 [0.0, 0.0] | |
| Outcome or subgroup title | No. of studies | No. of participants | Statistical method | Effect size |
| 1 Maslach Burnout Inventory (follow‐up 1 ‐ 6 months) Show forest plot | 4 | Mean Difference (IV, Random, 95% CI) | Subtotals only | |
| 1.1 Emotional Exhaustion | 4 | 137 | Mean Difference (IV, Random, 95% CI) | ‐1.06 [‐5.98, 3.87] |
| 1.2 Depersonalisation | 4 | 137 | Mean Difference (IV, Random, 95% CI) | ‐1.03 [‐2.70, 0.64] |
| 1.3 Personal Accomplishment (lack of) | 4 | 137 | Mean Difference (IV, Random, 95% CI) | 3.96 [0.70, 7.21] |
| Outcome or subgroup title | No. of studies | No. of participants | Statistical method | Effect size |
| 1 Maslach Burnout Inventory (follow‐up less than 1 month) Show forest plot | 1 | Std. Mean Difference (IV, Fixed, 95% CI) | Totals not selected | |
| 1.1 Emotional exhaustion | 1 | Std. Mean Difference (IV, Fixed, 95% CI) | 0.0 [0.0, 0.0] | |
| 1.2 Depersonalisation/ Disengagement | 1 | Std. Mean Difference (IV, Fixed, 95% CI) | 0.0 [0.0, 0.0] | |
| 1.3 Personal Accomplishment (lack of) | 1 | Std. Mean Difference (IV, Fixed, 95% CI) | 0.0 [0.0, 0.0] | |
| 2 Maslach Burnout Inventory (follow‐up 1 ‐ 6 months) Show forest plot | 2 | Std. Mean Difference (IV, Fixed, 95% CI) | Totals not selected | |
| 2.1 Emotional exhaustion | 2 | Std. Mean Difference (IV, Fixed, 95% CI) | 0.0 [0.0, 0.0] | |
| 2.2 Depersonalisation | 2 | Std. Mean Difference (IV, Fixed, 95% CI) | 0.0 [0.0, 0.0] | |
| 3 Maslach Burnout Inventory or Oldenburg Burnout Inventory (follow‐up more than 6 months) Show forest plot | 3 | Std. Mean Difference (IV, Fixed, 95% CI) | Subtotals only | |
| 3.1 Emotional exhaustion | 3 | 313 | Std. Mean Difference (IV, Fixed, 95% CI) | ‐0.27 [‐0.50, ‐0.04] |
| 3.2 Depersonalisation/ Disengagement | 3 | 313 | Std. Mean Difference (IV, Fixed, 95% CI) | ‐0.33 [‐0.56, ‐0.10] |
| 3.3 Personal Accomplishment (lack of) | 2 | 182 | Std. Mean Difference (IV, Fixed, 95% CI) | 0.08 [‐0.22, 0.38] |
| Outcome or subgroup title | No. of studies | No. of participants | Statistical method | Effect size |
| 1 Maslach Burnout Inventory (follow‐up 1 ‐ 6 months) Show forest plot | 1 | Mean Difference (IV, Fixed, 95% CI) | Totals not selected | |
| 1.1 Emotional Exhaustion | 1 | Mean Difference (IV, Fixed, 95% CI) | 0.0 [0.0, 0.0] | |
| 1.2 Depersonalisation | 1 | Mean Difference (IV, Fixed, 95% CI) | 0.0 [0.0, 0.0] | |
| 1.3 Personal Accomplishment (lack of) | 1 | Mean Difference (IV, Fixed, 95% CI) | 0.0 [0.0, 0.0] | |
| Outcome or subgroup title | No. of studies | No. of participants | Statistical method | Effect size |
| 1 Any Stress‐related Outcome (follow‐up up to 1 month) Show forest plot | 7 | 332 | Std. Mean Difference (IV, Random, 95% CI) | ‐0.27 [‐0.66, 0.13] |
| 1.1 Nurses | 1 | 36 | Std. Mean Difference (IV, Random, 95% CI) | ‐0.18 [‐0.84, 0.48] |
| 1.2 Physicians | 2 | 106 | Std. Mean Difference (IV, Random, 95% CI) | ‐0.59 [‐1.00, ‐0.18] |
| 1.3 All staff | 3 | 178 | Std. Mean Difference (IV, Random, 95% CI) | 0.11 [‐0.57, 0.80] |
| 1.4 Other professionals | 1 | 12 | Std. Mean Difference (IV, Random, 95% CI) | ‐1.20 [‐2.47, 0.08] |
| 2 Any Stress‐related Outcome (follow‐up 1 ‐ 6 months) Show forest plot | 8 | 549 | Std. Mean Difference (IV, Random, 95% CI) | ‐0.38 [‐0.59, ‐0.16] |
| 2.1 Nurses | 6 | 403 | Std. Mean Difference (IV, Random, 95% CI) | ‐0.34 [‐0.64, ‐0.04] |
| 2.2 All staff | 2 | 146 | Std. Mean Difference (IV, Random, 95% CI) | ‐0.48 [‐0.81, ‐0.15] |
| Outcome or subgroup title | No. of studies | No. of participants | Statistical method | Effect size |
| 1 Any stress outcome (follow‐up to 1 month) Show forest plot | 4 | 97 | Std. Mean Difference (IV, Fixed, 95% CI) | ‐0.48 [‐0.89, ‐0.08] |
| 1.1 Nurses | 2 | 43 | Std. Mean Difference (IV, Fixed, 95% CI) | ‐0.70 [‐1.32, ‐0.07] |
| 1.2 Physicians | 1 | 38 | Std. Mean Difference (IV, Fixed, 95% CI) | ‐0.18 [‐0.81, 0.46] |
| 1.3 Other Professionals | 1 | 16 | Std. Mean Difference (IV, Fixed, 95% CI) | ‐0.70 [‐1.71, 0.32] |
| 2 Any stress outcome (follow‐up 1 ‐ 6 months) Show forest plot | 12 | 521 | Std. Mean Difference (IV, Random, 95% CI) | ‐0.49 [‐0.78, ‐0.21] |
| 2.1 Nurses | 7 | 288 | Std. Mean Difference (IV, Random, 95% CI) | ‐0.59 [‐1.02, ‐0.16] |
| 2.2 Physicians | 0 | 0 | Std. Mean Difference (IV, Random, 95% CI) | 0.0 [0.0, 0.0] |
| 2.3 All Staff | 5 | 233 | Std. Mean Difference (IV, Random, 95% CI) | ‐0.36 [‐0.71, ‐0.01] |
| 2.4 Other Professionals | 0 | 0 | Std. Mean Difference (IV, Random, 95% CI) | 0.0 [0.0, 0.0] |