Hidroxiurea (hidroxicarbamida) para la anemia de células falciformes
References
References to studies included in this review
References to studies excluded from this review
References to studies awaiting assessment
References to ongoing studies
Additional references
References to other published versions of this review
Characteristics of studies
Characteristics of included studies [ordered by study ID]
| Methods | Randomised, double blind (participant, investigator), placebo control, parallel assignment, efficacy study conducted at 13 centres in the USA. | |
| Participants | Children aged 9 months to 18 months with SCD (HbSS or HbSߺ‐thalassemia) irrespective of clinical severity. Exclusion criteria were transfusion within 2 months, height, weight or head circumference below the 5th percentile, mental development index less than 70 or abnormal TCD ultrasound velocity. 193 randomised, 96 participants to hydroxyurea and 97 to placebo. Mean (SD) age: hydroxyurea group : 13.6 (2.7) months, placebo group: 13.5 (2.8) months 187 (97%) with HbSS genotype, 109 (56%) females | |
| Interventions | Hydroxyurea (20 mg/kg/day) versus placebo for 24 months. | |
| Outcomes | Primary outcomes: spleen function (decline in splenic uptake); and glomerular filtration rate with 99mTc‐diethyl‐enetriaminepentaacetic acid plasma clearance. Secondary outcomes: ratio of nuclear decay counts in the spleen and liver; proportion of red blood cells containing pits or Howell‐Jolly bodies; renal function; growth; and development (including neuro‐developmental assessment). | |
| Notes | ||
| Risk of bias | ||
| Bias | Authors' judgement | Support for judgement |
| Random sequence generation (selection bias) | Low risk | The telephone randomisation schedule was developed by the medical co‐ordinating centre. |
| Allocation concealment (selection bias) | Low risk | Centralised telephone randomisation was used. |
| Incomplete outcome data (attrition bias) | Low risk | Some secondary outcomes reported for only the individuals who completed the study but ITT approach taken for primary outcomes (via multiple imputation) and safety outcomes so risk of bias judged to be low. |
| Selective reporting (reporting bias) | Low risk | All outcomes well defined in the methods and reported well in the results. |
| Other bias | Low risk | None identified. |
| Blinding of participants and personnel (performance bias) | Low risk | Participants, caregivers and medical coordinating centre staff were masked to treatment allocation via packaging and treatment of the same appearance. |
| Blinding of outcome assessment (detection bias) | Low risk | An unmasked "primary endpoint person" monitored laboratory values and assisted clinical management. Other outcome assessors (e.g. those reading the liver‐spleen scans). |
| Methods | Randomised placebo‐controlled cross‐over study conducted in a single centre in Belgium. | |
| Participants | 25 children with HbSS genotype, age 2 ‐ 22 years (median 9 years) with > 3 vaso‐occlusive events reported in preceding 12 months and/or history of CVA off transfusion (severe alloimmunisation or compliance), ACS, ASS. | |
| Interventions | Hydroxyurea 20 mg/kg/day rising to 25 (unless toxic cytopenia) versus placebo. Treatment period was for 6 months. | |
| Outcomes | Number of hospitalisations. | |
| Notes | Data are not presented in a way that results can be included in the review so results are presented narratively. | |
| Risk of bias | ||
| Bias | Authors' judgement | Support for judgement |
| Random sequence generation (selection bias) | Unclear risk | Described as "drawing sealed envelopes, patients were randomly allocated to one of the following treatment sequences", therefore the generation of the treatment sequence are not clear from this statement. |
| Allocation concealment (selection bias) | Unclear risk | Described as "drawing sealed envelopes, patients were randomly allocated to one of the following treatment sequences", therefore the allocation of the treatment sequence are not clear from this statement. |
| Incomplete outcome data (attrition bias) | Unclear risk | 3 participants who were excluded from the analysis due to their failure to attend the monthly evaluation at 4 ‐ 5 months. There was no discussion of whether or not an ITT analysis was used so the risk is unclear. |
| Selective reporting (reporting bias) | High risk | A planned outcome (number of days in pain) was dropped from analysis due to difficulty in obtaining information to inform this analysis from participants |
| Other bias | Low risk | Unclear if a washout period was used in this cross‐over study but tests for period effects and carry‐over effect were not significant so the risk of bias in the cross‐over design is low. |
| Blinding of participants and personnel (performance bias) | Unclear risk | The hospital pharmacy provided the treatment and placebo for each participant and both were described as "indistinguishable," however the physician was aware of the treatment schedule because of the difficulty of blinding the attending physician to the treatment received. Unclear if this could have influenced results. |
| Blinding of outcome assessment (detection bias) | Unclear risk | No information provided. |
| Methods | Randomised multicentre, phase II, double blind placebo‐controlled study. | |
| Participants | Eligible participants over the age of 5 years with HbSC and at least 1 vaso‐occlusive event in the previous 12 months (but none in the 4 weeks prior to study entry). 44 participants randomised; 11 to each treatment group (see 'Interventions'). Mean age: 13.6 years (range 5 ‐ 53 years), 43% females. | |
| Interventions | Participants randomised to 1 of 4 arms in a factorial design: 1. hydroxyurea (20 mg/kg/day) and magnesium (0.6 mmol/kg/day in 2 doses); 2. hydroxyurea (20 mg/kg/day) and placebo; 3. placebo and magnesium (0.6 mmol/kg/day in 2 doses); 4. placebo and placebo. | |
| Outcomes | Primary outcome: proportion of hyperdense red blood cells at 8 weeks. Secondary outcomes: central laboratory evaluations (including measurements of red cell density, HbF, red cell cation content, KCl co‐transport and Gardos channel activity, cell adhesion to endothelial cells and laminin, and erythrocyte membrane phosphatidyl serine (PS exposure)) at baseline (twice) and weeks 8, 16, 24, and 44. Participants were evaluated at 2 or 4 week intervals for 11 months (15 visits). | |
| Notes | The study was not designed to measure efficacy and all analyses were considered exploratory. The study was terminated early due to low enrolment after 44 participants had been randomised (target 188). Due to factorial design, no data can be entered into analysis and results for hydroxyurea groups (groups 1 and 2) compared to no hydroxyurea groups are summarised narratively. | |
| Risk of bias | ||
| Bias | Authors' judgement | Support for judgement |
| Random sequence generation (selection bias) | Low risk | A sequential allocation algorithm (i.e. minimisation) was used due to small numbers within each strata (site and age group). |
| Allocation concealment (selection bias) | Unclear risk | No information provided. |
| Incomplete outcome data (attrition bias) | High risk | 36 out of 44 participants completed 8 weeks and 22 out of 44 completed 44 weeks. Only those who completed the follow‐up time were included in analysis (8 weeks for primary endpoint and 44 weeks for secondary endpoints). This is not an ITT approach. |
| Selective reporting (reporting bias) | Low risk | Outcome defined in the methods section well described in the results section. Study was not designed to measure efficacy. |
| Other bias | Low risk | Study terminated early after only 44 of planned sample size of 188 were recruited. However, the study was not designed to measure efficacy and performed only exploratory analyses therefore the early termination is unlikely to have introduced bias. |
| Blinding of participants and personnel (performance bias) | Low risk | All tablets were 'over‐capsulated' to disguise appearance. |
| Blinding of outcome assessment (detection bias) | Unclear risk | No information provided. |
| Methods | Double‐blind randomised controlled study conducted in a tertiary hospital in Nagpur City, India. | |
| Participants | Indian children between the ages of 5 and 18 years with severe manifestations (defined as 3 or more blood transfusions or VOC requiring hospitalisation per year) despite high HbF. Exclusion criteria included seropositivity for HIV or chronic illness. 60 participants randomised; 30 to each treatment group. 53% females (16 females per group). Mean (SD) age ‐ hydroxyurea group: 12.73 (4.4) years, placebo group: 11.73 (4.08) years. | |
| Interventions | Hydroxyurea (fixed dose 10 mg/mg/day) compared to placebo for 18 months. | |
| Outcomes | Primary outcome: frequency of VOC per participant per year. Secondary outcomes: frequency of blood transfusions, hospitalisations and HbF levels. | |
| Notes | ||
| Risk of bias | ||
| Bias | Authors' judgement | Support for judgement |
| Random sequence generation (selection bias) | Low risk | Participants were randomised using randomisation tables. |
| Allocation concealment (selection bias) | Unclear risk | No information provided. |
| Incomplete outcome data (attrition bias) | Low risk | All participants completed 18‐months follow‐up and were included in analysis. |
| Selective reporting (reporting bias) | Low risk | No protocol available, outcomes defined in the methods reported well in the results. |
| Other bias | Low risk | None identified. |
| Blinding of participants and personnel (performance bias) | Low risk | Participants were blinded with placebo tablets of identical appearance. The clinician who assessed participants were not aware of treatment arm. |
| Blinding of outcome assessment (detection bias) | Low risk | The laboratory technician and the clinician who assessed participants were not aware of treatment arm. |
| Methods | Randomised multicentre parallel, double‐blind placebo‐controlled study. Conducted in the USA and Canada across 21 sites. | |
| Participants | Adults over 18 years of age with HbSS genotype who had reported more than 3 'crises' to treating physician in the preceding 12 months and who had < 15% HbA. Exclusions included: HbA > 15%, pregnancy, opiate addiction, other potent anti‐sickling agents, cytopenia, CVA in the preceding 6 years, HIV antibody +, prior hydroxyurea therapy 152 randomised to hydroxyurea and 147 given placebo. | |
| Interventions | Hydroxyurea starting at 15 mg/kg/day rising 12‐weekly by 5 mg/kg/day unless marrow depression (then cessation of drug until recovery and restarted at 2.5 mg/kg/day lower, i.e. MTD) compared to placebo for 2 years. | |
| Outcomes | Primary outcome: pain events ‐ attending hospital > 4 hours & parenteral opiate treatment. | |
| Notes | 93% follow‐up at 2 years, treatment stopped in 14 hydroxyurea and 6 placebo participants. Due to beneficial treatment effects, the study was stopped at a mean follow‐up of 21 months, before the planned 24 months of treatment had been completed for all participants. | |
| Risk of bias | ||
| Bias | Authors' judgement | Support for judgement |
| Random sequence generation (selection bias) | Low risk | Treatment assignments were made centrally using a computer programme to generate separate, randomised block assignment schedules for each clinic. |
| Allocation concealment (selection bias) | Unclear risk | There was no clear discussion on allocation concealment. |
| Incomplete outcome data (attrition bias) | Low risk | Withdrawals from the study were well documented, all participants included in analysis in an ITT approach in the primary publications but later reported outcomes (such as quality of life) reported only for those who contributed data. |
| Selective reporting (reporting bias) | Low risk | All outcomes well defined in the methods and reported well in the results. |
| Other bias | Low risk | None identified. |
| Blinding of participants and personnel (performance bias) | Low risk | Stated as double‐blind (physician and participant), where treatment was assigned in combinations of identically appearing capsules. |
| Blinding of outcome assessment (detection bias) | Unclear risk | There was no clear discussion on blinding of outcome assessors. |
| Methods | Phase III randomised, partially masked (outcome assessors) multicentre study conducted in 3 centres in the USA, Jamaica and Brazil between May 2012 and August 2013. | |
| Participants | Children with SCA and conditional TCD ultrasound velocities (170 cm ‐ 199 cm per second). Exclusion criteria were prior abnormal TCD velocities or clinical stroke, red blood cell transfusion within 2 months of enrolment, concurrent use of another anti‐sickling medication or contraindication to hydroxyurea therapy (allergy, pregnancy, renal insufficiency). 22 participants randomised, 11 to each treatment group. Mean age (SD): hydroxyurea group: 6.2 (2.4) years, observation group: 6.6 (1.5) years. 64% females, 7 per group. 21 participants with HbSS and 1 with HbSβº‐thalassemia. | |
| Interventions | Hydroxyurea (starting at 20 mg/kg/day escalated to a maximum of 35 mg/kg/day) compared to standard treatment (observation). | |
| Outcomes | Primary outcome: conversion to abnormal maximum abnormal TAMV. Secondary outcomes: changes in serial TCD velocities. Indicence of acute events including stroke. Health‐related quality of life (planned but not recorded, see 'Selective reporting' below). | |
| Notes | The planned length of follow‐up was 30 months but the study was terminated early after 15 months of follow‐up due to slow participant accrual and the unlikelihood of meeting the trial recruitment target (100) and the primary endpoint. | |
| Risk of bias | ||
| Bias | Authors' judgement | Support for judgement |
| Random sequence generation (selection bias) | Low risk | Randomisation was performed using an adaptive blocked algorithm. |
| Allocation concealment (selection bias) | Low risk | Central pharmacy distribution of allocations. |
| Incomplete outcome data (attrition bias) | Low risk | Numbers screened, randomised and number receiving randomised treatment reported. Analysis conducted using an ITT approach. |
| Selective reporting (reporting bias) | High risk | A planned outcome (health‐related quality of life) was not analysed or presented as the outcome was not sufficiently collected due to early study termination. |
| Other bias | High risk | Study terminated early after only 22 of planned sample size of 100 were recruited therefore study is likely to be statistically underpowered. |
| Blinding of participants and personnel (performance bias) | Low risk | Participants and personnel could not be masked to treatment allocation by design (hydroxyurea compared to observation only). The primary outcome (conversion to abnormal TAMV) was objective and determined by masked outcome assessors so lack of blinding of participants and personnel is unlikely to have affected results. |
| Blinding of outcome assessment (detection bias) | Low risk | All TCD site examiners, central reviewers were masked and site clinicians were masked to participants TCD results. |
| Methods | Phase III, multicentre, single masked (outcome assessors), non‐inferiority study conducted across 26 paediatric sites in the USA. | |
| Participants | Participants with previous clinical stroke, aged 7 to 17 years, PRBC transfusions for at least 18 months and transfusional iron overload. No specific exclusion criteria stated. 133 participants were randomised; 67 randomised to hydroxyurea treatment and 66 to standard treatment. Mean (SD) age at study enrolment in years: hydroxyurea group 13.0 (4.0) years, standard treatment group 13.3 (3.8) years. 132 out of 133 participants with HbSS genotype, 61 females (46%). | |
| Interventions | Hydroxyurea starting at 20 mg/kg/day escalated to MTD and phlebotomy compared to standard treatment (transfusions and chelation) for 30 months. | |
| Outcomes | The primary outcome of the trial was a composite outcome. This involved occurrence of a secondary stroke and quantitative liver iron level change from baseline. Secondary outcomes included quality of life, non‐stroke neurological events, other SCD‐related events, growth and development, functional evaluations, neurocognitive evaluations, transfusion related complications, chelation related complications, hydroxyurea‐related complications, phlebotomy related complications, liver biopsy related complications and adverse and serious adverse events. | |
| Notes | Numerous secondary outcomes were not reported in the main paper or any subsequent papers. | |
| Risk of bias | ||
| Bias | Authors' judgement | Support for judgement |
| Random sequence generation (selection bias) | Unclear risk | Study described as randomised, no further details given. |
| Allocation concealment (selection bias) | Unclear risk | No details were given on allocation concealment. |
| Incomplete outcome data (attrition bias) | Low risk | Withdrawals from treatment reported, all individuals included in analysis in an ITT approach. |
| Selective reporting (reporting bias) | High risk | Many of the secondary outcomes (such as growth and development, functional evaluations, neurocognitive evaluations) have not yet been reported, If these results can be included at a later date then this judgement will be reconsidered. |
| Other bias | Low risk | None identified. |
| Blinding of participants and personnel (performance bias) | Low risk | Participants and personnel could not be masked to treatment allocation by design (hydroxyurea compared to transfusion). The primary outcome (secondary stroke and quantitative liver iron level change from baseline) was objective and determined by masked outcome assessors so lack of blinding of participants and personnel is unlikely to have affected results. |
| Blinding of outcome assessment (detection bias) | Low risk | The primary outcome (secondary stroke and quantitative liver iron level change from baseline) were determined by a group of treatment masked neurologists and neuroradiologists. |
| Methods | Multicentre phase III randomised open‐label (partially masked) non‐inferiority study conducted at 26 paediatric hospitals and health centres in the USA and Canada. | |
| Participants | Children aged 4 ‐ 16 years with SCA and abnormal TCD ultrasound velocities (> 200 cm per second) if they had received 12 months of chronic transfusions. Exclusion criteria were documented clinical stroke, TIA or severe vasculopathy. 121 participants were randomised; 60 randomised to hydroxyurea treatment and 61 to standard treatment. Mean (SD) age at study enrolment in years: hydroxyurea group 9.5 (2.6) years, standard treatment group 9.7 (3.2) years. 119 out of 121 participants with HbSS genotype, 73 females (60%). | |
| Interventions | Hydroxyurea starting at 20 mg/kg/day escalated to MTD and phlebotomy compared to standard treatment (transfusions and chelation) for 24 months. | |
| Outcomes | Primary outcome: maximum TCD time averaged mean velocity on the index side (i.e. the cerebral hemisphere with the higher mean arterial velocity at baseline assessment). Secondary outcomes: TCD velocity on the non‐index side, neurological events, new brain lesions, hepatic iron overload, SCD‐related events, treatment‐related complication (reported in this publication) neuropsychological status, quality of life and growth and (to be reported in future publications). | |
| Notes | Study was terminated early at the first interim analysis when non‐inferiority was demonstrated, target sample size was met at early termination. | |
| Risk of bias | ||
| Bias | Authors' judgement | Support for judgement |
| Random sequence generation (selection bias) | Low risk | Centralised block randomisation with block size four, with stratification by site and balanced by baseline age and TCD velocity. |
| Allocation concealment (selection bias) | Low risk | Central randomisation and treatment allocation. |
| Incomplete outcome data (attrition bias) | Low risk | Numbers discontinuing the interventions stated, all participants included in analysis in an ITT analysis. |
| Selective reporting (reporting bias) | High risk | Outcomes of neuropsychological status, quality of life and growth were measured but results are not yet published. If these results can be included at a later date then this judgement will be reconsidered. |
| Other bias | Low risk | Study was terminated early at the first interim analysis when non‐inferiority was demonstrated, target sample size was met at early termination so the study is adequately powered to detect differences. |
| Blinding of participants and personnel (performance bias) | Low risk | Participants and personnel could not be masked to treatment allocation by design (hydroxyurea compared to transfusion). The primary outcome (maximum TCD time averaged mean velocity) was objective and determined by masked outcome assessors so lack of blinding of participants and personnel is unlikely to have affected results. |
| Blinding of outcome assessment (detection bias) | Low risk | All TCD examinations were read centrally by observers blinded to treatment allocation and previous TCD results. |
ACS: acute chest syndrome
ASS: acute splenic sequestration
CVA: cerebro‐vascular accident
Cytopenia: refers to either neutropenia or thrombocytopenia, anaemia is also a risk but was not reported
FBC: full blood count
HbA: adult haemoglobin
HbF: fetal haemoglobin
HbSβº: haemoglobin Sβºthalassaemia genotype
HbSC: haemoglobin SC genotype
HbSS: haemoglobin SS genotype
ITT: intention‐to‐treat
KCl: potassium chloride
MTD: maximum tolerated dose
PRBC: packed red blood cells
SCA: sickle cell anaemia
SCD: sickle cell disease
SD: standard deviation
TAMV: time averaged mean velocity
TCD: transcranial doppler
TIA: transient ischaemic attack
VOC: vaso‐occlusive crisis
Characteristics of excluded studies [ordered by study ID]
| Study | Reason for exclusion |
| This is not a randomised study. | |
| This study does not fulfil the inclusion criteria. The length of treatment was 8 days, the inclusion criteria state that treatment should be at least 1 month. | |
| This does not make a randomised comparison of hydroxyurea and placebo or standard treatment (the randomised comparison is dosing schedules of hydroxyurea). | |
| This does not make a randomised comparison of hydroxyurea and placebo or standard treatment. | |
| This study does not fulfil the inclusion criteria. The length of treatment was 7 days, the inclusion criteria state that treatment should be at least 1 month. | |
| This does not make a randomised comparison of hydroxyurea and placebo or standard treatment. | |
| This is not an appropriate design to measure the effectiveness of hydroxyurea (cross‐over design of low‐dose hydroxyurea compared to no treatment to monitor those at increased risk of infection). | |
| This is not a randomised study. | |
| This is not a randomised study. | |
| This is not a randomised study. | |
| This does not make a randomised comparison of hydroxyurea and placebo or standard treatment. | |
| This is not a randomised study. |
Characteristics of studies awaiting assessment [ordered by study ID]
| Methods | Prospective, randomised, placebo‐controlled, double‐blinded phase III trial (NOHARM trial) |
| Participants | Study participants will be recruited from the Mulago Hospital Sickle Cell Clinic (MHSCC) in Kampala, Uganda. Children aged 1 to 4 years with documented HbSS living in an area of meso‐endemic malaria transmission. |
| Interventions | Hydroxyurea 20 ± 2.5 mg/kg/day compared to placebo |
| Outcomes | Primary outcome: malaria incidence, defined as episodes of clinical malaria occurring over the 1‐year randomised study treatment period. Secondary outcomes: frequency of haematologic toxicities and AEs, relationships between hydroxyurea treatment and fetal haemoglobin, soluble intracellular adhesion molecule‐1, and nitric oxide levels, and between levels of these factors and risk of subsequent malaria. |
| Notes | Currently, only a protocol is available for the NOHARM study. We are unsure if this study meets the inclusion criteria of the review of 'Type of Participants' due to the study objectives around determining the incidence of malaria in SCA individuals. We will make an assessment of the eligibility of the population when study results are available. |
| Methods | Randomised, double‐blind, parallel group, dose‐controlled study (SPRING) |
| Participants | Participants with HbSS or HbSβº‐thalassemia, S variant with baseline haemoglobin less than 10 g/dL or other sickle cell syndromes apart from HbSC between the ages of 5 and 12 years, living in sub‐Saharan Africa, without prior overt stroke. Inclusion criteria for a 'non‐elevated TCD group' (participants who are not eligible to receive hydroxyurea therapy but are willing to be following for a minimum of 3 years). |
| Interventions | Hydroxyurea (moderate dose): 20 mg/kg/day (range 17.5 ‐ 26 mg/kg/day) for 24 months. Hydroxyurea (low dose): 10 mg/kg/day (range 7 ‐ 15 mg/kg/day) for 24 months. |
| Outcomes | Primary outcome: efficacy of moderate vs low‐dose hydroxyurea therapy for primary stroke prevention. Secondary outcome: incidence of all‐cause hospitalizations. Secondary outcome: long‐term safety of hydroxyurea therapy. |
| Notes | Unclear if this is an appropriate design (dose‐control) and population for the review ('non‐elevated TCD group'). Trial is ongoing (estimated completion date ‐ December 2021), we will make an assessment of the eligibility of the design and population when trial results are available. |
| Methods | Randomised, double‐blind, parallel group, dose‐controlled study (SPRINT). |
| Participants | Participants between the age of 1 and 18 years with SCA and a history of stroke up to 30 days before entry into the study, living in sub‐Saharan Africa. |
| Interventions | Hydroxyurea (moderate dose): 20 mg/kg/day (range 17.5 ‐ 26 mg/kg/day) for 24 months. Hydroxyurea (low dose): 10 mg/kg/day (range 7 ‐ 15 mg/kg/day) for 24 months. |
| Outcomes | Primary outcome: rate of clinical stroke recurrence. Secondary outcome: incidence of all‐cause hospitalisation. |
| Notes | Unclear if this is an appropriate design (dose‐control) and population for the review (participants can have already received hydroxyurea treatment). Study is ongoing (estimated completion date July 2019), we will make an assessment of the eligibility of the design and population when study results are available. |
AEs: adverse events
HbSβº: haemoglobin Sβºthalassaemia genotype
HbSC: haemoglobin SC genotype
HbSS: haemoglobin SS genotype
TCD: transcranial doppler
Characteristics of ongoing studies [ordered by study ID]
| Trial name or title | NCT01389024: Hydroxyurea to Prevent Brain Injury in Sickle Cell Disease (HUPrevent) |
| Methods | Randomised, double‐blind, parallel design, phase 2 study. |
| Participants | Participants with HbSS or HbSβº‐thalassemia aged between 9 and 48 months of age, with or without central nervous system complications. |
| Interventions | Hydroxyurea 20 mg/kg/day increased by 5 mg/kg every 8 weeks to maximum of 35 mg/kg/day; placebo (sucrose) 0.2 mL/kg/day increased to max of 0.35 mL/kg/day. |
| Outcomes | Primary outcome: central nervous system complications (a composite of abnormally elevated cerebral blood flow velocity as measured by TCD ultrasound, SCI, or stroke) Secondary outcome: proportion of participants with severe adverse events attributed to study procedures. |
| Starting date | October 2011 |
| Contact information | Johns Hopkins University Diane Weiss, BA ([email protected]) James F. Casella, MD ([email protected]) |
| Notes | Estimated completion date October 2017 (final data collection date for primary outcome measure) |
HbSβº: haemoglobin Sβºthalassaemia genotype
HbSC: Haemoglobin SC genotype
HbSS: Haemoglobin SS genotype
SCI: silent cerebral infarct
TCD: transcranial doppler
Data and analyses
| Outcome or subgroup title | No. of studies | No. of participants | Statistical method | Effect size |
| 1 Pain crises Show forest plot | 2 | Mean Difference (IV, Fixed, 95% CI) | Totals not selected | |
| Analysis 1.1  Comparison 1 Hydroxyurea versus placebo for participants with sickle cell disease, Outcome 1 Pain crises. | ||||
| 1.1 Mean annual crisis rate at 2 years (all crises) | 1 | Mean Difference (IV, Fixed, 95% CI) | ‐2.80 [‐4.74, ‐0.86] | |
| 1.2 Mean annual crisis rate at 2 years (all crises requiring hospitalisation) | 1 | Mean Difference (IV, Fixed, 95% CI) | ‐1.50 [‐2.58, ‐0.42] | |
| 1.3 Number of vaso‐occlusive crises after 18 months of treatment | 1 | Mean Difference (IV, Fixed, 95% CI) | ‐9.6 [‐10.86, ‐8.34] | |
| 2 Proportion experiencing pain Show forest plot | 1 | Risk Ratio (M‐H, Fixed, 95% CI) | Totals not selected | |
| Analysis 1.2  Comparison 1 Hydroxyurea versus placebo for participants with sickle cell disease, Outcome 2 Proportion experiencing pain. | ||||
| 3 Proportion experiencing life threatening events during study Show forest plot | 2 | Risk Ratio (M‐H, Fixed, 95% CI) | Subtotals only | |
| Analysis 1.3  Comparison 1 Hydroxyurea versus placebo for participants with sickle cell disease, Outcome 3 Proportion experiencing life threatening events during study. | ||||
| 3.1 Acute chest syndrome | 2 | 492 | Risk Ratio (M‐H, Fixed, 95% CI) | 0.43 [0.29, 0.63] |
| 3.2 Hepatic sequestration | 1 | 299 | Risk Ratio (M‐H, Fixed, 95% CI) | 0.32 [0.03, 3.06] |
| 3.3 Stroke | 2 | 492 | Risk Ratio (M‐H, Fixed, 95% CI) | 0.54 [0.12, 2.53] |
| 3.4 Patients transfused | 2 | 492 | Risk Ratio (M‐H, Fixed, 95% CI) | 0.66 [0.52, 0.82] |
| 3.5 Splenic sequestration | 1 | 193 | Risk Ratio (M‐H, Fixed, 95% CI) | 0.90 [0.36, 2.23] |
| 4 Number of life‐threatening events during study Show forest plot | 1 | Mean Difference (IV, Fixed, 95% CI) | Totals not selected | |
| Analysis 1.4 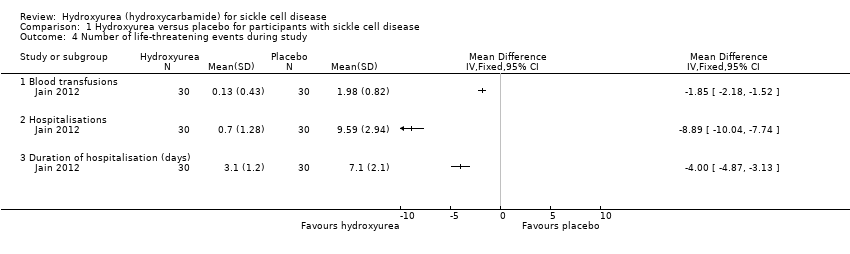 Comparison 1 Hydroxyurea versus placebo for participants with sickle cell disease, Outcome 4 Number of life‐threatening events during study. | ||||
| 4.1 Blood transfusions | 1 | Mean Difference (IV, Fixed, 95% CI) | ‐1.85 [‐2.18, ‐1.52] | |
| 4.2 Hospitalisations | 1 | Mean Difference (IV, Fixed, 95% CI) | ‐8.89 [‐10.04, ‐7.74] | |
| 4.3 Duration of hospitalisation (days) | 1 | Mean Difference (IV, Fixed, 95% CI) | ‐2.00 [‐4.87, ‐3.13] | |
| 5 Deaths during the study Show forest plot | 3 | Risk Ratio (M‐H, Fixed, 95% CI) | Subtotals only | |
| Analysis 1.5 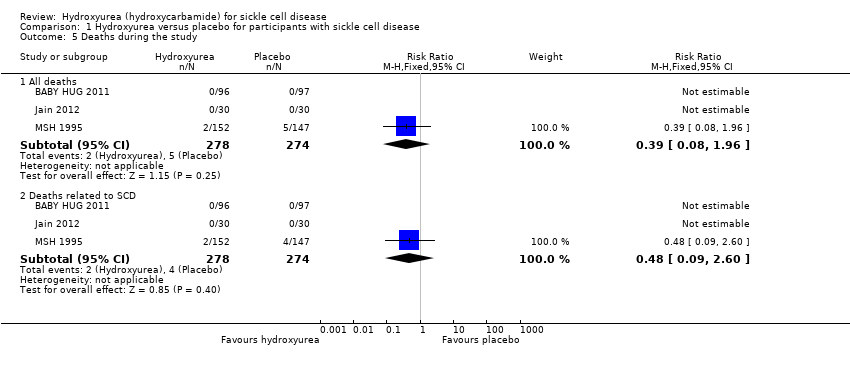 Comparison 1 Hydroxyurea versus placebo for participants with sickle cell disease, Outcome 5 Deaths during the study. | ||||
| 5.1 All deaths | 3 | 552 | Risk Ratio (M‐H, Fixed, 95% CI) | 0.39 [0.08, 1.96] |
| 5.2 Deaths related to SCD | 3 | 552 | Risk Ratio (M‐H, Fixed, 95% CI) | 0.48 [0.09, 2.60] |
| 6 Change from baseline in fetal haemoglobin (HbF %) Show forest plot | 1 | Mean Difference (Fixed, 95% CI) | Totals not selected | |
| Analysis 1.6  Comparison 1 Hydroxyurea versus placebo for participants with sickle cell disease, Outcome 6 Change from baseline in fetal haemoglobin (HbF %). | ||||
| 7 Fetal haemoglobin (HbF %) after treatment Show forest plot | 2 | 359 | Mean Difference (IV, Fixed, 95% CI) | 4.07 [2.95, 5.18] |
| Analysis 1.7  Comparison 1 Hydroxyurea versus placebo for participants with sickle cell disease, Outcome 7 Fetal haemoglobin (HbF %) after treatment. | ||||
| 8 Change from baseline in absolute neutrophil count (x10³ per μL) Show forest plot | 1 | Mean Difference (Fixed, 95% CI) | Totals not selected | |
| Analysis 1.8 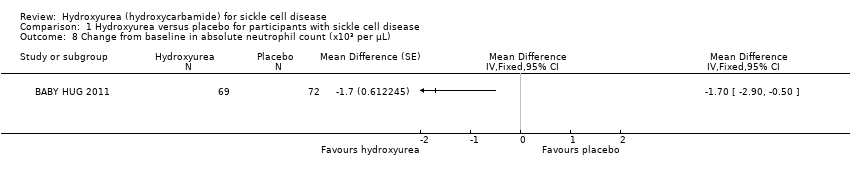 Comparison 1 Hydroxyurea versus placebo for participants with sickle cell disease, Outcome 8 Change from baseline in absolute neutrophil count (x10³ per μL). | ||||
| 9 Neutrophil response (10⁹/L) after treatment Show forest plot | 1 | Mean Difference (IV, Fixed, 95% CI) | Totals not selected | |
| Analysis 1.9 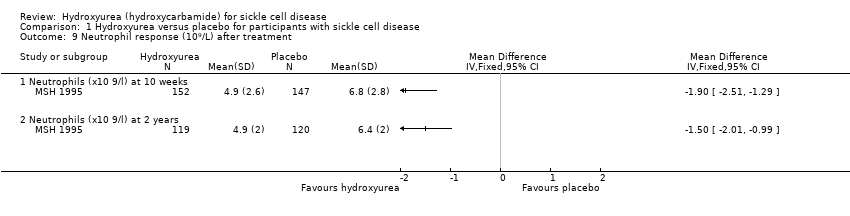 Comparison 1 Hydroxyurea versus placebo for participants with sickle cell disease, Outcome 9 Neutrophil response (10⁹/L) after treatment. | ||||
| 9.1 Neutrophils (x10 9/l) at 10 weeks | 1 | Mean Difference (IV, Fixed, 95% CI) | ‐1.90 [‐2.51, ‐1.29] | |
| 9.2 Neutrophils (x10 9/l) at 2 years | 1 | Mean Difference (IV, Fixed, 95% CI) | ‐1.50 [‐2.01, ‐0.99] | |
| 10 Change from baseline in haemoglobin (g/L) Show forest plot | 1 | Mean Difference (Fixed, 95% CI) | Totals not selected | |
| Analysis 1.10 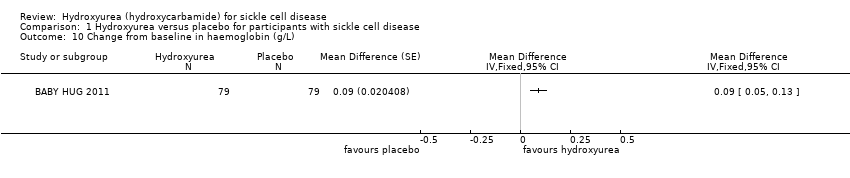 Comparison 1 Hydroxyurea versus placebo for participants with sickle cell disease, Outcome 10 Change from baseline in haemoglobin (g/L). | ||||
| 11 Change from baseline in m corpuscular volume (fL) Show forest plot | 1 | Mean Difference (Fixed, 95% CI) | Totals not selected | |
| Analysis 1.11 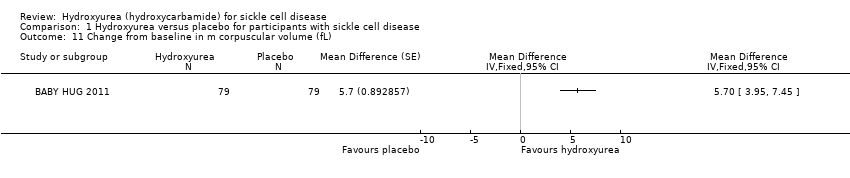 Comparison 1 Hydroxyurea versus placebo for participants with sickle cell disease, Outcome 11 Change from baseline in m corpuscular volume (fL). | ||||
| 12 Change from baseline in white blood cells (x10³ per μL) Show forest plot | 1 | Mean Difference (Fixed, 95% CI) | Totals not selected | |
| Analysis 1.12  Comparison 1 Hydroxyurea versus placebo for participants with sickle cell disease, Outcome 12 Change from baseline in white blood cells (x10³ per μL). | ||||
| 13 Change from baseline in absolute reticulocyte count (x10³ per μL) Show forest plot | 1 | Mean Difference (Fixed, 95% CI) | Totals not selected | |
| Analysis 1.13 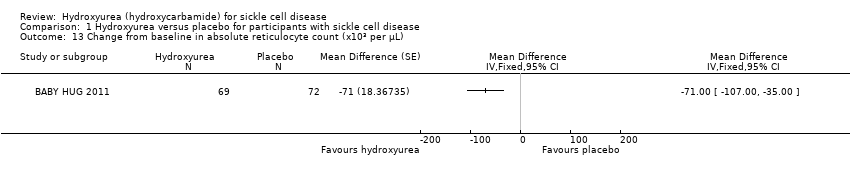 Comparison 1 Hydroxyurea versus placebo for participants with sickle cell disease, Outcome 13 Change from baseline in absolute reticulocyte count (x10³ per μL). | ||||
| 14 Change from baseline in reticulocytes (%) Show forest plot | 1 | Mean Difference (Fixed, 95% CI) | Totals not selected | |
| Analysis 1.14  Comparison 1 Hydroxyurea versus placebo for participants with sickle cell disease, Outcome 14 Change from baseline in reticulocytes (%). | ||||
| 15 Change from baseline in total bilirubin (mg/L) Show forest plot | 1 | Mean Difference (Fixed, 95% CI) | Totals not selected | |
| Analysis 1.15 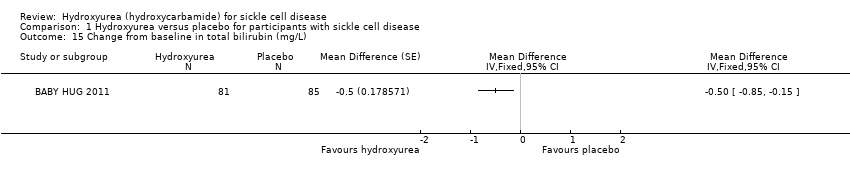 Comparison 1 Hydroxyurea versus placebo for participants with sickle cell disease, Outcome 15 Change from baseline in total bilirubin (mg/L). | ||||
| 16 Change from baseline in platelet count (x10³ per μL) Show forest plot | 1 | Mean Difference (Fixed, 95% CI) | Totals not selected | |
| Analysis 1.16  Comparison 1 Hydroxyurea versus placebo for participants with sickle cell disease, Outcome 16 Change from baseline in platelet count (x10³ per μL). | ||||
| 17 Haemoglobin (g/dL) Show forest plot | 2 | Mean Difference (IV, Fixed, 95% CI) | Subtotals only | |
| Analysis 1.17  Comparison 1 Hydroxyurea versus placebo for participants with sickle cell disease, Outcome 17 Haemoglobin (g/dL). | ||||
| 17.1 At 10 weeks | 1 | 299 | Mean Difference (IV, Fixed, 95% CI) | 0.5 [0.19, 0.81] |
| 17.2 At the end of the study | 2 | 359 | Mean Difference (IV, Fixed, 95% CI) | 1.04 [0.82, 1.25] |
| 18 Mean corpuscular volume (fL) Show forest plot | 1 | Mean Difference (IV, Fixed, 95% CI) | Totals not selected | |
| Analysis 1.18  Comparison 1 Hydroxyurea versus placebo for participants with sickle cell disease, Outcome 18 Mean corpuscular volume (fL). | ||||
| 18.1 At 10 weeks | 1 | Mean Difference (IV, Fixed, 95% CI) | 12.30 [9.69, 14.91] | |
| 18.2 At 2 years | 1 | Mean Difference (IV, Fixed, 95% CI) | 10.0 [7.34, 12.66] | |
| 19 Total bilirubin (mg/L) Show forest plot | 2 | Mean Difference (IV, Fixed, 95% CI) | Subtotals only | |
| Analysis 1.19  Comparison 1 Hydroxyurea versus placebo for participants with sickle cell disease, Outcome 19 Total bilirubin (mg/L). | ||||
| 19.1 At the end of the study | 2 | 359 | Mean Difference (IV, Fixed, 95% CI) | ‐1.56 [‐1.90, ‐1.23] |
| 20 Reticulocytes Show forest plot | 2 | Mean Difference (IV, Fixed, 95% CI) | Totals not selected | |
| Analysis 1.20  Comparison 1 Hydroxyurea versus placebo for participants with sickle cell disease, Outcome 20 Reticulocytes. | ||||
| 20.1 Reticulocytes (10⁵/mm³) at 18 months | 1 | Mean Difference (IV, Fixed, 95% CI) | ‐0.66 [‐0.90, ‐0.42] | |
| 20.2 Reticulocytes (10⁹/L) at 10 weeks | 1 | Mean Difference (IV, Fixed, 95% CI) | ‐130.0 [‐152.17, ‐107.83] | |
| 20.3 Reticulocytes (10⁹/L) at 2 years | 1 | Mean Difference (IV, Fixed, 95% CI) | ‐69.0 [‐91.56, ‐46.44] | |
| 21 Platelet count Show forest plot | 2 | Mean Difference (IV, Fixed, 95% CI) | Totals not selected | |
| Analysis 1.21  Comparison 1 Hydroxyurea versus placebo for participants with sickle cell disease, Outcome 21 Platelet count. | ||||
| 21.1 Platelet count (10³/mm³) at 18 months | 1 | Mean Difference (IV, Fixed, 95% CI) | ‐0.05 [‐0.16, 0.06] | |
| 21.2 Platelet count (x10⁹/L) at 10 weeks | 1 | Mean Difference (IV, Fixed, 95% CI) | ‐35.0 [‐75.19, 5.19] | |
| 21.3 Platelet count (x10⁹/L) at 2 years | 1 | Mean Difference (IV, Fixed, 95% CI) | ‐24.0 [‐51.88, 3.88] | |
| 22 Packed cell volume Show forest plot | 1 | Mean Difference (IV, Fixed, 95% CI) | Totals not selected | |
| Analysis 1.22  Comparison 1 Hydroxyurea versus placebo for participants with sickle cell disease, Outcome 22 Packed cell volume. | ||||
| 22.1 Packed cell volume (%) at 2 years | 1 | Mean Difference (IV, Fixed, 95% CI) | 1.90 [0.85, 2.95] | |
| 23 F reticulocytes Show forest plot | 1 | Mean Difference (IV, Fixed, 95% CI) | Totals not selected | |
| Analysis 1.23  Comparison 1 Hydroxyurea versus placebo for participants with sickle cell disease, Outcome 23 F reticulocytes. | ||||
| 23.1 F reticulocytes at 2 years | 1 | Mean Difference (IV, Fixed, 95% CI) | 2.0 [0.18, 3.82] | |
| 24 F cells Show forest plot | 1 | Mean Difference (IV, Fixed, 95% CI) | Totals not selected | |
| Analysis 1.24 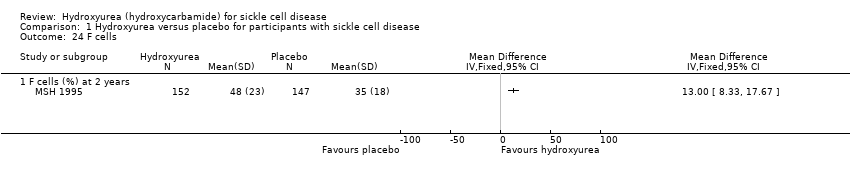 Comparison 1 Hydroxyurea versus placebo for participants with sickle cell disease, Outcome 24 F cells. | ||||
| 24.1 F cells (%) at 2 years | 1 | Mean Difference (IV, Fixed, 95% CI) | 13.0 [8.33, 17.67] | |
| 25 Red blood count Show forest plot | 1 | Mean Difference (IV, Fixed, 95% CI) | Totals not selected | |
| Analysis 1.25 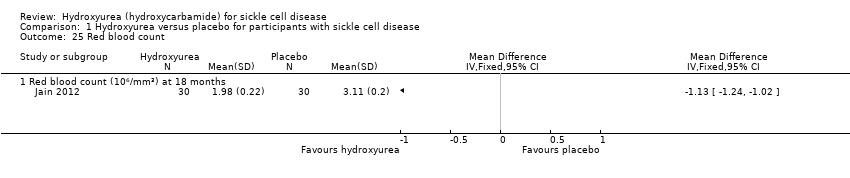 Comparison 1 Hydroxyurea versus placebo for participants with sickle cell disease, Outcome 25 Red blood count. | ||||
| 25.1 Red blood count (10⁶/mm³) at 18 months | 1 | Mean Difference (IV, Fixed, 95% CI) | ‐1.13 [‐1.24, ‐1.02] | |
| 26 White blood cells Show forest plot | 1 | Mean Difference (IV, Fixed, 95% CI) | Totals not selected | |
| Analysis 1.26  Comparison 1 Hydroxyurea versus placebo for participants with sickle cell disease, Outcome 26 White blood cells. | ||||
| 26.1 White blood cells (109/L) at 2 years | 1 | Mean Difference (IV, Fixed, 95% CI) | ‐2.30 [‐2.97, ‐1.63] | |
| 27 Dense cells Show forest plot | 1 | Mean Difference (IV, Fixed, 95% CI) | Totals not selected | |
| Analysis 1.27 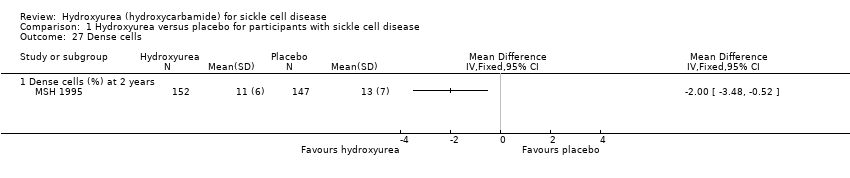 Comparison 1 Hydroxyurea versus placebo for participants with sickle cell disease, Outcome 27 Dense cells. | ||||
| 27.1 Dense cells (%) at 2 years | 1 | Mean Difference (IV, Fixed, 95% CI) | ‐2.0 [‐3.48, ‐0.52] | |
| 28 Leucocytes Show forest plot | 1 | Mean Difference (IV, Fixed, 95% CI) | Totals not selected | |
| Analysis 1.28  Comparison 1 Hydroxyurea versus placebo for participants with sickle cell disease, Outcome 28 Leucocytes. | ||||
| 28.1 Leucocytes (10³/mm³) at 18 months | 1 | Mean Difference (IV, Fixed, 95% CI) | ‐0.84 [‐3.07, 1.39] | |
| 29 Creatinine Show forest plot | 1 | Mean Difference (IV, Fixed, 95% CI) | Totals not selected | |
| Analysis 1.29  Comparison 1 Hydroxyurea versus placebo for participants with sickle cell disease, Outcome 29 Creatinine. | ||||
| 29.1 Creatinine (mg/dL) at 2 years | 1 | Mean Difference (IV, Fixed, 95% CI) | 0.0 [‐0.11, 0.11] | |
| 30 Aspartate aminotransferase Show forest plot | 1 | Mean Difference (IV, Fixed, 95% CI) | Totals not selected | |
| Analysis 1.30 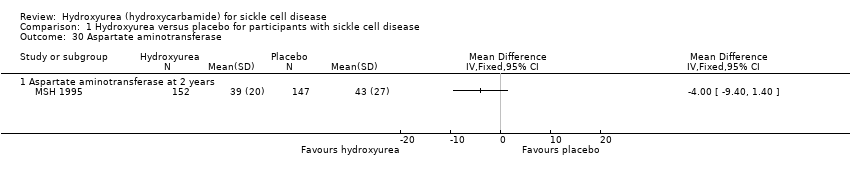 Comparison 1 Hydroxyurea versus placebo for participants with sickle cell disease, Outcome 30 Aspartate aminotransferase. | ||||
| 30.1 Aspartate aminotransferase at 2 years | 1 | Mean Difference (IV, Fixed, 95% CI) | ‐4.0 [‐9.40, 1.40] | |
| 31 Alkaline phosphatase Show forest plot | 1 | Mean Difference (IV, Fixed, 95% CI) | Totals not selected | |
| Analysis 1.31  Comparison 1 Hydroxyurea versus placebo for participants with sickle cell disease, Outcome 31 Alkaline phosphatase. | ||||
| 31.1 Alkaline phosphatase at 2 years | 1 | Mean Difference (IV, Fixed, 95% CI) | ‐2.0 [‐15.78, 11.78] | |
| 32 Change from baseline in growth Show forest plot | 1 | Mean Difference (Fixed, 95% CI) | Totals not selected | |
| Analysis 1.32  Comparison 1 Hydroxyurea versus placebo for participants with sickle cell disease, Outcome 32 Change from baseline in growth. | ||||
| 32.1 Height (cm) | 1 | Mean Difference (Fixed, 95% CI) | ‐0.2 [1.00, 0.60] | |
| 32.2 Weight (kg) | 1 | Mean Difference (Fixed, 95% CI) | 0.10 [‐0.20, 0.40] | |
| 32.3 Head circumference (cm) | 1 | Mean Difference (Fixed, 95% CI) | ‐0.2 [‐0.60, 0.20] | |
| 33 Quality of life: general health perception Show forest plot | 1 | Mean Difference (IV, Fixed, 95% CI) | Totals not selected | |
| Analysis 1.33  Comparison 1 Hydroxyurea versus placebo for participants with sickle cell disease, Outcome 33 Quality of life: general health perception. | ||||
| 33.1 General health perception at 6 months | 1 | Mean Difference (IV, Fixed, 95% CI) | 0.30 [‐0.54, 1.14] | |
| 33.2 General health perception at 1 year | 1 | Mean Difference (IV, Fixed, 95% CI) | 0.60 [‐0.18, 1.38] | |
| 33.3 General health perception at 18 months | 1 | Mean Difference (IV, Fixed, 95% CI) | 0.9 [0.08, 1.72] | |
| 33.4 General health perception at 2 years | 1 | Mean Difference (IV, Fixed, 95% CI) | 0.4 [‐0.51, 1.31] | |
| 34 Quality of life: pain recall Show forest plot | 1 | Mean Difference (IV, Fixed, 95% CI) | Totals not selected | |
| Analysis 1.34  Comparison 1 Hydroxyurea versus placebo for participants with sickle cell disease, Outcome 34 Quality of life: pain recall. | ||||
| 34.1 Pain recall at 6 months | 1 | Mean Difference (IV, Fixed, 95% CI) | 0.40 [‐0.13, 0.93] | |
| 34.2 Pain recall at 1 year | 1 | Mean Difference (IV, Fixed, 95% CI) | 0.40 [‐0.18, 0.98] | |
| 34.3 Pain recall at 18 months | 1 | Mean Difference (IV, Fixed, 95% CI) | 0.70 [0.11, 1.29] | |
| 34.4 Pain recall at 2 years | 1 | Mean Difference (IV, Fixed, 95% CI) | 0.3 [‐0.30, 0.90] | |
| 35 Quality of life: social function Show forest plot | 1 | Mean Difference (IV, Fixed, 95% CI) | Totals not selected | |
| Analysis 1.35  Comparison 1 Hydroxyurea versus placebo for participants with sickle cell disease, Outcome 35 Quality of life: social function. | ||||
| 35.1 Social function at 6 months | 1 | Mean Difference (IV, Fixed, 95% CI) | 0.4 [‐0.15, 0.95] | |
| 35.2 Social function at 1 year | 1 | Mean Difference (IV, Fixed, 95% CI) | 0.2 [‐0.36, 0.76] | |
| 35.3 Social function at 18 months | 1 | Mean Difference (IV, Fixed, 95% CI) | 0.40 [‐0.21, 1.01] | |
| 35.4 Social function at 2 years | 1 | Mean Difference (IV, Fixed, 95% CI) | 0.3 [‐0.31, 0.91] | |
| 36 Changes in 'Ladder of Life' Show forest plot | 1 | Mean Difference (IV, Fixed, 95% CI) | Totals not selected | |
| Analysis 1.36  Comparison 1 Hydroxyurea versus placebo for participants with sickle cell disease, Outcome 36 Changes in 'Ladder of Life'. | ||||
| 36.1 Changes in 'Ladder of Life' at 6 months | 1 | Mean Difference (IV, Fixed, 95% CI) | 0.0 [‐0.52, 0.52] | |
| 36.2 Changes in 'Ladder of Life' at 1 year | 1 | Mean Difference (IV, Fixed, 95% CI) | 0.4 [‐0.15, 0.95] | |
| 36.3 Changes in 'Ladder of Life' at 18 months | 1 | Mean Difference (IV, Fixed, 95% CI) | 0.30 [‐0.22, 0.82] | |
| 36.4 Changes in 'Ladder of Life' at 2 years | 1 | Mean Difference (IV, Fixed, 95% CI) | 0.3 [‐0.23, 0.83] | |
| 37 Proportion of participants with signs of organ damage Show forest plot | 2 | Risk Ratio (M‐H, Fixed, 95% CI) | Totals not selected | |
| Analysis 1.37  Comparison 1 Hydroxyurea versus placebo for participants with sickle cell disease, Outcome 37 Proportion of participants with signs of organ damage. | ||||
| 37.1 New leg ulcers | 1 | Risk Ratio (M‐H, Fixed, 95% CI) | 0.85 [0.44, 1.64] | |
| 37.2 Aseptic necrosis (humerus or femur) | 1 | Risk Ratio (M‐H, Fixed, 95% CI) | 0.97 [0.39, 2.37] | |
| 37.3 Decreased spleen function at exit (compared to baseline) | 1 | Risk Ratio (M‐H, Fixed, 95% CI) | 0.72 [0.44, 1.16] | |
| 38 Signs of organ damage ‐ change from baseline in DTPA GFR Show forest plot | 1 | Mean Difference (Fixed, 95% CI) | Totals not selected | |
| Analysis 1.38  Comparison 1 Hydroxyurea versus placebo for participants with sickle cell disease, Outcome 38 Signs of organ damage ‐ change from baseline in DTPA GFR. | ||||
| 39 Signs of organ damage ‐ change from baseline in Howell‐Jolley body (per 106 red blood cells) Show forest plot | 1 | Mean Difference (Fixed, 95% CI) | Totals not selected | |
| Analysis 1.39 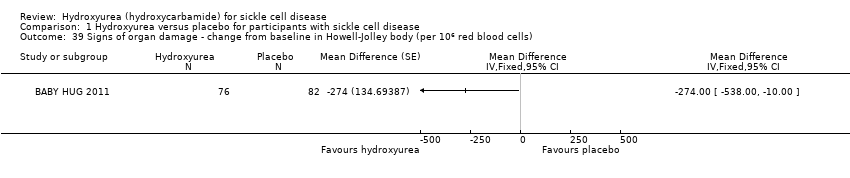 Comparison 1 Hydroxyurea versus placebo for participants with sickle cell disease, Outcome 39 Signs of organ damage ‐ change from baseline in Howell‐Jolley body (per 106 red blood cells). | ||||
| 40 Signs of organ damage ‐ change from baseline in pitted cells (%) Show forest plot | 1 | Mean Difference (Fixed, 95% CI) | Totals not selected | |
| Analysis 1.40  Comparison 1 Hydroxyurea versus placebo for participants with sickle cell disease, Outcome 40 Signs of organ damage ‐ change from baseline in pitted cells (%). | ||||
| 41 Signs of organ damage ‐ change from baseline in spleen: liver ratio of counts Show forest plot | 1 | Mean Difference (Fixed, 95% CI) | Totals not selected | |
| Analysis 1.41 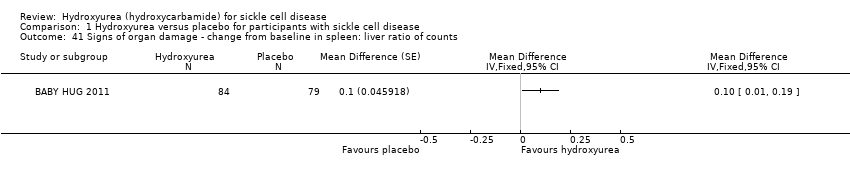 Comparison 1 Hydroxyurea versus placebo for participants with sickle cell disease, Outcome 41 Signs of organ damage ‐ change from baseline in spleen: liver ratio of counts. | ||||
| 42 Signs of organ damage ‐ change from baseline in spleen volume (cm3) Show forest plot | 1 | Mean Difference (Fixed, 95% CI) | Totals not selected | |
| Analysis 1.42 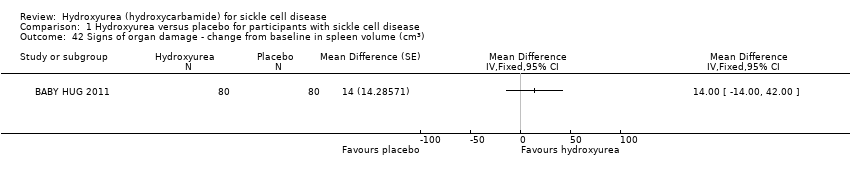 Comparison 1 Hydroxyurea versus placebo for participants with sickle cell disease, Outcome 42 Signs of organ damage ‐ change from baseline in spleen volume (cm3). | ||||
| 43 Signs of organ damage ‐ change from baseline in creatinine (mg/L) Show forest plot | 1 | Mean Difference (Fixed, 95% CI) | Totals not selected | |
| Analysis 1.43 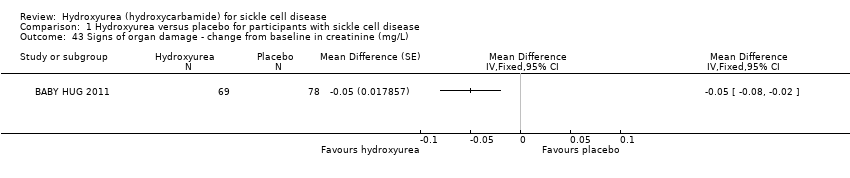 Comparison 1 Hydroxyurea versus placebo for participants with sickle cell disease, Outcome 43 Signs of organ damage ‐ change from baseline in creatinine (mg/L). | ||||
| 44 Signs of organ damage ‐ change from baseline in Schwartz GFR Show forest plot | 1 | Mean Difference (Fixed, 95% CI) | Totals not selected | |
| Analysis 1.44 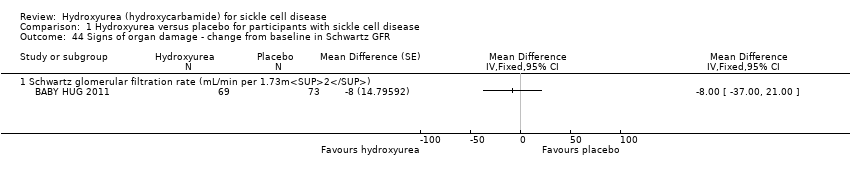 Comparison 1 Hydroxyurea versus placebo for participants with sickle cell disease, Outcome 44 Signs of organ damage ‐ change from baseline in Schwartz GFR. | ||||
| 44.1 Schwartz glomerular filtration rate (mL/min per 1.73m2) | 1 | Mean Difference (Fixed, 95% CI) | ‐8.0 [‐35.00, 21.00] | |
| 45 Signs of organ damage ‐ change from baseline in cystatin C Show forest plot | 1 | Mean Difference (Fixed, 95% CI) | Totals not selected | |
| Analysis 1.45  Comparison 1 Hydroxyurea versus placebo for participants with sickle cell disease, Outcome 45 Signs of organ damage ‐ change from baseline in cystatin C. | ||||
| 46 Signs of organ damage ‐ change from baseline in urine osmolality Show forest plot | 1 | Mean Difference (Fixed, 95% CI) | Totals not selected | |
| Analysis 1.46  Comparison 1 Hydroxyurea versus placebo for participants with sickle cell disease, Outcome 46 Signs of organ damage ‐ change from baseline in urine osmolality. | ||||
| 47 Signs of organ damage ‐ change from baseline in urine pH Show forest plot | 1 | Mean Difference (Fixed, 95% CI) | Totals not selected | |
| Analysis 1.47  Comparison 1 Hydroxyurea versus placebo for participants with sickle cell disease, Outcome 47 Signs of organ damage ‐ change from baseline in urine pH. | ||||
| 48 Signs of organ damage ‐ change from baseline in urine‐specific gravity Show forest plot | 1 | Mean Difference (Fixed, 95% CI) | Totals not selected | |
| Analysis 1.48  Comparison 1 Hydroxyurea versus placebo for participants with sickle cell disease, Outcome 48 Signs of organ damage ‐ change from baseline in urine‐specific gravity. | ||||
| 49 Signs of organ damage ‐ change from baseline in total kidney volume Show forest plot | 1 | Mean Difference (Fixed, 95% CI) | Totals not selected | |
| Analysis 1.49  Comparison 1 Hydroxyurea versus placebo for participants with sickle cell disease, Outcome 49 Signs of organ damage ‐ change from baseline in total kidney volume. | ||||
| 50 Signs of organ damage ‐ change from baseline in TCD ultrasound velocity (time‐averaged mean maximum velocity) Show forest plot | 1 | Mean Difference (Fixed, 95% CI) | Totals not selected | |
| Analysis 1.50 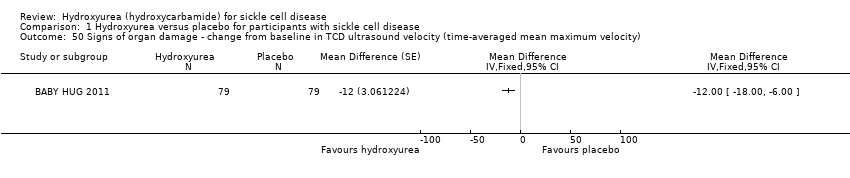 Comparison 1 Hydroxyurea versus placebo for participants with sickle cell disease, Outcome 50 Signs of organ damage ‐ change from baseline in TCD ultrasound velocity (time‐averaged mean maximum velocity). | ||||
| 51 Signs of organ damage ‐ change from baseline in CNS measures Show forest plot | 1 | Mean Difference (Fixed, 95% CI) | Totals not selected | |
| Analysis 1.51  Comparison 1 Hydroxyurea versus placebo for participants with sickle cell disease, Outcome 51 Signs of organ damage ‐ change from baseline in CNS measures. | ||||
| 51.1 Bayley Mental Development Index | 1 | Mean Difference (Fixed, 95% CI) | 3.0 [0.00, 8.00] | |
| 51.2 Bayley motor performance development index | 1 | Mean Difference (Fixed, 95% CI) | 2.0 [‐1.00, 7.00] | |
| 52 Proportion of participants experiencing adverse events and toxicity Show forest plot | 3 | Risk Ratio (M‐H, Fixed, 95% CI) | Totals not selected | |
| Analysis 1.52  Comparison 1 Hydroxyurea versus placebo for participants with sickle cell disease, Outcome 52 Proportion of participants experiencing adverse events and toxicity. | ||||
| 52.1 hair loss at 1 or 2 visits | 1 | Risk Ratio (M‐H, Fixed, 95% CI) | 1.25 [0.69, 2.26] | |
| 52.2 hair loss at 3 or more visits | 1 | Risk Ratio (M‐H, Fixed, 95% CI) | 0.61 [0.31, 1.21] | |
| 52.3 skin rash at 1 or 2 visits | 1 | Risk Ratio (M‐H, Fixed, 95% CI) | 0.97 [0.62, 1.51] | |
| 52.4 skin rash at 3 or more visits | 1 | Risk Ratio (M‐H, Fixed, 95% CI) | 0.97 [0.58, 1.60] | |
| 52.5 fever at 1 or 2 visits | 1 | Risk Ratio (M‐H, Fixed, 95% CI) | 0.97 [0.55, 1.69] | |
| 52.6 fever at 3 or more visits | 1 | Risk Ratio (M‐H, Fixed, 95% CI) | 0.89 [0.68, 1.17] | |
| 52.7 Gastroinestinal disturbance at 1 or 2 visits | 1 | Risk Ratio (M‐H, Fixed, 95% CI) | 0.83 [0.50, 1.36] | |
| 52.8 Gastrointestinal disturbance at 3 or more visits | 1 | Risk Ratio (M‐H, Fixed, 95% CI) | 0.98 [0.74, 1.31] | |
| 52.9 Other abnormalities at 1 or 2 visits | 1 | Risk Ratio (M‐H, Fixed, 95% CI) | 0.60 [0.33, 1.11] | |
| 52.10 Other abnormalities at 3 or more visits | 1 | Risk Ratio (M‐H, Fixed, 95% CI) | 1.08 [0.83, 1.40] | |
| 52.11 Hospitalisation (for any reason) | 1 | Risk Ratio (M‐H, Fixed, 95% CI) | 0.83 [0.72, 0.96] | |
| 52.12 Dactylitis | 1 | Risk Ratio (M‐H, Fixed, 95% CI) | 0.34 [0.20, 0.58] | |
| 52.13 Priapism | 1 | Risk Ratio (M‐H, Fixed, 95% CI) | 1.52 [0.26, 8.87] | |
| 52.14 Sepsis or bacteraemia | 1 | Risk Ratio (M‐H, Fixed, 95% CI) | 0.40 [0.08, 2.03] | |
| 52.15 Splenomegaly | 1 | Risk Ratio (M‐H, Fixed, 95% CI) | 0.90 [0.61, 1.32] | |
| 52.16 Absolute Neutrophil Count < 500 | 1 | Risk Ratio (M‐H, Fixed, 95% CI) | 2.53 [0.50, 12.71] | |
| 52.17 Absolute Neutrophil 500 ‐ 1250 | 1 | Risk Ratio (M‐H, Fixed, 95% CI) | 2.53 [1.58, 4.03] | |
| 52.18 Thrombocytopaenia | 1 | Risk Ratio (M‐H, Fixed, 95% CI) | 1.59 [0.64, 3.92] | |
| 52.19 Alanine transaminase > 150 U/L | 1 | Risk Ratio (M‐H, Fixed, 95% CI) | 2.02 [0.19, 21.92] | |
| 52.20 Severe anaemia | 1 | Risk Ratio (M‐H, Fixed, 95% CI) | 0.51 [0.05, 5.48] | |
| 52.21 Bilirubin | 1 | Risk Ratio (M‐H, Fixed, 95% CI) | 0.34 [0.01, 8.17] | |
| 52.22 Creatinine | 1 | Risk Ratio (M‐H, Fixed, 95% CI) | 0.0 [0.0, 0.0] | |
| 52.23 Skin and subcutaneous disorders | 1 | Risk Ratio (M‐H, Fixed, 95% CI) | 0.91 [0.75, 1.10] | |
| 52.24 Splenic sequestration | 1 | Risk Ratio (M‐H, Fixed, 95% CI) | 0.90 [0.36, 2.23] | |
| 52.25 Gastroenteritis | 1 | Risk Ratio (M‐H, Fixed, 95% CI) | 0.44 [0.28, 0.71] | |
| 52.26 Nausea | 1 | Risk Ratio (M‐H, Fixed, 95% CI) | 5.0 [0.25, 99.95] | |
| 52.27 Skin Rash | 1 | Risk Ratio (M‐H, Fixed, 95% CI) | 7.0 [0.38, 129.93] | |
| Outcome or subgroup title | No. of studies | No. of participants | Statistical method | Effect size |
| 1 Proportion experiencing pain Show forest plot | 2 | Risk Ratio (M‐H, Fixed, 95% CI) | Subtotals only | |
| Analysis 2.1 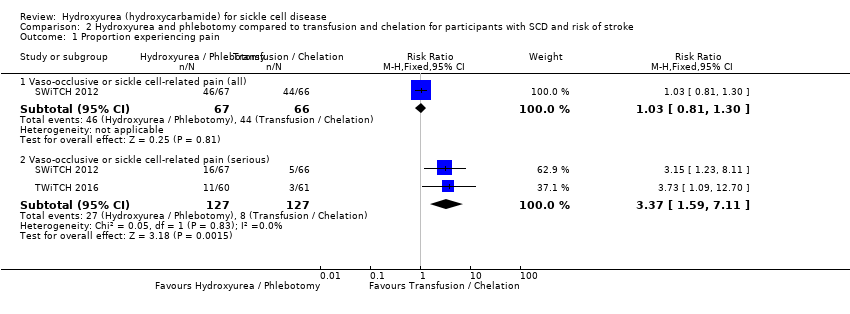 Comparison 2 Hydroxyurea and phlebotomy compared to transfusion and chelation for participants with SCD and risk of stroke, Outcome 1 Proportion experiencing pain. | ||||
| 1.1 Vaso‐occlusive or sickle cell‐related pain (all) | 1 | 133 | Risk Ratio (M‐H, Fixed, 95% CI) | 1.03 [0.81, 1.30] |
| 1.2 Vaso‐occlusive or sickle cell‐related pain (serious) | 2 | 254 | Risk Ratio (M‐H, Fixed, 95% CI) | 3.37 [1.59, 7.11] |
| 2 Proportion experiencing life‐threatening events during study Show forest plot | 2 | Risk Ratio (M‐H, Fixed, 95% CI) | Subtotals only | |
| Analysis 2.2 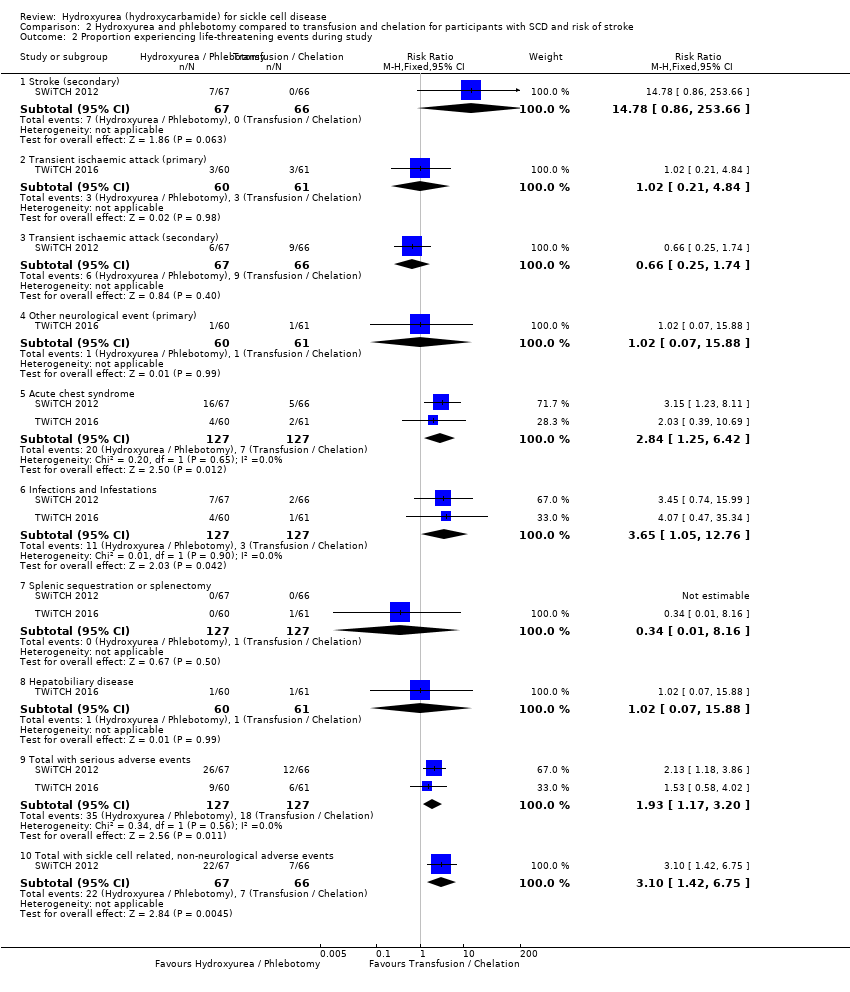 Comparison 2 Hydroxyurea and phlebotomy compared to transfusion and chelation for participants with SCD and risk of stroke, Outcome 2 Proportion experiencing life‐threatening events during study. | ||||
| 2.1 Stroke (secondary) | 1 | 133 | Risk Ratio (M‐H, Fixed, 95% CI) | 14.78 [0.86, 253.66] |
| 2.2 Transient ischaemic attack (primary) | 1 | 121 | Risk Ratio (M‐H, Fixed, 95% CI) | 1.02 [0.21, 4.84] |
| 2.3 Transient ischaemic attack (secondary) | 1 | 133 | Risk Ratio (M‐H, Fixed, 95% CI) | 0.66 [0.25, 1.74] |
| 2.4 Other neurological event (primary) | 1 | 121 | Risk Ratio (M‐H, Fixed, 95% CI) | 1.02 [0.07, 15.88] |
| 2.5 Acute chest syndrome | 2 | 254 | Risk Ratio (M‐H, Fixed, 95% CI) | 2.84 [1.25, 6.42] |
| 2.6 Infections and Infestations | 2 | 254 | Risk Ratio (M‐H, Fixed, 95% CI) | 3.65 [1.05, 12.76] |
| 2.7 Splenic sequestration or splenectomy | 2 | 254 | Risk Ratio (M‐H, Fixed, 95% CI) | 0.34 [0.01, 8.16] |
| 2.8 Hepatobiliary disease | 1 | 121 | Risk Ratio (M‐H, Fixed, 95% CI) | 1.02 [0.07, 15.88] |
| 2.9 Total with serious adverse events | 2 | 254 | Risk Ratio (M‐H, Fixed, 95% CI) | 1.93 [1.17, 3.20] |
| 2.10 Total with sickle cell related, non‐neurological adverse events | 1 | 133 | Risk Ratio (M‐H, Fixed, 95% CI) | 3.10 [1.42, 6.75] |
| 3 Deaths during the study Show forest plot | 2 | 254 | Risk Ratio (M‐H, Fixed, 95% CI) | 0.99 [0.06, 15.42] |
| Analysis 2.3 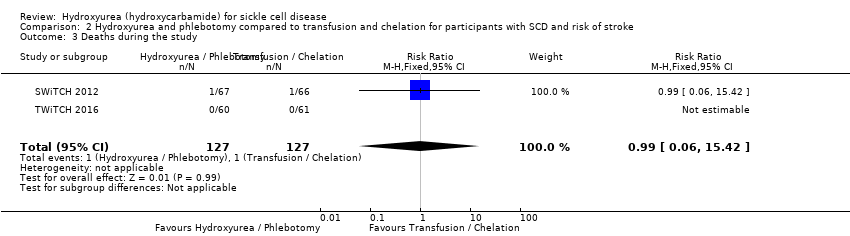 Comparison 2 Hydroxyurea and phlebotomy compared to transfusion and chelation for participants with SCD and risk of stroke, Outcome 3 Deaths during the study. | ||||
| 4 Change from baseline in fetal haemoglobin (HbF %) Show forest plot | 1 | Mean Difference (IV, Fixed, 95% CI) | Totals not selected | |
| Analysis 2.4 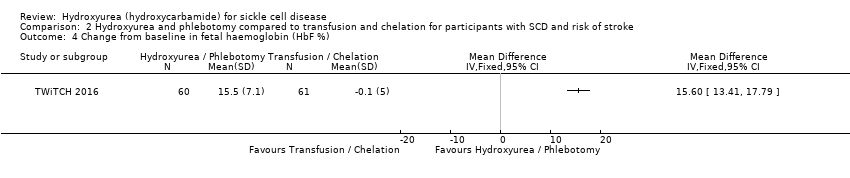 Comparison 2 Hydroxyurea and phlebotomy compared to transfusion and chelation for participants with SCD and risk of stroke, Outcome 4 Change from baseline in fetal haemoglobin (HbF %). | ||||
| 5 Change from baseline in absolute neutrophil count (x10⁹/L) Show forest plot | 1 | Mean Difference (IV, Fixed, 95% CI) | Totals not selected | |
| Analysis 2.5 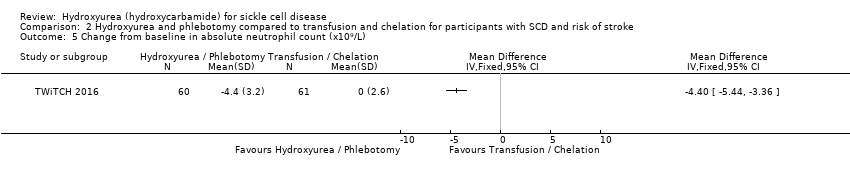 Comparison 2 Hydroxyurea and phlebotomy compared to transfusion and chelation for participants with SCD and risk of stroke, Outcome 5 Change from baseline in absolute neutrophil count (x10⁹/L). | ||||
| 6 Change from baseline in mean corpuscular volume (fL) Show forest plot | 1 | Mean Difference (IV, Fixed, 95% CI) | Totals not selected | |
| Analysis 2.6  Comparison 2 Hydroxyurea and phlebotomy compared to transfusion and chelation for participants with SCD and risk of stroke, Outcome 6 Change from baseline in mean corpuscular volume (fL). | ||||
| 7 Change from baseline in sickle haemoglobin (%) Show forest plot | 1 | Mean Difference (IV, Fixed, 95% CI) | Totals not selected | |
| Analysis 2.7 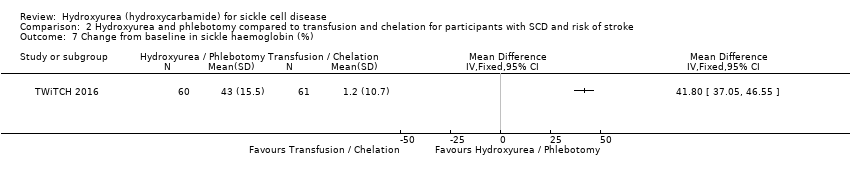 Comparison 2 Hydroxyurea and phlebotomy compared to transfusion and chelation for participants with SCD and risk of stroke, Outcome 7 Change from baseline in sickle haemoglobin (%). | ||||
| 8 Change from baseline in haemoglobin (g/L) Show forest plot | 1 | Mean Difference (IV, Fixed, 95% CI) | Totals not selected | |
| Analysis 2.8  Comparison 2 Hydroxyurea and phlebotomy compared to transfusion and chelation for participants with SCD and risk of stroke, Outcome 8 Change from baseline in haemoglobin (g/L). | ||||
| 9 Change from baseline in absolute reticulocyte count (10⁹ / L) Show forest plot | 1 | Mean Difference (IV, Fixed, 95% CI) | Totals not selected | |
| Analysis 2.9 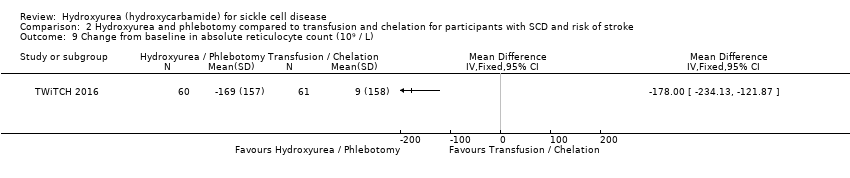 Comparison 2 Hydroxyurea and phlebotomy compared to transfusion and chelation for participants with SCD and risk of stroke, Outcome 9 Change from baseline in absolute reticulocyte count (10⁹ / L). | ||||
| 10 Change from baseline in white blood count (10⁹ / L) Show forest plot | 1 | Mean Difference (IV, Fixed, 95% CI) | Totals not selected | |
| Analysis 2.10 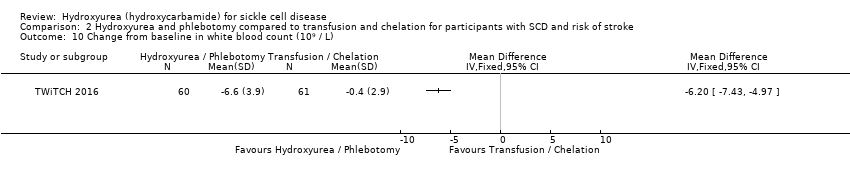 Comparison 2 Hydroxyurea and phlebotomy compared to transfusion and chelation for participants with SCD and risk of stroke, Outcome 10 Change from baseline in white blood count (10⁹ / L). | ||||
| 11 Change from baseline in platelets (10⁹ / L) Show forest plot | 1 | Mean Difference (IV, Fixed, 95% CI) | Totals not selected | |
| Analysis 2.11  Comparison 2 Hydroxyurea and phlebotomy compared to transfusion and chelation for participants with SCD and risk of stroke, Outcome 11 Change from baseline in platelets (10⁹ / L). | ||||
| 12 Change from baseline in total bilirubin (mg/L) Show forest plot | 1 | Mean Difference (IV, Fixed, 95% CI) | Totals not selected | |
| Analysis 2.12  Comparison 2 Hydroxyurea and phlebotomy compared to transfusion and chelation for participants with SCD and risk of stroke, Outcome 12 Change from baseline in total bilirubin (mg/L). | ||||
| 13 Change from baseline in liver iron concentration Show forest plot | 1 | Mean Difference (IV, Fixed, 95% CI) | Totals not selected | |
| Analysis 2.13  Comparison 2 Hydroxyurea and phlebotomy compared to transfusion and chelation for participants with SCD and risk of stroke, Outcome 13 Change from baseline in liver iron concentration. | ||||
| 14 Change from baseline in serum ferritin (ng/mL) Show forest plot | 1 | Mean Difference (IV, Fixed, 95% CI) | Totals not selected | |
| Analysis 2.14  Comparison 2 Hydroxyurea and phlebotomy compared to transfusion and chelation for participants with SCD and risk of stroke, Outcome 14 Change from baseline in serum ferritin (ng/mL). | ||||
| 15 Change from baseline in lactate dehydrogenase (U/L) Show forest plot | 1 | Mean Difference (IV, Fixed, 95% CI) | Totals not selected | |
| Analysis 2.15  Comparison 2 Hydroxyurea and phlebotomy compared to transfusion and chelation for participants with SCD and risk of stroke, Outcome 15 Change from baseline in lactate dehydrogenase (U/L). | ||||
| 16 Signs of organ damage ‐ CNS measures at the end of the study Show forest plot | 1 | Mean Difference (IV, Fixed, 95% CI) | Totals not selected | |
| Analysis 2.16 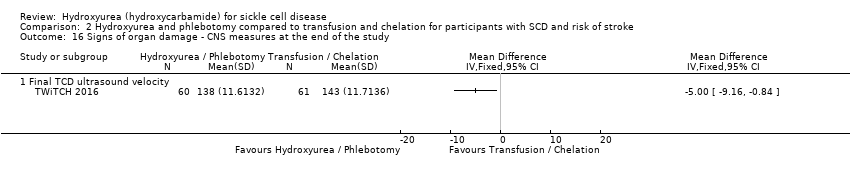 Comparison 2 Hydroxyurea and phlebotomy compared to transfusion and chelation for participants with SCD and risk of stroke, Outcome 16 Signs of organ damage ‐ CNS measures at the end of the study. | ||||
| 16.1 Final TCD ultrasound velocity | 1 | Mean Difference (IV, Fixed, 95% CI) | ‐5.0 [‐9.16, ‐0.84] | |
| 17 Proportion of participants experiencing non‐neurological adverse events and toxicity Show forest plot | 1 | Risk Ratio (M‐H, Fixed, 95% CI) | Totals not selected | |
| Analysis 2.17 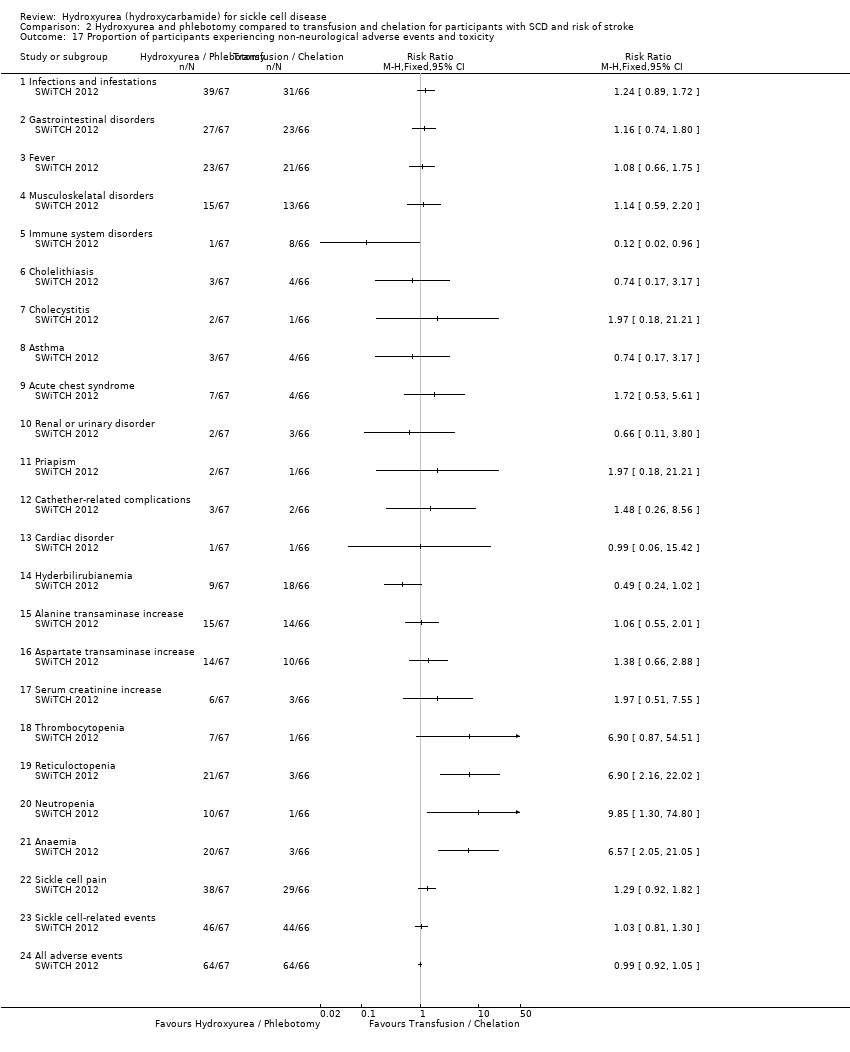 Comparison 2 Hydroxyurea and phlebotomy compared to transfusion and chelation for participants with SCD and risk of stroke, Outcome 17 Proportion of participants experiencing non‐neurological adverse events and toxicity. | ||||
| 17.1 Infections and infestations | 1 | Risk Ratio (M‐H, Fixed, 95% CI) | 1.24 [0.89, 1.72] | |
| 17.2 Gastrointestinal disorders | 1 | Risk Ratio (M‐H, Fixed, 95% CI) | 1.16 [0.74, 1.80] | |
| 17.3 Fever | 1 | Risk Ratio (M‐H, Fixed, 95% CI) | 1.08 [0.66, 1.75] | |
| 17.4 Musculoskelatal disorders | 1 | Risk Ratio (M‐H, Fixed, 95% CI) | 1.14 [0.59, 2.20] | |
| 17.5 Immune system disorders | 1 | Risk Ratio (M‐H, Fixed, 95% CI) | 0.12 [0.02, 0.96] | |
| 17.6 Cholelithiasis | 1 | Risk Ratio (M‐H, Fixed, 95% CI) | 0.74 [0.17, 3.17] | |
| 17.7 Cholecystitis | 1 | Risk Ratio (M‐H, Fixed, 95% CI) | 1.97 [0.18, 21.21] | |
| 17.8 Asthma | 1 | Risk Ratio (M‐H, Fixed, 95% CI) | 0.74 [0.17, 3.17] | |
| 17.9 Acute chest syndrome | 1 | Risk Ratio (M‐H, Fixed, 95% CI) | 1.72 [0.53, 5.61] | |
| 17.10 Renal or urinary disorder | 1 | Risk Ratio (M‐H, Fixed, 95% CI) | 0.66 [0.11, 3.80] | |
| 17.11 Priapism | 1 | Risk Ratio (M‐H, Fixed, 95% CI) | 1.97 [0.18, 21.21] | |
| 17.12 Cathether‐related complications | 1 | Risk Ratio (M‐H, Fixed, 95% CI) | 1.48 [0.26, 8.56] | |
| 17.13 Cardiac disorder | 1 | Risk Ratio (M‐H, Fixed, 95% CI) | 0.99 [0.06, 15.42] | |
| 17.14 Hyderbilirubianemia | 1 | Risk Ratio (M‐H, Fixed, 95% CI) | 0.49 [0.24, 1.02] | |
| 17.15 Alanine transaminase increase | 1 | Risk Ratio (M‐H, Fixed, 95% CI) | 1.06 [0.55, 2.01] | |
| 17.16 Aspartate transaminase increase | 1 | Risk Ratio (M‐H, Fixed, 95% CI) | 1.38 [0.66, 2.88] | |
| 17.17 Serum creatinine increase | 1 | Risk Ratio (M‐H, Fixed, 95% CI) | 1.97 [0.51, 7.55] | |
| 17.18 Thrombocytopenia | 1 | Risk Ratio (M‐H, Fixed, 95% CI) | 6.90 [0.87, 54.51] | |
| 17.19 Reticuloctopenia | 1 | Risk Ratio (M‐H, Fixed, 95% CI) | 6.90 [2.16, 22.02] | |
| 17.20 Neutropenia | 1 | Risk Ratio (M‐H, Fixed, 95% CI) | 9.85 [1.30, 74.80] | |
| 17.21 Anaemia | 1 | Risk Ratio (M‐H, Fixed, 95% CI) | 6.57 [2.05, 21.05] | |
| 17.22 Sickle cell pain | 1 | Risk Ratio (M‐H, Fixed, 95% CI) | 1.29 [0.92, 1.82] | |
| 17.23 Sickle cell‐related events | 1 | Risk Ratio (M‐H, Fixed, 95% CI) | 1.03 [0.81, 1.30] | |
| 17.24 All adverse events | 1 | Risk Ratio (M‐H, Fixed, 95% CI) | 0.99 [0.92, 1.05] | |
| Outcome or subgroup title | No. of studies | No. of participants | Statistical method | Effect size |
| 1 Proportion experiencing life‐threatening events during the study Show forest plot | 1 | Risk Ratio (M‐H, Fixed, 95% CI) | Totals not selected | |
| Analysis 3.1  Comparison 3 Hydroxyurea compared to observation for participants with SCD and risk of stroke, Outcome 1 Proportion experiencing life‐threatening events during the study. | ||||
| 1.1 Vaso‐occlusive events | 1 | Risk Ratio (M‐H, Fixed, 95% CI) | 0.4 [0.10, 1.64] | |
| 1.2 Acute splenic sequestration | 1 | Risk Ratio (M‐H, Fixed, 95% CI) | 1.0 [0.07, 14.05] | |
| 1.3 Blood transfusions required | 1 | Risk Ratio (M‐H, Fixed, 95% CI) | 0.33 [0.04, 2.73] | |
| 2 Signs of organ damage ‐ proportion of participants with a change in CNS measures Show forest plot | 1 | Risk Ratio (M‐H, Fixed, 95% CI) | Totals not selected | |
| Analysis 3.2 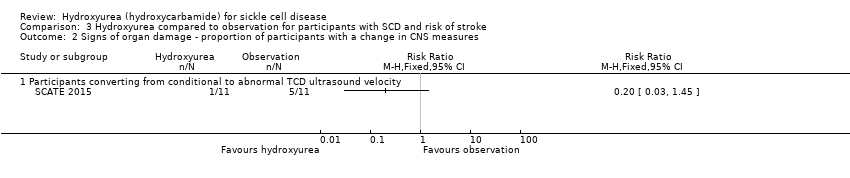 Comparison 3 Hydroxyurea compared to observation for participants with SCD and risk of stroke, Outcome 2 Signs of organ damage ‐ proportion of participants with a change in CNS measures. | ||||
| 2.1 Participants converting from conditional to abnormal TCD ultrasound velocity | 1 | Risk Ratio (M‐H, Fixed, 95% CI) | 0.2 [0.03, 1.45] | |
| 3 Signs of organ damage ‐ change from baseline in CNS measures Show forest plot | 1 | Mean Difference (IV, Fixed, 95% CI) | Totals not selected | |
| Analysis 3.3  Comparison 3 Hydroxyurea compared to observation for participants with SCD and risk of stroke, Outcome 3 Signs of organ damage ‐ change from baseline in CNS measures. | ||||
| 3.1 TCD ultrasound velocity (time‐averaged mean maximum velocity) | 1 | Mean Difference (IV, Fixed, 95% CI) | ‐25.7 [‐45.38, ‐6.02] | |
| 4 Adverse events and toxicity Show forest plot | 1 | Risk Ratio (M‐H, Fixed, 95% CI) | Totals not selected | |
| Analysis 3.4 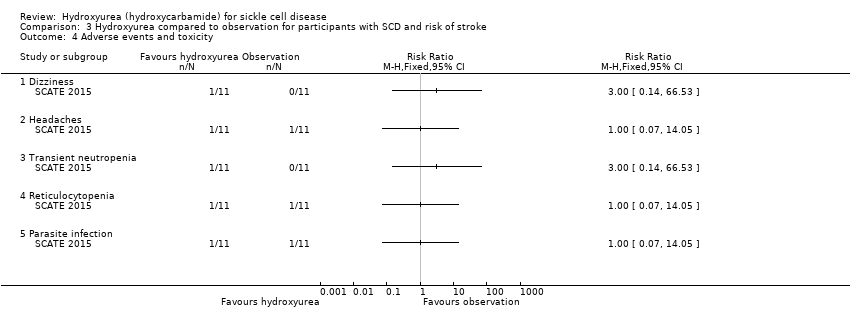 Comparison 3 Hydroxyurea compared to observation for participants with SCD and risk of stroke, Outcome 4 Adverse events and toxicity. | ||||
| 4.1 Dizziness | 1 | Risk Ratio (M‐H, Fixed, 95% CI) | 3.0 [0.14, 66.53] | |
| 4.2 Headaches | 1 | Risk Ratio (M‐H, Fixed, 95% CI) | 1.0 [0.07, 14.05] | |
| 4.3 Transient neutropenia | 1 | Risk Ratio (M‐H, Fixed, 95% CI) | 3.0 [0.14, 66.53] | |
| 4.4 Reticulocytopenia | 1 | Risk Ratio (M‐H, Fixed, 95% CI) | 1.0 [0.07, 14.05] | |
| 4.5 Parasite infection | 1 | Risk Ratio (M‐H, Fixed, 95% CI) | 1.0 [0.07, 14.05] | |
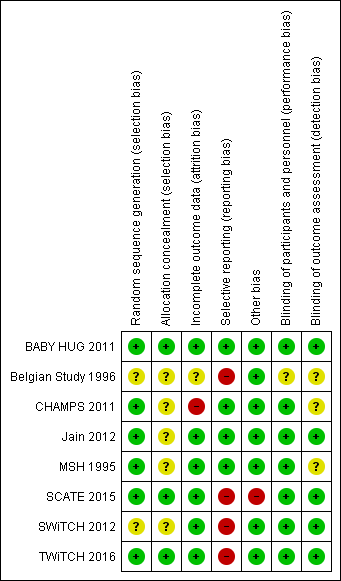
Risk of bias summary: review authors' judgements about each risk of bias item for each included study.
Comparison 1 Hydroxyurea versus placebo for participants with sickle cell disease, Outcome 1 Pain crises.
Comparison 1 Hydroxyurea versus placebo for participants with sickle cell disease, Outcome 2 Proportion experiencing pain.
Comparison 1 Hydroxyurea versus placebo for participants with sickle cell disease, Outcome 3 Proportion experiencing life threatening events during study.
Comparison 1 Hydroxyurea versus placebo for participants with sickle cell disease, Outcome 4 Number of life‐threatening events during study.
Comparison 1 Hydroxyurea versus placebo for participants with sickle cell disease, Outcome 5 Deaths during the study.
Comparison 1 Hydroxyurea versus placebo for participants with sickle cell disease, Outcome 6 Change from baseline in fetal haemoglobin (HbF %).
Comparison 1 Hydroxyurea versus placebo for participants with sickle cell disease, Outcome 7 Fetal haemoglobin (HbF %) after treatment.
Comparison 1 Hydroxyurea versus placebo for participants with sickle cell disease, Outcome 8 Change from baseline in absolute neutrophil count (x10³ per μL).
Comparison 1 Hydroxyurea versus placebo for participants with sickle cell disease, Outcome 9 Neutrophil response (10⁹/L) after treatment.
Comparison 1 Hydroxyurea versus placebo for participants with sickle cell disease, Outcome 10 Change from baseline in haemoglobin (g/L).
Comparison 1 Hydroxyurea versus placebo for participants with sickle cell disease, Outcome 11 Change from baseline in m corpuscular volume (fL).
Comparison 1 Hydroxyurea versus placebo for participants with sickle cell disease, Outcome 12 Change from baseline in white blood cells (x10³ per μL).
Comparison 1 Hydroxyurea versus placebo for participants with sickle cell disease, Outcome 13 Change from baseline in absolute reticulocyte count (x10³ per μL).
Comparison 1 Hydroxyurea versus placebo for participants with sickle cell disease, Outcome 14 Change from baseline in reticulocytes (%).
Comparison 1 Hydroxyurea versus placebo for participants with sickle cell disease, Outcome 15 Change from baseline in total bilirubin (mg/L).
Comparison 1 Hydroxyurea versus placebo for participants with sickle cell disease, Outcome 16 Change from baseline in platelet count (x10³ per μL).
Comparison 1 Hydroxyurea versus placebo for participants with sickle cell disease, Outcome 17 Haemoglobin (g/dL).
Comparison 1 Hydroxyurea versus placebo for participants with sickle cell disease, Outcome 18 Mean corpuscular volume (fL).
Comparison 1 Hydroxyurea versus placebo for participants with sickle cell disease, Outcome 19 Total bilirubin (mg/L).
Comparison 1 Hydroxyurea versus placebo for participants with sickle cell disease, Outcome 20 Reticulocytes.
Comparison 1 Hydroxyurea versus placebo for participants with sickle cell disease, Outcome 21 Platelet count.
Comparison 1 Hydroxyurea versus placebo for participants with sickle cell disease, Outcome 22 Packed cell volume.
Comparison 1 Hydroxyurea versus placebo for participants with sickle cell disease, Outcome 23 F reticulocytes.
Comparison 1 Hydroxyurea versus placebo for participants with sickle cell disease, Outcome 24 F cells.
Comparison 1 Hydroxyurea versus placebo for participants with sickle cell disease, Outcome 25 Red blood count.
Comparison 1 Hydroxyurea versus placebo for participants with sickle cell disease, Outcome 26 White blood cells.
Comparison 1 Hydroxyurea versus placebo for participants with sickle cell disease, Outcome 27 Dense cells.
Comparison 1 Hydroxyurea versus placebo for participants with sickle cell disease, Outcome 28 Leucocytes.
Comparison 1 Hydroxyurea versus placebo for participants with sickle cell disease, Outcome 29 Creatinine.
Comparison 1 Hydroxyurea versus placebo for participants with sickle cell disease, Outcome 30 Aspartate aminotransferase.
Comparison 1 Hydroxyurea versus placebo for participants with sickle cell disease, Outcome 31 Alkaline phosphatase.
Comparison 1 Hydroxyurea versus placebo for participants with sickle cell disease, Outcome 32 Change from baseline in growth.
Comparison 1 Hydroxyurea versus placebo for participants with sickle cell disease, Outcome 33 Quality of life: general health perception.
Comparison 1 Hydroxyurea versus placebo for participants with sickle cell disease, Outcome 34 Quality of life: pain recall.
Comparison 1 Hydroxyurea versus placebo for participants with sickle cell disease, Outcome 35 Quality of life: social function.
Comparison 1 Hydroxyurea versus placebo for participants with sickle cell disease, Outcome 36 Changes in 'Ladder of Life'.
Comparison 1 Hydroxyurea versus placebo for participants with sickle cell disease, Outcome 37 Proportion of participants with signs of organ damage.
Comparison 1 Hydroxyurea versus placebo for participants with sickle cell disease, Outcome 38 Signs of organ damage ‐ change from baseline in DTPA GFR.
Comparison 1 Hydroxyurea versus placebo for participants with sickle cell disease, Outcome 39 Signs of organ damage ‐ change from baseline in Howell‐Jolley body (per 106 red blood cells).
Comparison 1 Hydroxyurea versus placebo for participants with sickle cell disease, Outcome 40 Signs of organ damage ‐ change from baseline in pitted cells (%).
Comparison 1 Hydroxyurea versus placebo for participants with sickle cell disease, Outcome 41 Signs of organ damage ‐ change from baseline in spleen: liver ratio of counts.
Comparison 1 Hydroxyurea versus placebo for participants with sickle cell disease, Outcome 42 Signs of organ damage ‐ change from baseline in spleen volume (cm3).
Comparison 1 Hydroxyurea versus placebo for participants with sickle cell disease, Outcome 43 Signs of organ damage ‐ change from baseline in creatinine (mg/L).
Comparison 1 Hydroxyurea versus placebo for participants with sickle cell disease, Outcome 44 Signs of organ damage ‐ change from baseline in Schwartz GFR.
Comparison 1 Hydroxyurea versus placebo for participants with sickle cell disease, Outcome 45 Signs of organ damage ‐ change from baseline in cystatin C.
Comparison 1 Hydroxyurea versus placebo for participants with sickle cell disease, Outcome 46 Signs of organ damage ‐ change from baseline in urine osmolality.
Comparison 1 Hydroxyurea versus placebo for participants with sickle cell disease, Outcome 47 Signs of organ damage ‐ change from baseline in urine pH.
Comparison 1 Hydroxyurea versus placebo for participants with sickle cell disease, Outcome 48 Signs of organ damage ‐ change from baseline in urine‐specific gravity.
Comparison 1 Hydroxyurea versus placebo for participants with sickle cell disease, Outcome 49 Signs of organ damage ‐ change from baseline in total kidney volume.
Comparison 1 Hydroxyurea versus placebo for participants with sickle cell disease, Outcome 50 Signs of organ damage ‐ change from baseline in TCD ultrasound velocity (time‐averaged mean maximum velocity).
Comparison 1 Hydroxyurea versus placebo for participants with sickle cell disease, Outcome 51 Signs of organ damage ‐ change from baseline in CNS measures.
Comparison 1 Hydroxyurea versus placebo for participants with sickle cell disease, Outcome 52 Proportion of participants experiencing adverse events and toxicity.
Comparison 2 Hydroxyurea and phlebotomy compared to transfusion and chelation for participants with SCD and risk of stroke, Outcome 1 Proportion experiencing pain.
Comparison 2 Hydroxyurea and phlebotomy compared to transfusion and chelation for participants with SCD and risk of stroke, Outcome 2 Proportion experiencing life‐threatening events during study.
Comparison 2 Hydroxyurea and phlebotomy compared to transfusion and chelation for participants with SCD and risk of stroke, Outcome 3 Deaths during the study.
Comparison 2 Hydroxyurea and phlebotomy compared to transfusion and chelation for participants with SCD and risk of stroke, Outcome 4 Change from baseline in fetal haemoglobin (HbF %).
Comparison 2 Hydroxyurea and phlebotomy compared to transfusion and chelation for participants with SCD and risk of stroke, Outcome 5 Change from baseline in absolute neutrophil count (x10⁹/L).
Comparison 2 Hydroxyurea and phlebotomy compared to transfusion and chelation for participants with SCD and risk of stroke, Outcome 6 Change from baseline in mean corpuscular volume (fL).
Comparison 2 Hydroxyurea and phlebotomy compared to transfusion and chelation for participants with SCD and risk of stroke, Outcome 7 Change from baseline in sickle haemoglobin (%).
Comparison 2 Hydroxyurea and phlebotomy compared to transfusion and chelation for participants with SCD and risk of stroke, Outcome 8 Change from baseline in haemoglobin (g/L).
Comparison 2 Hydroxyurea and phlebotomy compared to transfusion and chelation for participants with SCD and risk of stroke, Outcome 9 Change from baseline in absolute reticulocyte count (10⁹ / L).
Comparison 2 Hydroxyurea and phlebotomy compared to transfusion and chelation for participants with SCD and risk of stroke, Outcome 10 Change from baseline in white blood count (10⁹ / L).
Comparison 2 Hydroxyurea and phlebotomy compared to transfusion and chelation for participants with SCD and risk of stroke, Outcome 11 Change from baseline in platelets (10⁹ / L).
Comparison 2 Hydroxyurea and phlebotomy compared to transfusion and chelation for participants with SCD and risk of stroke, Outcome 12 Change from baseline in total bilirubin (mg/L).
Comparison 2 Hydroxyurea and phlebotomy compared to transfusion and chelation for participants with SCD and risk of stroke, Outcome 13 Change from baseline in liver iron concentration.
Comparison 2 Hydroxyurea and phlebotomy compared to transfusion and chelation for participants with SCD and risk of stroke, Outcome 14 Change from baseline in serum ferritin (ng/mL).
Comparison 2 Hydroxyurea and phlebotomy compared to transfusion and chelation for participants with SCD and risk of stroke, Outcome 15 Change from baseline in lactate dehydrogenase (U/L).
Comparison 2 Hydroxyurea and phlebotomy compared to transfusion and chelation for participants with SCD and risk of stroke, Outcome 16 Signs of organ damage ‐ CNS measures at the end of the study.
Comparison 2 Hydroxyurea and phlebotomy compared to transfusion and chelation for participants with SCD and risk of stroke, Outcome 17 Proportion of participants experiencing non‐neurological adverse events and toxicity.
Comparison 3 Hydroxyurea compared to observation for participants with SCD and risk of stroke, Outcome 1 Proportion experiencing life‐threatening events during the study.
Comparison 3 Hydroxyurea compared to observation for participants with SCD and risk of stroke, Outcome 2 Signs of organ damage ‐ proportion of participants with a change in CNS measures.
Comparison 3 Hydroxyurea compared to observation for participants with SCD and risk of stroke, Outcome 3 Signs of organ damage ‐ change from baseline in CNS measures.
Comparison 3 Hydroxyurea compared to observation for participants with SCD and risk of stroke, Outcome 4 Adverse events and toxicity.
| Hydroxyurea compared with placebo for sickle cell disease | ||||||
| Patient or population: adults and children with sickle cell disease Settings: outpatients Intervention: hydroxyurea Comparison: placebo | ||||||
| Outcomes | Illustrative comparative risks* (95% CI) | Relative effect | No of Participants | Quality of the evidence | Comments | |
| Assumed risk | Corresponding risk | |||||
| Placebo | Hydroxyurea | |||||
| Pain alteration1 Follow‐up: 6 ‐ 24 months | See comment | See comment | NA | 577 (4 studies)2 | ⊕⊕⊕⊝ | All studies showed a significant advantage to hydroxyurea compared to placebo (different measures of pain alteration presented)1. |
| Life‐threatening illness Follow‐up: 6 ‐ 24 months | See comment | See comment | NA | 552 (3 studies) | ⊕⊕⊕⊝ | Significantly fewer occurrences of ACS (2 studies) and transfusions (3 studies) on hydroxyurea compared to placebo. No significant differences in terms of stroke, hepatic or splenic sequestration (two studies). |
| Death during the study (all deaths) Follow‐up: 6 ‐ 24 months | 26 per 1000 | 10 per 1000 (0 to 51 per 1000) | RR 0.39 (0.08 to 1.96) | 577 (4 studies)2 | ⊕⊕⊕⊝ | There was also no significant difference between groups in terms of deaths related to SCD. |
| Measures of HbF (%) Follow‐up: 6 ‐ 24 months | See comment | See comment | NA | 577 (4 studies)2 | ⊕⊕⊕⊝ | There was a significant increase in HbF(%) in the hydroxyurea group compared to the placebo group in all studies (different measures presented)3. |
| Measures of ANC Follow‐up: 6 ‐ 24 months | See comment | See comment | NA | 517 (3 studies)2 | ⊕⊕⊕⊝ | There was a significant decrease in ANC in the hydroxyurea group compared to the placebo group in all studies (different measures presented)3. |
| Quality of life: 'Health Status Survey' the 'Profile of Mood States' and the 'Ladder of Life' Follow‐up: 24 months | See comment | See comment | NA | up to 277 (1 study) | ⊕⊕⊝⊝ low5,6 | No significant difference in terms of any domain of any scale except for pain recall at 18 months (MD 0.70, 95% CI 0.11 to 1.29, P = 0.02)4. |
| Adverse events or toxicity: differences in rates of specific adverse events Follow‐up: 6 ‐ 24 months | See comment | See comment | NA | 577 (4 studies)2 | ⊕⊕⊝⊝ low5,7 | Significantly fewer events of dactylitis and gastroenteritis on hydroxyurea compared to placebo. No significant differences between groups in terms of all other events. |
| The basis for the assumed risk is the event rate in the control group unless otherwise stated in the comments and footnotes. The corresponding risk (and its 95% confidence interval) is based on the assumed risk in the comparison group and the relative effect of the intervention (and its 95% CI). | ||||||
| GRADE Working Group grades of evidence | ||||||
|
| ||||||
| Hydroxyurea and phlebotomy compared to transfusion and chelation for people with sickle cell disease and an increased risk of stroke | ||||||
| Patient or population: adults and children with sickle cell disease and an increased risk of stroke Settings: outpatients Intervention: hydroxyurea and phlebotomy Comparison: transfusion and chelation | ||||||
| Outcomes | Illustrative comparative risks* (95% CI) | Relative effect | No of Participants | Quality of the evidence | Comments | |
| Assumed risk | Corresponding risk | |||||
| Transfusion and chelation | Hydroxyurea and phlebotomy | |||||
| Pain alteration: proportion experiencing serious VOC or sickle‐related pain events Follow‐up: 24 to 30 months | 213 per 1000 | 718 per 1000 (339 to 1000 per 1000) | RR 3.37 (95% CI 1.59 to 7.11) | 254 (2 studies) | ⊕⊕⊝⊝ low4,5 | No significant difference between treatment groups in terms of all pain events (serious and non‐serious) in 1 study (RR 1.03, 95% CI 0.81 to 1.30). |
| Life‐threatening illness Follow‐up: 24 ‐ 30 months | See comment | See comment | NA | 254 (2 studies) | ⊕⊕⊕⊝ | No significant difference between groups in life‐threatening neurological events, hepatobiliary disease and splenic sequestration; significantly more ACS and infections and infestations in the hydroxyurea and phlebotomy compared to the transfusion and chelation group. |
| Death during the study (all deaths) Follow‐up: 24 ‐ 30 months | 1 death occurred in the transfusion and chelation group of 1 study1. | 1 death occurred in the hydroxyurea and phlebotomy group of 1 study1. | RR 0.99 (95% CI 0.06 to 15.42) | 254 (2 studies) | ⊕⊕⊝⊝ low4,5 | |
| Measures of HbF (%) Follow‐up: 24 to 30 months | See comment | See comment | NA | 254 (2 studies) | ⊕⊕⊕⊝ | There was a significant increase in HbF(%) in the hydroxyurea and phlebotomy group compared to the transfusion and chelation group for both studies (different measures presented)2. |
| Measures of ANC Follow‐up: 24 to 30 months | See comment | See comment | NA | 254 (2 studies) | ⊕⊕⊕⊝ | There was a significant decrease in ANC in the hydroxyurea and phlebotomy group compared to the transfusion and chelation group for both studies (different measures presented)2. |
| Quality of life | Outcome not reported3 | NA | ||||
| Adverse events or toxicity: differences in rates of specific adverse events | See comment | See comment | NA | 254 (2 studies) | ⊕⊕⊝⊝ low4,6 | There was a statistically significant difference in terms of immune disorders (more in transfusion and chelation group), reticulocytopenia, neutropenia and anaemia (more in hydroxyurea and phlebotomy group) in 1 study and the rate of adverse events was balanced across groups in the other study. |
| The basis for the assumed risk is the event rate in the control group unless otherwise stated in the comments and footnotes. The corresponding risk (and its 95% confidence interval) is based on the assumed risk in the comparison group and the relative effect of the intervention (and its 95% CI). | ||||||
| GRADE Working Group grades of evidence | ||||||
| 1. Absolute data presented for number of deaths as the confidence interval of the relative effect very large due to the small number of events. | ||||||
| Hydroxyurea compared with observation for people with sickle cell disease and an increased risk of stroke | ||||||
| Patient or population: adults and children with sickle cell disease and an increased risk of stroke Settings: outpatients Intervention: hydroxyurea Comparison: observation | ||||||
| Outcomes | Illustrative comparative risks* (95% CI) | Relative effect | No of Participants | Quality of the evidence | Comments | |
| Assumed risk | Corresponding risk | |||||
| Observation | Hydroxyurea | |||||
| Pain alteration Follow‐up: NA | Outcome not reported | NA | ||||
| Life‐threatening illness Follow‐up: 15 months | See comment | See comment | NA | 22 (1 study) | ⊕⊝⊝⊝ | No significant differences between groups in terms of ACS, blood transfusions required or acute splenic sequestration. |
| Death during the study Follow‐up: 15 months | No deaths occurred | No deaths occurred | NA | 22 (1 study) | ⊕⊝⊝⊝ | |
| Measures of HbF Follow‐up: 15 months | See comment | See comment | NA | 22 (1 study) | ⊕⊝⊝⊝ | There was a significant increase in HbF in the hydroxyurea group compared to the observation group1. |
| Measures of ANC Follow‐up: 15 months | See comment | See comment | NA | 22 (1 study) | ⊕⊝⊝⊝ | There was a significant decrease in ANC in the hydroxyurea group compared to the observation group1. |
| Quality of Life Follow‐up: NA | Outcome not reported2 | NA | ||||
| Adverse events or toxicity: differences in rates of specific adverse events Follow‐up: 15 months | See comment | See comment | NA | 22 (1 study) | ⊕⊝⊝⊝ | No significant differences between groups in terms of transient neutropenia, reticulocytopenia, parasite infestation, headache and dizziness. |
| The basis for the assumed risk is the event rate in the control group unless otherwise stated in the comments and footnotes. The corresponding risk (and its 95% confidence interval) is based on the assumed risk in the comparison group and the relative effect of the intervention (and its 95% CI). | ||||||
| GRADE Working Group grades of evidence | ||||||
| 1. Median values reported so data cannot be entered into analysis. | ||||||
| Hydroxyurea compared with no hydroxyurea for sickle cell disease | ||||||
| Patient or population: adults and children with sickle cell disease Settings: outpatients Intervention: hydroxyurea Comparison: no hydroxyurea | ||||||
| Outcomes | Illustrative comparative risks* (95% CI) | Relative effect | No of Participants | Quality of the evidence | Comments | |
| Assumed risk | Corresponding risk | |||||
| No hydroxyurea | Hydroxyurea | |||||
| Pain alteration Follow‐up: NA | Outcome not reported | NA | ||||
| Life‐threatening illness Follow‐up: NA | Outcome not reported | NA | ||||
| Death during the study Follow‐up: 11 months | No deaths occurred | No deaths occurred | NA | up to 44 (1 study)1 | ⊕⊝⊝⊝ | |
| Measures of HbF Follow‐up: 24 weeks | See comment | See comment | NA | up to 44 (1 study)1 | ⊕⊝⊝⊝ | There was a significant increase in HbF in the hydroxyurea group compared to the no hydroxyurea group1. |
| Measures of ANC Follow‐up: 24 weeks | See comment | See comment | NA | up to 44 (1 study)1 | ⊕⊝⊝⊝ | There was no significant difference in ANC between treatment groups1. |
| Quality of life Follow‐up: NA | Outcome not reported | NA | ||||
| Adverse events or toxicity Follow‐up: 11 months | See comment | See comment | NA | up to 44 (1 study)1 | ⊕⊝⊝⊝ | Vaso‐occlusive pain crises, headache / migraine, upper respiratory infection, skin rash diarrhoea and abdominal pain were the most common adverse events during the trial and these events were evenly distributed across treatment groups (not separated by group). |
| The basis for the assumed risk is the event rate in the control group unless otherwise stated in the comments and footnotes. The corresponding risk (and its 95% confidence interval) is based on the assumed risk in the comparison group and the relative effect of the intervention (and its 95% CI). | ||||||
| GRADE Working Group grades of evidence. | ||||||
| 1. Due to the factorial design of the study (22 participants randomised to a treatment arm including hydroxyurea and 22 randomised to a treatment arm without hydroxyurea), results are not entered into analysis. All results of this trial are considered exploratory (CHAMPS 2011). | ||||||
| Hydroxyurea | Placebo | P value | |||
| Baseline | 18 months | Baseline | 18 months | ||
| Clinical events (number of events per participant per year) | |||||
| VOC | 12.13 (8.56) | 0.60 (1.37) | 11.46 (3.01) | 10.2 (3.24) | < 0.001 |
| Blood transfusions | 2.43 (0.69) | 0.13 (0.43) | 2.13 (0.98) | 1.98 (0.82) | < 0.001 |
| Hospitalisations | 10.13 (6.56) | 0.70 (1.28) | 9.56 (2.91) | 9.59 (2.94) | < 0.001 |
| Haematological parameters | |||||
| Hb (g/dL) | 8.1 (0.68) | 9.29 (0.55) | 8.21 (0.68) | 7.90 (0.58) | < 0.001 |
| HbF(%) | 19.8 (0.9) | 24 (5.9) | 19.21 (6.37) | 18.92 (5.77) | < 0.001 |
| Reticulocytes (x10⁵ /mm³) | 1.83 (0.96) | 1.15 (0.1) | 1.73 (0.49) | 1.81 (0.67) | < 0.001 |
| Leucocytes (x10³ /mm³) | 7.36 (6.03) | 6.54 (5.54) | 7.26 (4.91) | 7.38 (2.85) | < 0.001 |
| Platelets (x10³ /mm³) | 1.78 (0.26) | 2.01 (0.18) | 1.91 (0.21) | 2.06 (0.26) | 0.28 |
| RBC (x10⁶ /mm³) | 2.89 (0.57) | 1.98 (0.22) | 1.84 (0.47) | 3.11 (0.20) | 0.05 |
| Total bilirubin (mg/dL) | 2.32 (1.42) | 1.10 (0.42) | 2.27 (1.28) | 2.71 (0.93) | < 0.001 |
| Values are mean (standard deviation) P values are calculated using independent t‐test. Hb: haemoglobin | |||||
| Baseline | Hyrdoxyurea | Placebo | P value | ||
| 2 years | Baseline | 2 years | 2 years | ||
| WBC (10⁹/L) | 12.6 (3.4) | 9.9 (3.1) | 12.3 (3.2) | 12.2 (2.8) | 0.0001 |
| Neutrophils (10⁹/L) | 6.9 (2.4) | 4.9 (2.0) | 6.7 (2.3) | 6.4 (2.0) | 0.0001 |
| Platelets (10⁹/L) | 468 (147) | 399 (124) | 457 (130) | 423 (122) | 0.12 |
| Hb (g/dL) | 8.5 (1.4) | 9.1 (1.5) | 8.5 (1.2) | 8.5 (1.3) | 0.0009 |
| PCV (%) | 24.9 (4.4) | 27 (5) | 25.2 (4.0) | 25.1 (4.2) | 0.0007 |
| MCV (fl) | 94 (9) | 103 (14) | 93 (9) | 93 (9) | 0.0001 |
| Reticulocytes (10⁹/L) | 327 (98) | 231 (100) | 325 (94) | 300 (99) | 0.0001 |
| HbF (%) | 5 (3.5) | 8.6 (6.8) | 5.2 (3.4) | 4.7 (3.3) | 0.0001 |
| F cells (%) | 33 (17) | 48 (23) | 33 (17) | 35 (18) | 0.0001 |
| F reticulocytes | 15 (8) | 17 (9) | 15 (8) | 15 (7) | 0.0036 |
| Dense cells (%) | 14 (6) | 11 (6) | 14 (7) | 13 (7) | 0.004 |
| Creatinine (mg/dL) | 0.9 (0.3) | 1.0 (0.5) | 0.9 (0.2) | 1.0 (0.5) | 0.64 |
| Total bilirubin (mg/dL) | 3.7 (2.4) | 2.9 (2.5) | 3.7 (2.5) | 4.2 (4.6) | 0.004 |
| Direct bilirubin (mg/dL) | 0.5 (0.3) | 0.4 (0.3) | 0.5 (0.4) | 0.7 (2.2) | 0.08 |
| Aspartate aminotransferase | 44 (23) | 39 (20) | 41 (21) | 43 (27) | 0.16 |
| Alkaline phosphatase | 120 (59) | 117 (48) | 119 (67) | 119 (71) | 0.71 |
| Values are mean (standard deviation) P values are calculated using independent t‐test. Hb: haemoglobin | |||||
| Outcome | Hydroxyurea and phlebotomy group (n = 67) | Transfusions and chelation group (n = 66) | P value |
| HbF (%) | 17.9 (92 to 22.9) | ‐0.2 (‐0.8 to 0.4) | < 0.001 |
| ANC (x10⁹/L) | ‐3.3 (‐5.1 to ‐1.4) | 0.8 (‐1.3 to 2.4) | < 0.001 |
| Hb (g /dL) | 0.0 (‐0.7 to 0.7) | 0.0 (‐0.5 to 0.6) | 0.898 |
| HbA (%) | ‐50.9 (‐66.8 to ‐33.7) | 0.0 (‐12.7 to 6.7) | < 0.001 |
| HbS (%) | 35.0 (21.7 to 46.2) | 0.3 (‐7.5 to 12.3) | < 0.001 |
| MCV (fL) | 19.5 (7.5 to 28.5) | 0.1 (‐2.0 to 2.5) | < 0.001 |
| WBC (x10⁹/L) | ‐5.4 (‐8.1 to ‐2.2) | 0.2 (‐2.0 to 2.3) | < 0.001 |
| ARC (x10⁹/L) | ‐149.1 (‐231.0 to ‐19.0) | ‐11.8 (‐88.2 to 93.2) | < 0.001 |
| Platelets (x10⁹/L) | ‐83.0 (‐171.0 to ‐8.0) | ‐28.0 (‐70.0 to 18.0) | 0.0022 |
| Total bilirubin (mg/dL) | ‐1.1 (‐1.9 to ‐0.6) | 0.4 (‐0.3 to 1.2) | < 0.001 |
| LIC (mg Fe/g) | ‐1.2 (‐2.8 to 7.2) | ‐2.2 (‐5.5 to 4.9) | 0.48888 |
| Serum ferritin (ng/mL) | ‐966.0 (‐1629.0 to 49.0) | 1159.5 (‐662.0 to 2724.0) | < 0.001 |
| LDH (U/L) | ‐67.0 (‐143.0 to 7.0) | ‐8.5 (‐74.0 to 74.0) | 0.0015 |
| ANC: absolute neutrophil count Values are median change from baseline and interquartile range. P values are calculated using Wilcoxon rank sum test. | |||
| Outcome | Hydroxyurea (n = 11) | Observation (n = 11) | P value |
| Hb (g/dL) | 1.6 | ‐0.5 | < 0.0001 |
| MCV (fL) | 8.7 | 1 | 0.0001 |
| ARC ( x10⁹/L) | 22.7 | ‐33.2 | 0.76 |
| WBC ( x10⁹/L) | ‐4.6 | 1.3 | 0.07 |
| ANC ( x10⁹/L) | ‐2.2 | 1.4 | 0.05 |
| Platelets ( x10⁹/L) | ‐76 | ‐35 | 0.56 |
| HbF (%) | 8.9 | 0.3 | 0.002 |
| Weight (kg) | 2.5 | 1.8 | 0.51 |
| Height (cm) | 6.8 | 3.8 | 0.22 |
| ANC: absolute neutrophil count Values are median change from baseline and P values are calculated using Wilcoxon rank sum test. | |||
| Pregnancy | Hydroxyurea | Placebo | |
| Patients | Normal full‐term delivery | 1 | 2 |
| Elective termination | 2 | 1 | |
| Partners of patients | Normal full‐term delivery | 2 | 0 |
| Spontaneous abortion | 1 | 0 | |
| Still pregnant | 0 | 1 | |
| TOTAL | 6 | 4 | |
| Outcome or subgroup title | No. of studies | No. of participants | Statistical method | Effect size |
| 1 Pain crises Show forest plot | 2 | Mean Difference (IV, Fixed, 95% CI) | Totals not selected | |
| 1.1 Mean annual crisis rate at 2 years (all crises) | 1 | Mean Difference (IV, Fixed, 95% CI) | ‐2.80 [‐4.74, ‐0.86] | |
| 1.2 Mean annual crisis rate at 2 years (all crises requiring hospitalisation) | 1 | Mean Difference (IV, Fixed, 95% CI) | ‐1.50 [‐2.58, ‐0.42] | |
| 1.3 Number of vaso‐occlusive crises after 18 months of treatment | 1 | Mean Difference (IV, Fixed, 95% CI) | ‐9.6 [‐10.86, ‐8.34] | |
| 2 Proportion experiencing pain Show forest plot | 1 | Risk Ratio (M‐H, Fixed, 95% CI) | Totals not selected | |
| 3 Proportion experiencing life threatening events during study Show forest plot | 2 | Risk Ratio (M‐H, Fixed, 95% CI) | Subtotals only | |
| 3.1 Acute chest syndrome | 2 | 492 | Risk Ratio (M‐H, Fixed, 95% CI) | 0.43 [0.29, 0.63] |
| 3.2 Hepatic sequestration | 1 | 299 | Risk Ratio (M‐H, Fixed, 95% CI) | 0.32 [0.03, 3.06] |
| 3.3 Stroke | 2 | 492 | Risk Ratio (M‐H, Fixed, 95% CI) | 0.54 [0.12, 2.53] |
| 3.4 Patients transfused | 2 | 492 | Risk Ratio (M‐H, Fixed, 95% CI) | 0.66 [0.52, 0.82] |
| 3.5 Splenic sequestration | 1 | 193 | Risk Ratio (M‐H, Fixed, 95% CI) | 0.90 [0.36, 2.23] |
| 4 Number of life‐threatening events during study Show forest plot | 1 | Mean Difference (IV, Fixed, 95% CI) | Totals not selected | |
| 4.1 Blood transfusions | 1 | Mean Difference (IV, Fixed, 95% CI) | ‐1.85 [‐2.18, ‐1.52] | |
| 4.2 Hospitalisations | 1 | Mean Difference (IV, Fixed, 95% CI) | ‐8.89 [‐10.04, ‐7.74] | |
| 4.3 Duration of hospitalisation (days) | 1 | Mean Difference (IV, Fixed, 95% CI) | ‐2.00 [‐4.87, ‐3.13] | |
| 5 Deaths during the study Show forest plot | 3 | Risk Ratio (M‐H, Fixed, 95% CI) | Subtotals only | |
| 5.1 All deaths | 3 | 552 | Risk Ratio (M‐H, Fixed, 95% CI) | 0.39 [0.08, 1.96] |
| 5.2 Deaths related to SCD | 3 | 552 | Risk Ratio (M‐H, Fixed, 95% CI) | 0.48 [0.09, 2.60] |
| 6 Change from baseline in fetal haemoglobin (HbF %) Show forest plot | 1 | Mean Difference (Fixed, 95% CI) | Totals not selected | |
| 7 Fetal haemoglobin (HbF %) after treatment Show forest plot | 2 | 359 | Mean Difference (IV, Fixed, 95% CI) | 4.07 [2.95, 5.18] |
| 8 Change from baseline in absolute neutrophil count (x10³ per μL) Show forest plot | 1 | Mean Difference (Fixed, 95% CI) | Totals not selected | |
| 9 Neutrophil response (10⁹/L) after treatment Show forest plot | 1 | Mean Difference (IV, Fixed, 95% CI) | Totals not selected | |
| 9.1 Neutrophils (x10 9/l) at 10 weeks | 1 | Mean Difference (IV, Fixed, 95% CI) | ‐1.90 [‐2.51, ‐1.29] | |
| 9.2 Neutrophils (x10 9/l) at 2 years | 1 | Mean Difference (IV, Fixed, 95% CI) | ‐1.50 [‐2.01, ‐0.99] | |
| 10 Change from baseline in haemoglobin (g/L) Show forest plot | 1 | Mean Difference (Fixed, 95% CI) | Totals not selected | |
| 11 Change from baseline in m corpuscular volume (fL) Show forest plot | 1 | Mean Difference (Fixed, 95% CI) | Totals not selected | |
| 12 Change from baseline in white blood cells (x10³ per μL) Show forest plot | 1 | Mean Difference (Fixed, 95% CI) | Totals not selected | |
| 13 Change from baseline in absolute reticulocyte count (x10³ per μL) Show forest plot | 1 | Mean Difference (Fixed, 95% CI) | Totals not selected | |
| 14 Change from baseline in reticulocytes (%) Show forest plot | 1 | Mean Difference (Fixed, 95% CI) | Totals not selected | |
| 15 Change from baseline in total bilirubin (mg/L) Show forest plot | 1 | Mean Difference (Fixed, 95% CI) | Totals not selected | |
| 16 Change from baseline in platelet count (x10³ per μL) Show forest plot | 1 | Mean Difference (Fixed, 95% CI) | Totals not selected | |
| 17 Haemoglobin (g/dL) Show forest plot | 2 | Mean Difference (IV, Fixed, 95% CI) | Subtotals only | |
| 17.1 At 10 weeks | 1 | 299 | Mean Difference (IV, Fixed, 95% CI) | 0.5 [0.19, 0.81] |
| 17.2 At the end of the study | 2 | 359 | Mean Difference (IV, Fixed, 95% CI) | 1.04 [0.82, 1.25] |
| 18 Mean corpuscular volume (fL) Show forest plot | 1 | Mean Difference (IV, Fixed, 95% CI) | Totals not selected | |
| 18.1 At 10 weeks | 1 | Mean Difference (IV, Fixed, 95% CI) | 12.30 [9.69, 14.91] | |
| 18.2 At 2 years | 1 | Mean Difference (IV, Fixed, 95% CI) | 10.0 [7.34, 12.66] | |
| 19 Total bilirubin (mg/L) Show forest plot | 2 | Mean Difference (IV, Fixed, 95% CI) | Subtotals only | |
| 19.1 At the end of the study | 2 | 359 | Mean Difference (IV, Fixed, 95% CI) | ‐1.56 [‐1.90, ‐1.23] |
| 20 Reticulocytes Show forest plot | 2 | Mean Difference (IV, Fixed, 95% CI) | Totals not selected | |
| 20.1 Reticulocytes (10⁵/mm³) at 18 months | 1 | Mean Difference (IV, Fixed, 95% CI) | ‐0.66 [‐0.90, ‐0.42] | |
| 20.2 Reticulocytes (10⁹/L) at 10 weeks | 1 | Mean Difference (IV, Fixed, 95% CI) | ‐130.0 [‐152.17, ‐107.83] | |
| 20.3 Reticulocytes (10⁹/L) at 2 years | 1 | Mean Difference (IV, Fixed, 95% CI) | ‐69.0 [‐91.56, ‐46.44] | |
| 21 Platelet count Show forest plot | 2 | Mean Difference (IV, Fixed, 95% CI) | Totals not selected | |
| 21.1 Platelet count (10³/mm³) at 18 months | 1 | Mean Difference (IV, Fixed, 95% CI) | ‐0.05 [‐0.16, 0.06] | |
| 21.2 Platelet count (x10⁹/L) at 10 weeks | 1 | Mean Difference (IV, Fixed, 95% CI) | ‐35.0 [‐75.19, 5.19] | |
| 21.3 Platelet count (x10⁹/L) at 2 years | 1 | Mean Difference (IV, Fixed, 95% CI) | ‐24.0 [‐51.88, 3.88] | |
| 22 Packed cell volume Show forest plot | 1 | Mean Difference (IV, Fixed, 95% CI) | Totals not selected | |
| 22.1 Packed cell volume (%) at 2 years | 1 | Mean Difference (IV, Fixed, 95% CI) | 1.90 [0.85, 2.95] | |
| 23 F reticulocytes Show forest plot | 1 | Mean Difference (IV, Fixed, 95% CI) | Totals not selected | |
| 23.1 F reticulocytes at 2 years | 1 | Mean Difference (IV, Fixed, 95% CI) | 2.0 [0.18, 3.82] | |
| 24 F cells Show forest plot | 1 | Mean Difference (IV, Fixed, 95% CI) | Totals not selected | |
| 24.1 F cells (%) at 2 years | 1 | Mean Difference (IV, Fixed, 95% CI) | 13.0 [8.33, 17.67] | |
| 25 Red blood count Show forest plot | 1 | Mean Difference (IV, Fixed, 95% CI) | Totals not selected | |
| 25.1 Red blood count (10⁶/mm³) at 18 months | 1 | Mean Difference (IV, Fixed, 95% CI) | ‐1.13 [‐1.24, ‐1.02] | |
| 26 White blood cells Show forest plot | 1 | Mean Difference (IV, Fixed, 95% CI) | Totals not selected | |
| 26.1 White blood cells (109/L) at 2 years | 1 | Mean Difference (IV, Fixed, 95% CI) | ‐2.30 [‐2.97, ‐1.63] | |
| 27 Dense cells Show forest plot | 1 | Mean Difference (IV, Fixed, 95% CI) | Totals not selected | |
| 27.1 Dense cells (%) at 2 years | 1 | Mean Difference (IV, Fixed, 95% CI) | ‐2.0 [‐3.48, ‐0.52] | |
| 28 Leucocytes Show forest plot | 1 | Mean Difference (IV, Fixed, 95% CI) | Totals not selected | |
| 28.1 Leucocytes (10³/mm³) at 18 months | 1 | Mean Difference (IV, Fixed, 95% CI) | ‐0.84 [‐3.07, 1.39] | |
| 29 Creatinine Show forest plot | 1 | Mean Difference (IV, Fixed, 95% CI) | Totals not selected | |
| 29.1 Creatinine (mg/dL) at 2 years | 1 | Mean Difference (IV, Fixed, 95% CI) | 0.0 [‐0.11, 0.11] | |
| 30 Aspartate aminotransferase Show forest plot | 1 | Mean Difference (IV, Fixed, 95% CI) | Totals not selected | |
| 30.1 Aspartate aminotransferase at 2 years | 1 | Mean Difference (IV, Fixed, 95% CI) | ‐4.0 [‐9.40, 1.40] | |
| 31 Alkaline phosphatase Show forest plot | 1 | Mean Difference (IV, Fixed, 95% CI) | Totals not selected | |
| 31.1 Alkaline phosphatase at 2 years | 1 | Mean Difference (IV, Fixed, 95% CI) | ‐2.0 [‐15.78, 11.78] | |
| 32 Change from baseline in growth Show forest plot | 1 | Mean Difference (Fixed, 95% CI) | Totals not selected | |
| 32.1 Height (cm) | 1 | Mean Difference (Fixed, 95% CI) | ‐0.2 [1.00, 0.60] | |
| 32.2 Weight (kg) | 1 | Mean Difference (Fixed, 95% CI) | 0.10 [‐0.20, 0.40] | |
| 32.3 Head circumference (cm) | 1 | Mean Difference (Fixed, 95% CI) | ‐0.2 [‐0.60, 0.20] | |
| 33 Quality of life: general health perception Show forest plot | 1 | Mean Difference (IV, Fixed, 95% CI) | Totals not selected | |
| 33.1 General health perception at 6 months | 1 | Mean Difference (IV, Fixed, 95% CI) | 0.30 [‐0.54, 1.14] | |
| 33.2 General health perception at 1 year | 1 | Mean Difference (IV, Fixed, 95% CI) | 0.60 [‐0.18, 1.38] | |
| 33.3 General health perception at 18 months | 1 | Mean Difference (IV, Fixed, 95% CI) | 0.9 [0.08, 1.72] | |
| 33.4 General health perception at 2 years | 1 | Mean Difference (IV, Fixed, 95% CI) | 0.4 [‐0.51, 1.31] | |
| 34 Quality of life: pain recall Show forest plot | 1 | Mean Difference (IV, Fixed, 95% CI) | Totals not selected | |
| 34.1 Pain recall at 6 months | 1 | Mean Difference (IV, Fixed, 95% CI) | 0.40 [‐0.13, 0.93] | |
| 34.2 Pain recall at 1 year | 1 | Mean Difference (IV, Fixed, 95% CI) | 0.40 [‐0.18, 0.98] | |
| 34.3 Pain recall at 18 months | 1 | Mean Difference (IV, Fixed, 95% CI) | 0.70 [0.11, 1.29] | |
| 34.4 Pain recall at 2 years | 1 | Mean Difference (IV, Fixed, 95% CI) | 0.3 [‐0.30, 0.90] | |
| 35 Quality of life: social function Show forest plot | 1 | Mean Difference (IV, Fixed, 95% CI) | Totals not selected | |
| 35.1 Social function at 6 months | 1 | Mean Difference (IV, Fixed, 95% CI) | 0.4 [‐0.15, 0.95] | |
| 35.2 Social function at 1 year | 1 | Mean Difference (IV, Fixed, 95% CI) | 0.2 [‐0.36, 0.76] | |
| 35.3 Social function at 18 months | 1 | Mean Difference (IV, Fixed, 95% CI) | 0.40 [‐0.21, 1.01] | |
| 35.4 Social function at 2 years | 1 | Mean Difference (IV, Fixed, 95% CI) | 0.3 [‐0.31, 0.91] | |
| 36 Changes in 'Ladder of Life' Show forest plot | 1 | Mean Difference (IV, Fixed, 95% CI) | Totals not selected | |
| 36.1 Changes in 'Ladder of Life' at 6 months | 1 | Mean Difference (IV, Fixed, 95% CI) | 0.0 [‐0.52, 0.52] | |
| 36.2 Changes in 'Ladder of Life' at 1 year | 1 | Mean Difference (IV, Fixed, 95% CI) | 0.4 [‐0.15, 0.95] | |
| 36.3 Changes in 'Ladder of Life' at 18 months | 1 | Mean Difference (IV, Fixed, 95% CI) | 0.30 [‐0.22, 0.82] | |
| 36.4 Changes in 'Ladder of Life' at 2 years | 1 | Mean Difference (IV, Fixed, 95% CI) | 0.3 [‐0.23, 0.83] | |
| 37 Proportion of participants with signs of organ damage Show forest plot | 2 | Risk Ratio (M‐H, Fixed, 95% CI) | Totals not selected | |
| 37.1 New leg ulcers | 1 | Risk Ratio (M‐H, Fixed, 95% CI) | 0.85 [0.44, 1.64] | |
| 37.2 Aseptic necrosis (humerus or femur) | 1 | Risk Ratio (M‐H, Fixed, 95% CI) | 0.97 [0.39, 2.37] | |
| 37.3 Decreased spleen function at exit (compared to baseline) | 1 | Risk Ratio (M‐H, Fixed, 95% CI) | 0.72 [0.44, 1.16] | |
| 38 Signs of organ damage ‐ change from baseline in DTPA GFR Show forest plot | 1 | Mean Difference (Fixed, 95% CI) | Totals not selected | |
| 39 Signs of organ damage ‐ change from baseline in Howell‐Jolley body (per 106 red blood cells) Show forest plot | 1 | Mean Difference (Fixed, 95% CI) | Totals not selected | |
| 40 Signs of organ damage ‐ change from baseline in pitted cells (%) Show forest plot | 1 | Mean Difference (Fixed, 95% CI) | Totals not selected | |
| 41 Signs of organ damage ‐ change from baseline in spleen: liver ratio of counts Show forest plot | 1 | Mean Difference (Fixed, 95% CI) | Totals not selected | |
| 42 Signs of organ damage ‐ change from baseline in spleen volume (cm3) Show forest plot | 1 | Mean Difference (Fixed, 95% CI) | Totals not selected | |
| 43 Signs of organ damage ‐ change from baseline in creatinine (mg/L) Show forest plot | 1 | Mean Difference (Fixed, 95% CI) | Totals not selected | |
| 44 Signs of organ damage ‐ change from baseline in Schwartz GFR Show forest plot | 1 | Mean Difference (Fixed, 95% CI) | Totals not selected | |
| 44.1 Schwartz glomerular filtration rate (mL/min per 1.73m2) | 1 | Mean Difference (Fixed, 95% CI) | ‐8.0 [‐35.00, 21.00] | |
| 45 Signs of organ damage ‐ change from baseline in cystatin C Show forest plot | 1 | Mean Difference (Fixed, 95% CI) | Totals not selected | |
| 46 Signs of organ damage ‐ change from baseline in urine osmolality Show forest plot | 1 | Mean Difference (Fixed, 95% CI) | Totals not selected | |
| 47 Signs of organ damage ‐ change from baseline in urine pH Show forest plot | 1 | Mean Difference (Fixed, 95% CI) | Totals not selected | |
| 48 Signs of organ damage ‐ change from baseline in urine‐specific gravity Show forest plot | 1 | Mean Difference (Fixed, 95% CI) | Totals not selected | |
| 49 Signs of organ damage ‐ change from baseline in total kidney volume Show forest plot | 1 | Mean Difference (Fixed, 95% CI) | Totals not selected | |
| 50 Signs of organ damage ‐ change from baseline in TCD ultrasound velocity (time‐averaged mean maximum velocity) Show forest plot | 1 | Mean Difference (Fixed, 95% CI) | Totals not selected | |
| 51 Signs of organ damage ‐ change from baseline in CNS measures Show forest plot | 1 | Mean Difference (Fixed, 95% CI) | Totals not selected | |
| 51.1 Bayley Mental Development Index | 1 | Mean Difference (Fixed, 95% CI) | 3.0 [0.00, 8.00] | |
| 51.2 Bayley motor performance development index | 1 | Mean Difference (Fixed, 95% CI) | 2.0 [‐1.00, 7.00] | |
| 52 Proportion of participants experiencing adverse events and toxicity Show forest plot | 3 | Risk Ratio (M‐H, Fixed, 95% CI) | Totals not selected | |
| 52.1 hair loss at 1 or 2 visits | 1 | Risk Ratio (M‐H, Fixed, 95% CI) | 1.25 [0.69, 2.26] | |
| 52.2 hair loss at 3 or more visits | 1 | Risk Ratio (M‐H, Fixed, 95% CI) | 0.61 [0.31, 1.21] | |
| 52.3 skin rash at 1 or 2 visits | 1 | Risk Ratio (M‐H, Fixed, 95% CI) | 0.97 [0.62, 1.51] | |
| 52.4 skin rash at 3 or more visits | 1 | Risk Ratio (M‐H, Fixed, 95% CI) | 0.97 [0.58, 1.60] | |
| 52.5 fever at 1 or 2 visits | 1 | Risk Ratio (M‐H, Fixed, 95% CI) | 0.97 [0.55, 1.69] | |
| 52.6 fever at 3 or more visits | 1 | Risk Ratio (M‐H, Fixed, 95% CI) | 0.89 [0.68, 1.17] | |
| 52.7 Gastroinestinal disturbance at 1 or 2 visits | 1 | Risk Ratio (M‐H, Fixed, 95% CI) | 0.83 [0.50, 1.36] | |
| 52.8 Gastrointestinal disturbance at 3 or more visits | 1 | Risk Ratio (M‐H, Fixed, 95% CI) | 0.98 [0.74, 1.31] | |
| 52.9 Other abnormalities at 1 or 2 visits | 1 | Risk Ratio (M‐H, Fixed, 95% CI) | 0.60 [0.33, 1.11] | |
| 52.10 Other abnormalities at 3 or more visits | 1 | Risk Ratio (M‐H, Fixed, 95% CI) | 1.08 [0.83, 1.40] | |
| 52.11 Hospitalisation (for any reason) | 1 | Risk Ratio (M‐H, Fixed, 95% CI) | 0.83 [0.72, 0.96] | |
| 52.12 Dactylitis | 1 | Risk Ratio (M‐H, Fixed, 95% CI) | 0.34 [0.20, 0.58] | |
| 52.13 Priapism | 1 | Risk Ratio (M‐H, Fixed, 95% CI) | 1.52 [0.26, 8.87] | |
| 52.14 Sepsis or bacteraemia | 1 | Risk Ratio (M‐H, Fixed, 95% CI) | 0.40 [0.08, 2.03] | |
| 52.15 Splenomegaly | 1 | Risk Ratio (M‐H, Fixed, 95% CI) | 0.90 [0.61, 1.32] | |
| 52.16 Absolute Neutrophil Count < 500 | 1 | Risk Ratio (M‐H, Fixed, 95% CI) | 2.53 [0.50, 12.71] | |
| 52.17 Absolute Neutrophil 500 ‐ 1250 | 1 | Risk Ratio (M‐H, Fixed, 95% CI) | 2.53 [1.58, 4.03] | |
| 52.18 Thrombocytopaenia | 1 | Risk Ratio (M‐H, Fixed, 95% CI) | 1.59 [0.64, 3.92] | |
| 52.19 Alanine transaminase > 150 U/L | 1 | Risk Ratio (M‐H, Fixed, 95% CI) | 2.02 [0.19, 21.92] | |
| 52.20 Severe anaemia | 1 | Risk Ratio (M‐H, Fixed, 95% CI) | 0.51 [0.05, 5.48] | |
| 52.21 Bilirubin | 1 | Risk Ratio (M‐H, Fixed, 95% CI) | 0.34 [0.01, 8.17] | |
| 52.22 Creatinine | 1 | Risk Ratio (M‐H, Fixed, 95% CI) | 0.0 [0.0, 0.0] | |
| 52.23 Skin and subcutaneous disorders | 1 | Risk Ratio (M‐H, Fixed, 95% CI) | 0.91 [0.75, 1.10] | |
| 52.24 Splenic sequestration | 1 | Risk Ratio (M‐H, Fixed, 95% CI) | 0.90 [0.36, 2.23] | |
| 52.25 Gastroenteritis | 1 | Risk Ratio (M‐H, Fixed, 95% CI) | 0.44 [0.28, 0.71] | |
| 52.26 Nausea | 1 | Risk Ratio (M‐H, Fixed, 95% CI) | 5.0 [0.25, 99.95] | |
| 52.27 Skin Rash | 1 | Risk Ratio (M‐H, Fixed, 95% CI) | 7.0 [0.38, 129.93] | |
| Outcome or subgroup title | No. of studies | No. of participants | Statistical method | Effect size |
| 1 Proportion experiencing pain Show forest plot | 2 | Risk Ratio (M‐H, Fixed, 95% CI) | Subtotals only | |
| 1.1 Vaso‐occlusive or sickle cell‐related pain (all) | 1 | 133 | Risk Ratio (M‐H, Fixed, 95% CI) | 1.03 [0.81, 1.30] |
| 1.2 Vaso‐occlusive or sickle cell‐related pain (serious) | 2 | 254 | Risk Ratio (M‐H, Fixed, 95% CI) | 3.37 [1.59, 7.11] |
| 2 Proportion experiencing life‐threatening events during study Show forest plot | 2 | Risk Ratio (M‐H, Fixed, 95% CI) | Subtotals only | |
| 2.1 Stroke (secondary) | 1 | 133 | Risk Ratio (M‐H, Fixed, 95% CI) | 14.78 [0.86, 253.66] |
| 2.2 Transient ischaemic attack (primary) | 1 | 121 | Risk Ratio (M‐H, Fixed, 95% CI) | 1.02 [0.21, 4.84] |
| 2.3 Transient ischaemic attack (secondary) | 1 | 133 | Risk Ratio (M‐H, Fixed, 95% CI) | 0.66 [0.25, 1.74] |
| 2.4 Other neurological event (primary) | 1 | 121 | Risk Ratio (M‐H, Fixed, 95% CI) | 1.02 [0.07, 15.88] |
| 2.5 Acute chest syndrome | 2 | 254 | Risk Ratio (M‐H, Fixed, 95% CI) | 2.84 [1.25, 6.42] |
| 2.6 Infections and Infestations | 2 | 254 | Risk Ratio (M‐H, Fixed, 95% CI) | 3.65 [1.05, 12.76] |
| 2.7 Splenic sequestration or splenectomy | 2 | 254 | Risk Ratio (M‐H, Fixed, 95% CI) | 0.34 [0.01, 8.16] |
| 2.8 Hepatobiliary disease | 1 | 121 | Risk Ratio (M‐H, Fixed, 95% CI) | 1.02 [0.07, 15.88] |
| 2.9 Total with serious adverse events | 2 | 254 | Risk Ratio (M‐H, Fixed, 95% CI) | 1.93 [1.17, 3.20] |
| 2.10 Total with sickle cell related, non‐neurological adverse events | 1 | 133 | Risk Ratio (M‐H, Fixed, 95% CI) | 3.10 [1.42, 6.75] |
| 3 Deaths during the study Show forest plot | 2 | 254 | Risk Ratio (M‐H, Fixed, 95% CI) | 0.99 [0.06, 15.42] |
| 4 Change from baseline in fetal haemoglobin (HbF %) Show forest plot | 1 | Mean Difference (IV, Fixed, 95% CI) | Totals not selected | |
| 5 Change from baseline in absolute neutrophil count (x10⁹/L) Show forest plot | 1 | Mean Difference (IV, Fixed, 95% CI) | Totals not selected | |
| 6 Change from baseline in mean corpuscular volume (fL) Show forest plot | 1 | Mean Difference (IV, Fixed, 95% CI) | Totals not selected | |
| 7 Change from baseline in sickle haemoglobin (%) Show forest plot | 1 | Mean Difference (IV, Fixed, 95% CI) | Totals not selected | |
| 8 Change from baseline in haemoglobin (g/L) Show forest plot | 1 | Mean Difference (IV, Fixed, 95% CI) | Totals not selected | |
| 9 Change from baseline in absolute reticulocyte count (10⁹ / L) Show forest plot | 1 | Mean Difference (IV, Fixed, 95% CI) | Totals not selected | |
| 10 Change from baseline in white blood count (10⁹ / L) Show forest plot | 1 | Mean Difference (IV, Fixed, 95% CI) | Totals not selected | |
| 11 Change from baseline in platelets (10⁹ / L) Show forest plot | 1 | Mean Difference (IV, Fixed, 95% CI) | Totals not selected | |
| 12 Change from baseline in total bilirubin (mg/L) Show forest plot | 1 | Mean Difference (IV, Fixed, 95% CI) | Totals not selected | |
| 13 Change from baseline in liver iron concentration Show forest plot | 1 | Mean Difference (IV, Fixed, 95% CI) | Totals not selected | |
| 14 Change from baseline in serum ferritin (ng/mL) Show forest plot | 1 | Mean Difference (IV, Fixed, 95% CI) | Totals not selected | |
| 15 Change from baseline in lactate dehydrogenase (U/L) Show forest plot | 1 | Mean Difference (IV, Fixed, 95% CI) | Totals not selected | |
| 16 Signs of organ damage ‐ CNS measures at the end of the study Show forest plot | 1 | Mean Difference (IV, Fixed, 95% CI) | Totals not selected | |
| 16.1 Final TCD ultrasound velocity | 1 | Mean Difference (IV, Fixed, 95% CI) | ‐5.0 [‐9.16, ‐0.84] | |
| 17 Proportion of participants experiencing non‐neurological adverse events and toxicity Show forest plot | 1 | Risk Ratio (M‐H, Fixed, 95% CI) | Totals not selected | |
| 17.1 Infections and infestations | 1 | Risk Ratio (M‐H, Fixed, 95% CI) | 1.24 [0.89, 1.72] | |
| 17.2 Gastrointestinal disorders | 1 | Risk Ratio (M‐H, Fixed, 95% CI) | 1.16 [0.74, 1.80] | |
| 17.3 Fever | 1 | Risk Ratio (M‐H, Fixed, 95% CI) | 1.08 [0.66, 1.75] | |
| 17.4 Musculoskelatal disorders | 1 | Risk Ratio (M‐H, Fixed, 95% CI) | 1.14 [0.59, 2.20] | |
| 17.5 Immune system disorders | 1 | Risk Ratio (M‐H, Fixed, 95% CI) | 0.12 [0.02, 0.96] | |
| 17.6 Cholelithiasis | 1 | Risk Ratio (M‐H, Fixed, 95% CI) | 0.74 [0.17, 3.17] | |
| 17.7 Cholecystitis | 1 | Risk Ratio (M‐H, Fixed, 95% CI) | 1.97 [0.18, 21.21] | |
| 17.8 Asthma | 1 | Risk Ratio (M‐H, Fixed, 95% CI) | 0.74 [0.17, 3.17] | |
| 17.9 Acute chest syndrome | 1 | Risk Ratio (M‐H, Fixed, 95% CI) | 1.72 [0.53, 5.61] | |
| 17.10 Renal or urinary disorder | 1 | Risk Ratio (M‐H, Fixed, 95% CI) | 0.66 [0.11, 3.80] | |
| 17.11 Priapism | 1 | Risk Ratio (M‐H, Fixed, 95% CI) | 1.97 [0.18, 21.21] | |
| 17.12 Cathether‐related complications | 1 | Risk Ratio (M‐H, Fixed, 95% CI) | 1.48 [0.26, 8.56] | |
| 17.13 Cardiac disorder | 1 | Risk Ratio (M‐H, Fixed, 95% CI) | 0.99 [0.06, 15.42] | |
| 17.14 Hyderbilirubianemia | 1 | Risk Ratio (M‐H, Fixed, 95% CI) | 0.49 [0.24, 1.02] | |
| 17.15 Alanine transaminase increase | 1 | Risk Ratio (M‐H, Fixed, 95% CI) | 1.06 [0.55, 2.01] | |
| 17.16 Aspartate transaminase increase | 1 | Risk Ratio (M‐H, Fixed, 95% CI) | 1.38 [0.66, 2.88] | |
| 17.17 Serum creatinine increase | 1 | Risk Ratio (M‐H, Fixed, 95% CI) | 1.97 [0.51, 7.55] | |
| 17.18 Thrombocytopenia | 1 | Risk Ratio (M‐H, Fixed, 95% CI) | 6.90 [0.87, 54.51] | |
| 17.19 Reticuloctopenia | 1 | Risk Ratio (M‐H, Fixed, 95% CI) | 6.90 [2.16, 22.02] | |
| 17.20 Neutropenia | 1 | Risk Ratio (M‐H, Fixed, 95% CI) | 9.85 [1.30, 74.80] | |
| 17.21 Anaemia | 1 | Risk Ratio (M‐H, Fixed, 95% CI) | 6.57 [2.05, 21.05] | |
| 17.22 Sickle cell pain | 1 | Risk Ratio (M‐H, Fixed, 95% CI) | 1.29 [0.92, 1.82] | |
| 17.23 Sickle cell‐related events | 1 | Risk Ratio (M‐H, Fixed, 95% CI) | 1.03 [0.81, 1.30] | |
| 17.24 All adverse events | 1 | Risk Ratio (M‐H, Fixed, 95% CI) | 0.99 [0.92, 1.05] | |
| Outcome or subgroup title | No. of studies | No. of participants | Statistical method | Effect size |
| 1 Proportion experiencing life‐threatening events during the study Show forest plot | 1 | Risk Ratio (M‐H, Fixed, 95% CI) | Totals not selected | |
| 1.1 Vaso‐occlusive events | 1 | Risk Ratio (M‐H, Fixed, 95% CI) | 0.4 [0.10, 1.64] | |
| 1.2 Acute splenic sequestration | 1 | Risk Ratio (M‐H, Fixed, 95% CI) | 1.0 [0.07, 14.05] | |
| 1.3 Blood transfusions required | 1 | Risk Ratio (M‐H, Fixed, 95% CI) | 0.33 [0.04, 2.73] | |
| 2 Signs of organ damage ‐ proportion of participants with a change in CNS measures Show forest plot | 1 | Risk Ratio (M‐H, Fixed, 95% CI) | Totals not selected | |
| 2.1 Participants converting from conditional to abnormal TCD ultrasound velocity | 1 | Risk Ratio (M‐H, Fixed, 95% CI) | 0.2 [0.03, 1.45] | |
| 3 Signs of organ damage ‐ change from baseline in CNS measures Show forest plot | 1 | Mean Difference (IV, Fixed, 95% CI) | Totals not selected | |
| 3.1 TCD ultrasound velocity (time‐averaged mean maximum velocity) | 1 | Mean Difference (IV, Fixed, 95% CI) | ‐25.7 [‐45.38, ‐6.02] | |
| 4 Adverse events and toxicity Show forest plot | 1 | Risk Ratio (M‐H, Fixed, 95% CI) | Totals not selected | |
| 4.1 Dizziness | 1 | Risk Ratio (M‐H, Fixed, 95% CI) | 3.0 [0.14, 66.53] | |
| 4.2 Headaches | 1 | Risk Ratio (M‐H, Fixed, 95% CI) | 1.0 [0.07, 14.05] | |
| 4.3 Transient neutropenia | 1 | Risk Ratio (M‐H, Fixed, 95% CI) | 3.0 [0.14, 66.53] | |
| 4.4 Reticulocytopenia | 1 | Risk Ratio (M‐H, Fixed, 95% CI) | 1.0 [0.07, 14.05] | |
| 4.5 Parasite infection | 1 | Risk Ratio (M‐H, Fixed, 95% CI) | 1.0 [0.07, 14.05] | |