Tratamiento de la incontinencia fecal y la constipación en adultos con enfermedades neurológicas centrales
Appendices
Appendix 1. Additional searches performed for the previous version of this review
Additional searches were performed by the lead author for the previous version of this review, these are detailed below.
Electronic databases
The Cochrane Central Register of Controlled Trials (Issue 2, 2005), MEDLINE (January 1966 to May 2005), and EMBASE (January 1998 to May 2005) were searched in May 2005. The neurological search terms used were: central nervous system diseases, brain diseases, movement disorders, spinal cord diseases, demyelinating diseases, neurodegenerative diseases, neuromuscular diseases.
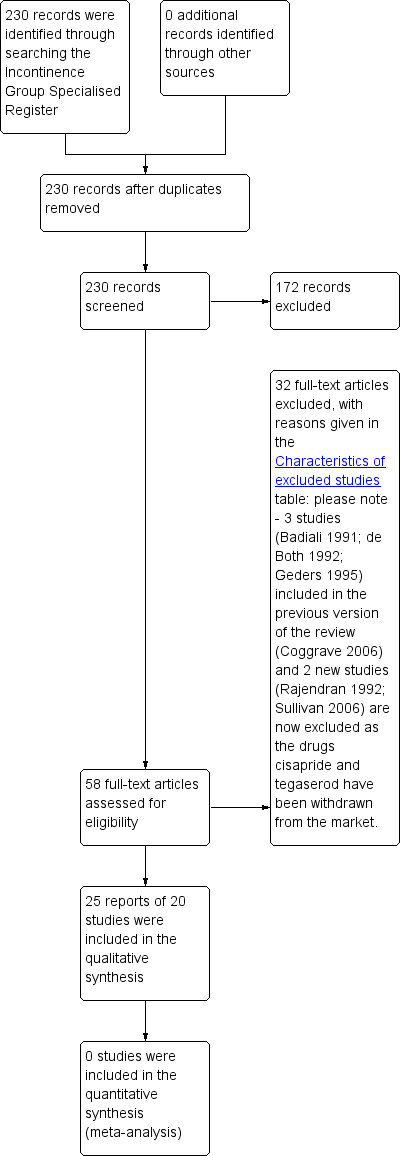
PRISMA study flow diagram.
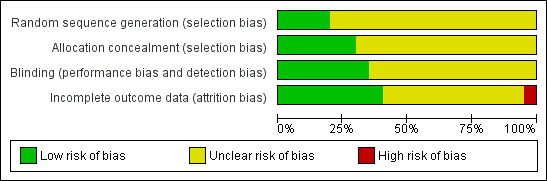
Risk of bias graph: review authors' judgements about each risk of bias item presented as percentages across all included studies.

Risk of bias summary: review authors' judgements about each risk of bias item for each included study.

Comparison 1 Active treatment versus no treatment or placebo, Outcome 1 Number of bowel motions or successful bowel care routine per week.
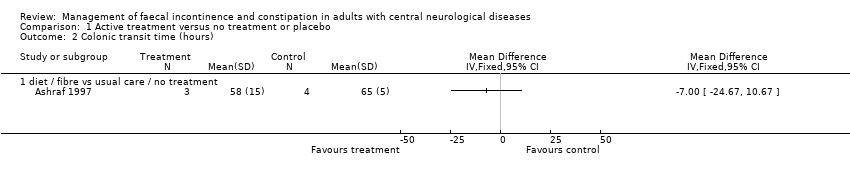
Comparison 1 Active treatment versus no treatment or placebo, Outcome 2 Colonic transit time (hours).
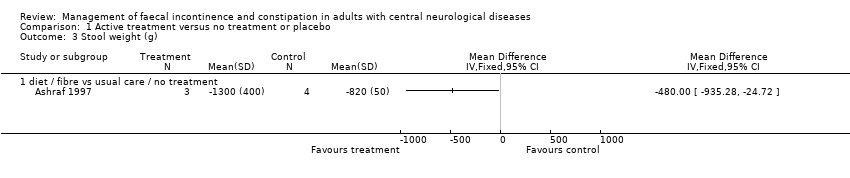
Comparison 1 Active treatment versus no treatment or placebo, Outcome 3 Stool weight (g).

Comparison 1 Active treatment versus no treatment or placebo, Outcome 4 Numbers NOT responding to treatment.
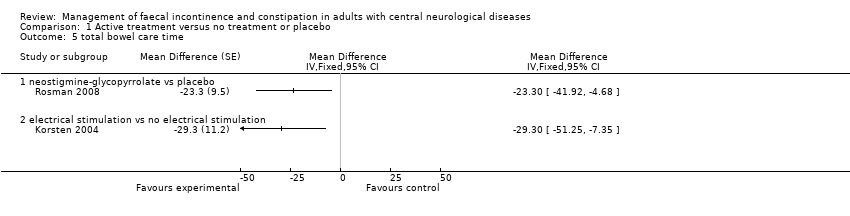
Comparison 1 Active treatment versus no treatment or placebo, Outcome 5 total bowel care time.

Comparison 2 One treatment versus another treatment, Outcome 1 Number of bowel motions or successful bowel care routines per week.
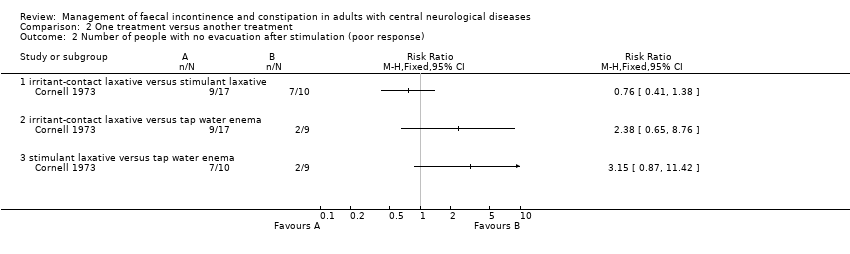
Comparison 2 One treatment versus another treatment, Outcome 2 Number of people with no evacuation after stimulation (poor response).
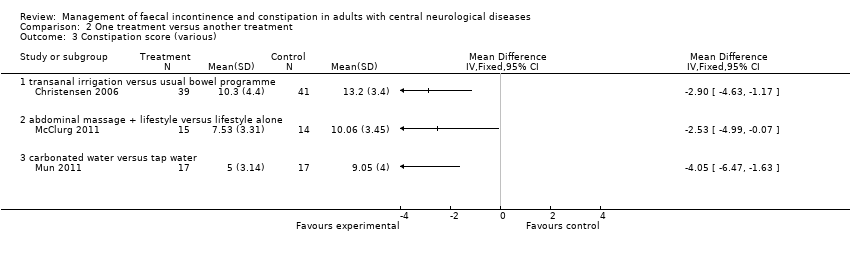
Comparison 2 One treatment versus another treatment, Outcome 3 Constipation score (various).

Comparison 2 One treatment versus another treatment, Outcome 4 Neurogenic bowel dysfunction score.

Comparison 2 One treatment versus another treatment, Outcome 5 Satisfaction with bowel care.
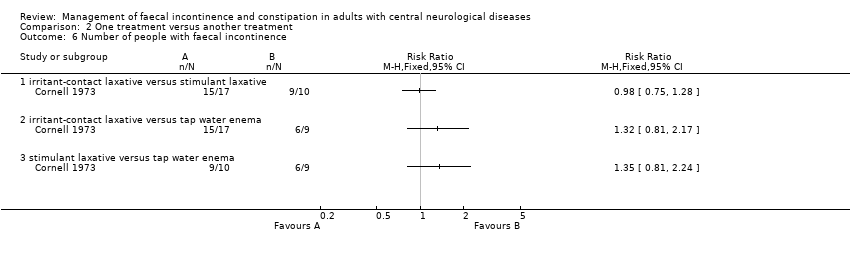
Comparison 2 One treatment versus another treatment, Outcome 6 Number of people with faecal incontinence.

Comparison 2 One treatment versus another treatment, Outcome 7 Faecal incontinence score.

Comparison 2 One treatment versus another treatment, Outcome 8 Total time for bowel care.
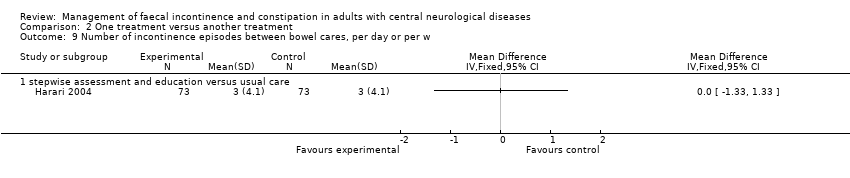
Comparison 2 One treatment versus another treatment, Outcome 9 Number of incontinence episodes between bowel cares, per day or per w.
| Outcome or subgroup title | No. of studies | No. of participants | Statistical method | Effect size |
| 1 Number of bowel motions or successful bowel care routine per week Show forest plot | 3 | Mean Difference (IV, Fixed, 95% CI) | Totals not selected | |
| 1.1 diet / fibre vs usual care / no treatment | 1 | Mean Difference (IV, Fixed, 95% CI) | 0.0 [0.0, 0.0] | |
| 1.2 massage versus usual care / no treatment | 1 | Mean Difference (IV, Fixed, 95% CI) | 0.0 [0.0, 0.0] | |
| 1.3 laxative versus placebo | 1 | Mean Difference (IV, Fixed, 95% CI) | 0.0 [0.0, 0.0] | |
| 2 Colonic transit time (hours) Show forest plot | 1 | Mean Difference (IV, Fixed, 95% CI) | Totals not selected | |
| 2.1 diet / fibre vs usual care / no treatment | 1 | Mean Difference (IV, Fixed, 95% CI) | 0.0 [0.0, 0.0] | |
| 3 Stool weight (g) Show forest plot | 1 | Mean Difference (IV, Fixed, 95% CI) | Totals not selected | |
| 3.1 diet / fibre vs usual care / no treatment | 1 | Mean Difference (IV, Fixed, 95% CI) | 0.0 [0.0, 0.0] | |
| 4 Numbers NOT responding to treatment Show forest plot | 1 | Risk Ratio (M‐H, Fixed, 95% CI) | Totals not selected | |
| 4.1 laxative versus placebo | 1 | Risk Ratio (M‐H, Fixed, 95% CI) | 0.0 [0.0, 0.0] | |
| 5 total bowel care time Show forest plot | 2 | Mean Difference (Fixed, 95% CI) | Totals not selected | |
| 5.1 neostigmine‐glycopyrrolate vs placebo | 1 | Mean Difference (Fixed, 95% CI) | 0.0 [0.0, 0.0] | |
| 5.2 electrical stimulation vs no electrical stimulation | 1 | Mean Difference (Fixed, 95% CI) | 0.0 [0.0, 0.0] | |
| Outcome or subgroup title | No. of studies | No. of participants | Statistical method | Effect size |
| 1 Number of bowel motions or successful bowel care routines per week Show forest plot | 2 | Mean Difference (IV, Fixed, 95% CI) | Totals not selected | |
| 1.1 assessment and education versus usual care | 1 | Mean Difference (IV, Fixed, 95% CI) | 0.0 [0.0, 0.0] | |
| 1.2 carbonated water versus tap water | 1 | Mean Difference (IV, Fixed, 95% CI) | 0.0 [0.0, 0.0] | |
| 2 Number of people with no evacuation after stimulation (poor response) Show forest plot | 1 | Risk Ratio (M‐H, Fixed, 95% CI) | Totals not selected | |
| 2.1 irritant‐contact laxative versus stimulant laxative | 1 | Risk Ratio (M‐H, Fixed, 95% CI) | 0.0 [0.0, 0.0] | |
| 2.2 irritant‐contact laxative versus tap water enema | 1 | Risk Ratio (M‐H, Fixed, 95% CI) | 0.0 [0.0, 0.0] | |
| 2.3 stimulant laxative versus tap water enema | 1 | Risk Ratio (M‐H, Fixed, 95% CI) | 0.0 [0.0, 0.0] | |
| 3 Constipation score (various) Show forest plot | 3 | Mean Difference (IV, Fixed, 95% CI) | Totals not selected | |
| 3.1 transanal irrigation versus usual bowel programme | 1 | Mean Difference (IV, Fixed, 95% CI) | 0.0 [0.0, 0.0] | |
| 3.2 abdominal massage + lifestyle versus lifestyle alone | 1 | Mean Difference (IV, Fixed, 95% CI) | 0.0 [0.0, 0.0] | |
| 3.3 carbonated water versus tap water | 1 | Mean Difference (IV, Fixed, 95% CI) | 0.0 [0.0, 0.0] | |
| 4 Neurogenic bowel dysfunction score Show forest plot | 2 | Mean Difference (IV, Fixed, 95% CI) | Totals not selected | |
| 4.1 transanal irrigation versus usual bowel programme | 1 | Mean Difference (IV, Fixed, 95% CI) | 0.0 [0.0, 0.0] | |
| 4.2 abdominal massage + lifestyle versus lifestyle alone | 1 | Mean Difference (IV, Fixed, 95% CI) | 0.0 [0.0, 0.0] | |
| 5 Satisfaction with bowel care Show forest plot | 1 | Mean Difference (IV, Fixed, 95% CI) | Totals not selected | |
| 5.1 transanal irrigation versus usual bowel programme | 1 | Mean Difference (IV, Fixed, 95% CI) | 0.0 [0.0, 0.0] | |
| 6 Number of people with faecal incontinence Show forest plot | 1 | Risk Ratio (M‐H, Fixed, 95% CI) | Totals not selected | |
| 6.1 irritant‐contact laxative versus stimulant laxative | 1 | Risk Ratio (M‐H, Fixed, 95% CI) | 0.0 [0.0, 0.0] | |
| 6.2 irritant‐contact laxative versus tap water enema | 1 | Risk Ratio (M‐H, Fixed, 95% CI) | 0.0 [0.0, 0.0] | |
| 6.3 stimulant laxative versus tap water enema | 1 | Risk Ratio (M‐H, Fixed, 95% CI) | 0.0 [0.0, 0.0] | |
| 7 Faecal incontinence score Show forest plot | 1 | Mean Difference (IV, Fixed, 95% CI) | Totals not selected | |
| 7.1 transanal irrigation versus usual bowel programme | 1 | Mean Difference (IV, Fixed, 95% CI) | 0.0 [0.0, 0.0] | |
| 8 Total time for bowel care Show forest plot | 1 | Mean Difference (IV, Fixed, 95% CI) | Totals not selected | |
| 8.1 transanal irrigation versus usual bowel programme | 1 | Mean Difference (IV, Fixed, 95% CI) | 0.0 [0.0, 0.0] | |
| 9 Number of incontinence episodes between bowel cares, per day or per w Show forest plot | 1 | Mean Difference (IV, Fixed, 95% CI) | Totals not selected | |
| 9.1 stepwise assessment and education versus usual care | 1 | Mean Difference (IV, Fixed, 95% CI) | 0.0 [0.0, 0.0] | |