Comunicación personalizada de riesgos para la toma de decisiones informada sobre la participación en pruebas de detección
References
References to studies included in this review
References to studies excluded from this review
References to ongoing studies
Additional references
References to other published versions of this review
Characteristics of studies
Characteristics of included studies [ordered by study ID]
Jump to:
| Methods | RCT | |
| Participants | Women over 30; breast cancer in first degree relative; resident in USA or Canada. Number of participants included in the analysis = 753. | |
| Interventions | Mailed personalised risk assessment notification and other theoretically driven (Adherence Model) materials tailored for high risk women. | |
| Outcomes | Uptake of mammography one year after baseline survey. | |
| Notes | ||
| Risk of bias | ||
| Bias | Authors' judgement | Support for judgement |
| Random sequence generation (selection bias) | Unclear risk | No information provided. |
| Allocation concealment (selection bias) | Unclear risk | No information provided. |
| Blinding of participants and personnel (performance bias) | Unclear risk | Authors do not mention blinding of participants and/or personnel. |
| Blinding of outcome assessment (detection bias) | Unclear risk | Authors do not mention blinding of outcome assessors. |
| Incomplete outcome data (attrition bias) | High risk | Significant loss to follow‐up. 22% loss in the intervention arm and 11% loss in the control arm. Incomplete data were excluded from the analysis. |
| Selective reporting (reporting bias) | Unclear risk | Study protocol was not available but all outcomes in the methods section of the study were reported. |
| Funding for the screening test | Unclear risk | No information provided. |
| Baseline comparability | High risk | Lower education levels in intervention group. |
| Measure against contamination | Low risk | Members of the same family received the same interventions. |
| Methods | RCT | |
| Participants | Breast cancer screening in high risk women (those who have first degree relatives with breast cancer diagnosed at age < 50). Number of participants included in the analysis = 163. | |
| Interventions | Telephone counselling. | |
| Outcomes | Breast cancer worry, Achievement of more accurate risk perception, Improvements in health behaviours, breast cancer screening‐ mammography and clinical breast examination; six months post intervention. | |
| Notes | Mammography adherence reported for women aged more that 40 years only. | |
| Risk of bias | ||
| Bias | Authors' judgement | Support for judgement |
| Random sequence generation (selection bias) | Unclear risk | No information provided. |
| Allocation concealment (selection bias) | Unclear risk | No information provided. |
| Blinding of participants and personnel (performance bias) | Unclear risk | Authors do not mention blinding of participants and/or personnel. |
| Blinding of outcome assessment (detection bias) | Unclear risk | Authors do not mention blinding of outcome assessors. |
| Incomplete outcome data (attrition bias) | Low risk | Intention‐to‐treat analysis done. |
| Selective reporting (reporting bias) | High risk | Study protocol was not available. Mammography adherence reported for women aged more that 40 years only. |
| Funding for the screening test | Unclear risk | No information provided. |
| Baseline comparability | Unclear risk | Baseline demographic and behavioural characteristics not mentioned separately for control and intervention arms. |
| Measure against contamination | High risk | The participants were relatives of those who were diagnosed with breast cancer. They were recruited through the index cancer patients. There may be a high chance of contamination and authors do not mention any measures taken to prevent this. |
| Methods | RCT | |
| Participants | Recruitment occurred in waiting rooms of four women’s health clinics in the Virginia Commonwealth University Health System in Richmond, Virginia, USA Women eligible for the study were:
Number of participants included in the analysis = 899. | |
| Interventions | Participants in the intervention group had 5‐year and lifetime probabilities for breast cancer using the Gail model. Information sheets for those in intervention groups provided this personalised risk detail and also addressed other traditional constructs of Health Belief Model. Nutrition and physical activity were also included. | |
| Outcomes |
| |
| Notes | ||
| Risk of bias | ||
| Bias | Authors' judgement | Support for judgement |
| Random sequence generation (selection bias) | Low risk | A biostatistician prepared stratified (by clinic) block randomisation assignments before the study. |
| Allocation concealment (selection bias) | Unclear risk | No information provided. |
| Blinding of participants and personnel (performance bias) | Unclear risk | Authors do not mention blinding of participants and/or personnel. |
| Blinding of outcome assessment (detection bias) | Unclear risk | Authors do not mention blinding of outcome assessors. |
| Incomplete outcome data (attrition bias) | Low risk | Analysis preserved the intention to treat. |
| Selective reporting (reporting bias) | Unclear risk | Study protocol was not available. All outcomes in the study methods section were reported. |
| Funding for the screening test | Low risk | Most participants had some form of medical insurance. Self pay participants in the control and intervention groups were comparable at baseline. |
| Baseline comparability | Low risk | Baseline characteristics were comparable. |
| Measure against contamination | Unclear risk | No information provided. |
| Methods | RCT | |
| Participants | Women with first degree relative with breast cancer; Seattle, USA. Number of participants included in the analysis = 317. | |
| Interventions | Individual or group‐based genetic counselling, including Gail and Claus scores. | |
| Outcomes | Interest in having BRCA tests; perception of self as appropriate candidate for tests, measured at six months. | |
| Notes | ||
| Risk of bias | ||
| Bias | Authors' judgement | Support for judgement |
| Random sequence generation (selection bias) | Unclear risk | No information provided. |
| Allocation concealment (selection bias) | Unclear risk | No information provided. |
| Blinding of participants and personnel (performance bias) | Unclear risk | The authors do not report blinding of participants and/or personnel. |
| Blinding of outcome assessment (detection bias) | Unclear risk | The authors do not report blinding of outcome assessors. |
| Incomplete outcome data (attrition bias) | Low risk | Insignificant loss to follow‐up. |
| Selective reporting (reporting bias) | Unclear risk | Study protocol was unavailable. All stated outcomes in the methods section are reported. |
| Funding for the screening test | Unclear risk | No information provided. |
| Baseline comparability | Low risk | Baseline characteristics of participants in each arm did not differ significantly. |
| Measure against contamination | High risk | The participants were relatives of those who were diagnosed with breast cancer. Some were recruited through the index cancer patients, others by newspaper advertisements. There may be a chance of contamination and authors do not mention any measures taken to prevent this. |
| Methods | RCT | |
| Participants | Sexual minority women (lesbian and bisexual women) aged 18 to 75. Participants were recruited by announcements in lesbian and gay mailing lists and organisations, newspapers at sexual minority women's community centres and Gay and Lesbian Employee network. Inclusion criteria:
| |
| Interventions | Breast cancer counselling including information on screening mammography, breast self examination, stress management and social support session. A personalised assessment of breast cancer risk based on Gail and Claus model was provided to the participants in intervention group. | |
| Outcomes | Outcomes measured at 6 and 24 months were:
| |
| Notes | Data could not be used in our analysis, but study reports increase in screening uptake in those aged above 40 in the intervention group. Perceived risk and the anxiety associated with breast cancer decreased significantly in the intervention group. | |
| Risk of bias | ||
| Bias | Authors' judgement | Support for judgement |
| Random sequence generation (selection bias) | Unclear risk | No information provided. |
| Allocation concealment (selection bias) | Unclear risk | No information provided. |
| Blinding of participants and personnel (performance bias) | Unclear risk | The authors do not report blinding of participants and/or personnel. |
| Blinding of outcome assessment (detection bias) | Unclear risk | The authors do not report blinding of outcome assessors. |
| Incomplete outcome data (attrition bias) | Low risk | Low drop out rate in the study which is not significant. Those who dropped out of the study did not differ significantly in baseline characteristics. |
| Selective reporting (reporting bias) | High risk | Study protocol was not available. Uptake selectively reported for participants above age of 40. No mention of number of participants in these groups. |
| Funding for the screening test | Unclear risk | No information provided. |
| Baseline comparability | Low risk | Participants were comparable at baseline. |
| Measure against contamination | Unclear risk | No information provided. |
| Methods | RCT | |
| Participants | Participants were recruited via telephone from purchased lists of women in general population in the Pacific Northwest. USA. Number of participants included in the analysis = 1366. | |
| Interventions | Participants were divided into average risk (70% in total), mixed risk (25%) and genetic risk (5%) depending on risk factors for breast cancer, Gail score and level of cancer worry. They were provided with stepped care interventions depending on their category. Mail intervention for all in intervention group, which was then stepped up for other intervention strategies according to risk; for example, genetic counselling for genetic risk individuals. | |
| Outcomes | Outcomes measured at one year were:
| |
| Notes | ||
| Risk of bias | ||
| Bias | Authors' judgement | Support for judgement |
| Random sequence generation (selection bias) | Unclear risk | No information provided. |
| Allocation concealment (selection bias) | Unclear risk | No information provided. |
| Blinding of participants and personnel (performance bias) | Unclear risk | The authors do not report blinding of participants and/or personnel. |
| Blinding of outcome assessment (detection bias) | Unclear risk | The authors do not report blinding of outcome assessors. |
| Incomplete outcome data (attrition bias) | Low risk | Intention‐to‐treat principle has been used. There was no difference in the characteristics of participants who were followed up compared with those lost to follow up. |
| Selective reporting (reporting bias) | High risk | Study protocol not available. Some outcomes in methods section have not been reported. |
| Funding for the screening test | Unclear risk | No information provided. |
| Baseline comparability | Low risk | Both study arms comparable at baseline. |
| Measure against contamination | Unclear risk | No information provided. |
| Methods | RCT | |
| Participants | Women who had not had a cervical (Pap) smear in previous 30 months; New South Wales, Australia. Number of participants included in the analysis = 411. | |
| Interventions | Computer generated printed feedback, listing 'risk factor' of not having a smear within past 2 years. | |
| Outcomes | Uptake of cervical (Pap) smear was measured at 6 months | |
| Notes | ||
| Risk of bias | ||
| Bias | Authors' judgement | Support for judgement |
| Random sequence generation (selection bias) | High risk | Randomisation was undertaken according to day of attendance at practice. |
| Allocation concealment (selection bias) | Unclear risk | No information provided. |
| Blinding of participants and personnel (performance bias) | Unclear risk | The authors do not report blinding of participants and/or personnel. |
| Blinding of outcome assessment (detection bias) | Unclear risk | The authors do not report blinding of outcome assessors. |
| Incomplete outcome data (attrition bias) | Low risk | Intervention was delivered immediately after recruitment and outcome ascertainment was carried out using self reporting and routinely collected data. There were no issues of loss to follow‐up. |
| Selective reporting (reporting bias) | Unclear risk | Study protocol not available. The only outcome measure was uptake of screening as mentioned in the study. |
| Funding for the screening test | Unclear risk | No information provided. |
| Baseline comparability | Low risk | No significant baseline difference between groups. |
| Measure against contamination | Low risk | Authors state randomisation by day of attendance was a measure against contamination. |
| Methods | RCT | |
| Participants | Women aged >= 35 ; never having had breast cancer. USA. Number of participants included in the analysis = 300. | |
| Interventions | In‐home interviews conducted by graduate nursing research assistants. Discussion about individual risk factors ‐ susceptibility intervention ‐ as part of a belief modifying intervention. | |
| Outcomes | Change in beliefs and knowledge (including susceptibility scores) post‐intervention; mammography compliance one year post‐intervention. | |
| Notes | ||
| Risk of bias | ||
| Bias | Authors' judgement | Support for judgement |
| Random sequence generation (selection bias) | Unclear risk | Random digit dialling but no other information provided. |
| Allocation concealment (selection bias) | Unclear risk | No information provided. |
| Blinding of participants and personnel (performance bias) | Unclear risk | The authors do not report blinding of participants and/or personnel. |
| Blinding of outcome assessment (detection bias) | Unclear risk | The authors do not report blinding of outcome assessors. |
| Incomplete outcome data (attrition bias) | Low risk | Low attrition rate of 7%. Those who dropped out had moved their residence. |
| Selective reporting (reporting bias) | Unclear risk | Study protocol not available. All outcomes mentioned in the study have been reported. |
| Funding for the screening test | Unclear risk | No information provided. |
| Baseline comparability | High risk | Much higher baseline compliance rate for mammography in intervention group. |
| Measure against contamination | Unclear risk | No measures reported. |
| Methods | RCT | |
| Participants |
| |
| Interventions | In‐home interviews conducted by graduate nursing students. Discussion about individual risk factors ‐ susceptibility intervention ‐ as part of a belief modifying intervention. | |
| Outcomes | Change in beliefs and knowledge, including susceptibility (scores); mammography compliance; movement across stages of change were measured at one year. | |
| Notes | ||
| Risk of bias | ||
| Bias | Authors' judgement | Support for judgement |
| Random sequence generation (selection bias) | Unclear risk | No information provided. |
| Allocation concealment (selection bias) | Unclear risk | No information provided. |
| Blinding of participants and personnel (performance bias) | Unclear risk | The authors do not report blinding of participants and/or personnel. |
| Blinding of outcome assessment (detection bias) | Unclear risk | The authors do not report blinding of outcome assessors. |
| Incomplete outcome data (attrition bias) | Low risk | Low attrition rate of 7%. Those who dropped out had moved their residence. |
| Selective reporting (reporting bias) | High risk | Collected data for > 35 year olds but only reported for > 40 year olds. |
| Funding for the screening test | Unclear risk | No information provided. |
| Baseline comparability | Unclear risk | Unclear how many participants in each arm were in stage 3 of adoption of screening. |
| Measure against contamination | Unclear risk | No measures reported. |
| Methods | RCT | |
| Participants | Low‐income African American women aged 45 to 64; Indiana, USA. Number of participants included in the analysis = 278. | |
| Interventions | In‐person tailored interventions based on Health Belief and Transtheoretical Models, including listing of susceptibility factors. | |
| Outcomes | Screening mammography uptake at one year. | |
| Notes | ||
| Risk of bias | ||
| Bias | Authors' judgement | Support for judgement |
| Random sequence generation (selection bias) | Low risk | Computer generated randomised sequence. |
| Allocation concealment (selection bias) | Unclear risk | No information provided. |
| Blinding of participants and personnel (performance bias) | Unclear risk | The authors do not report blinding of participants and/or personnel. |
| Blinding of outcome assessment (detection bias) | Unclear risk | The authors do not report blinding of outcome assessors. |
| Incomplete outcome data (attrition bias) | Unclear risk | Low attrition rate of 11%. However authors do not give information on the reasons for this and the actual figures in each of the study arms. Incomplete data excluded from analysis. |
| Selective reporting (reporting bias) | Unclear risk | Study protocol not available. All outcomes mentioned in the study have been reported. |
| Funding for the screening test | Unclear risk | No information provided. |
| Baseline comparability | Unclear risk | No differences reported but very little data provided. |
| Measure against contamination | Unclear risk | No measures reported. |
| Methods | RCT | |
| Participants | Women aged over 50 not adherent to mammography recommendations; medical clinic at St Louis and HMO in Indianapolis, USA. Number of participants included in the analysis = 976. | |
| Interventions | Tailored interventions based on Health Belief and Transtheoretical Models, including perceived risk and risk factors (e.g. age, family history). | |
| Outcomes | Self‐reported mammography uptake at two months. | |
| Notes | ||
| Risk of bias | ||
| Bias | Authors' judgement | Support for judgement |
| Random sequence generation (selection bias) | Unclear risk | No information provided. |
| Allocation concealment (selection bias) | Unclear risk | No information provided. |
| Blinding of participants and personnel (performance bias) | Unclear risk | The authors do not report blinding of participants and/or personnel. |
| Blinding of outcome assessment (detection bias) | Unclear risk | The authors do not report blinding of outcome assessors. |
| Incomplete outcome data (attrition bias) | High risk | Significant rate of attrition. This has not been clearly described. No mention of adjustments for missing data. |
| Selective reporting (reporting bias) | High risk | Study protocol not available. Not all outcomes addressed, sub‐group reporting. |
| Funding for the screening test | Unclear risk | No information provided. |
| Baseline comparability | High risk | Baseline characteristics have not been described separately for each study arms. |
| Measure against contamination | Unclear risk | No measures reported. |
| Methods | RCT | |
| Participants | Women in the 51 to 84 years age range who have not received a mammogram in the last 15 months; from an HMO and general medicine clinic, USA. Number of participants included in the analysis = 773. | |
| Interventions | Tailored interventions based on Health Belief and Transtheoretical Models, including listing of susceptibility factors. | |
| Outcomes | Screening mammography uptake at six months to one year. | |
| Notes | ||
| Risk of bias | ||
| Bias | Authors' judgement | Support for judgement |
| Random sequence generation (selection bias) | Low risk | Computer generated allocation sequence. |
| Allocation concealment (selection bias) | Unclear risk | No information provided. |
| Blinding of participants and personnel (performance bias) | Unclear risk | The authors do not report blinding of participants and/or personnel. |
| Blinding of outcome assessment (detection bias) | Unclear risk | The authors do not report blinding of outcome assessors. |
| Incomplete outcome data (attrition bias) | Unclear risk | Insignificant attrition rate. However no reasons given for attrition and attrition rate in each of the study arms not explicit. Incomplete data excluded from analysis. |
| Selective reporting (reporting bias) | Unclear risk | Study protocol unavailable. Outcome mentioned in the study has been reported. |
| Funding for the screening test | Unclear risk | No information provided. |
| Baseline comparability | High risk | There are more African Americans in the control group. |
| Measure against contamination | Unclear risk | No measures reported. |
| Methods | RCT | |
| Participants | Participants recruited from two sites: A university‐affiliated general medicine clinic setting serving predominately low‐income clientele in St. Louis and a HMO comprised mainly of enrollees in Indianapolis, IN, USA. Number of participants included in the analysis = 1244. | |
| Interventions | Computer‐tailored interventions addressed each woman’s perceived risk of breast cancer, benefits and/or barriers related to screening and self‐efficacy for obtaining mammography, and her knowledge of the mammography procedure. | |
| Outcomes | Mammography adherence used for our review and forward stage movement (pre‐contemplation to contemplation, contemplation to action or pre‐contemplation to action) from baseline to 2 month post follow up. | |
| Notes | ||
| Risk of bias | ||
| Bias | Authors' judgement | Support for judgement |
| Random sequence generation (selection bias) | Unclear risk | No information provided. |
| Allocation concealment (selection bias) | Unclear risk | No information provided. |
| Blinding of participants and personnel (performance bias) | Unclear risk | The authors do not report blinding of participants and/or personnel. |
| Blinding of outcome assessment (detection bias) | Unclear risk | The authors do not report blinding of outcome assessors. |
| Incomplete outcome data (attrition bias) | Low risk | No significant attrition. |
| Selective reporting (reporting bias) | Unclear risk | Study protocol not available. Outcomes mentioned in the study have been addressed. |
| Funding for the screening test | Unclear risk | No information provided. |
| Baseline comparability | Low risk | The study reports that there were no significant differences at baseline. |
| Measure against contamination | Unclear risk | No information provided. |
| Methods | RCT | |
| Participants | Women aged > = 50; newly enrolled in an HMO, without prior history of breast cancer or of mammography use in the previous 12 months. USA. Number of participants included in the analysis = 841. | |
| Interventions | Mailed risk factor questionnaire plus personal risk invitation detailing personal risk factors. | |
| Outcomes | Mammography use within 1 year of invitation. | |
| Notes | ||
| Risk of bias | ||
| Bias | Authors' judgement | Support for judgement |
| Random sequence generation (selection bias) | Unclear risk | No information provided. |
| Allocation concealment (selection bias) | Unclear risk | No information provided. |
| Blinding of participants and personnel (performance bias) | Unclear risk | The authors do not report blinding of participants and/or personnel. |
| Blinding of outcome assessment (detection bias) | Unclear risk | The authors do not report blinding of outcome assessors. |
| Incomplete outcome data (attrition bias) | Low risk | Intention‐to‐treat analysis has been used. |
| Selective reporting (reporting bias) | Unclear risk | Study protocol unavailable. All outcomes mentioned in the study have been reported. |
| Funding for the screening test | Unclear risk | No information provided. |
| Baseline comparability | Unclear risk | Differences in response rates to baseline survey and rates of previous breast biopsy between study arms. |
| Measure against contamination | Unclear risk | No measures reported. |
| Methods | RCT | |
| Participants | Siblings of melanoma patients living in the USA were approached to participate in the study. Patients were recruited from the Boston area teaching hospital dermatology clinics, within a month after diagnosis of melanoma. Participants were at least 18 years of age with no previous history of skin cancer. Number of participants included in the analysis = 494. | |
| Interventions | The intervention drew on a number of psychosocial theories of health behaviour change, including Social Cognitive Theory, Theory of Planned Behaviour, The Health Belief Model, The Precaution Adoption Model, and The Transtheoretical Model. Intervention condition participants received an initial motivational and goal‐setting telephone intervention session delivered by the health educator. Thereafter computer‐generated tailored print materials were sent at 1, 3, and 5 months after randomization. | |
| Outcomes | Having skin cancer screen by dermatologist, personal examination of moles and use of sun protection at one year. | |
| Notes | ||
| Risk of bias | ||
| Bias | Authors' judgement | Support for judgement |
| Random sequence generation (selection bias) | High risk | Alternate patient groups used. |
| Allocation concealment (selection bias) | Unclear risk | No information provided. |
| Blinding of participants and personnel (performance bias) | Unclear risk | The authors do not report blinding of participants and/or personnel. |
| Blinding of outcome assessment (detection bias) | Unclear risk | The authors do not report blinding of outcome assessors. |
| Incomplete outcome data (attrition bias) | High risk | Significant loss to follow‐up. No mention of any adjustments or intention‐to‐treat principle. |
| Selective reporting (reporting bias) | Unclear risk | Study protocol unavailable. All outcomes mentioned in the study analysed/reported. |
| Funding for the screening test | Unclear risk | No information provided. |
| Baseline comparability | Low risk | All study arms were comparable at baseline. |
| Measure against contamination | Low risk | Cluster randomised study. |
| Methods | RCT | |
| Participants | First degree relatives of colorectal cancer from Hawaii, USA. Number of participants included in the analysis = 176. | |
| Interventions | Intervention included personal risk and culturally tailored intervention. | |
| Outcomes | Primary outcome was adherence to screening at one year. | |
| Notes | ||
| Risk of bias | ||
| Bias | Authors' judgement | Support for judgement |
| Random sequence generation (selection bias) | Unclear risk | No information provided. |
| Allocation concealment (selection bias) | Unclear risk | No information provided. |
| Blinding of participants and personnel (performance bias) | Unclear risk | The authors do not report blinding of participants and/or personnel. |
| Blinding of outcome assessment (detection bias) | Unclear risk | The authors do not report blinding of outcome assessors. |
| Incomplete outcome data (attrition bias) | Low risk | Adjustment done in analysis. Reasons for attrition given. |
| Selective reporting (reporting bias) | Unclear risk | Study protocol unavailable. All outcomes mentioned in the study were reported. |
| Funding for the screening test | Low risk | 98.3% had health insurance. Insurance status was comparable at baseline. |
| Baseline comparability | Low risk | All study arms were comparable at baseline. |
| Measure against contamination | High risk | The participants were relatives of those who were diagnosed with colorectal cancer. They were recruited through the index cancer patients. There may be a high chance of contamination and authors do not mention any measures taken to prevent this. |
| Methods | RCT | |
| Participants | Participants were recruited from Family Practices within Nottinghamshire, England. Number of participants included in the analysis = 589. | |
| Interventions | Multimedia programme called "Skinsafe" with eight sections designed to be completed in 10 to 15 minutes was used. It included animation, photographs and simple text to inform users about the dangers from excessive sun exposure; how to protect skin from the sun; characteristics of skin at risk; early signs of melanoma; how to reduce risk from melanoma; how to check skin for suspicious lesions. The last section was designed to provide individualised feedback on the persons relative risk for skin cancer (melanoma). Health Belief Model was used to base the intervention. | |
| Outcomes | Knowledge, skin protective behaviour, perceived risk and screening uptake measured at six months. | |
| Notes | ||
| Risk of bias | ||
| Bias | Authors' judgement | Support for judgement |
| Random sequence generation (selection bias) | Low risk | Coin toss. |
| Allocation concealment (selection bias) | Unclear risk | No information provided. |
| Blinding of participants and personnel (performance bias) | Unclear risk | The authors do not report blinding of participants and/or personnel. |
| Blinding of outcome assessment (detection bias) | Unclear risk | The authors do not report blinding of outcome assessors. |
| Incomplete outcome data (attrition bias) | Unclear risk | Significant loss to follow‐up. Missing values were replaced by baseline values ‐ perhaps retains intention‐to‐treat principle |
| Selective reporting (reporting bias) | High risk | Study protocol unavailable. Perceived risk not fully reported |
| Funding for the screening test | Low risk | National Health Service funded. |
| Baseline comparability | Low risk | Study arms were comparable at baseline. |
| Measure against contamination | Low risk | Cluster randomised. |
| Methods | RCT | |
| Participants | Participants were recruited from the Washington State Physicians' Networks' computerized database. They were aged 18 to 64; had no personal history of breast or ovarian cancer, or of genetic counselling or testing for cancer risk; and were able to speak and write English. All participants who did not refuse were called to complete a brief eligibility survey by phone and then were mailed a baseline survey. If participants returned the survey and gave written consent, they were then randomised to one of the counselling conditions or the control group. Number of participants included in the analysis = 335. | |
| Interventions | This study measured the effects of an intervention (individualised Gail risk score) in person and by telephone, compared to a control group. | |
| Outcomes | Cancer worry, breast health intentions, perceived risk and intention to take up genetic testing measured at three months. | |
| Notes | ||
| Risk of bias | ||
| Bias | Authors' judgement | Support for judgement |
| Random sequence generation (selection bias) | Unclear risk | No information provided. |
| Allocation concealment (selection bias) | Unclear risk | No information provided. |
| Blinding of participants and personnel (performance bias) | Unclear risk | The authors do not report blinding of participants and/or personnel. |
| Blinding of outcome assessment (detection bias) | Unclear risk | The authors do not report blinding of outcome assessors. |
| Incomplete outcome data (attrition bias) | Low risk | Intention‐to‐treat principle used. Reasons for drop outs given. |
| Selective reporting (reporting bias) | Unclear risk | Study protocols unavailable. All outcomes mentioned in the study were addressed. |
| Funding for the screening test | Low risk | All participants had health insurance |
| Baseline comparability | Low risk | Participants were comparable at baseline. |
| Measure against contamination | Unclear risk | No information provided |
| Methods | RCT | |
| Participants | Patients aged 20 to 69 years, from two Canadian primary care group practices. Number of participants included in the analysis = 3152. | |
| Interventions | Risk appraisal questionnaire (yielding risk score). Those with scores above 2 advised to go for screening. | |
| Outcomes | Rate of cholesterol testing during the three months of follow up. | |
| Notes | ||
| Risk of bias | ||
| Bias | Authors' judgement | Support for judgement |
| Random sequence generation (selection bias) | Unclear risk | No information provided. |
| Allocation concealment (selection bias) | Unclear risk | No information provided. |
| Blinding of participants and personnel (performance bias) | Unclear risk | The authors do not report blinding of participants and/or personnel. |
| Blinding of outcome assessment (detection bias) | Unclear risk | The authors do not report blinding of outcome assessors. |
| Incomplete outcome data (attrition bias) | High risk | Significant loss to follow‐up. Incomplete data excluded from analysis. |
| Selective reporting (reporting bias) | Unclear risk | Study protocol not available. All outcomes mentioned in the study reported. |
| Funding for the screening test | Unclear risk | No information provided. |
| Baseline comparability | High risk | Greater proportion of high‐risk patients in control group. |
| Measure against contamination | Low risk | Randomised by household unit. |
| Methods | RCT. | |
| Participants | Women registered at 2 urban community health centres; Houston, USA. Number of participants included in the analysis = 1483. | |
| Interventions | Personalised letter, tailored for risk factor data and giving screening recommendations. | |
| Outcomes | Scheduling and uptake of cervical (Pap) smear test and mammogram measured at one year after intervention. | |
| Notes | ||
| Risk of bias | ||
| Bias | Authors' judgement | Support for judgement |
| Random sequence generation (selection bias) | Low risk | Computer generated random number assignment. |
| Allocation concealment (selection bias) | Unclear risk | No information provided. |
| Blinding of participants and personnel (performance bias) | Low risk | Participants and service providers blinded. |
| Blinding of outcome assessment (detection bias) | Unclear risk | Unclear if outcome assessors were blinded. |
| Incomplete outcome data (attrition bias) | Unclear risk | Intervention in the form of postal letters could not be delivered (reason not known) to a significant number of recruits in the intervention arms. These were not accounted for in the analysis. |
| Selective reporting (reporting bias) | High risk | Study protocol unavailable. Data on breast cancer collected from 18 to 64 year olds but only reported for > 40 year olds. |
| Funding for the screening test | Unclear risk | No information provided. |
| Baseline comparability | Low risk | No significant differences between groups at baseline. |
| Measure against contamination | Unclear risk | No measures reported. |
| Methods | RCT | |
| Participants | Patients aged 18 to 75 from 8 family medical practices, North Carolina, USA. Number of participants included in the analysis = 1131. | |
| Interventions | Mailed HRA (Health Risk Appraisal) ‐ risk information tailored to information given at baseline questionnaire. | |
| Outcomes | Rate of Pap smear, mammography and cholesterol uptake after six months in those contemplating these behaviours at baseline. | |
| Notes | ||
| Risk of bias | ||
| Bias | Authors' judgement | Support for judgement |
| Random sequence generation (selection bias) | Unclear risk | No information provided. |
| Allocation concealment (selection bias) | Unclear risk | No information provided. |
| Blinding of participants and personnel (performance bias) | Unclear risk | The authors do not report blinding of participants and/or personnel. |
| Blinding of outcome assessment (detection bias) | Unclear risk | The authors do not report blinding of outcome assessors. |
| Incomplete outcome data (attrition bias) | Unclear risk | 14% loss to follow‐up. No differences in attrition rates in the two intervention arms, but we are unclear about how this compares to the attrition rate in the control arm. |
| Selective reporting (reporting bias) | Unclear risk | Study protocol unavailable. All outcomes mentioned in the study reported. |
| Funding for the screening test | Unclear risk | No information provided. |
| Baseline comparability | Low risk | No significant differences in baseline characteristics. |
| Measure against contamination | Unclear risk | No measures reported |
| Methods | RCT, stratified for previous screening history and risk status. | |
| Participants | Federal employees aged > = 40 years. USA. Number of participants included in the analysis = 278. | |
| Interventions | Colorectal cancer risk appraisal ‐ categorised as high, medium or low personal risk. | |
| Outcomes | Knowledge, intention to take test, and uptake measured at three months after intervention. | |
| Notes | ||
| Risk of bias | ||
| Bias | Authors' judgement | Support for judgement |
| Random sequence generation (selection bias) | Low risk | Random number table. |
| Allocation concealment (selection bias) | Unclear risk | No information provided. |
| Blinding of participants and personnel (performance bias) | Unclear risk | The authors do not report blinding of participants and/or personnel. |
| Blinding of outcome assessment (detection bias) | Unclear risk | The authors do not report blinding of outcome assessors. |
| Incomplete outcome data (attrition bias) | Low risk | Similar loss to follow‐up in either of the study arms and low attrition rates. |
| Selective reporting (reporting bias) | High risk | Study protocol was not available. Outcomes mentioned not fully reported. |
| Funding for the screening test | Unclear risk | No information provided. |
| Baseline comparability | Unclear risk | Differences between family history and fat consumption between groups but authors controlled for this in analysis. |
| Measure against contamination | Unclear risk | None reported. |
| Methods | RCT | |
| Participants | Women aged 35 years and older with a family history of breast cancer in a first degree relative. USA. Number of participants included in the analysis = 239. | |
| Interventions | Breast cancer risk counselling including discussion of factors contributing to elevated risk and presentation of individualized risk data. | |
| Outcomes | Changes/improvement in risk comprehension. | |
| Notes | Additional paper (Lerman 1996) addresses effects on general and breast cancer‐specific distress measured at three months after intervention. | |
| Risk of bias | ||
| Bias | Authors' judgement | Support for judgement |
| Random sequence generation (selection bias) | Unclear risk | No information provided. |
| Allocation concealment (selection bias) | Unclear risk | No information provided. |
| Blinding of participants and personnel (performance bias) | Unclear risk | The authors report blinding of randomisation personnel only. |
| Blinding of outcome assessment (detection bias) | Low risk | The authors report blinding of outcome assessors. |
| Incomplete outcome data (attrition bias) | Unclear risk | 12% loss to follow‐up. However it is not clear as to the number of drop outs in each of the study arms. No mention of adjustment/intention‐to‐treat analysis. |
| Selective reporting (reporting bias) | Unclear risk | Study protocol unavailable. All outcomes mentioned in the study are reported. |
| Funding for the screening test | Unclear risk | No information provided. |
| Baseline comparability | Unclear risk | Unclear. There were significant baseline differences. However these were attempted to be controlled at the analysis stage. |
| Measure against contamination | High risk | The participants were relatives of those who were diagnosed with breast cancer. They were recruited through the index cancer patients. There may be a high chance of contamination and authors do not mention any measures taken to prevent this. |
| Methods | RCT | |
| Participants | Women aged 18 to 75 who had at least one first degree relative with breast and/or ovarian cancer. USA. Number of participants included in the analysis = 320. | |
| Interventions | Educational session including a review of individual risk factors for breast and ovarian cancers. | |
| Outcomes | Changes in risk perception; testing intentions (breast cancer gene testing) measured at one month after intervention. | |
| Notes | No data on taking test in control group. | |
| Risk of bias | ||
| Bias | Authors' judgement | Support for judgement |
| Random sequence generation (selection bias) | Unclear risk | No information provided. |
| Allocation concealment (selection bias) | Unclear risk | No information provided. |
| Blinding of participants and personnel (performance bias) | Unclear risk | The authors do not report blinding of participants and/or personnel. |
| Blinding of outcome assessment (detection bias) | Unclear risk | The authors do not report blinding of outcome assessors. |
| Incomplete outcome data (attrition bias) | Unclear risk | 9% loss to follow‐up. However it is not clear as to the number of drop outs in each of the study arms. No mention of adjustment/intention‐to‐treat analysis. |
| Selective reporting (reporting bias) | Unclear risk | Study protocol unavailable. All outcomes mentioned in the study reported. |
| Funding for the screening test | Unclear risk | Unclear, may have different sources as recruitment was by identifying relatives of index patients with cancer and self referrals. |
| Baseline comparability | Low risk | Study arms comparable at baseline. |
| Measure against contamination | High risk | The participants were relatives of those who were diagnosed with breast cancer. They were recruited through the index cancer patients. There may be a high chance of contamination and authors do not mention any measures taken to prevent this. |
| Methods | RCT (2 x 2 factorial with basic versus more comprehensive information as well as personalised (tailored) versus non‐personalised). | |
| Participants | 99% male, New Jersey Carpenters' Fund members; aged over 50 years. Number of participants included in the analysis = 860. | |
| Interventions | Tailored risk information with information about risk factors for colorectal cancer derived from baseline questionnaire. | |
| Outcomes | Faecal Occult Blood Test (FOBT) uptake at one, two and three years after intervention. | |
| Notes | Also assessed 'attributions of colorectal cancer risk' but not as risk perceptions directly affected by interventions. | |
| Risk of bias | ||
| Bias | Authors' judgement | Support for judgement |
| Random sequence generation (selection bias) | Unclear risk | No information provided. |
| Allocation concealment (selection bias) | Unclear risk | No information provided. |
| Blinding of participants and personnel (performance bias) | Unclear risk | The authors do not report blinding of participants and/or personnel. |
| Blinding of outcome assessment (detection bias) | Unclear risk | The authors do not report blinding of outcome assessors. |
| Incomplete outcome data (attrition bias) | Low risk | Intention‐to‐treat principle used. |
| Selective reporting (reporting bias) | Unclear risk | Study protocol unavailable. All outcomes mentioned in the study were addressed adequately. |
| Funding for the screening test | Low risk | FOBT kits were provided by the research group. |
| Baseline comparability | Low risk | Participants were comparable at baseline. |
| Measure against contamination | Unclear risk | No information provided. |
| Methods | RCT | |
| Participants | Participants were recruited by newspaper adverts in Orange, Durham and Wake counties of North Carolina, USA. Subjects were included if they did not have a history of colorectal cancer, were 50 to 75 years of age, had never had a colonoscopic/sigmoidoscopic examination and not had an FOBT in the last 2 years. Number of participants included in the analysis = 160. | |
| Interventions | Participants were first stratified to high and low colorectal cancer risk groups and were then randomised to the three study groups ‐ Control, Absolute risk only and Absolute + Comparative risk groups. All groups received general information on basic facts about colorectal cancer. The Absolute risk group were provided with a list of risk factors that were relevant to them. The Comparative + Absolute risk groups also received information on if their number of risk factors was high or low compared to the average number of risk factors for the population their geographical area, age and sex groups. Health Belief Model used to base the constructs. | |
| Outcomes |
| |
| Notes | The primary outcomes have not been included in the meta‐analysis due to inadequate statistical details. | |
| Risk of bias | ||
| Bias | Authors' judgement | Support for judgement |
| Random sequence generation (selection bias) | Unclear risk | No information provided. |
| Allocation concealment (selection bias) | Unclear risk | No information provided. |
| Blinding of participants and personnel (performance bias) | Unclear risk | The authors do not report blinding of participants and/or personnel. |
| Blinding of outcome assessment (detection bias) | Unclear risk | The authors do not report blinding of outcome assessors. |
| Incomplete outcome data (attrition bias) | Low risk | No drop out. Two errors dealt with appropriately. |
| Selective reporting (reporting bias) | Unclear risk | Study protocol unavailable. All outcomes mentioned in the study were reported. |
| Funding for the screening test | Low risk | FOBT was free of charge. Participants were paid $40 for taking part in the test. |
| Baseline comparability | Low risk | Study arms were comparable at baseline. |
| Measure against contamination | Unclear risk | No information provided. |
| Methods | Cluster RCT. | |
| Participants | Participants were siblings of (index) patients recruited from the oncology, gastroenterology, and surgical practices at 26 participating medical centres’ located across the USA (sites contributed 1 to 93 participants). Prospective patients were identified from tumour registries or medical records. Age of participants was < 35 years or < than 10 years younger that the age of diagnosis in the index patient. Number of participants included in the analysis = 412. | |
| Interventions | Interventions for control group was generic educational print material used by Centre for Disease Control for prevention of colorectal cancer. There were two intervention groups. One group was provided with tailored print material including list of personal risk factors and the other group had the tailored print material along with telephone counselling. | |
| Outcomes | Adherence to colorectal screening programme and the effect of mediators (decisional balance) on adherence measured at six months after intervention. | |
| Notes | We have compared generic print group with tailored print group. | |
| Risk of bias | ||
| Bias | Authors' judgement | Support for judgement |
| Random sequence generation (selection bias) | Unclear risk | No information provided. |
| Allocation concealment (selection bias) | Unclear risk | No information provided. |
| Blinding of participants and personnel (performance bias) | Unclear risk | The authors do not report blinding of participants and/or personnel. |
| Blinding of outcome assessment (detection bias) | Unclear risk | The authors do not report blinding of outcome assessors. |
| Incomplete outcome data (attrition bias) | Low risk | Reasons for drop‐outs mentioned. Intention‐to‐treat analysis used. |
| Selective reporting (reporting bias) | High risk | Study protocol unavailable. Several outcomes mentioned in the study are not reported. |
| Funding for the screening test | Low risk | Most participants were covered by health insurance. |
| Baseline comparability | Low risk | Participants were comparable at baseline. |
| Measure against contamination | Low risk | Randomisation done by family. |
| Methods | RCT. | |
| Participants | First degree relatives of patients with skin cancer, with additional risk factors; aged over 20. Number of participants included in the analysis = 443. | |
| Interventions | Tailored interventions with print material and telephone counselling, including personalised list of risk factors. | |
| Outcomes | Uptake of screening, self skin examination and adopting sun protection habits measured at six months post intervention. | |
| Notes | ||
| Risk of bias | ||
| Bias | Authors' judgement | Support for judgement |
| Random sequence generation (selection bias) | Unclear risk | No information provided. |
| Allocation concealment (selection bias) | Unclear risk | No information provided. |
| Blinding of participants and personnel (performance bias) | Unclear risk | The authors do not report blinding of participants and/or personnel. |
| Blinding of outcome assessment (detection bias) | Unclear risk | The authors do not report blinding of outcome assessors. |
| Incomplete outcome data (attrition bias) | Low risk | Intention‐to‐treat used. Reasons for attrition given. |
| Selective reporting (reporting bias) | Unclear risk | Study protocol unavailable. All outcomes mentioned in the study are reported. |
| Funding for the screening test | Low risk | Most people had health insurance. Health insurance status comparable in both study arms. |
| Baseline comparability | Low risk | Comparable at baseline. |
| Measure against contamination | Low risk | Randomisation done by family. |
| Methods | RCT | |
| Participants | Callers to one of nine participating regional Cancer Information Service offices in the USA. Number of participants included in the analysis = 2224. | |
| Interventions | Tailored print materials were tested for efficacy in promoting colorectal cancer. Transtheoretical and Health Belief Model used to draw behavioural constructs. | |
| Outcomes | Screening adherence at 14 months after intervention. | |
| Notes | ||
| Risk of bias | ||
| Bias | Authors' judgement | Support for judgement |
| Random sequence generation (selection bias) | Unclear risk | No information provided. |
| Allocation concealment (selection bias) | Unclear risk | No information provided. |
| Blinding of participants and personnel (performance bias) | Unclear risk | The authors do not report blinding of participants and/or personnel. |
| Blinding of outcome assessment (detection bias) | Unclear risk | The authors do not report blinding of outcome assessors. |
| Incomplete outcome data (attrition bias) | Low risk | Attrition described and intention‐to‐treat analysis used. |
| Selective reporting (reporting bias) | Unclear risk | Study protocol unavailable. All outcomes mentioned in the study are reported. |
| Funding for the screening test | Unclear risk | Unclear risk. No mention of insurance status/funding for the screening test. |
| Baseline comparability | Low risk | Comparable at baseline. |
| Measure against contamination | Unclear risk | No measures mentioned. |
| Methods | RCT | |
| Participants | African American men, aged 40 to 70 years. Patients at the University of Chicago, USA. Number of participants included in the analysis = 413. | |
| Interventions | A personalised 'ProRecord' which included a tailored risk factors and symptoms form. | |
| Outcomes | 'Adherence', i.e. men who made an office visit for prostate cancer education and early detection within a year. | |
| Notes | ||
| Risk of bias | ||
| Bias | Authors' judgement | Support for judgement |
| Random sequence generation (selection bias) | Unclear risk | No information provided. |
| Allocation concealment (selection bias) | Unclear risk | No information provided. |
| Blinding of participants and personnel (performance bias) | Low risk | The follow‐up surveys were carried out by an external agency. It is unlikely that participants were aware of the intervention group allocation. |
| Blinding of outcome assessment (detection bias) | Unclear risk | The authors do not report blinding of outcome assessors. |
| Incomplete outcome data (attrition bias) | Low risk | No loss to follow‐up after assignment to intervention and control arms. |
| Selective reporting (reporting bias) | Unclear risk | Study protocol unavailable. All outcomes mentioned in the study are reported. |
| Funding for the screening test | Unclear risk | Unclear risk. No mention of insurance status/funding for the screening test. |
| Baseline comparability | Unclear risk | No information provided. |
| Measure against contamination | Unclear risk | No information provided. |
| Methods | RCT | |
| Participants | Pregnant women aged > 18 years and less than 12 weeks gestation. Number of participants included in the analysis = 339. | |
| Interventions | Decision aid for prenatal testing of foetal abnormalities to improve women’s informed decision making. Decision aid included individual age‐related risk report. | |
| Outcomes |
Outcomes were measured within 14 weeks of intervention. | |
| Notes | ||
| Risk of bias | ||
| Bias | Authors' judgement | Support for judgement |
| Random sequence generation (selection bias) | Low risk | Computer generated random numbers by an independent statistician. |
| Allocation concealment (selection bias) | Low risk | Allocation was concealed. |
| Blinding of participants and personnel (performance bias) | High risk | Study reports that it was not possible to blind personnel and the participants. |
| Blinding of outcome assessment (detection bias) | Unclear risk | The authors do not report blinding of outcome assessors. |
| Incomplete outcome data (attrition bias) | Low risk | Intention‐to‐treat analysis used. |
| Selective reporting (reporting bias) | Low risk | Study protocol available. All outcomes adequately reported. |
| Funding for the screening test | Unclear risk | Some screening tests were public funded depending on maternal age and others had private insurance. |
| Baseline comparability | Low risk | Study arms were comparable at baseline. |
| Measure against contamination | Low risk | Cluster randomised. |
| Methods | RCT | |
| Participants | First degree relatives aged 40 and above of colorectal cancer survivors. Participants were able to read English; no personal colorectal cancer history; had not been screened for colorectal cancer according to American Cancer Society guidelines for screening. Number of participants included in the analysis = 140. | |
| Interventions | Personalised versus general print intervention detailing colorectal cancer risk and recommendations for screening. | |
| Outcomes | Uptake of screening (FOBT or sigmoidoscopy or colonoscopy) and change in stage of adoption for screening three months after intervention. | |
| Notes | ||
| Risk of bias | ||
| Bias | Authors' judgement | Support for judgement |
| Random sequence generation (selection bias) | Unclear risk | Authors state 'Computer randomisation', no further details provided. |
| Allocation concealment (selection bias) | Unclear risk | No information provided. |
| Blinding of participants and personnel (performance bias) | Unclear risk | The authors do not report blinding of participants and/or personnel. |
| Blinding of outcome assessment (detection bias) | Unclear risk | The authors do not report blinding of outcome assessors. |
| Incomplete outcome data (attrition bias) | Unclear risk | 208 subjects were randomised. 177 completed baseline interview. However further 37 subjects were disqualified as 'ineligible' at this stage leaving a total of 140. Loss is higher in the intervention arm. |
| Selective reporting (reporting bias) | Unclear risk | Study protocol was unavailable. All outcome mentioned in the study were reported. |
| Funding for the screening test | Low risk | Participants given $20 gift voucher upon completion of data collection. Participants were insured. |
| Baseline comparability | Low risk | Groups were comparable at baseline. |
| Measure against contamination | High risk | The participants were relatives of those who were diagnosed with colorectal cancer. They were recruited through the index cancer patients. There may be a high chance of contamination and authors do not mention any measures taken to prevent this. |
| Methods | RCT | |
| Participants | Women aged in their 40s and 50s, and members of Blue Cross and Blue Shield, North Carolina, USA. Number of participants included in the analysis = 1091. | |
| Interventions | Tailored print materials detailing a woman's personal risk (numerical and graphical) of breast cancer based on Gail score. | |
| Outcomes | Knowledge, accuracy of risk perceptions; mammography uptake measured at one year after intervention. | |
| Notes | Tailored print + telephone counselling arm excluded as different and extra content. | |
| Risk of bias | ||
| Bias | Authors' judgement | Support for judgement |
| Random sequence generation (selection bias) | Unclear risk | No information provided. |
| Allocation concealment (selection bias) | Unclear risk | No information provided. |
| Blinding of participants and personnel (performance bias) | Unclear risk | The authors do not report blinding of participants and/or personnel. |
| Blinding of outcome assessment (detection bias) | Unclear risk | The authors do not report blinding of outcome assessors. |
| Incomplete outcome data (attrition bias) | High risk | Significant loss to follow‐up. Missing data were excluded from the analysis. |
| Selective reporting (reporting bias) | Unclear risk | Study protocol unavailable. All outcomes mentioned in the study are reported. |
| Funding for the screening test | Unclear risk | No information provided. |
| Baseline comparability | Low risk | Study arms were comparable at baseline. |
| Measure against contamination | Unclear risk | None reported. |
| Methods | RCT | |
| Participants | Women 50 to 85 years; non‐compliant with mammography guidelines; no history of breast cancer, USA. Number of participants included in the analysis = 808. | |
| Interventions | Telephone and in‐person counselling including discussion of personal risk factors. | |
| Outcomes | Mammography compliance 4 to 6 weeks after counselling. | |
| Notes | ||
| Risk of bias | ||
| Bias | Authors' judgement | Support for judgement |
| Random sequence generation (selection bias) | Unclear risk | No information provided. |
| Allocation concealment (selection bias) | Unclear risk | No information provided. |
| Blinding of participants and personnel (performance bias) | Unclear risk | The authors do not report blinding of participants and/or personnel. |
| Blinding of outcome assessment (detection bias) | Unclear risk | The authors do not report blinding of outcome assessors. |
| Incomplete outcome data (attrition bias) | High risk | 14% loss to follow‐up. Considerably higher loss in the control arm compared to the intervention groups of interest in this review (33/143 in control and 14/251 in intervention arm). No adjustments made for the loss to follow‐up. |
| Selective reporting (reporting bias) | Unclear risk | Study protocol unavailable. All outcomes mentioned in the study were reported. |
| Funding for the screening test | Low risk | Participants belonged to an HMO in the USA. |
| Baseline comparability | Low risk | Groups comparable at baseline. |
| Measure against contamination | Unclear risk | None reported. |
| Methods | RCT | |
| Participants | Women with family history of breast cancer (first degree relative of sufferer) aged 40 years and older. USA. Number of participants included in the analysis = 508. | |
| Interventions | Risk counselling including individualised risk figures. | |
| Outcomes | Self‐reported mammography use one year after (compared to baseline). | |
| Notes | This is a follow‐up to the Lerman 1995 trial. | |
| Risk of bias | ||
| Bias | Authors' judgement | Support for judgement |
| Random sequence generation (selection bias) | Unclear risk | No information provided. |
| Allocation concealment (selection bias) | Unclear risk | No information provided. |
| Blinding of participants and personnel (performance bias) | Unclear risk | Participants were blinded up to the point of intervention delivery. It may be difficult to blind the personnel but no information is provided. |
| Blinding of outcome assessment (detection bias) | Low risk | The authors report blinding of outcome assessors at follow‐up interview. |
| Incomplete outcome data (attrition bias) | Low risk | Significant loss to follow‐up. Intention‐to‐treat analysis done with no significant differences in results. |
| Selective reporting (reporting bias) | Unclear risk | Study protocol unavailable. All outcomes mentioned in the study are reported. |
| Funding for the screening test | Unclear risk | No information provided. |
| Baseline comparability | Unclear risk | Baseline characteristics differed amongst control and intervention groups but authors state they controlled for differences in analysis. |
| Measure against contamination | High risk | The participants were relatives of those who were diagnosed with breast cancer. They were recruited through the index cancer patients. There may be a chance of contamination within the family and authors do not mention any measures taken to prevent this. |
| Methods | RCT | |
| Participants | Patients (age range 50 to 75 years) of 174 primary care physicians at 14 health centres who had a visit with a Harvard Vanguard Medical Associates primary care physician during the prior 18 months, and an active personal health record account, USA. Number of participants included in the analysis = 1103. | |
| Interventions | Electronic patient messages and personalized risk assessments delivered via an electronic personal health record. | |
| Outcomes | Screening uptake at one and four months. | |
| Notes | ||
| Risk of bias | ||
| Bias | Authors' judgement | Support for judgement |
| Random sequence generation (selection bias) | Unclear risk | No information provided. |
| Allocation concealment (selection bias) | Unclear risk | No information provided |
| Blinding of participants and personnel (performance bias) | Unclear risk | The authors do not report blinding of participants and/or personnel. |
| Blinding of outcome assessment (detection bias) | Unclear risk | The authors do not report blinding of outcome assessors. |
| Incomplete outcome data (attrition bias) | Low risk | No loss to follow‐up. |
| Selective reporting (reporting bias) | Low risk | Study protocol was available. All outcomes reported adequately. |
| Funding for the screening test | Low risk | Most participants had some form of insurance and insurance status was comparable at baseline. |
| Baseline comparability | Low risk | Study participants comparable at baseline. |
| Measure against contamination | Unclear risk | None reported. |
| Methods | RCT, stratified between clinics. | |
| Participants | Female family practice attenders aged 40 to 65 years. USA. Number of participants included in the analysis = 435. | |
| Interventions | Tailored text about beliefs, mammography stages, risk factors and barriers. | |
| Outcomes | Mammography stage and uptake measured at eight months after intervention. | |
| Notes | ||
| Risk of bias | ||
| Bias | Authors' judgement | Support for judgement |
| Random sequence generation (selection bias) | Unclear risk | No information provided. |
| Allocation concealment (selection bias) | Unclear risk | No information provided. |
| Blinding of participants and personnel (performance bias) | Unclear risk | The authors do not report blinding of participants and/or personnel. |
| Blinding of outcome assessment (detection bias) | Unclear risk | The authors do not report blinding of outcome assessors. |
| Incomplete outcome data (attrition bias) | Unclear risk | 11% drop out rate, no information on spread of loss of follow‐up across the study arms. |
| Selective reporting (reporting bias) | High risk | Some of the outcomes mentioned in the study were not reported. |
| Funding for the screening test | Unclear risk | No information provided. |
| Baseline comparability | Low risk | Baseline characteristics comparable. |
| Measure against contamination | Unclear risk | None reported. |
| Methods | RCT | |
| Participants | Women with personal and family history of breast and/or ovarian cancer; North Carolina, USA. Number of participants included in the analysis = 262. | |
| Interventions | Tailored print materials about cancer, risk factors, genes and genetic testing and risk quartile in verbal or verbal and numerical format according to woman's preference. | |
| Outcomes | Knowledge, anxiety, accuracy of perceived risk and intention to take genetic test. | |
| Notes | ||
| Risk of bias | ||
| Bias | Authors' judgement | Support for judgement |
| Random sequence generation (selection bias) | Unclear risk | No information provided. |
| Allocation concealment (selection bias) | Unclear risk | No information provided. |
| Blinding of participants and personnel (performance bias) | Unclear risk | The authors do not report blinding of participants and/or personnel. |
| Blinding of outcome assessment (detection bias) | Unclear risk | The authors do not report blinding of outcome assessors. |
| Incomplete outcome data (attrition bias) | Low risk | 16% drop out rate and equal in both study arms. |
| Selective reporting (reporting bias) | Unclear risk | Study protocol unavailable. All outcomes mentioned in the study were reported. |
| Funding for the screening test | Unclear risk | No information provided. |
| Baseline comparability | Low risk | No differences between groups. |
| Measure against contamination | Unclear risk | None reported. |
| Methods | RCT | |
| Participants | Participants were aged 55 to 64 years; speaking mainly English; average or slightly above average colorectal cancer risk; and low educational attainment. Potential participants were randomly drawn from the New South Wales electoral register, using the Australian Bureau of Statistics 'Socio‐Economic Index for Area' codes to target areas identified as socio‐economically disadvantaged (low educational attainment, high unemployment, and unskilled occupations). Number of participants included in the analysis = 572. | |
| Interventions | Intervention was in form of decision aids for colorectal cancer screening. Participants in the intervention group received a paper based booklet and DVD (with or without a question prompt list) that had been designed for adults with low education and literacy skills. The aid contained an interactive exercise for the reader to identify his or her risk factor. | |
| Outcomes | Primary outcomes: Informed choice, knowledge, screening attitudes and behaviour, and involvement preferences in screening decision Secondary: Decision conflict, decision satisfaction, anxiety (STAI), cancer worry and uptake of test measured at two weeks after intervention. | |
| Notes | ||
| Risk of bias | ||
| Bias | Authors' judgement | Support for judgement |
| Random sequence generation (selection bias) | Low risk | Random permuted blocks of size 6 and 9 for each sex stratum. A statistician who had no contact with participants generated this randomisation list. |
| Allocation concealment (selection bias) | Low risk | Interviewers were unaware of allocation. Due to the nature of the intervention it is not possible to blind the participants of the allocation and allocation concealment was done as best as possible. |
| Blinding of participants and personnel (performance bias) | Low risk | Interviewers at baseline interview were blind. |
| Blinding of outcome assessment (detection bias) | Low risk | It was not possible to blind interviewers at follow‐up interview, but questions with standardised wordings and pre‐coded responses were used within a supervised environment. |
| Incomplete outcome data (attrition bias) | Low risk | Reasons for missing data reported and dealt with at analysis stage. Intention‐to‐treat principle used. |
| Selective reporting (reporting bias) | Low risk | Study protocol was available. All outcomes are reported. |
| Funding for the screening test | Low risk | Screening kits were provided with the intervention packs. |
| Baseline comparability | Low risk | Participants were comparable at baseline. |
| Measure against contamination | Unclear risk | No information provided. |
| Methods | RCT | |
| Participants | The study recruited people insured by a large German statutory health insurance scheme, the Gmünder ErsatzKasse (GEK), who were members of the target group for colorectal cancer screening in Germany (age 50 to 75, no history of colorectal cancer). Number of participants included in the analysis = 1586. | |
| Interventions | Evidence based brochure with listing of risk factors were provided to the participants. Internet modules with information based on UKMRC framework for complex interventions were also a part of the interventions. | |
| Outcomes | Primary: Informed consent (Marteau). Secondary: Knowledge, uptake of screening and planned uptake of screening. Outcomes were measured at six weeks after intervention. | |
| Notes | ||
| Risk of bias | ||
| Bias | Authors' judgement | Support for judgement |
| Random sequence generation (selection bias) | Low risk | Computer‐generated random sequence. |
| Allocation concealment (selection bias) | Low risk | Allocation was concealed. Identity numbers were independent of allocation and study members did not have access to data. |
| Blinding of participants and personnel (performance bias) | Low risk | Trial staff who sent out questionnaires and reminder letters and entered data were unaware of the study arm to which participants had been assigned, as was the statistician. |
| Blinding of outcome assessment (detection bias) | Low risk | Trial staff who sent out questionnaires and reminder letters and entered data were unaware of the study arm to which participants had been assigned, as was the statistician. |
| Incomplete outcome data (attrition bias) | Low risk | Low risk. Intention‐to‐treat principle used at analysis. |
| Selective reporting (reporting bias) | Low risk | Study protocol available. All outcomes adequately reported. |
| Funding for the screening test | Low risk | All participants were members of statutory insurance scheme. |
| Baseline comparability | Low risk | Participants were comparable at baseline. |
| Measure against contamination | Low risk | People in same family given same intervention. |
| Methods | RCT | |
| Participants | List of patients between the ages of 50 and 74 years from general practice databases, New South Wales, Australia. Number of participants included in the analysis = 271. | |
| Interventions | Self administered mailed decision aid with personalised risk component versus general information for colorectal cancer screening | |
| Outcomes | Primary outcomes: adequate knowledge, clear values and screening intention (decision) at 4 months post intervention. Secondary outcomes self‐reported FOBT uptake, the Ottawa acceptability scale, short‐form state anxiety scale (not fully published), full decisional conflict scale (not fully published) and self‐efficacy scale, measured at one month. | |
| Notes | ||
| Risk of bias | ||
| Bias | Authors' judgement | Support for judgement |
| Random sequence generation (selection bias) | Low risk | Sequential ID numbers randomly assigned using computer programme. |
| Allocation concealment (selection bias) | Low risk | Allocation was concealed via password protected programme. |
| Blinding of participants and personnel (performance bias) | Unclear risk | The authors do not report blinding of participants and/or personnel. |
| Blinding of outcome assessment (detection bias) | Unclear risk | The authors do not report blinding of outcome assessors. |
| Incomplete outcome data (attrition bias) | Low risk | 14% attrition and equal in both arms. |
| Selective reporting (reporting bias) | High risk | Study protocol available, but had inadequate details for outcome measures. Some of the secondary outcomes mentioned in the study were not reported fully. |
| Funding for the screening test | Unclear risk | No information provided. |
| Baseline comparability | Low risk | Participants were comparable at baseline. |
| Measure against contamination | Unclear risk | No information provided. |
FOBT: Faecal Occult Blood Test
HMO: Health Maintenance Organization
RCT: randomised controlled trial
USA: United States of America
Characteristics of excluded studies [ordered by study ID]
Jump to:
| Study | Reason for exclusion |
| A one group pre‐test and post‐test design. No control group. | |
| This was an evaluation of decision guide with no communication or classification of risk. | |
| Not personalised risk elements despite some attention to susceptibility; personalisation is for transtheoretical stage. | |
| Intervention was tailored to Health Belief Model constructs rather that to risk. | |
| Interventions were delivered in group settings and did not involve personalised risk communication. | |
| This was evaluation of motivational interviewing rather than risk communication. | |
| Individualised counselling based on each woman's barriers to obtaining cervical screening, but not estimating her personal level of risk or risk factors. | |
| Intervention for follow‐up of abnormal Pap smears, not screening. | |
| Intervention involved counselling in which an estimate of a woman's risk of developing breast cancer was given, but no control group present; and main behavioural outcome was not mammography but breast self‐examination. | |
| Personalised risks given, but no control group for this pre‐post study. | |
| Intervention was tailored to Health Belief Model constructs rather that to risk. | |
| No control group. | |
| Tailoring for beliefs and cultural adaptation but not of risk information itself. | |
| A longitudinal study, with risk calculated after cardiovascular screening. | |
| Tailored print and counselling, but no clear evidence that personalised risk information was given. | |
| Patient initiated call for information, consideration of testing; not screening. | |
| Intervention tailored towards participants health beliefs with no personalisation of risk. | |
| Intervention was tailored to Health Belief Model constructs rather that to risk. | |
| This was a protocol with no data. | |
| Identified from the Jepson review as being a 'risk factor assessment study'; but questionnaire assessed symptoms and not risk factors as such. | |
| Stage (of change) matched intervention but not explicitly dealing with individually calculated risk estimates. | |
| Personal health recommendations but not risk communication in screening. Process measures and no outcomes. | |
| A tailored intervention, but not with regards to personal risks. | |
| Intervention was tailored to Health Belief Model constructs rather that to risk. | |
| This study did not address screening. | |
| Intervention was tailored to behaviour theoretical constructs rather that to risk. | |
| Risk was not personalised in this study. | |
| Intervention was tailored to Health Belief Model constructs rather that to risk. | |
| Structured outreach, with identification and removal of barriers to care, but not estimating her personal level of risk or risk factors. |
Characteristics of ongoing studies [ordered by study ID]
Jump to:
| Trial name or title | Changes in risk perceptions in relation to self‐reported colorectal cancer screening among first‐degree relatives of colorectal cancer cases enrolled in a randomized trial. |
| Methods | RCT |
| Participants | People with colorectal cancer, identified through the California Cancer Registry, were contacted and invited to refer their first‐degree relatives to the study. |
| Interventions | Print booklet with information on colorectal cancer and screening, with a personalised risk assessment based on actual risk information assessed during baseline interview. |
| Outcomes | Changes in self‐reported perceived risk in relation to screening behaviour |
| Starting date | Not known |
| Contact information | Beth A Glenn Division of Cancer Prevention and Control Research, School of Public Health and Jonsson Comprehensive Cancer Centre, University of California, Los Angeles, CA 90095‐6900, United States. email: [email protected] |
| Notes | This is a secondary analysis of data. The manuscript for the primary study 'Increasing colorectal cancer screening with a sample of ethnically‐diverse first‐degree relatives of Colorectal cancer cases' has not yet been published. |
| Trial name or title | The Family Health Promotion Project (FHPP): design and baseline data from a randomized trial to increase colonoscopy screening in high risk families. |
| Methods | RCT |
| Participants | Participants were recruited from eight Colorectal Family Register (CFR) and four Cancer Genetics Network (CGN) registry sites. |
| Interventions | Interventions are grounded in several behaviour change theoretical models and delivered via motivational interviewing counselling framework. |
| Outcomes | Adherence to risk appropriate colonoscopic screening in high‐risk individuals. |
| Starting date | Not known |
| Contact information | Jan T. Lowery University of Colorado Cancer Centre, Anschutz Medical Campus, Bldg 500, MS F‐538, PO Box 6508, Aurora, CO 80045‐0508, United States. email: [email protected] |
| Notes |
Data and analyses
| Outcome or subgroup title | No. of studies | No. of participants | Statistical method | Effect size | ||||||||||||
| 1 Informed decision Show forest plot | 3 | 2444 | Odds Ratio (Fixed, 95% CI) | 4.48 [3.62, 5.53] | ||||||||||||
| Analysis 1.1  Comparison 1 personalised risk communication versus general risk information, Outcome 1 Informed decision. | ||||||||||||||||
| 1.1 calculated risk score (numerical) v general information | 1 | 338 | Odds Ratio (Fixed, 95% CI) | 2.08 [1.14, 3.81] | ||||||||||||
| 1.2 personal risk factor list v general information | 2 | 2106 | Odds Ratio (Fixed, 95% CI) | 4.98 [3.97, 6.24] | ||||||||||||
| 2 knowledge regarding screening test / condition concerned Show forest plot | 4 | Std. Mean Difference (Fixed, 95% CI) | Subtotals only | |||||||||||||
| Analysis 1.2 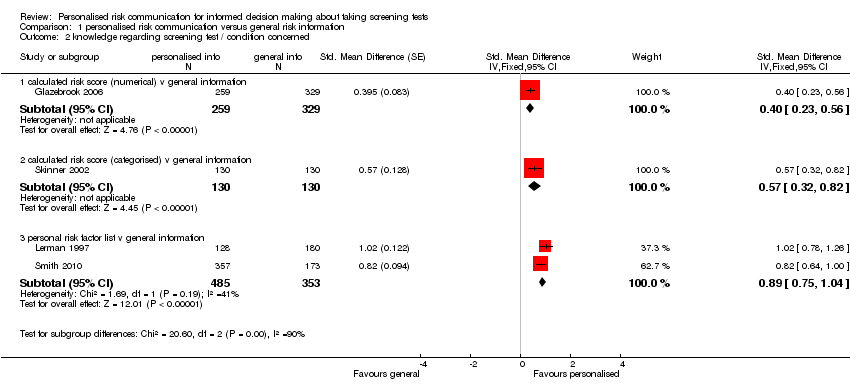 Comparison 1 personalised risk communication versus general risk information, Outcome 2 knowledge regarding screening test / condition concerned. | ||||||||||||||||
| 2.1 calculated risk score (numerical) v general information | 1 | 588 | Std. Mean Difference (Fixed, 95% CI) | 0.40 [0.23, 0.56] | ||||||||||||
| 2.2 calculated risk score (categorised) v general information | 1 | 260 | Std. Mean Difference (Fixed, 95% CI) | 0.57 [0.32, 0.82] | ||||||||||||
| 2.3 personal risk factor list v general information | 2 | 838 | Std. Mean Difference (Fixed, 95% CI) | 0.89 [0.75, 1.04] | ||||||||||||
| 3 knowledge regarding screening test / condition concerned‐ proportion with good knowledge Show forest plot | 3 | Odds Ratio (Random, 95% CI) | Subtotals only | |||||||||||||
| Analysis 1.3 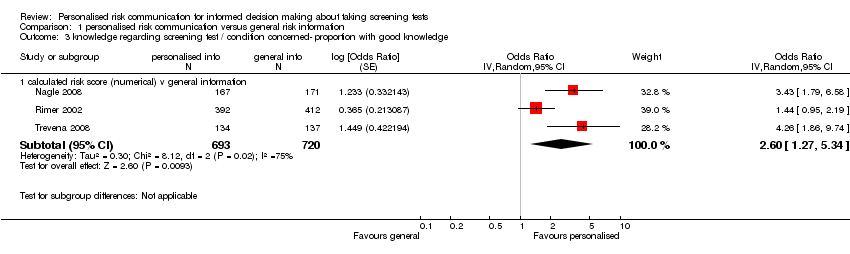 Comparison 1 personalised risk communication versus general risk information, Outcome 3 knowledge regarding screening test / condition concerned‐ proportion with good knowledge. | ||||||||||||||||
| 3.1 calculated risk score (numerical) v general information | 3 | 1413 | Odds Ratio (Random, 95% CI) | 2.60 [1.27, 5.34] | ||||||||||||
| 4 knowledge regarding screening test / condition concerned‐ proportion with good knowledge Show forest plot | 2 | 2107 | Odds Ratio (Fixed, 95% CI) | 7.13 [5.79, 8.79] | ||||||||||||
| Analysis 1.4 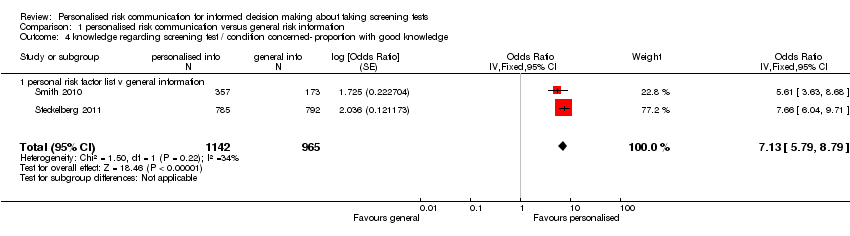 Comparison 1 personalised risk communication versus general risk information, Outcome 4 knowledge regarding screening test / condition concerned‐ proportion with good knowledge. | ||||||||||||||||
| 4.1 personal risk factor list v general information | 2 | 2107 | Odds Ratio (Fixed, 95% CI) | 7.13 [5.79, 8.79] | ||||||||||||
| 5 accurately perceived risk Show forest plot | 3 | 1264 | Odds Ratio (M‐H, Random, 95% CI) | 1.65 [0.96, 2.81] | ||||||||||||
| Analysis 1.5 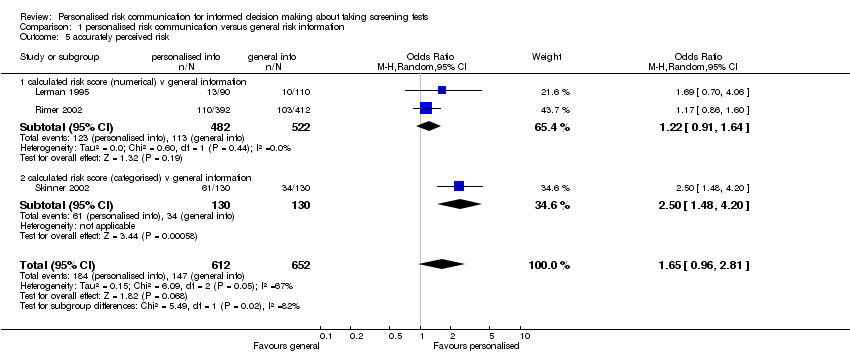 Comparison 1 personalised risk communication versus general risk information, Outcome 5 accurately perceived risk. | ||||||||||||||||
| 5.1 calculated risk score (numerical) v general information | 2 | 1004 | Odds Ratio (M‐H, Random, 95% CI) | 1.22 [0.91, 1.64] | ||||||||||||
| 5.2 calculated risk score (categorised) v general information | 1 | 260 | Odds Ratio (M‐H, Random, 95% CI) | 2.50 [1.48, 4.20] | ||||||||||||
| 6 perceived risk ‐ perceiving self as appropriate candidate for test Show forest plot | 1 | Odds Ratio (M‐H, Fixed, 95% CI) | Totals not selected | |||||||||||||
| Analysis 1.6 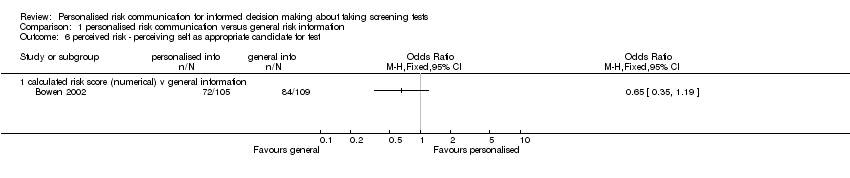 Comparison 1 personalised risk communication versus general risk information, Outcome 6 perceived risk ‐ perceiving self as appropriate candidate for test. | ||||||||||||||||
| 6.1 calculated risk score (numerical) v general information | 1 | Odds Ratio (M‐H, Fixed, 95% CI) | 0.0 [0.0, 0.0] | |||||||||||||
| 7 Anxiety (Cancer related anxiety and helplessness scale; IES breast cancer distress) Show forest plot | 6 | 1848 | Std. Mean Difference (Random, 95% CI) | ‐0.13 [‐0.29, 0.03] | ||||||||||||
| Analysis 1.7  Comparison 1 personalised risk communication versus general risk information, Outcome 7 Anxiety (Cancer related anxiety and helplessness scale; IES breast cancer distress). | ||||||||||||||||
| 7.1 calculated risk score (numerical) v general information | 4 | 1058 | Std. Mean Difference (Random, 95% CI) | ‐0.19 [‐0.42, 0.04] | ||||||||||||
| 7.2 calculated risk score (categorised) v general information | 1 | 260 | Std. Mean Difference (Random, 95% CI) | 0.0 [‐0.24, 0.24] | ||||||||||||
| 7.3 personal risk factor list v general information | 1 | 530 | Std. Mean Difference (Random, 95% CI) | ‐0.02 [‐0.20, 0.16] | ||||||||||||
| 8 decision conflict (proportion with lower scores) Show forest plot | 1 | Odds Ratio (M‐H, Fixed, 95% CI) | Totals not selected | |||||||||||||
| Analysis 1.8 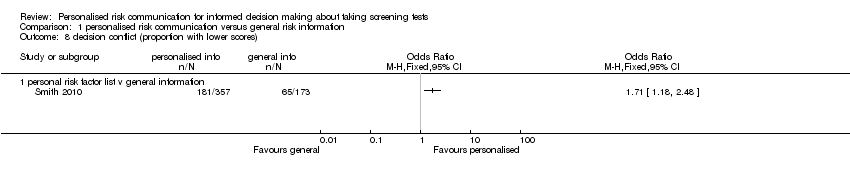 Comparison 1 personalised risk communication versus general risk information, Outcome 8 decision conflict (proportion with lower scores). | ||||||||||||||||
| 8.1 personal risk factor list v general information | 1 | Odds Ratio (M‐H, Fixed, 95% CI) | 0.0 [0.0, 0.0] | |||||||||||||
| 9 decision conflict Show forest plot | 1 | Mean Difference (Fixed, 95% CI) | Totals not selected | |||||||||||||
| Analysis 1.9 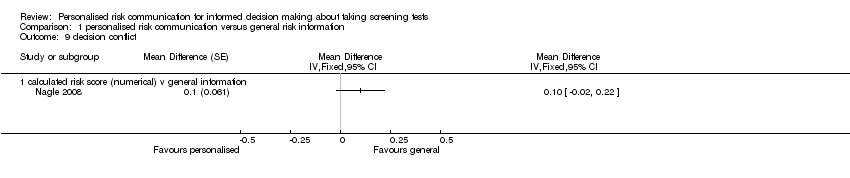 Comparison 1 personalised risk communication versus general risk information, Outcome 9 decision conflict. | ||||||||||||||||
| 9.1 calculated risk score (numerical) v general information | 1 | Mean Difference (Fixed, 95% CI) | 0.0 [0.0, 0.0] | |||||||||||||
| 10 satisfaction with decision Show forest plot | 1 | Mean Difference (IV, Fixed, 95% CI) | Totals not selected | |||||||||||||
| Analysis 1.10 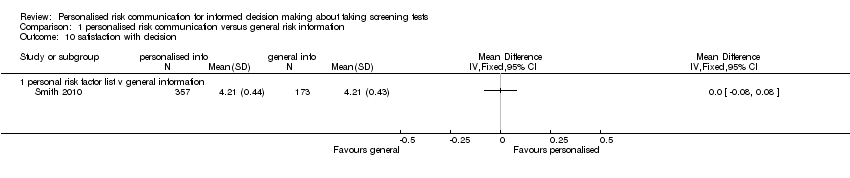 Comparison 1 personalised risk communication versus general risk information, Outcome 10 satisfaction with decision. | ||||||||||||||||
| 10.1 personal risk factor list v general information | 1 | Mean Difference (IV, Fixed, 95% CI) | 0.0 [0.0, 0.0] | |||||||||||||
| 11 intention to take screening test Show forest plot | 7 | Odds Ratio (Random, 95% CI) | Totals not selected | |||||||||||||
| Analysis 1.11  Comparison 1 personalised risk communication versus general risk information, Outcome 11 intention to take screening test. | ||||||||||||||||
| 11.1 calculated risk score (numerical) v general information | 1 | Odds Ratio (Random, 95% CI) | 0.0 [0.0, 0.0] | |||||||||||||
| 11.2 calculated risk score (categorised) v general information | 3 | Odds Ratio (Random, 95% CI) | 0.0 [0.0, 0.0] | |||||||||||||
| 11.3 personal risk factor list v general information | 3 | Odds Ratio (Random, 95% CI) | 0.0 [0.0, 0.0] | |||||||||||||
| 12 intention to take genetic screening test in normal risk patients Show forest plot | 1 | Odds Ratio (M‐H, Fixed, 95% CI) | Totals not selected | |||||||||||||
| Analysis 1.12 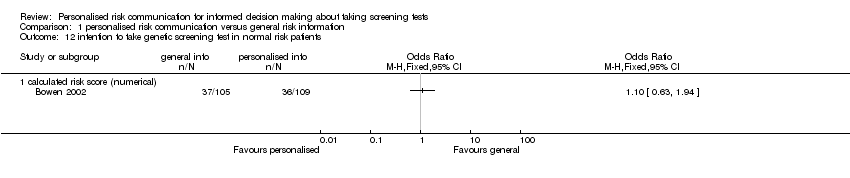 Comparison 1 personalised risk communication versus general risk information, Outcome 12 intention to take genetic screening test in normal risk patients. | ||||||||||||||||
| 12.1 calculated risk score (numerical) | 1 | Odds Ratio (M‐H, Fixed, 95% CI) | 0.0 [0.0, 0.0] | |||||||||||||
| 13 intention to take genetic screening test in normal risk patients Show forest plot | 2 | Mean Difference (Random, 95% CI) | ‐0.77 [‐1.42, ‐0.13] | |||||||||||||
| Analysis 1.13 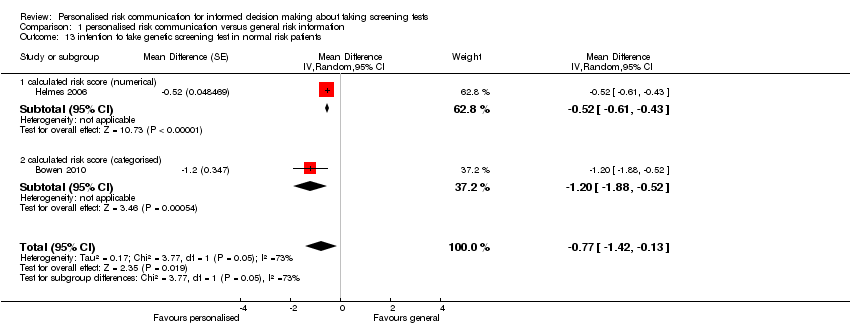 Comparison 1 personalised risk communication versus general risk information, Outcome 13 intention to take genetic screening test in normal risk patients. | ||||||||||||||||
| 13.1 calculated risk score (numerical) | 1 | Mean Difference (Random, 95% CI) | ‐0.52 [‐0.61, ‐0.43] | |||||||||||||
| 13.2 calculated risk score (categorised) | 1 | Mean Difference (Random, 95% CI) | ‐1.2 [‐1.88, ‐0.52] | |||||||||||||
| 14 uptake of screening test Show forest plot | 12 | 6442 | Odds Ratio (Fixed, 95% CI) | 1.15 [1.02, 1.29] | ||||||||||||
| Analysis 1.14  Comparison 1 personalised risk communication versus general risk information, Outcome 14 uptake of screening test. | ||||||||||||||||
| 14.1 calculated risk score (numerical) v general information | 6 | 2569 | Odds Ratio (Fixed, 95% CI) | 0.95 [0.78, 1.15] | ||||||||||||
| 14.2 calculated risk score (categorised) v general information | 6 | 3873 | Odds Ratio (Fixed, 95% CI) | 1.29 [1.11, 1.51] | ||||||||||||
| 15 uptake of screening test Show forest plot | 20 | Odds Ratio (Random, 95% CI) | Totals not selected | |||||||||||||
| Analysis 1.15  Comparison 1 personalised risk communication versus general risk information, Outcome 15 uptake of screening test. | ||||||||||||||||
| 15.1 personal risk factor list v general information | 20 | Odds Ratio (Random, 95% CI) | 0.0 [0.0, 0.0] | |||||||||||||
| 16 appropriate use of cholesterol test Show forest plot | 1 | Odds Ratio (M‐H, Fixed, 95% CI) | Totals not selected | |||||||||||||
| Analysis 1.16 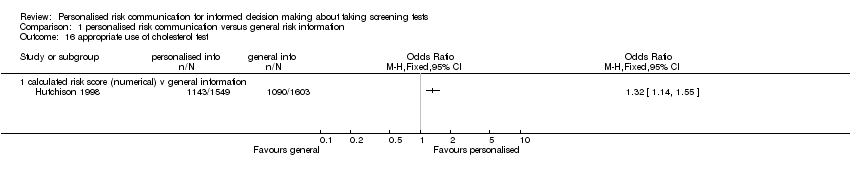 Comparison 1 personalised risk communication versus general risk information, Outcome 16 appropriate use of cholesterol test. | ||||||||||||||||
| 16.1 calculated risk score (numerical) v general information | 1 | Odds Ratio (M‐H, Fixed, 95% CI) | 0.0 [0.0, 0.0] | |||||||||||||
| 17 improvement in risk comprehension/perception Show forest plot | 1 | Odds Ratio (M‐H, Fixed, 95% CI) | Totals not selected | |||||||||||||
| Analysis 1.17  Comparison 1 personalised risk communication versus general risk information, Outcome 17 improvement in risk comprehension/perception. | ||||||||||||||||
| 17.1 calculated risk score (numerical) v general information | 1 | Odds Ratio (M‐H, Fixed, 95% CI) | 0.0 [0.0, 0.0] | |||||||||||||
| 18 stages of change Show forest plot | Other data | No numeric data | ||||||||||||||
| Analysis 1.18
Comparison 1 personalised risk communication versus general risk information, Outcome 18 stages of change. | ||||||||||||||||
| 18.1 personal risk factor list v general information | Other data | No numeric data | ||||||||||||||
| 19 making a recommended behaviour change Show forest plot | 1 | Odds Ratio (M‐H, Fixed, 95% CI) | Totals not selected | |||||||||||||
| Analysis 1.19  Comparison 1 personalised risk communication versus general risk information, Outcome 19 making a recommended behaviour change. | ||||||||||||||||
| 19.1 personal risk factor list v general information | 1 | Odds Ratio (M‐H, Fixed, 95% CI) | 0.0 [0.0, 0.0] | |||||||||||||
| 20 Quality of life (SF‐36) Show forest plot | 1 | Mean Difference (Fixed, 95% CI) | Totals not selected | |||||||||||||
| Analysis 1.20  Comparison 1 personalised risk communication versus general risk information, Outcome 20 Quality of life (SF‐36). | ||||||||||||||||
| 20.1 calculated risk score (categorised) v general information | 1 | Mean Difference (Fixed, 95% CI) | 0.0 [0.0, 0.0] | |||||||||||||
| Outcome or subgroup title | No. of studies | No. of participants | Statistical method | Effect size |
| 1 intention to take screening test Show forest plot | 1 | Odds Ratio (M‐H, Fixed, 95% CI) | Totals not selected | |
| Analysis 2.1 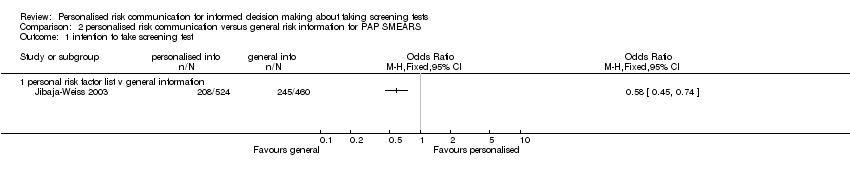 Comparison 2 personalised risk communication versus general risk information for PAP SMEARS, Outcome 1 intention to take screening test. | ||||
| 1.1 personal risk factor list v general information | 1 | Odds Ratio (M‐H, Fixed, 95% CI) | 0.0 [0.0, 0.0] | |
| 2 uptake of screening test Show forest plot | 3 | Odds Ratio (M‐H, Fixed, 95% CI) | Totals not selected | |
| Analysis 2.2  Comparison 2 personalised risk communication versus general risk information for PAP SMEARS, Outcome 2 uptake of screening test. | ||||
| 2.1 calculated risk score (numerical) v general information | 1 | Odds Ratio (M‐H, Fixed, 95% CI) | 0.0 [0.0, 0.0] | |
| 2.2 personal risk factor list v general information | 2 | Odds Ratio (M‐H, Fixed, 95% CI) | 0.0 [0.0, 0.0] | |
| Outcome or subgroup title | No. of studies | No. of participants | Statistical method | Effect size | ||||||||
| 1 knowledge regarding screening test / condition concerned Show forest plot | 1 | Odds Ratio (M‐H, Fixed, 95% CI) | Totals not selected | |||||||||
| Analysis 3.1 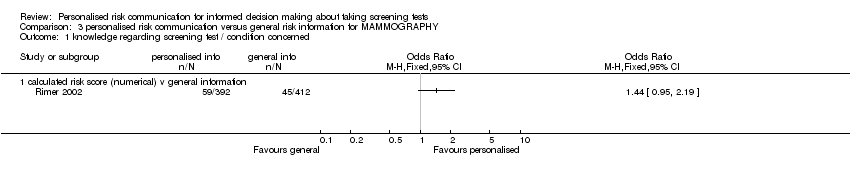 Comparison 3 personalised risk communication versus general risk information for MAMMOGRAPHY, Outcome 1 knowledge regarding screening test / condition concerned. | ||||||||||||
| 1.1 calculated risk score (numerical) v general information | 1 | Odds Ratio (M‐H, Fixed, 95% CI) | 0.0 [0.0, 0.0] | |||||||||
| 2 accuracy of perceived risk Show forest plot | 1 | Odds Ratio (M‐H, Fixed, 95% CI) | Totals not selected | |||||||||
| Analysis 3.2 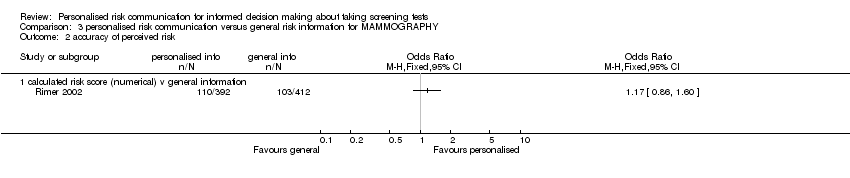 Comparison 3 personalised risk communication versus general risk information for MAMMOGRAPHY, Outcome 2 accuracy of perceived risk. | ||||||||||||
| 2.1 calculated risk score (numerical) v general information | 1 | Odds Ratio (M‐H, Fixed, 95% CI) | 0.0 [0.0, 0.0] | |||||||||
| 3 anxiety (Cancer related anxiety and helplessness scale; IES breast cancer distress) Show forest plot | 1 | Mean Difference (IV, Fixed, 95% CI) | Totals not selected | |||||||||
| Analysis 3.3 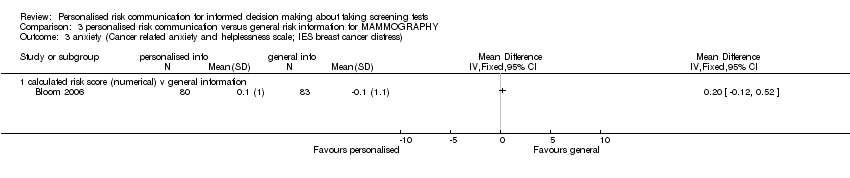 Comparison 3 personalised risk communication versus general risk information for MAMMOGRAPHY, Outcome 3 anxiety (Cancer related anxiety and helplessness scale; IES breast cancer distress). | ||||||||||||
| 3.1 calculated risk score (numerical) v general information | 1 | Mean Difference (IV, Fixed, 95% CI) | 0.0 [0.0, 0.0] | |||||||||
| 4 intention to take screening test Show forest plot | 2 | Odds Ratio (Fixed, 95% CI) | Totals not selected | |||||||||
| Analysis 3.4 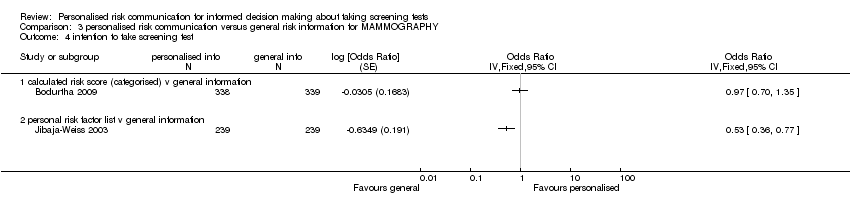 Comparison 3 personalised risk communication versus general risk information for MAMMOGRAPHY, Outcome 4 intention to take screening test. | ||||||||||||
| 4.1 calculated risk score (categorised) v general information | 1 | Odds Ratio (Fixed, 95% CI) | 0.0 [0.0, 0.0] | |||||||||
| 4.2 personal risk factor list v general information | 1 | Odds Ratio (Fixed, 95% CI) | 0.0 [0.0, 0.0] | |||||||||
| 5 uptake of screening test Show forest plot | 4 | 1595 | Odds Ratio (M‐H, Fixed, 95% CI) | 0.84 [0.68, 1.03] | ||||||||
| Analysis 3.5  Comparison 3 personalised risk communication versus general risk information for MAMMOGRAPHY, Outcome 5 uptake of screening test. | ||||||||||||
| 5.1 calculated risk score (numerical) v general information | 4 | 1595 | Odds Ratio (M‐H, Fixed, 95% CI) | 0.84 [0.68, 1.03] | ||||||||
| 6 uptake of screening test Show forest plot | 3 | Odds Ratio (M‐H, Random, 95% CI) | Totals not selected | |||||||||
| Analysis 3.6  Comparison 3 personalised risk communication versus general risk information for MAMMOGRAPHY, Outcome 6 uptake of screening test. | ||||||||||||
| 6.1 calculated risk score (categorised) v general information | 3 | Odds Ratio (M‐H, Random, 95% CI) | 0.0 [0.0, 0.0] | |||||||||
| 7 uptake of screening test Show forest plot | 8 | Odds Ratio (M‐H, Random, 95% CI) | Totals not selected | |||||||||
| Analysis 3.7  Comparison 3 personalised risk communication versus general risk information for MAMMOGRAPHY, Outcome 7 uptake of screening test. | ||||||||||||
| 7.1 personal risk factor list v general information | 8 | Odds Ratio (M‐H, Random, 95% CI) | 0.0 [0.0, 0.0] | |||||||||
| 8 stages of change Show forest plot | Other data | No numeric data | ||||||||||
| Analysis 3.8
Comparison 3 personalised risk communication versus general risk information for MAMMOGRAPHY, Outcome 8 stages of change. | ||||||||||||
| 8.1 personal risk factor list v general information | Other data | No numeric data | ||||||||||
| Outcome or subgroup title | No. of studies | No. of participants | Statistical method | Effect size |
| 1 uptake of screening test Show forest plot | 2 | Odds Ratio (M‐H, Fixed, 95% CI) | Totals not selected | |
| Analysis 4.1  Comparison 4 personalised risk communication versus general risk information for CHOLESTEROL TESTS, Outcome 1 uptake of screening test. | ||||
| 1.1 calculated risk score (numerical) v general information | 1 | Odds Ratio (M‐H, Fixed, 95% CI) | 0.0 [0.0, 0.0] | |
| 1.2 calculated risk score (categorised) v general information | 0 | Odds Ratio (M‐H, Fixed, 95% CI) | 0.0 [0.0, 0.0] | |
| 1.3 personal risk factor list v general information | 1 | Odds Ratio (M‐H, Fixed, 95% CI) | 0.0 [0.0, 0.0] | |
| 2 appropriate use of cholesterol test Show forest plot | 1 | Odds Ratio (M‐H, Fixed, 95% CI) | Totals not selected | |
| Analysis 4.2  Comparison 4 personalised risk communication versus general risk information for CHOLESTEROL TESTS, Outcome 2 appropriate use of cholesterol test. | ||||
| 2.1 personal risk factor list v general information | 1 | Odds Ratio (M‐H, Fixed, 95% CI) | 0.0 [0.0, 0.0] | |
| Outcome or subgroup title | No. of studies | No. of participants | Statistical method | Effect size | ||||||||
| 1 knowledge regarding screening test / condition concerned Show forest plot | 3 | 1156 | Std. Mean Difference (Fixed, 95% CI) | 0.59 [0.47, 0.71] | ||||||||
| Analysis 5.1  Comparison 5 personalised risk communication versus general risk information for 'HIGH RISK' PEOPLE, Outcome 1 knowledge regarding screening test / condition concerned. | ||||||||||||
| 1.1 calculated risk score (numerical) v general information | 1 | 588 | Std. Mean Difference (Fixed, 95% CI) | 0.40 [0.23, 0.56] | ||||||||
| 1.2 calculated risk score (categorised) v general information | 1 | 260 | Std. Mean Difference (Fixed, 95% CI) | 0.57 [0.32, 0.82] | ||||||||
| 1.3 personal risk factor list v general information | 1 | 308 | Std. Mean Difference (Fixed, 95% CI) | 1.02 [0.78, 1.26] | ||||||||
| 2 perceived risk ‐ perceiving self as appropriate candidate for test Show forest plot | 1 | Odds Ratio (M‐H, Fixed, 95% CI) | Totals not selected | |||||||||
| Analysis 5.2 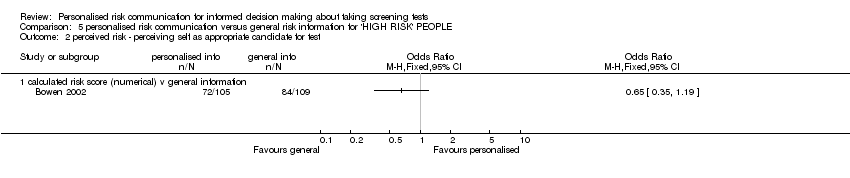 Comparison 5 personalised risk communication versus general risk information for 'HIGH RISK' PEOPLE, Outcome 2 perceived risk ‐ perceiving self as appropriate candidate for test. | ||||||||||||
| 2.1 calculated risk score (numerical) v general information | 1 | Odds Ratio (M‐H, Fixed, 95% CI) | 0.0 [0.0, 0.0] | |||||||||
| 3 accurately perceived risk Show forest plot | 2 | 460 | Odds Ratio (M‐H, Fixed, 95% CI) | 2.25 [1.44, 3.53] | ||||||||
| Analysis 5.3  Comparison 5 personalised risk communication versus general risk information for 'HIGH RISK' PEOPLE, Outcome 3 accurately perceived risk. | ||||||||||||
| 3.1 calculated risk score (numerical) v general information | 1 | 200 | Odds Ratio (M‐H, Fixed, 95% CI) | 1.69 [0.70, 4.06] | ||||||||
| 3.2 calculated risk score (categorised) v general information | 1 | 260 | Odds Ratio (M‐H, Fixed, 95% CI) | 2.50 [1.48, 4.20] | ||||||||
| 4 anxiety (Cancer related anxiety and helplessness scale; IES breast cancer distress) Show forest plot | 3 | 662 | Mean Difference (IV, Fixed, 95% CI) | 0.07 [‐0.14, 0.28] | ||||||||
| Analysis 5.4 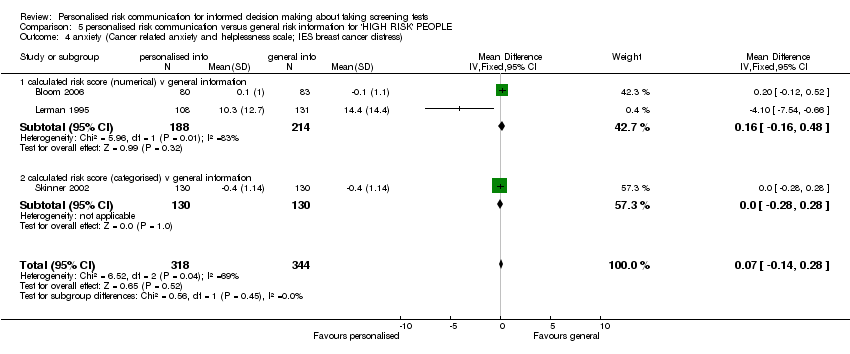 Comparison 5 personalised risk communication versus general risk information for 'HIGH RISK' PEOPLE, Outcome 4 anxiety (Cancer related anxiety and helplessness scale; IES breast cancer distress). | ||||||||||||
| 4.1 calculated risk score (numerical) v general information | 2 | 402 | Mean Difference (IV, Fixed, 95% CI) | 0.16 [‐0.16, 0.48] | ||||||||
| 4.2 calculated risk score (categorised) v general information | 1 | 260 | Mean Difference (IV, Fixed, 95% CI) | 0.0 [‐0.28, 0.28] | ||||||||
| 5 intention to take screening test Show forest plot | 3 | 854 | Odds Ratio (Fixed, 95% CI) | 1.29 [0.97, 1.72] | ||||||||
| Analysis 5.5  Comparison 5 personalised risk communication versus general risk information for 'HIGH RISK' PEOPLE, Outcome 5 intention to take screening test. | ||||||||||||
| 5.1 calculated risk score (categorised) v general information | 1 | 260 | Odds Ratio (Fixed, 95% CI) | 0.21 [0.07, 0.64] | ||||||||
| 5.2 personal risk factor list v general information | 2 | 594 | Odds Ratio (Fixed, 95% CI) | 1.47 [1.09, 1.97] | ||||||||
| 6 uptake of screening test Show forest plot | 5 | 2085 | Odds Ratio (Fixed, 95% CI) | 1.22 [1.00, 1.48] | ||||||||
| Analysis 5.6  Comparison 5 personalised risk communication versus general risk information for 'HIGH RISK' PEOPLE, Outcome 6 uptake of screening test. | ||||||||||||
| 6.1 calculated risk score (numerical) v general information | 3 | 1156 | Odds Ratio (Fixed, 95% CI) | 1.05 [0.79, 1.40] | ||||||||
| 6.2 calculated risk score (categorised) v general information | 2 | 929 | Odds Ratio (Fixed, 95% CI) | 1.38 [1.06, 1.80] | ||||||||
| 7 uptake of screening test Show forest plot | 7 | Odds Ratio (Random, 95% CI) | Totals not selected | |||||||||
| Analysis 5.7  Comparison 5 personalised risk communication versus general risk information for 'HIGH RISK' PEOPLE, Outcome 7 uptake of screening test. | ||||||||||||
| 7.1 personal risk factor list v general information | 7 | Odds Ratio (Random, 95% CI) | 0.0 [0.0, 0.0] | |||||||||
| 8 stages of change Show forest plot | Other data | No numeric data | ||||||||||
| Analysis 5.8
Comparison 5 personalised risk communication versus general risk information for 'HIGH RISK' PEOPLE, Outcome 8 stages of change. | ||||||||||||
| 8.1 personal risk factor list v general information | Other data | No numeric data | ||||||||||
| Outcome or subgroup title | No. of studies | No. of participants | Statistical method | Effect size | ||||||||
| 1 Informed decision Show forest plot | 2 | 2107 | Odds Ratio (Fixed, 95% CI) | 4.99 [3.98, 6.25] | ||||||||
| Analysis 6.1 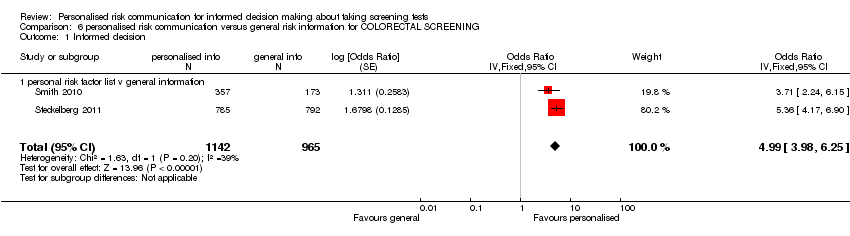 Comparison 6 personalised risk communication versus general risk information for COLORECTAL SCREENING, Outcome 1 Informed decision. | ||||||||||||
| 1.1 personal risk factor list v general information | 2 | 2107 | Odds Ratio (Fixed, 95% CI) | 4.99 [3.98, 6.25] | ||||||||
| 2 knowledge regarding screening test / condition concerned Show forest plot | 3 | 2378 | Odds Ratio (M‐H, Fixed, 95% CI) | 6.81 [5.57, 8.34] | ||||||||
| Analysis 6.2 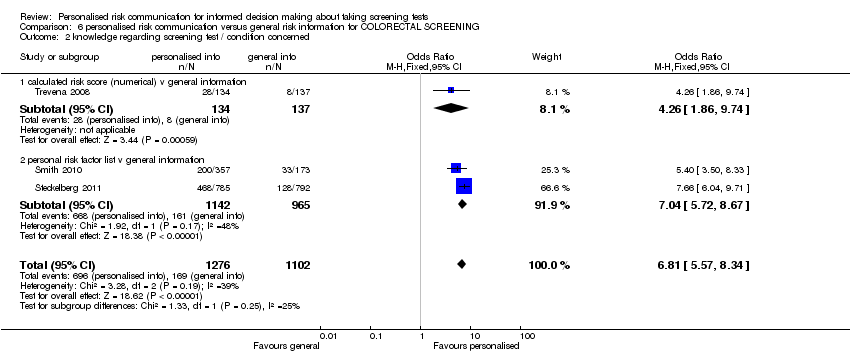 Comparison 6 personalised risk communication versus general risk information for COLORECTAL SCREENING, Outcome 2 knowledge regarding screening test / condition concerned. | ||||||||||||
| 2.1 calculated risk score (numerical) v general information | 1 | 271 | Odds Ratio (M‐H, Fixed, 95% CI) | 4.26 [1.86, 9.74] | ||||||||
| 2.2 personal risk factor list v general information | 2 | 2107 | Odds Ratio (M‐H, Fixed, 95% CI) | 7.04 [5.72, 8.67] | ||||||||
| 3 knowledge regarding screening test / condition concerned Show forest plot | 1 | Mean Difference (IV, Fixed, 95% CI) | Totals not selected | |||||||||
| Analysis 6.3 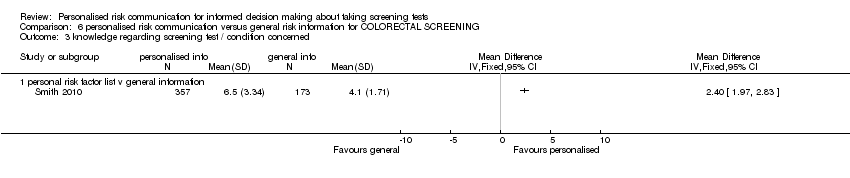 Comparison 6 personalised risk communication versus general risk information for COLORECTAL SCREENING, Outcome 3 knowledge regarding screening test / condition concerned. | ||||||||||||
| 3.1 personal risk factor list v general information | 1 | Mean Difference (IV, Fixed, 95% CI) | 0.0 [0.0, 0.0] | |||||||||
| 4 anxiety (Cancer related anxiety and helplessness scale; IES breast cancer distress) Show forest plot | 1 | Mean Difference (IV, Fixed, 95% CI) | Totals not selected | |||||||||
| Analysis 6.4 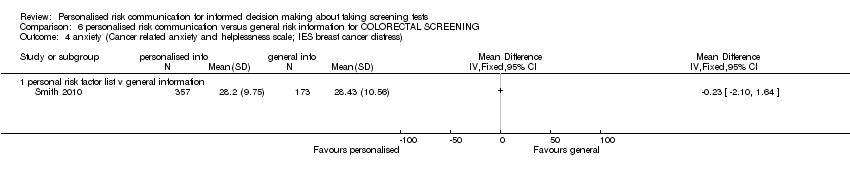 Comparison 6 personalised risk communication versus general risk information for COLORECTAL SCREENING, Outcome 4 anxiety (Cancer related anxiety and helplessness scale; IES breast cancer distress). | ||||||||||||
| 4.1 personal risk factor list v general information | 1 | Mean Difference (IV, Fixed, 95% CI) | 0.0 [0.0, 0.0] | |||||||||
| 5 satisfaction with decision Show forest plot | 1 | Mean Difference (IV, Fixed, 95% CI) | Totals not selected | |||||||||
| Analysis 6.5  Comparison 6 personalised risk communication versus general risk information for COLORECTAL SCREENING, Outcome 5 satisfaction with decision. | ||||||||||||
| 5.1 personal risk factor list v general information | 1 | Mean Difference (IV, Fixed, 95% CI) | 0.0 [0.0, 0.0] | |||||||||
| 6 Decision conflict (proportion with low scores) Show forest plot | 1 | Odds Ratio (M‐H, Fixed, 95% CI) | Totals not selected | |||||||||
| Analysis 6.6  Comparison 6 personalised risk communication versus general risk information for COLORECTAL SCREENING, Outcome 6 Decision conflict (proportion with low scores). | ||||||||||||
| 6.1 personal risk factor list v general information | 1 | Odds Ratio (M‐H, Fixed, 95% CI) | 0.0 [0.0, 0.0] | |||||||||
| 7 intention to take screening test Show forest plot | 1 | Odds Ratio (M‐H, Fixed, 95% CI) | Totals not selected | |||||||||
| Analysis 6.7 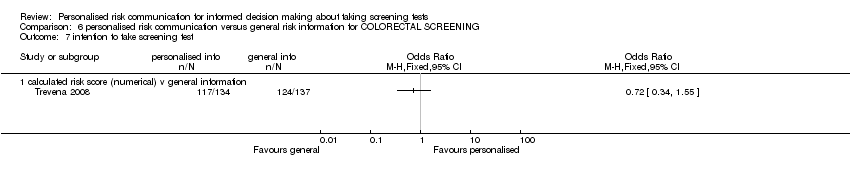 Comparison 6 personalised risk communication versus general risk information for COLORECTAL SCREENING, Outcome 7 intention to take screening test. | ||||||||||||
| 7.1 calculated risk score (numerical) v general information | 1 | Odds Ratio (M‐H, Fixed, 95% CI) | 0.0 [0.0, 0.0] | |||||||||
| 8 uptake of screening test Show forest plot | 10 | 5567 | Odds Ratio (M‐H, Random, 95% CI) | 1.06 [0.82, 1.37] | ||||||||
| Analysis 6.8  Comparison 6 personalised risk communication versus general risk information for COLORECTAL SCREENING, Outcome 8 uptake of screening test. | ||||||||||||
| 8.1 calculated risk score (numerical) v general information | 1 | 271 | Odds Ratio (M‐H, Random, 95% CI) | 0.78 [0.28, 2.17] | ||||||||
| 8.2 calculated risk score (categorised) v general information | 3 | 1557 | Odds Ratio (M‐H, Random, 95% CI) | 1.34 [1.01, 1.77] | ||||||||
| 8.3 personal risk factor list v general information | 6 | 3739 | Odds Ratio (M‐H, Random, 95% CI) | 0.96 [0.68, 1.35] | ||||||||
| 9 stages of change Show forest plot | Other data | No numeric data | ||||||||||
| Analysis 6.9
Comparison 6 personalised risk communication versus general risk information for COLORECTAL SCREENING, Outcome 9 stages of change. | ||||||||||||
| 9.1 personal risk factor list v general information | Other data | No numeric data | ||||||||||
| Outcome or subgroup title | No. of studies | No. of participants | Statistical method | Effect size |
| 1 uptake of screening test Show forest plot | 1 | Odds Ratio (M‐H, Fixed, 95% CI) | Totals not selected | |
| Analysis 7.1 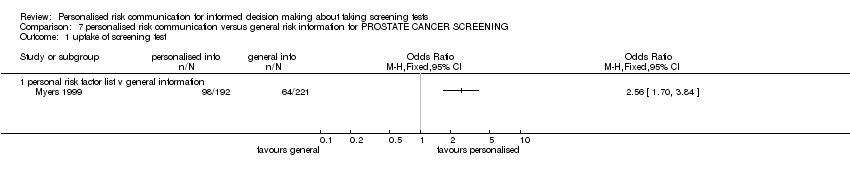 Comparison 7 personalised risk communication versus general risk information for PROSTATE CANCER SCREENING, Outcome 1 uptake of screening test. | ||||
| 1.1 personal risk factor list v general information | 1 | Odds Ratio (M‐H, Fixed, 95% CI) | 0.0 [0.0, 0.0] | |
| Outcome or subgroup title | No. of studies | No. of participants | Statistical method | Effect size |
| 1 knowledge regarding screening test / condition concerned (Generic Inverse Variance) Show forest plot | 1 | Std. Mean Difference (Fixed, 95% CI) | Totals not selected | |
| Analysis 8.1 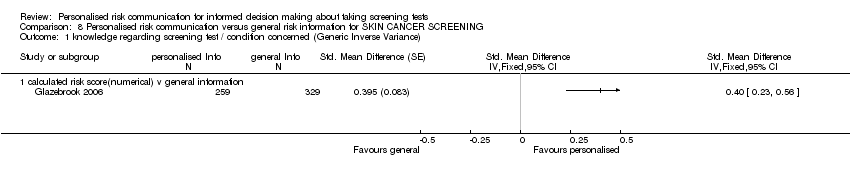 Comparison 8 Personalised risk communication versus general risk information for SKIN CANCER SCREENING, Outcome 1 knowledge regarding screening test / condition concerned (Generic Inverse Variance). | ||||
| 1.1 calculated risk score(numerical) v general information | 1 | Std. Mean Difference (Fixed, 95% CI) | 0.0 [0.0, 0.0] | |
| 2 intention to take screening test Show forest plot | 1 | Odds Ratio (Fixed, 95% CI) | Totals not selected | |
| Analysis 8.2  Comparison 8 Personalised risk communication versus general risk information for SKIN CANCER SCREENING, Outcome 2 intention to take screening test. | ||||
| 2.1 Personal risk factor list v general information | 1 | Odds Ratio (Fixed, 95% CI) | 0.0 [0.0, 0.0] | |
| 3 uptake of screening test Show forest plot | 3 | 1284 | Odds Ratio (Fixed, 95% CI) | 1.69 [1.32, 2.18] |
| Analysis 8.3 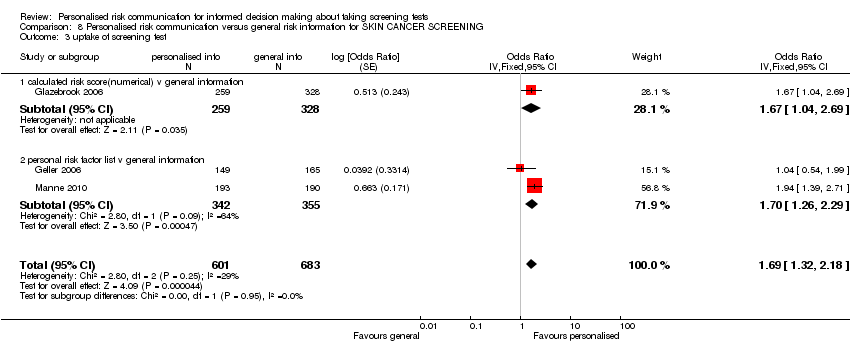 Comparison 8 Personalised risk communication versus general risk information for SKIN CANCER SCREENING, Outcome 3 uptake of screening test. | ||||
| 3.1 calculated risk score(numerical) v general information | 1 | 587 | Odds Ratio (Fixed, 95% CI) | 1.67 [1.04, 2.69] |
| 3.2 personal risk factor list v general information | 2 | 697 | Odds Ratio (Fixed, 95% CI) | 1.70 [1.26, 2.29] |
| Outcome or subgroup title | No. of studies | No. of participants | Statistical method | Effect size |
| 1 Informed decision Show forest plot | 1 | 338 | Odds Ratio (Fixed, 95% CI) | 2.08 [1.14, 3.81] |
| Analysis 9.1  Comparison 9 Personalised risk communication versus general risk information for PRENATAL TESTING FOR FOETAL ABNORMALITY, Outcome 1 Informed decision. | ||||
| 1.1 calculated risk score(numerical) v general information | 1 | 338 | Odds Ratio (Fixed, 95% CI) | 2.08 [1.14, 3.81] |
| 2 knowledge regarding screening test / condition concerned Show forest plot | 1 | Odds Ratio (M‐H, Fixed, 95% CI) | Totals not selected | |
| Analysis 9.2  Comparison 9 Personalised risk communication versus general risk information for PRENATAL TESTING FOR FOETAL ABNORMALITY, Outcome 2 knowledge regarding screening test / condition concerned. | ||||
| 2.1 calculated risk score(numerical) v general information | 1 | Odds Ratio (M‐H, Fixed, 95% CI) | 0.0 [0.0, 0.0] | |
| 3 uptake of screening test Show forest plot | 1 | Odds Ratio (M‐H, Fixed, 95% CI) | Totals not selected | |
| Analysis 9.3 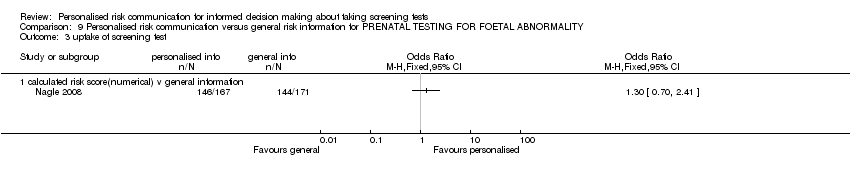 Comparison 9 Personalised risk communication versus general risk information for PRENATAL TESTING FOR FOETAL ABNORMALITY, Outcome 3 uptake of screening test. | ||||
| 3.1 calculated risk score(numerical) v general information | 1 | Odds Ratio (M‐H, Fixed, 95% CI) | 0.0 [0.0, 0.0] | |
| 4 anxiety Show forest plot | 1 | Mean Difference (IV, Fixed, 95% CI) | Totals not selected | |
| Analysis 9.4  Comparison 9 Personalised risk communication versus general risk information for PRENATAL TESTING FOR FOETAL ABNORMALITY, Outcome 4 anxiety. | ||||
| 4.1 calculated risk score(numerical) v general information | 1 | Mean Difference (IV, Fixed, 95% CI) | 0.0 [0.0, 0.0] | |
| 5 decision conflict Show forest plot | 1 | Mean Difference (IV, Fixed, 95% CI) | Totals not selected | |
| Analysis 9.5  Comparison 9 Personalised risk communication versus general risk information for PRENATAL TESTING FOR FOETAL ABNORMALITY, Outcome 5 decision conflict. | ||||
| 5.1 calculated risk score(numerical) v general information | 1 | Mean Difference (IV, Fixed, 95% CI) | 0.0 [0.0, 0.0] | |

Study flow diagram. Search dates from 2006 to March 2012.

Risk of bias summary: review authors' judgements about each risk of bias item for each included study.
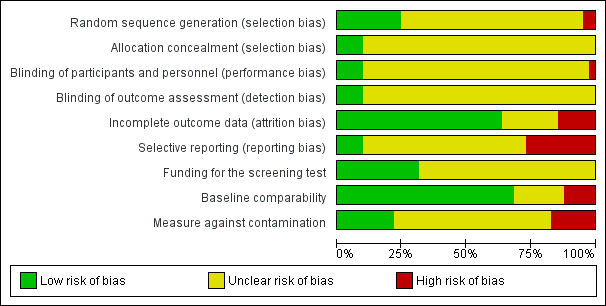
Risk of bias graph: review authors' judgements about each risk of bias item presented as percentages across all included studies.
Comparison 1 personalised risk communication versus general risk information, Outcome 1 Informed decision.
Comparison 1 personalised risk communication versus general risk information, Outcome 2 knowledge regarding screening test / condition concerned.
Comparison 1 personalised risk communication versus general risk information, Outcome 3 knowledge regarding screening test / condition concerned‐ proportion with good knowledge.
Comparison 1 personalised risk communication versus general risk information, Outcome 4 knowledge regarding screening test / condition concerned‐ proportion with good knowledge.
Comparison 1 personalised risk communication versus general risk information, Outcome 5 accurately perceived risk.
Comparison 1 personalised risk communication versus general risk information, Outcome 6 perceived risk ‐ perceiving self as appropriate candidate for test.
Comparison 1 personalised risk communication versus general risk information, Outcome 7 Anxiety (Cancer related anxiety and helplessness scale; IES breast cancer distress).
Comparison 1 personalised risk communication versus general risk information, Outcome 8 decision conflict (proportion with lower scores).
Comparison 1 personalised risk communication versus general risk information, Outcome 9 decision conflict.
Comparison 1 personalised risk communication versus general risk information, Outcome 10 satisfaction with decision.
Comparison 1 personalised risk communication versus general risk information, Outcome 11 intention to take screening test.
Comparison 1 personalised risk communication versus general risk information, Outcome 12 intention to take genetic screening test in normal risk patients.
Comparison 1 personalised risk communication versus general risk information, Outcome 13 intention to take genetic screening test in normal risk patients.
Comparison 1 personalised risk communication versus general risk information, Outcome 14 uptake of screening test.
Comparison 1 personalised risk communication versus general risk information, Outcome 15 uptake of screening test.
Comparison 1 personalised risk communication versus general risk information, Outcome 16 appropriate use of cholesterol test.
Comparison 1 personalised risk communication versus general risk information, Outcome 17 improvement in risk comprehension/perception.
| Study | |
| personal risk factor list v general information | |
| Champion 2007 | All interventions were effective (compared to usual care) in moving women forward in mammography stage (versus same or backward). However, the combination of tailored telephone and print interventions versus usual care, had the largest effect. (OR 1.949, 95% CI 1.355 to 2.815) |
| Rawl 2008 | Forward movement of stage was:
Forward movement of stage was slightly higher in the risk tailored group. |
| Skinner 1994 | 71% did not change; 14% advanced one stage; 12% 'regressed': no significant differences between tailored message and control. |
Comparison 1 personalised risk communication versus general risk information, Outcome 18 stages of change.
Comparison 1 personalised risk communication versus general risk information, Outcome 19 making a recommended behaviour change.
Comparison 1 personalised risk communication versus general risk information, Outcome 20 Quality of life (SF‐36).
Comparison 2 personalised risk communication versus general risk information for PAP SMEARS, Outcome 1 intention to take screening test.
Comparison 2 personalised risk communication versus general risk information for PAP SMEARS, Outcome 2 uptake of screening test.
Comparison 3 personalised risk communication versus general risk information for MAMMOGRAPHY, Outcome 1 knowledge regarding screening test / condition concerned.
Comparison 3 personalised risk communication versus general risk information for MAMMOGRAPHY, Outcome 2 accuracy of perceived risk.
Comparison 3 personalised risk communication versus general risk information for MAMMOGRAPHY, Outcome 3 anxiety (Cancer related anxiety and helplessness scale; IES breast cancer distress).
Comparison 3 personalised risk communication versus general risk information for MAMMOGRAPHY, Outcome 4 intention to take screening test.
Comparison 3 personalised risk communication versus general risk information for MAMMOGRAPHY, Outcome 5 uptake of screening test.
Comparison 3 personalised risk communication versus general risk information for MAMMOGRAPHY, Outcome 6 uptake of screening test.
Comparison 3 personalised risk communication versus general risk information for MAMMOGRAPHY, Outcome 7 uptake of screening test.
| Study | |
| personal risk factor list v general information | |
| Skinner 1994 | 71% did not change; 14% advanced one stage; 12% 'regressed': no significant differences between tailored message and control. |
Comparison 3 personalised risk communication versus general risk information for MAMMOGRAPHY, Outcome 8 stages of change.
Comparison 4 personalised risk communication versus general risk information for CHOLESTEROL TESTS, Outcome 1 uptake of screening test.
Comparison 4 personalised risk communication versus general risk information for CHOLESTEROL TESTS, Outcome 2 appropriate use of cholesterol test.
Comparison 5 personalised risk communication versus general risk information for 'HIGH RISK' PEOPLE, Outcome 1 knowledge regarding screening test / condition concerned.
Comparison 5 personalised risk communication versus general risk information for 'HIGH RISK' PEOPLE, Outcome 2 perceived risk ‐ perceiving self as appropriate candidate for test.
Comparison 5 personalised risk communication versus general risk information for 'HIGH RISK' PEOPLE, Outcome 3 accurately perceived risk.
Comparison 5 personalised risk communication versus general risk information for 'HIGH RISK' PEOPLE, Outcome 4 anxiety (Cancer related anxiety and helplessness scale; IES breast cancer distress).
Comparison 5 personalised risk communication versus general risk information for 'HIGH RISK' PEOPLE, Outcome 5 intention to take screening test.
Comparison 5 personalised risk communication versus general risk information for 'HIGH RISK' PEOPLE, Outcome 6 uptake of screening test.
Comparison 5 personalised risk communication versus general risk information for 'HIGH RISK' PEOPLE, Outcome 7 uptake of screening test.
| Study | |
| personal risk factor list v general information | |
| Rawl 2008 | Forward movement of stage was:
Forward movement of stage was slightly higher in the risk tailored group. |
Comparison 5 personalised risk communication versus general risk information for 'HIGH RISK' PEOPLE, Outcome 8 stages of change.
Comparison 6 personalised risk communication versus general risk information for COLORECTAL SCREENING, Outcome 1 Informed decision.
Comparison 6 personalised risk communication versus general risk information for COLORECTAL SCREENING, Outcome 2 knowledge regarding screening test / condition concerned.
Comparison 6 personalised risk communication versus general risk information for COLORECTAL SCREENING, Outcome 3 knowledge regarding screening test / condition concerned.
Comparison 6 personalised risk communication versus general risk information for COLORECTAL SCREENING, Outcome 4 anxiety (Cancer related anxiety and helplessness scale; IES breast cancer distress).
Comparison 6 personalised risk communication versus general risk information for COLORECTAL SCREENING, Outcome 5 satisfaction with decision.
Comparison 6 personalised risk communication versus general risk information for COLORECTAL SCREENING, Outcome 6 Decision conflict (proportion with low scores).
Comparison 6 personalised risk communication versus general risk information for COLORECTAL SCREENING, Outcome 7 intention to take screening test.
Comparison 6 personalised risk communication versus general risk information for COLORECTAL SCREENING, Outcome 8 uptake of screening test.
| Study | |
| personal risk factor list v general information | |
| Rawl 2008 | Forward movement of stage was:
Forward movement of stage was slightly higher in the risk tailored group. |
Comparison 6 personalised risk communication versus general risk information for COLORECTAL SCREENING, Outcome 9 stages of change.
Comparison 7 personalised risk communication versus general risk information for PROSTATE CANCER SCREENING, Outcome 1 uptake of screening test.
Comparison 8 Personalised risk communication versus general risk information for SKIN CANCER SCREENING, Outcome 1 knowledge regarding screening test / condition concerned (Generic Inverse Variance).
Comparison 8 Personalised risk communication versus general risk information for SKIN CANCER SCREENING, Outcome 2 intention to take screening test.
Comparison 8 Personalised risk communication versus general risk information for SKIN CANCER SCREENING, Outcome 3 uptake of screening test.
Comparison 9 Personalised risk communication versus general risk information for PRENATAL TESTING FOR FOETAL ABNORMALITY, Outcome 1 Informed decision.
Comparison 9 Personalised risk communication versus general risk information for PRENATAL TESTING FOR FOETAL ABNORMALITY, Outcome 2 knowledge regarding screening test / condition concerned.
Comparison 9 Personalised risk communication versus general risk information for PRENATAL TESTING FOR FOETAL ABNORMALITY, Outcome 3 uptake of screening test.
Comparison 9 Personalised risk communication versus general risk information for PRENATAL TESTING FOR FOETAL ABNORMALITY, Outcome 4 anxiety.
Comparison 9 Personalised risk communication versus general risk information for PRENATAL TESTING FOR FOETAL ABNORMALITY, Outcome 5 decision conflict.
| Patient or population: patients with informed decision making about taking screening tests | ||||||
| Outcomes | Illustrative comparative risks* (95% CI) | Relative effect | No of Participants | Quality of the evidence | Comments | |
| Assumed risk8 | Corresponding risk | |||||
| Control | Personalised risk communication versus general risk information | |||||
| Informed decision ‐ Numerical risk and categorised risk combined | 202 per 1000 | 480 per 1000 | OR 3.65 | 2444 | ⊕⊕⊕⊕ | Random‐effects estimate presented due to significant heterogeneity |
| Uptake of screening test ‐ Numerical and categorised risk combined | 532 per 1000 | 566 per 1000 | OR 1.15 | 6442 | ⊕⊕⊝⊝ | Fixed‐effect estimate |
| *The basis for the assumed risk (e.g. the median control group risk across studies) is provided in footnotes. The corresponding risk (and its 95% confidence interval) is based on the assumed risk in the comparison group and the relative effect of the intervention (and its 95% CI). | ||||||
| GRADE Working Group grades of evidence (we have not assessed publication bias for any of the groups) | ||||||
| 1 MMIC: Multi‐dimensional Measure of Informed Choice 8Control risk was used as baseline risk, due to lack of studies that measure this in detail to be presented as baseline risk for the population. | ||||||
| Patient or population: patients with informed decision making about taking screening tests | ||||||
| Outcomes | Illustrative comparative risks* (95% CI) | Relative effect | No of Participants | Quality of the evidence | Comments | |
| Assumed risk10 | Corresponding risk | |||||
| Control | Personalised risk communication versus general risk information | |||||
| Knowledge regarding screening test/condition concerned ‐ calculated risk score (numerical) versus general information | The mean knowledge regarding screening test/condition concerned ‐ calculated risk score (numerical) versus general information in the intervention group was | 588 | ⊕⊕⊕⊝ | SMD 0.4 (0.23 to 0.56) Fixed‐effect estimate | ||
| Knowledge regarding screening test/condition concerned ‐ calculated risk score (categorised) versus general information | The mean knowledge regarding screening test/condition concerned ‐ calculated risk score (categorised) versus general information in the intervention group was | 260 | ⊕⊕⊝⊝ | SMD 0.57 (0.32 to 0.82) Fixed‐effect estimate | ||
| Knowledge regarding screening test/condition concerned ‐ personal risk factor list versus general information | The mean knowledge regarding screening test/condition concerned ‐ personal risk factor list versus general information in the intervention group was | 838 | ⊕⊕⊕⊕ | SMD 0.89 (0.75 to 1.04) Fixed effect estimate | ||
| Knowledge regarding screening test/condition concerned ‐ calculated risk score (numerical) versus general information | 244 per 1000 | 457 per 1000 | OR 2.6 | 1413 | ⊕⊕⊕⊕ high4,6,13,14 | Random‐effects estimate |
| Knowledge regarding screening test / condition concerned ‐ personal risk factor list v general information | 166 per 1000 | 586 per 1000 | OR 7.13 | 2107 | ⊕⊕⊕⊕ | Fixed‐effect estimate |
| Accurately‐perceived risk | 225 per 1000 | 324 per 1000 | OR 1.65 | 1264 | ⊕⊕⊝⊝ | Random‐effects estimate |
| Anxiety ‐ all groups | The mean anxiety in the intervention groups was | 1848 | ⊕⊝⊝⊝ | SMD ‐0.13 (‐0.29 to 0.03) Random‐effects estimate | ||
| *The basis for the assumed risk (e.g. the median control group risk across studies) is provided in footnotes. The corresponding risk (and its 95% confidence interval) is based on the assumed risk in the comparison group and the relative effect of the intervention (and its 95% CI). | ||||||
| GRADE Working Group grades of evidence (we have not assessed publication bias for any of the groups) | ||||||
| 1 This study was high risk for reporting bias. Four risk of bias items were low risk and four were unclear risk. Quality down graded by a point. 10Control risk was used as baseline risk due to lack of studies that measure this in detail to be presented as baseline risk for the population. 11Sample size less than the Optimal Information size (OIS). Quality downgraded by one point. 12Both studies were of low risk of bias and hence not downgraded. 13Significant heterogeneity among studies but all studies have same direction of effect and hence quality not down graded. 14Not downgraded for indirectness of evidence. | ||||||
| Outcome or subgroup title | No. of studies | No. of participants | Statistical method | Effect size |
| 1 Informed decision Show forest plot | 3 | 2444 | Odds Ratio (Fixed, 95% CI) | 4.48 [3.62, 5.53] |
| 1.1 calculated risk score (numerical) v general information | 1 | 338 | Odds Ratio (Fixed, 95% CI) | 2.08 [1.14, 3.81] |
| 1.2 personal risk factor list v general information | 2 | 2106 | Odds Ratio (Fixed, 95% CI) | 4.98 [3.97, 6.24] |
| 2 knowledge regarding screening test / condition concerned Show forest plot | 4 | Std. Mean Difference (Fixed, 95% CI) | Subtotals only | |
| 2.1 calculated risk score (numerical) v general information | 1 | 588 | Std. Mean Difference (Fixed, 95% CI) | 0.40 [0.23, 0.56] |
| 2.2 calculated risk score (categorised) v general information | 1 | 260 | Std. Mean Difference (Fixed, 95% CI) | 0.57 [0.32, 0.82] |
| 2.3 personal risk factor list v general information | 2 | 838 | Std. Mean Difference (Fixed, 95% CI) | 0.89 [0.75, 1.04] |
| 3 knowledge regarding screening test / condition concerned‐ proportion with good knowledge Show forest plot | 3 | Odds Ratio (Random, 95% CI) | Subtotals only | |
| 3.1 calculated risk score (numerical) v general information | 3 | 1413 | Odds Ratio (Random, 95% CI) | 2.60 [1.27, 5.34] |
| 4 knowledge regarding screening test / condition concerned‐ proportion with good knowledge Show forest plot | 2 | 2107 | Odds Ratio (Fixed, 95% CI) | 7.13 [5.79, 8.79] |
| 4.1 personal risk factor list v general information | 2 | 2107 | Odds Ratio (Fixed, 95% CI) | 7.13 [5.79, 8.79] |
| 5 accurately perceived risk Show forest plot | 3 | 1264 | Odds Ratio (M‐H, Random, 95% CI) | 1.65 [0.96, 2.81] |
| 5.1 calculated risk score (numerical) v general information | 2 | 1004 | Odds Ratio (M‐H, Random, 95% CI) | 1.22 [0.91, 1.64] |
| 5.2 calculated risk score (categorised) v general information | 1 | 260 | Odds Ratio (M‐H, Random, 95% CI) | 2.50 [1.48, 4.20] |
| 6 perceived risk ‐ perceiving self as appropriate candidate for test Show forest plot | 1 | Odds Ratio (M‐H, Fixed, 95% CI) | Totals not selected | |
| 6.1 calculated risk score (numerical) v general information | 1 | Odds Ratio (M‐H, Fixed, 95% CI) | 0.0 [0.0, 0.0] | |
| 7 Anxiety (Cancer related anxiety and helplessness scale; IES breast cancer distress) Show forest plot | 6 | 1848 | Std. Mean Difference (Random, 95% CI) | ‐0.13 [‐0.29, 0.03] |
| 7.1 calculated risk score (numerical) v general information | 4 | 1058 | Std. Mean Difference (Random, 95% CI) | ‐0.19 [‐0.42, 0.04] |
| 7.2 calculated risk score (categorised) v general information | 1 | 260 | Std. Mean Difference (Random, 95% CI) | 0.0 [‐0.24, 0.24] |
| 7.3 personal risk factor list v general information | 1 | 530 | Std. Mean Difference (Random, 95% CI) | ‐0.02 [‐0.20, 0.16] |
| 8 decision conflict (proportion with lower scores) Show forest plot | 1 | Odds Ratio (M‐H, Fixed, 95% CI) | Totals not selected | |
| 8.1 personal risk factor list v general information | 1 | Odds Ratio (M‐H, Fixed, 95% CI) | 0.0 [0.0, 0.0] | |
| 9 decision conflict Show forest plot | 1 | Mean Difference (Fixed, 95% CI) | Totals not selected | |
| 9.1 calculated risk score (numerical) v general information | 1 | Mean Difference (Fixed, 95% CI) | 0.0 [0.0, 0.0] | |
| 10 satisfaction with decision Show forest plot | 1 | Mean Difference (IV, Fixed, 95% CI) | Totals not selected | |
| 10.1 personal risk factor list v general information | 1 | Mean Difference (IV, Fixed, 95% CI) | 0.0 [0.0, 0.0] | |
| 11 intention to take screening test Show forest plot | 7 | Odds Ratio (Random, 95% CI) | Totals not selected | |
| 11.1 calculated risk score (numerical) v general information | 1 | Odds Ratio (Random, 95% CI) | 0.0 [0.0, 0.0] | |
| 11.2 calculated risk score (categorised) v general information | 3 | Odds Ratio (Random, 95% CI) | 0.0 [0.0, 0.0] | |
| 11.3 personal risk factor list v general information | 3 | Odds Ratio (Random, 95% CI) | 0.0 [0.0, 0.0] | |
| 12 intention to take genetic screening test in normal risk patients Show forest plot | 1 | Odds Ratio (M‐H, Fixed, 95% CI) | Totals not selected | |
| 12.1 calculated risk score (numerical) | 1 | Odds Ratio (M‐H, Fixed, 95% CI) | 0.0 [0.0, 0.0] | |
| 13 intention to take genetic screening test in normal risk patients Show forest plot | 2 | Mean Difference (Random, 95% CI) | ‐0.77 [‐1.42, ‐0.13] | |
| 13.1 calculated risk score (numerical) | 1 | Mean Difference (Random, 95% CI) | ‐0.52 [‐0.61, ‐0.43] | |
| 13.2 calculated risk score (categorised) | 1 | Mean Difference (Random, 95% CI) | ‐1.2 [‐1.88, ‐0.52] | |
| 14 uptake of screening test Show forest plot | 12 | 6442 | Odds Ratio (Fixed, 95% CI) | 1.15 [1.02, 1.29] |
| 14.1 calculated risk score (numerical) v general information | 6 | 2569 | Odds Ratio (Fixed, 95% CI) | 0.95 [0.78, 1.15] |
| 14.2 calculated risk score (categorised) v general information | 6 | 3873 | Odds Ratio (Fixed, 95% CI) | 1.29 [1.11, 1.51] |
| 15 uptake of screening test Show forest plot | 20 | Odds Ratio (Random, 95% CI) | Totals not selected | |
| 15.1 personal risk factor list v general information | 20 | Odds Ratio (Random, 95% CI) | 0.0 [0.0, 0.0] | |
| 16 appropriate use of cholesterol test Show forest plot | 1 | Odds Ratio (M‐H, Fixed, 95% CI) | Totals not selected | |
| 16.1 calculated risk score (numerical) v general information | 1 | Odds Ratio (M‐H, Fixed, 95% CI) | 0.0 [0.0, 0.0] | |
| 17 improvement in risk comprehension/perception Show forest plot | 1 | Odds Ratio (M‐H, Fixed, 95% CI) | Totals not selected | |
| 17.1 calculated risk score (numerical) v general information | 1 | Odds Ratio (M‐H, Fixed, 95% CI) | 0.0 [0.0, 0.0] | |
| 18 stages of change Show forest plot | Other data | No numeric data | ||
| 18.1 personal risk factor list v general information | Other data | No numeric data | ||
| 19 making a recommended behaviour change Show forest plot | 1 | Odds Ratio (M‐H, Fixed, 95% CI) | Totals not selected | |
| 19.1 personal risk factor list v general information | 1 | Odds Ratio (M‐H, Fixed, 95% CI) | 0.0 [0.0, 0.0] | |
| 20 Quality of life (SF‐36) Show forest plot | 1 | Mean Difference (Fixed, 95% CI) | Totals not selected | |
| 20.1 calculated risk score (categorised) v general information | 1 | Mean Difference (Fixed, 95% CI) | 0.0 [0.0, 0.0] | |
| Outcome or subgroup title | No. of studies | No. of participants | Statistical method | Effect size |
| 1 intention to take screening test Show forest plot | 1 | Odds Ratio (M‐H, Fixed, 95% CI) | Totals not selected | |
| 1.1 personal risk factor list v general information | 1 | Odds Ratio (M‐H, Fixed, 95% CI) | 0.0 [0.0, 0.0] | |
| 2 uptake of screening test Show forest plot | 3 | Odds Ratio (M‐H, Fixed, 95% CI) | Totals not selected | |
| 2.1 calculated risk score (numerical) v general information | 1 | Odds Ratio (M‐H, Fixed, 95% CI) | 0.0 [0.0, 0.0] | |
| 2.2 personal risk factor list v general information | 2 | Odds Ratio (M‐H, Fixed, 95% CI) | 0.0 [0.0, 0.0] | |
| Outcome or subgroup title | No. of studies | No. of participants | Statistical method | Effect size |
| 1 knowledge regarding screening test / condition concerned Show forest plot | 1 | Odds Ratio (M‐H, Fixed, 95% CI) | Totals not selected | |
| 1.1 calculated risk score (numerical) v general information | 1 | Odds Ratio (M‐H, Fixed, 95% CI) | 0.0 [0.0, 0.0] | |
| 2 accuracy of perceived risk Show forest plot | 1 | Odds Ratio (M‐H, Fixed, 95% CI) | Totals not selected | |
| 2.1 calculated risk score (numerical) v general information | 1 | Odds Ratio (M‐H, Fixed, 95% CI) | 0.0 [0.0, 0.0] | |
| 3 anxiety (Cancer related anxiety and helplessness scale; IES breast cancer distress) Show forest plot | 1 | Mean Difference (IV, Fixed, 95% CI) | Totals not selected | |
| 3.1 calculated risk score (numerical) v general information | 1 | Mean Difference (IV, Fixed, 95% CI) | 0.0 [0.0, 0.0] | |
| 4 intention to take screening test Show forest plot | 2 | Odds Ratio (Fixed, 95% CI) | Totals not selected | |
| 4.1 calculated risk score (categorised) v general information | 1 | Odds Ratio (Fixed, 95% CI) | 0.0 [0.0, 0.0] | |
| 4.2 personal risk factor list v general information | 1 | Odds Ratio (Fixed, 95% CI) | 0.0 [0.0, 0.0] | |
| 5 uptake of screening test Show forest plot | 4 | 1595 | Odds Ratio (M‐H, Fixed, 95% CI) | 0.84 [0.68, 1.03] |
| 5.1 calculated risk score (numerical) v general information | 4 | 1595 | Odds Ratio (M‐H, Fixed, 95% CI) | 0.84 [0.68, 1.03] |
| 6 uptake of screening test Show forest plot | 3 | Odds Ratio (M‐H, Random, 95% CI) | Totals not selected | |
| 6.1 calculated risk score (categorised) v general information | 3 | Odds Ratio (M‐H, Random, 95% CI) | 0.0 [0.0, 0.0] | |
| 7 uptake of screening test Show forest plot | 8 | Odds Ratio (M‐H, Random, 95% CI) | Totals not selected | |
| 7.1 personal risk factor list v general information | 8 | Odds Ratio (M‐H, Random, 95% CI) | 0.0 [0.0, 0.0] | |
| 8 stages of change Show forest plot | Other data | No numeric data | ||
| 8.1 personal risk factor list v general information | Other data | No numeric data | ||
| Outcome or subgroup title | No. of studies | No. of participants | Statistical method | Effect size |
| 1 uptake of screening test Show forest plot | 2 | Odds Ratio (M‐H, Fixed, 95% CI) | Totals not selected | |
| 1.1 calculated risk score (numerical) v general information | 1 | Odds Ratio (M‐H, Fixed, 95% CI) | 0.0 [0.0, 0.0] | |
| 1.2 calculated risk score (categorised) v general information | 0 | Odds Ratio (M‐H, Fixed, 95% CI) | 0.0 [0.0, 0.0] | |
| 1.3 personal risk factor list v general information | 1 | Odds Ratio (M‐H, Fixed, 95% CI) | 0.0 [0.0, 0.0] | |
| 2 appropriate use of cholesterol test Show forest plot | 1 | Odds Ratio (M‐H, Fixed, 95% CI) | Totals not selected | |
| 2.1 personal risk factor list v general information | 1 | Odds Ratio (M‐H, Fixed, 95% CI) | 0.0 [0.0, 0.0] | |
| Outcome or subgroup title | No. of studies | No. of participants | Statistical method | Effect size |
| 1 knowledge regarding screening test / condition concerned Show forest plot | 3 | 1156 | Std. Mean Difference (Fixed, 95% CI) | 0.59 [0.47, 0.71] |
| 1.1 calculated risk score (numerical) v general information | 1 | 588 | Std. Mean Difference (Fixed, 95% CI) | 0.40 [0.23, 0.56] |
| 1.2 calculated risk score (categorised) v general information | 1 | 260 | Std. Mean Difference (Fixed, 95% CI) | 0.57 [0.32, 0.82] |
| 1.3 personal risk factor list v general information | 1 | 308 | Std. Mean Difference (Fixed, 95% CI) | 1.02 [0.78, 1.26] |
| 2 perceived risk ‐ perceiving self as appropriate candidate for test Show forest plot | 1 | Odds Ratio (M‐H, Fixed, 95% CI) | Totals not selected | |
| 2.1 calculated risk score (numerical) v general information | 1 | Odds Ratio (M‐H, Fixed, 95% CI) | 0.0 [0.0, 0.0] | |
| 3 accurately perceived risk Show forest plot | 2 | 460 | Odds Ratio (M‐H, Fixed, 95% CI) | 2.25 [1.44, 3.53] |
| 3.1 calculated risk score (numerical) v general information | 1 | 200 | Odds Ratio (M‐H, Fixed, 95% CI) | 1.69 [0.70, 4.06] |
| 3.2 calculated risk score (categorised) v general information | 1 | 260 | Odds Ratio (M‐H, Fixed, 95% CI) | 2.50 [1.48, 4.20] |
| 4 anxiety (Cancer related anxiety and helplessness scale; IES breast cancer distress) Show forest plot | 3 | 662 | Mean Difference (IV, Fixed, 95% CI) | 0.07 [‐0.14, 0.28] |
| 4.1 calculated risk score (numerical) v general information | 2 | 402 | Mean Difference (IV, Fixed, 95% CI) | 0.16 [‐0.16, 0.48] |
| 4.2 calculated risk score (categorised) v general information | 1 | 260 | Mean Difference (IV, Fixed, 95% CI) | 0.0 [‐0.28, 0.28] |
| 5 intention to take screening test Show forest plot | 3 | 854 | Odds Ratio (Fixed, 95% CI) | 1.29 [0.97, 1.72] |
| 5.1 calculated risk score (categorised) v general information | 1 | 260 | Odds Ratio (Fixed, 95% CI) | 0.21 [0.07, 0.64] |
| 5.2 personal risk factor list v general information | 2 | 594 | Odds Ratio (Fixed, 95% CI) | 1.47 [1.09, 1.97] |
| 6 uptake of screening test Show forest plot | 5 | 2085 | Odds Ratio (Fixed, 95% CI) | 1.22 [1.00, 1.48] |
| 6.1 calculated risk score (numerical) v general information | 3 | 1156 | Odds Ratio (Fixed, 95% CI) | 1.05 [0.79, 1.40] |
| 6.2 calculated risk score (categorised) v general information | 2 | 929 | Odds Ratio (Fixed, 95% CI) | 1.38 [1.06, 1.80] |
| 7 uptake of screening test Show forest plot | 7 | Odds Ratio (Random, 95% CI) | Totals not selected | |
| 7.1 personal risk factor list v general information | 7 | Odds Ratio (Random, 95% CI) | 0.0 [0.0, 0.0] | |
| 8 stages of change Show forest plot | Other data | No numeric data | ||
| 8.1 personal risk factor list v general information | Other data | No numeric data | ||
| Outcome or subgroup title | No. of studies | No. of participants | Statistical method | Effect size |
| 1 Informed decision Show forest plot | 2 | 2107 | Odds Ratio (Fixed, 95% CI) | 4.99 [3.98, 6.25] |
| 1.1 personal risk factor list v general information | 2 | 2107 | Odds Ratio (Fixed, 95% CI) | 4.99 [3.98, 6.25] |
| 2 knowledge regarding screening test / condition concerned Show forest plot | 3 | 2378 | Odds Ratio (M‐H, Fixed, 95% CI) | 6.81 [5.57, 8.34] |
| 2.1 calculated risk score (numerical) v general information | 1 | 271 | Odds Ratio (M‐H, Fixed, 95% CI) | 4.26 [1.86, 9.74] |
| 2.2 personal risk factor list v general information | 2 | 2107 | Odds Ratio (M‐H, Fixed, 95% CI) | 7.04 [5.72, 8.67] |
| 3 knowledge regarding screening test / condition concerned Show forest plot | 1 | Mean Difference (IV, Fixed, 95% CI) | Totals not selected | |
| 3.1 personal risk factor list v general information | 1 | Mean Difference (IV, Fixed, 95% CI) | 0.0 [0.0, 0.0] | |
| 4 anxiety (Cancer related anxiety and helplessness scale; IES breast cancer distress) Show forest plot | 1 | Mean Difference (IV, Fixed, 95% CI) | Totals not selected | |
| 4.1 personal risk factor list v general information | 1 | Mean Difference (IV, Fixed, 95% CI) | 0.0 [0.0, 0.0] | |
| 5 satisfaction with decision Show forest plot | 1 | Mean Difference (IV, Fixed, 95% CI) | Totals not selected | |
| 5.1 personal risk factor list v general information | 1 | Mean Difference (IV, Fixed, 95% CI) | 0.0 [0.0, 0.0] | |
| 6 Decision conflict (proportion with low scores) Show forest plot | 1 | Odds Ratio (M‐H, Fixed, 95% CI) | Totals not selected | |
| 6.1 personal risk factor list v general information | 1 | Odds Ratio (M‐H, Fixed, 95% CI) | 0.0 [0.0, 0.0] | |
| 7 intention to take screening test Show forest plot | 1 | Odds Ratio (M‐H, Fixed, 95% CI) | Totals not selected | |
| 7.1 calculated risk score (numerical) v general information | 1 | Odds Ratio (M‐H, Fixed, 95% CI) | 0.0 [0.0, 0.0] | |
| 8 uptake of screening test Show forest plot | 10 | 5567 | Odds Ratio (M‐H, Random, 95% CI) | 1.06 [0.82, 1.37] |
| 8.1 calculated risk score (numerical) v general information | 1 | 271 | Odds Ratio (M‐H, Random, 95% CI) | 0.78 [0.28, 2.17] |
| 8.2 calculated risk score (categorised) v general information | 3 | 1557 | Odds Ratio (M‐H, Random, 95% CI) | 1.34 [1.01, 1.77] |
| 8.3 personal risk factor list v general information | 6 | 3739 | Odds Ratio (M‐H, Random, 95% CI) | 0.96 [0.68, 1.35] |
| 9 stages of change Show forest plot | Other data | No numeric data | ||
| 9.1 personal risk factor list v general information | Other data | No numeric data | ||
| Outcome or subgroup title | No. of studies | No. of participants | Statistical method | Effect size |
| 1 uptake of screening test Show forest plot | 1 | Odds Ratio (M‐H, Fixed, 95% CI) | Totals not selected | |
| 1.1 personal risk factor list v general information | 1 | Odds Ratio (M‐H, Fixed, 95% CI) | 0.0 [0.0, 0.0] | |
| Outcome or subgroup title | No. of studies | No. of participants | Statistical method | Effect size |
| 1 knowledge regarding screening test / condition concerned (Generic Inverse Variance) Show forest plot | 1 | Std. Mean Difference (Fixed, 95% CI) | Totals not selected | |
| 1.1 calculated risk score(numerical) v general information | 1 | Std. Mean Difference (Fixed, 95% CI) | 0.0 [0.0, 0.0] | |
| 2 intention to take screening test Show forest plot | 1 | Odds Ratio (Fixed, 95% CI) | Totals not selected | |
| 2.1 Personal risk factor list v general information | 1 | Odds Ratio (Fixed, 95% CI) | 0.0 [0.0, 0.0] | |
| 3 uptake of screening test Show forest plot | 3 | 1284 | Odds Ratio (Fixed, 95% CI) | 1.69 [1.32, 2.18] |
| 3.1 calculated risk score(numerical) v general information | 1 | 587 | Odds Ratio (Fixed, 95% CI) | 1.67 [1.04, 2.69] |
| 3.2 personal risk factor list v general information | 2 | 697 | Odds Ratio (Fixed, 95% CI) | 1.70 [1.26, 2.29] |
| Outcome or subgroup title | No. of studies | No. of participants | Statistical method | Effect size |
| 1 Informed decision Show forest plot | 1 | 338 | Odds Ratio (Fixed, 95% CI) | 2.08 [1.14, 3.81] |
| 1.1 calculated risk score(numerical) v general information | 1 | 338 | Odds Ratio (Fixed, 95% CI) | 2.08 [1.14, 3.81] |
| 2 knowledge regarding screening test / condition concerned Show forest plot | 1 | Odds Ratio (M‐H, Fixed, 95% CI) | Totals not selected | |
| 2.1 calculated risk score(numerical) v general information | 1 | Odds Ratio (M‐H, Fixed, 95% CI) | 0.0 [0.0, 0.0] | |
| 3 uptake of screening test Show forest plot | 1 | Odds Ratio (M‐H, Fixed, 95% CI) | Totals not selected | |
| 3.1 calculated risk score(numerical) v general information | 1 | Odds Ratio (M‐H, Fixed, 95% CI) | 0.0 [0.0, 0.0] | |
| 4 anxiety Show forest plot | 1 | Mean Difference (IV, Fixed, 95% CI) | Totals not selected | |
| 4.1 calculated risk score(numerical) v general information | 1 | Mean Difference (IV, Fixed, 95% CI) | 0.0 [0.0, 0.0] | |
| 5 decision conflict Show forest plot | 1 | Mean Difference (IV, Fixed, 95% CI) | Totals not selected | |
| 5.1 calculated risk score(numerical) v general information | 1 | Mean Difference (IV, Fixed, 95% CI) | 0.0 [0.0, 0.0] | |