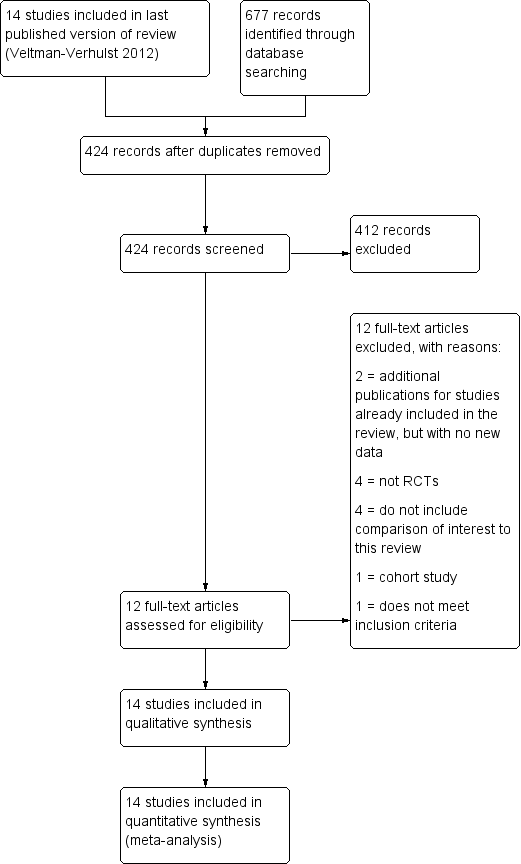
Intra‐uterine insemination for unexplained subfertility
References
References to studies included in this review
References to studies excluded from this review
Additional references
References to other published versions of this review
Characteristics of studies
Characteristics of included studies [ordered by study ID]
Jump to:
| Methods | Trial design: parallel Nr of Pt randomised: IUI + OH 70; TI + OH 70 | |
| Participants | Couples with unexplained subfertility | |
| Interventions | Comparison: IUI + OH versus TI + OH | |
| Outcomes | Live birth and PR per couple and per cycle Pregnancy confirmed by USS showing gestational sac | |
| Notes | ITT analysis: possible | |
| Risk of bias | ||
| Bias | Authors' judgement | Support for judgement |
| Random sequence generation (selection bias) | Low risk | Random number table |
| Allocation concealment (selection bias) | Low risk | Adequate; sealed opaque envelopes |
| Blinding (performance bias and detection bias) | Unclear risk | Blinding was not possible because of the nature of the interventions and non‐blinding was not likely to affect the outcomes of interest |
| Incomplete outcome data (attrition bias) | High risk | There was an unequal dropout in the treatment group due to financial reasons. |
| Selective reporting (reporting bias) | Unclear risk | Reported on live birth, however authors provided additional information on ongoing pregnancies and twin pregnancies resulting in different data used for meta‐analysis |
| Other bias | Low risk | Baseline demographic characteristics similar between the two groups |
| Methods | Trial design: parallel Nr of Pt randomised: IUI + OH 36; TI + OH 32 | |
| Participants | Couples with unexplained subfertility | |
| Interventions | Comparison: IUI + OH versus TI + OH | |
| Outcomes | PR per couple Pregnancy confirmed by USS | |
| Notes | ITT analysis: yes | |
| Risk of bias | ||
| Bias | Authors' judgement | Support for judgement |
| Random sequence generation (selection bias) | Unclear risk | Not stated |
| Allocation concealment (selection bias) | Unclear risk | Unclear |
| Blinding (performance bias and detection bias) | Unclear risk | Blinding was not possible because of the nature of the interventions and non‐blinding was not likely to affect the outcomes of interest |
| Incomplete outcome data (attrition bias) | Low risk | A total of 16 cancelled treatment cycles is described and analysed according to intention to treat. People who dropped out are clearly stated in a table |
| Selective reporting (reporting bias) | Unclear risk | Did not report on live birth, however, did not intend to report on live birth |
| Other bias | Low risk | Nothing detected |
| Methods | Trial design: crossover (after 1 cycle) Nr of Pt randomised: 26 | |
| Participants | Couples with unexplained subfertility and couples with male factor subfertility | |
| Interventions | Comparison: IUI + NC versus IUI + OH Timing: | |
| Outcomes | Live birth and PR per couple Pregnancy confirmed by USS showing gestational sac | |
| Notes | ITT analysis: yes | |
| Risk of bias | ||
| Bias | Authors' judgement | Support for judgement |
| Random sequence generation (selection bias) | Low risk | Computer‐generated random number table |
| Allocation concealment (selection bias) | Low risk | Adequate; computer system utilising locked files |
| Blinding (performance bias and detection bias) | Unclear risk | Blinding was not possible because of the nature of the interventions and non‐blinding was not likely to affect the outcomes of interest |
| Incomplete outcome data (attrition bias) | Low risk | Author gave additional information on dropout rates of the couples with unexplained subfertility. Of the 26 women with unexplained subfertility, dropout occurred after one treatment cycle. Post‐crossover data are not included in the meta‐analysis |
| Selective reporting (reporting bias) | Low risk | Live birth data were obtained from the author |
| Other bias | Unclear risk | No sufficient information reported on baseline demographic characteristics |
| Methods | Trial design: parallel Nr of Pt randomised: 509 with unexplained subfertility only (total 580) | |
| Participants | Couples with unexplained subfertility, (mild male factor infertility and minimal endometriosis) | |
| Interventions | Comparison: TI (expectant management) + NC versus TI + OH versus IUI + NC | |
| Outcomes | Live birth and PR per couple Pregnancy confirmed by USS showing gestational sac and foetal heart beat | |
| Notes | The author provided additional data on the couples with unexplained subfertility only The baseline characteristics of the participants reported are from the group total. ITT analysis was therefore possible and performed Author provided additional information | |
| Risk of bias | ||
| Bias | Authors' judgement | Support for judgement |
| Random sequence generation (selection bias) | Low risk | Sequence generated by independent statistician |
| Allocation concealment (selection bias) | Low risk | Adequate; central telephone randomisation system |
| Blinding (performance bias and detection bias) | Unclear risk | Blinding was not possible because of the nature of the interventions and non‐blinding was not likely to affect the outcomes of interest |
| Incomplete outcome data (attrition bias) | Low risk | Loss to follow‐up and participants who received alternative treatment are presented in a flow‐chart. |
| Selective reporting (reporting bias) | Low risk | Live birth data and adverse events are published |
| Other bias | Low risk | Nothing detected |
| Methods | Trial design: parallel Nr of Pt randomised: 100 | |
| Participants | Couples with unexplained subfertility | |
| Interventions | Comparison: IUI + OH versus TI + OH | |
| Outcomes | PR per couple and per cycle | |
| Notes | ITT analysis: possible | |
| Risk of bias | ||
| Bias | Authors' judgement | Support for judgement |
| Random sequence generation (selection bias) | Low risk | Blocked randomisation scheme |
| Allocation concealment (selection bias) | Low risk | Adequate; numbered sealed envelopes |
| Blinding (performance bias and detection bias) | Unclear risk | Blinding was not possible because of the nature of the interventions and non‐blinding was not likely to affect the outcomes of interest |
| Incomplete outcome data (attrition bias) | Unclear risk | 8/50 withdrawn and 6 treatment cycles cancelled in TI group, 4/50 withdrawn and 11 treatment cycles cancelled in IUI group. Reason for cycle cancellation was excessive response. Reason for withdrawal was not stated |
| Selective reporting (reporting bias) | Low risk | Live birth data and complication numbers were reported. |
| Other bias | Low risk | Nothing detected |
| Methods | Data from centre 10: Hedon, Montpellier, France Trial design: crossover (after 1 cycle) Nr of Pt randomised: unclear | |
| Participants | Couples with unexplained subfertility | |
| Interventions | Comparison: IUI + OH versus TI + OH | |
| Outcomes | PR per 1st cycle | |
| Notes | ITT analysis: not possible | |
| Risk of bias | ||
| Bias | Authors' judgement | Support for judgement |
| Random sequence generation (selection bias) | Unclear risk | Each centre used own randomisation method. The per‐centre method could not be obtained |
| Allocation concealment (selection bias) | Unclear risk | Unclear; each centre used own treatment allocation method. The per‐centre method could not be obtained |
| Blinding (performance bias and detection bias) | Unclear risk | Blinding was not possible because of the nature of the interventions and non‐blinding was not likely to affect the outcomes of interest |
| Incomplete outcome data (attrition bias) | High risk | Details on participant withdrawal or loss to follow‐up were not stated |
| Selective reporting (reporting bias) | Unclear risk | Live birth data were not reported |
| Other bias | Unclear risk | Insufficient information available to evaluate this risk domain |
| Methods | Trial design: crossover (after 4 cycles) Nr of Pt randomised: 67 | |
| Participants | Couples with unexplained subfertility and couples with surgically treated endometriosis | |
| Interventions | Comparison: IUI + OH versus TI + NC Timing: | |
| Outcomes | Ongoing pregnancy rate Pregnancy: not further defined | |
| Notes | ITT analysis: not possible | |
| Risk of bias | ||
| Bias | Authors' judgement | Support for judgement |
| Random sequence generation (selection bias) | Unclear risk | Sequence generation not stated |
| Allocation concealment (selection bias) | Unclear risk | Unclear |
| Blinding (performance bias and detection bias) | Unclear risk | Blinding was not possible because of the nature of the interventions and non‐blinding was not likely to affect the outcomes of interest |
| Incomplete outcome data (attrition bias) | Low risk | 16/67 participants excluded from analysis due to anovulation, poor semen quality or inability to follow the treatment protocol. Of the remaining 51 participants, 6 couples did not complete treatment because of illness or relocation. 4/51 dropped out before cross‐over |
| Selective reporting (reporting bias) | Unclear risk | Live birth rate was not reported |
| Other bias | Unclear risk | Insufficient information available to evaluate this risk domain |
| Methods | Trial design: parallel Nr of participants randomised: 120 (unexplained IUI + NC and IUI + TI), 258 total | |
| Participants | Couples with unexplained subfertility and couples with male factor subfertility | |
| Interventions | Comparison: IUI + NC versus IUI + OH (versus IVF) | |
| Outcomes | Live birth per couple | |
| Notes | ITT analysis: yes Some dropouts because of spontaneous pregnancy | |
| Risk of bias | ||
| Bias | Authors' judgement | Support for judgement |
| Random sequence generation (selection bias) | Low risk | Computer‐generated randomisation schedule |
| Allocation concealment (selection bias) | Low risk | Adequate; numbered, masked and sealed envelopes |
| Blinding (performance bias and detection bias) | Unclear risk | Blinding was not possible because of the nature of the interventions and non‐blinding was not likely to affect the outcomes of interest |
| Incomplete outcome data (attrition bias) | Unclear risk | 7/120 withdrew before 1st treatment cycle. Details on dropout not separately available for unexplained subfertility. Some participants dropped out because of spontaneous pregnancy. It is not known whether these participants are included in the IUI unexplained subfertility group |
| Selective reporting (reporting bias) | Low risk | Live birth and complication data were reported |
| Other bias | Low risk | Nothing detected; baseline demographic characteristics similar between the two groups |
| Methods | Trial design: Parallel Nr of Pt randomised: 932 (465 treated with IUI) | |
| Participants | Couples with unexplained subfertility and couples with stage I or II treated endometriosis or male factor subfertility | |
| Interventions | Comparison: IUI + NC versus IUI + OH Cycles were cancelled if serum E2 concentration > 3000 pg/ml Duration of treatment: 4 cycles max | |
| Outcomes | Live birth per couple Pregnancy defined by two positive HCG tests. This is biochemical pregnancy, therefore not included in analysis | |
| Notes | ITT analysis: not possible | |
| Risk of bias | ||
| Bias | Authors' judgement | Support for judgement |
| Random sequence generation (selection bias) | Unclear risk | Author could not guarantee whether or not participants were truly randomised |
| Allocation concealment (selection bias) | Unclear risk | Author could not guarantee whether or not participants were truly randomised |
| Blinding (performance bias and detection bias) | Unclear risk | Blinding was not possible because of the nature of the interventions and non‐blinding was not likely to affect the outcomes of interest |
| Incomplete outcome data (attrition bias) | Unclear risk | Withdrawal rates of the total group were presented: 4/465 treatment‐related withdrawal, 27/465 not treatment‐related. Numbers for unexplained subfertility group are not known. |
| Selective reporting (reporting bias) | Low risk | Live birth and complication data were reported |
| Other bias | Low risk | Nothing detected |
| Methods | Trial design: parallel Nr of Pt randomised: 72 | |
| Participants | Couples with unexplained subfertility | |
| Interventions | Comparison: IUI + OH versus TI + OH | |
| Outcomes | PR per cycle Pregnancy not further defined | |
| Notes | ITT analysis: possible | |
| Risk of bias | ||
| Bias | Authors' judgement | Support for judgement |
| Random sequence generation (selection bias) | Unclear risk | Not stated |
| Allocation concealment (selection bias) | Unclear risk | Unclear; not stated |
| Blinding (performance bias and detection bias) | Unclear risk | Blinding was not possible because of the nature of the interventions and non blinding was not likely to affect the outcomes of interest |
| Incomplete outcome data (attrition bias) | High risk | Not available |
| Selective reporting (reporting bias) | High risk | In this abstract the reported outcome data are minimal |
| Other bias | Unclear risk | Insufficient information available to evaluate this risk domain |
| Methods | Trial design: parallel Nr of Pt randomised: not clear | |
| Participants | Couples with unexplained subfertility and minimal or mild endometriosis | |
| Interventions | Comparison: IUI + OH versus TI + OH (vs DIPI + OH vs IUI and DIPI + OH) Stimulation method 2: 100 mg CC/day for 5 days Monitoring + Ovulation: urinary LH timed Cycles were cancelled according to serum E2 rise Duration of treatment: 1 cycle max | |
| Outcomes | PR per cycle | |
| Notes | ITT analysis: not possible | |
| Risk of bias | ||
| Bias | Authors' judgement | Support for judgement |
| Random sequence generation (selection bias) | Unclear risk | Not stated |
| Allocation concealment (selection bias) | Unclear risk | Not stated |
| Blinding (performance bias and detection bias) | Unclear risk | Blinding was not possible because of the nature of the interventions and non‐blinding was not likely to affect the outcomes of interest |
| Incomplete outcome data (attrition bias) | Low risk | Four withdrawals in clomiphene group due to absent LH surge, 5 withdrawals in hMG group due to absent LH surge, fast oestrogen rise or personal reasons. |
| Selective reporting (reporting bias) | Unclear risk | Live birth data were not reported |
| Other bias | Unclear risk | Insufficient information was reported on demographic characteristics to make a conclusive judgement |
| Methods | Trial design: parallel Nr of Pt randomised: 108 | |
| Participants | Couples with unexplained subfertility and couples with mild male factor subfertility | |
| Interventions | Comparison: IUI + OH versus TI + OH Duration of treatment: 3 cycles max | |
| Outcomes | Live birth per couple Pregnancy confirmed by USS showing foetal heart activity | |
| Notes | ITT analysis: possible | |
| Risk of bias | ||
| Bias | Authors' judgement | Support for judgement |
| Random sequence generation (selection bias) | Low risk | Computer‐generated random number list |
| Allocation concealment (selection bias) | Low risk | Adequate; numbered opaque sealed envelopes |
| Blinding (performance bias and detection bias) | Unclear risk | Blinding was not possible because of the nature of the interventions and non‐blinding was not likely to affect the outcomes of interest |
| Incomplete outcome data (attrition bias) | Low risk | Exclusion numbers were published for the overall group.The author provided additional information: 1/52 (IUI + OH group) withdrew, 4/56 (TI + OH group) withdrew. Reasons for dropout were family problems, poor response or exaggerated response |
| Selective reporting (reporting bias) | Low risk | Live birth data and complication numbers were available for analysis |
| Other bias | Unclear risk | Insufficient information was reported to make a conclusive judgement on participant demographic characteristics |
| Methods | Trial design: parallel Nr of Pt randomised: 39 | |
| Participants | Couples with unexplained subfertility | |
| Interventions | Comparison: IUI + NC versus IUI + OH (vs GIFT) Duration of treatment: 3 cycles max | |
| Outcomes | PR per couple and per cycle Clinical pregnancy defined by USS showing foetal heart activity | |
| Notes | ITT analysis: yes One pregnancy between treatment cycles | |
| Risk of bias | ||
| Bias | Authors' judgement | Support for judgement |
| Random sequence generation (selection bias) | Low risk | Computer‐generated random number sequence |
| Allocation concealment (selection bias) | Low risk | Adequate; numbered opaque sealed envelopes |
| Blinding (performance bias and detection bias) | Unclear risk | Blinding was not possible because of the nature of the interventions and non‐blinding was not likely to affect the outcomes of interest |
| Incomplete outcome data (attrition bias) | Unclear risk | Drop‐out rate 3/19 (IUI + NC), and 2/20 (IUI + OH) |
| Selective reporting (reporting bias) | Low risk | Live birth data were provided |
| Other bias | Low risk | Nothing detected |
| Methods | Trial design: parallel Nr of Pt randomised: 253 | |
| Participants | Couples with unexplained subfertility and an intermediate prognosis of conceiving within the next 12 months (Hunault 30% to 40%) Age: IUI + OH 33 years (± 3.4); TI + NC 33 years (± 3.19) | |
| Interventions | Comparison: IUI + OH versus TI (expectant management) + NC Cycles were cancelled when > 3 follicles of 16 mm or > 5 follicles of 12 mm were present Duration of treatment: 6 months | |
| Outcomes | Live birth/couple | |
| Notes | ITT analysis: yes Only couples with an intermediate prognosis of conceiving were included, this influences the possible treatment effect | |
| Risk of bias | ||
| Bias | Authors' judgement | Support for judgement |
| Random sequence generation (selection bias) | Low risk | Computer‐generated sequence in balanced blocks |
| Allocation concealment (selection bias) | Low risk | Adequate; via opaque sealed envelopes |
| Blinding (performance bias and detection bias) | Unclear risk | Blinding was not possible because of the nature of the interventions and non‐blinding was not likely to affect the outcomes of interest |
| Incomplete outcome data (attrition bias) | Low risk | IUI + OH group, 3 participants lost to follow up, TI + NC group, 2 lost to follow up, 2 still pregnant |
| Selective reporting (reporting bias) | Low risk | Live birth and complications reported |
| Other bias | Low risk | Nothing detected |
CC: clomiphene citrate
DIPI: direct intraperitoneal insemination
FSH: follicle stimulating hormone
hCG: human chorionic gonadotropin
hMG: human menopausal gonadotropin
IUI: intra‐uterine insemination
OH: ovarian hyperstimulation
USS: ultrasound scan
Characteristics of excluded studies [ordered by study ID]
Jump to:
| Study | Reason for exclusion |
| Cohort study | |
| The trial was not randomised | |
| Not RCT | |
| Did not include comparison of interest to this review | |
| Not RCT | |
| No pre‐crossover data available | |
| No pre‐crossover data available | |
| No pre‐crossover data available | |
| Abstract, full article not available. No separate data for couples with unexplained subfertility | |
| Did not include comparison of interest to this review | |
| No pre‐crossover data available | |
| Did not include comparison of interest to this review | |
| Did not include comparison of interest to this review | |
| No per‐woman data. Biochemical pregnancies only reported | |
| No pre‐crossover data available | |
| The trial (published as full paper in 1993) was not randomised | |
| The trial (also published as an abstract in 1990) was not randomised | |
| Did not include comparison of interest to this review | |
| This trial was quasi randomised, on the basis of hospital case record number | |
| The trial was not randomised | |
| The participants in this trial were all diagnosed with endometriosis | |
| Did not include comparison of interest to this review | |
| Study involved donor semen | |
| No pre‐crossover data available |
Data and analyses
| Outcome or subgroup title | No. of studies | No. of participants | Statistical method | Effect size |
| 1 Live birth rate per couple (all cycles) Show forest plot | 1 | 334 | Odds Ratio (M‐H, Fixed, 95% CI) | 1.60 [0.92, 2.78] |
| Analysis 1.1 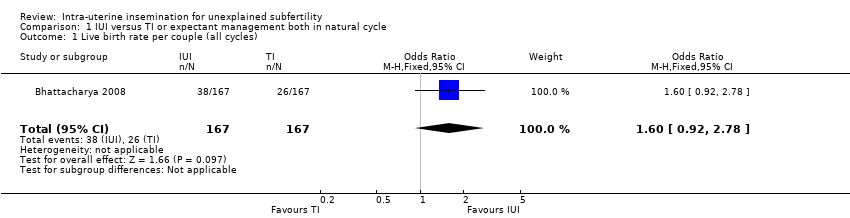 Comparison 1 IUI versus TI or expectant management both in natural cycle, Outcome 1 Live birth rate per couple (all cycles). | ||||
| 2 Multiple pregnancy rate per couple Show forest plot | 1 | 334 | Odds Ratio (M‐H, Fixed, 95% CI) | 0.50 [0.04, 5.53] |
| Analysis 1.2 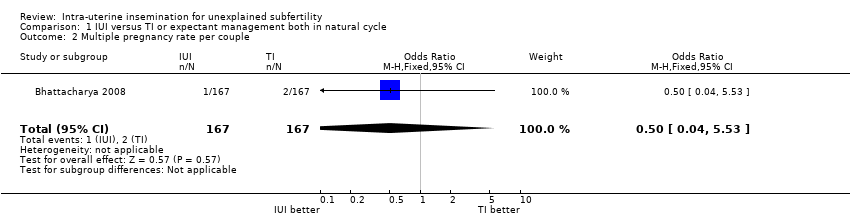 Comparison 1 IUI versus TI or expectant management both in natural cycle, Outcome 2 Multiple pregnancy rate per couple. | ||||
| 3 Pregnancy rate per couple (all cycles) Show forest plot | 1 | 334 | Odds Ratio (M‐H, Fixed, 95% CI) | 1.53 [0.88, 2.64] |
| Analysis 1.3 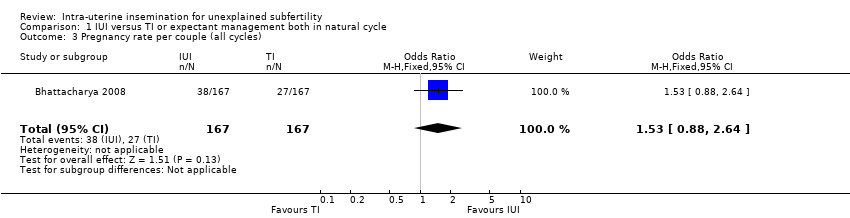 Comparison 1 IUI versus TI or expectant management both in natural cycle, Outcome 3 Pregnancy rate per couple (all cycles). | ||||
| 4 Miscarriage rate per couple Show forest plot | 1 | 334 | Odds Ratio (M‐H, Fixed, 95% CI) | 0.77 [0.28, 2.11] |
| Analysis 1.4 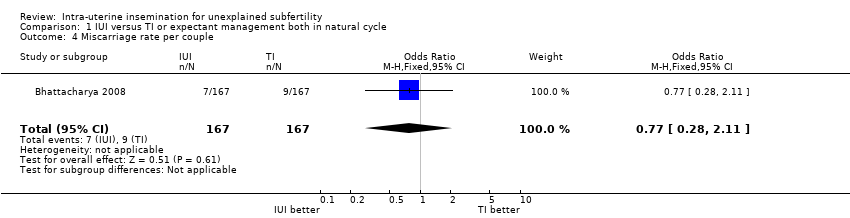 Comparison 1 IUI versus TI or expectant management both in natural cycle, Outcome 4 Miscarriage rate per couple. | ||||
| 5 Ectopic pregnancy rate per couple Show forest plot | 1 | 334 | Odds Ratio (M‐H, Fixed, 95% CI) | 5.06 [0.24, 106.21] |
| Analysis 1.5 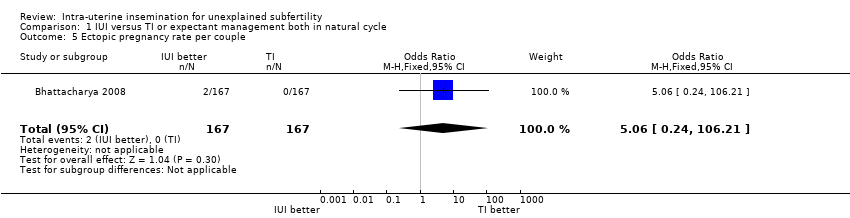 Comparison 1 IUI versus TI or expectant management both in natural cycle, Outcome 5 Ectopic pregnancy rate per couple. | ||||
| Outcome or subgroup title | No. of studies | No. of participants | Statistical method | Effect size |
| 1 Live birth rate per couple (all cycles) Show forest plot | 2 | 208 | Odds Ratio (M‐H, Fixed, 95% CI) | 1.59 [0.88, 2.88] |
| Analysis 2.1  Comparison 2 IUI versus TI or expectant management both in stimulated cycle, Outcome 1 Live birth rate per couple (all cycles). | ||||
| 1.1 Gonadotropins | 2 | 208 | Odds Ratio (M‐H, Fixed, 95% CI) | 1.59 [0.88, 2.88] |
| 2 Multiple pregnancy rate per couple Show forest plot | 4 | 316 | Odds Ratio (M‐H, Fixed, 95% CI) | 1.46 [0.55, 3.87] |
| Analysis 2.2 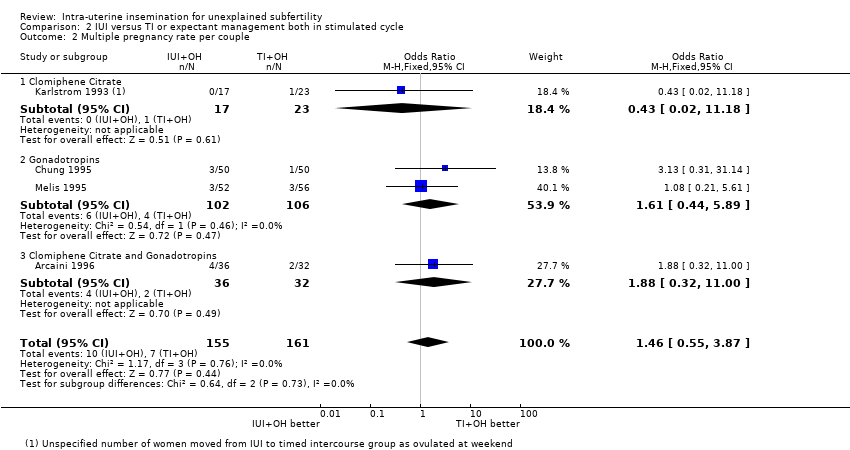 Comparison 2 IUI versus TI or expectant management both in stimulated cycle, Outcome 2 Multiple pregnancy rate per couple. | ||||
| 2.1 Clomiphene Citrate | 1 | 40 | Odds Ratio (M‐H, Fixed, 95% CI) | 0.43 [0.02, 11.18] |
| 2.2 Gonadotropins | 2 | 208 | Odds Ratio (M‐H, Fixed, 95% CI) | 1.61 [0.44, 5.89] |
| 2.3 Clomiphene Citrate and Gonadotropins | 1 | 68 | Odds Ratio (M‐H, Fixed, 95% CI) | 1.88 [0.32, 11.00] |
| 3 Pregnancy rate per couple (all cycles) Show forest plot | 6 | 517 | Odds Ratio (M‐H, Fixed, 95% CI) | 1.69 [1.14, 2.53] |
| Analysis 2.3  Comparison 2 IUI versus TI or expectant management both in stimulated cycle, Outcome 3 Pregnancy rate per couple (all cycles). | ||||
| 3.1 Clomiphene Citrate | 1 | 40 | Odds Ratio (M‐H, Fixed, 95% CI) | 0.30 [0.03, 2.93] |
| 3.2 Gonadotropins | 4 | 319 | Odds Ratio (M‐H, Fixed, 95% CI) | 1.68 [1.03, 2.75] |
| 3.3 Clomiphene Citrate and Gonadotropins | 1 | 68 | Odds Ratio (M‐H, Fixed, 95% CI) | 2.62 [0.98, 6.98] |
| 3.4 Clomiphene citrate OR Gonadotropins | 1 | 90 | Odds Ratio (M‐H, Fixed, 95% CI) | 1.72 [0.50, 5.89] |
| 4 Moderate or severe ovarian hyperstimulation syndrome rate per woman Show forest plot | 2 | Odds Ratio (M‐H, Fixed, 95% CI) | Subtotals only | |
| Analysis 2.4 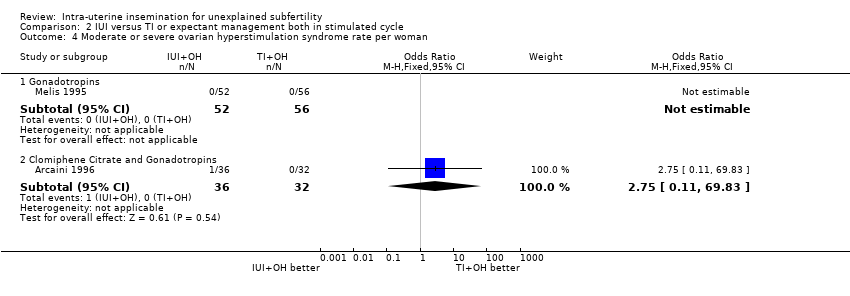 Comparison 2 IUI versus TI or expectant management both in stimulated cycle, Outcome 4 Moderate or severe ovarian hyperstimulation syndrome rate per woman. | ||||
| 4.1 Gonadotropins | 1 | 108 | Odds Ratio (M‐H, Fixed, 95% CI) | 0.0 [0.0, 0.0] |
| 4.2 Clomiphene Citrate and Gonadotropins | 1 | 68 | Odds Ratio (M‐H, Fixed, 95% CI) | 2.75 [0.11, 69.83] |
| 5 Miscarriage rate per couple Show forest plot | 2 | 208 | Odds Ratio (M‐H, Fixed, 95% CI) | 1.66 [0.56, 4.88] |
| Analysis 2.5 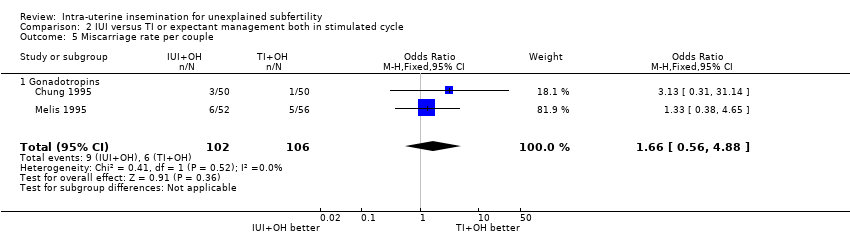 Comparison 2 IUI versus TI or expectant management both in stimulated cycle, Outcome 5 Miscarriage rate per couple. | ||||
| 5.1 Gonadotropins | 2 | 208 | Odds Ratio (M‐H, Fixed, 95% CI) | 1.66 [0.56, 4.88] |
| 6 Ectopic pregnancy rate per couple Show forest plot | 1 | 100 | Odds Ratio (M‐H, Fixed, 95% CI) | 3.06 [0.12, 76.95] |
| Analysis 2.6  Comparison 2 IUI versus TI or expectant management both in stimulated cycle, Outcome 6 Ectopic pregnancy rate per couple. | ||||
| 6.1 Gonadotropins | 1 | 100 | Odds Ratio (M‐H, Fixed, 95% CI) | 3.06 [0.12, 76.95] |
| Outcome or subgroup title | No. of studies | No. of participants | Statistical method | Effect size |
| 1 Live birth rate per couple (all cycles) Show forest plot | 4 | 396 | Odds Ratio (M‐H, Fixed, 95% CI) | 0.48 [0.29, 0.82] |
| Analysis 3.1  Comparison 3 IUI in natural cycle versus IUI in stimulated cycle, Outcome 1 Live birth rate per couple (all cycles). | ||||
| 1.1 Clomiphene Citrate | 1 | 26 | Odds Ratio (M‐H, Fixed, 95% CI) | 0.27 [0.02, 3.41] |
| 1.2 Gonadotropins | 3 | 370 | Odds Ratio (M‐H, Fixed, 95% CI) | 0.50 [0.29, 0.85] |
| 2 Multiple pregnancy rate per couple Show forest plot | 2 | 65 | Odds Ratio (M‐H, Fixed, 95% CI) | 0.33 [0.01, 8.70] |
| Analysis 3.2  Comparison 3 IUI in natural cycle versus IUI in stimulated cycle, Outcome 2 Multiple pregnancy rate per couple. | ||||
| 2.1 Clomiphene Citrate | 1 | 26 | Odds Ratio (M‐H, Fixed, 95% CI) | 0.0 [0.0, 0.0] |
| 2.2 Gonadotropins | 1 | 39 | Odds Ratio (M‐H, Fixed, 95% CI) | 0.33 [0.01, 8.70] |
| 3 Pregnancy rate per couple (all cycles) Show forest plot | 1 | 26 | Odds Ratio (M‐H, Fixed, 95% CI) | 0.16 [0.01, 1.77] |
| Analysis 3.3 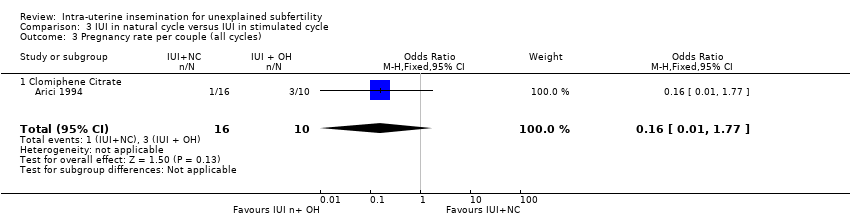 Comparison 3 IUI in natural cycle versus IUI in stimulated cycle, Outcome 3 Pregnancy rate per couple (all cycles). | ||||
| 3.1 Clomiphene Citrate | 1 | 26 | Odds Ratio (M‐H, Fixed, 95% CI) | 0.16 [0.01, 1.77] |
| 4 Moderate or severe ovarian hyperstimulation syndrome per woman Show forest plot | 3 | 185 | Odds Ratio (M‐H, Fixed, 95% CI) | 0.0 [0.0, 0.0] |
| Analysis 3.4  Comparison 3 IUI in natural cycle versus IUI in stimulated cycle, Outcome 4 Moderate or severe ovarian hyperstimulation syndrome per woman. | ||||
| 4.1 Clomiphene Citrate | 1 | 26 | Odds Ratio (M‐H, Fixed, 95% CI) | 0.0 [0.0, 0.0] |
| 4.2 Gonadotropins | 2 | 159 | Odds Ratio (M‐H, Fixed, 95% CI) | 0.0 [0.0, 0.0] |
| 5 Miscarriage rate per couple Show forest plot | 1 | 26 | Odds Ratio (M‐H, Fixed, 95% CI) | 0.19 [0.01, 5.20] |
| Analysis 3.5 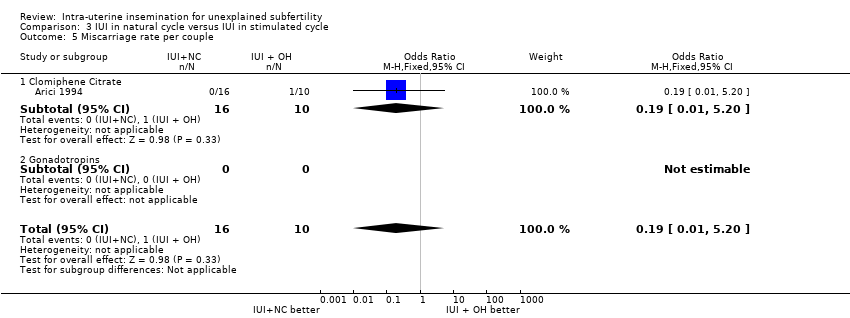 Comparison 3 IUI in natural cycle versus IUI in stimulated cycle, Outcome 5 Miscarriage rate per couple. | ||||
| 5.1 Clomiphene Citrate | 1 | 26 | Odds Ratio (M‐H, Fixed, 95% CI) | 0.19 [0.01, 5.20] |
| 5.2 Gonadotropins | 0 | 0 | Odds Ratio (M‐H, Fixed, 95% CI) | 0.0 [0.0, 0.0] |
| 6 Ectopic pregnancy rate per couple Show forest plot | 2 | 250 | Odds Ratio (M‐H, Fixed, 95% CI) | 0.15 [0.01, 3.02] |
| Analysis 3.6  Comparison 3 IUI in natural cycle versus IUI in stimulated cycle, Outcome 6 Ectopic pregnancy rate per couple. | ||||
| 6.1 Gonadotropins | 2 | 250 | Odds Ratio (M‐H, Fixed, 95% CI) | 0.15 [0.01, 3.02] |
| Outcome or subgroup title | No. of studies | No. of participants | Statistical method | Effect size |
| 1 Live birth rate per couple (all cycles) Show forest plot | 1 | 253 | Odds Ratio (M‐H, Fixed, 95% CI) | 0.82 [0.45, 1.49] |
| Analysis 4.1 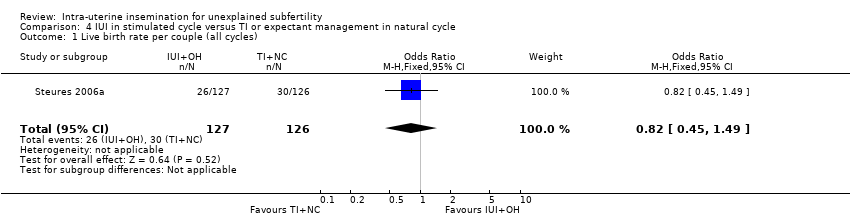 Comparison 4 IUI in stimulated cycle versus TI or expectant management in natural cycle, Outcome 1 Live birth rate per couple (all cycles). | ||||
| 2 Multiple pregnancy rate per couple Show forest plot | 2 | 304 | Odds Ratio (M‐H, Fixed, 95% CI) | 2.0 [0.18, 22.34] |
| Analysis 4.2  Comparison 4 IUI in stimulated cycle versus TI or expectant management in natural cycle, Outcome 2 Multiple pregnancy rate per couple. | ||||
| 2.1 Clomiphene Citrate | 1 | 51 | Odds Ratio (M‐H, Fixed, 95% CI) | 0.0 [0.0, 0.0] |
| 2.2 Clomiphene Citrate or Gonadotropins | 1 | 253 | Odds Ratio (M‐H, Fixed, 95% CI) | 2.0 [0.18, 22.34] |
| 3 Pregnancy rate per couple (all cycles) Show forest plot | 2 | 304 | Odds Ratio (M‐H, Fixed, 95% CI) | 1.00 [0.59, 1.67] |
| Analysis 4.3 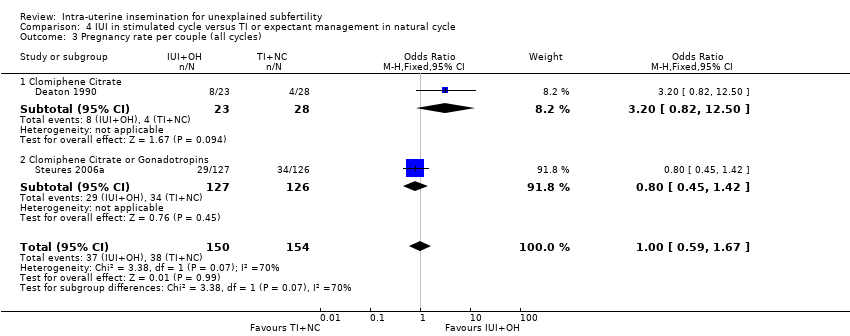 Comparison 4 IUI in stimulated cycle versus TI or expectant management in natural cycle, Outcome 3 Pregnancy rate per couple (all cycles). | ||||
| 3.1 Clomiphene Citrate | 1 | 51 | Odds Ratio (M‐H, Fixed, 95% CI) | 3.2 [0.82, 12.50] |
| 3.2 Clomiphene Citrate or Gonadotropins | 1 | 253 | Odds Ratio (M‐H, Fixed, 95% CI) | 0.80 [0.45, 1.42] |
| 4 Moderate or severe ovarian hyperstimulation syndrome per woman Show forest plot | 1 | Odds Ratio (M‐H, Fixed, 95% CI) | Totals not selected | |
| Analysis 4.4  Comparison 4 IUI in stimulated cycle versus TI or expectant management in natural cycle, Outcome 4 Moderate or severe ovarian hyperstimulation syndrome per woman. | ||||
| 4.1 Clomiphene Citrate | 1 | Odds Ratio (M‐H, Fixed, 95% CI) | 0.0 [0.0, 0.0] | |
| 4.2 Clomiphene Citrate or Gonadotropins | 0 | Odds Ratio (M‐H, Fixed, 95% CI) | 0.0 [0.0, 0.0] | |
| 5 Miscarriage rate per couple Show forest plot | 1 | 253 | Odds Ratio (M‐H, Fixed, 95% CI) | 2.28 [0.84, 6.20] |
| Analysis 4.5  Comparison 4 IUI in stimulated cycle versus TI or expectant management in natural cycle, Outcome 5 Miscarriage rate per couple. | ||||
| Outcome or subgroup title | No. of studies | No. of participants | Statistical method | Effect size |
| 1 Live birth rate per couple (all cycles) Show forest plot | 1 | 342 | Odds Ratio (M‐H, Fixed, 95% CI) | 1.95 [1.10, 3.44] |
| Analysis 5.1 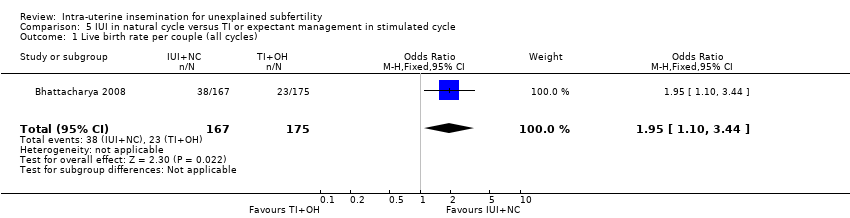 Comparison 5 IUI in natural cycle versus TI or expectant management in stimulated cycle, Outcome 1 Live birth rate per couple (all cycles). | ||||
| 2 Multiple pregnancy rate per couple Show forest plot | 1 | 342 | Odds Ratio (M‐H, Fixed, 95% CI) | 1.05 [0.07, 16.90] |
| Analysis 5.2 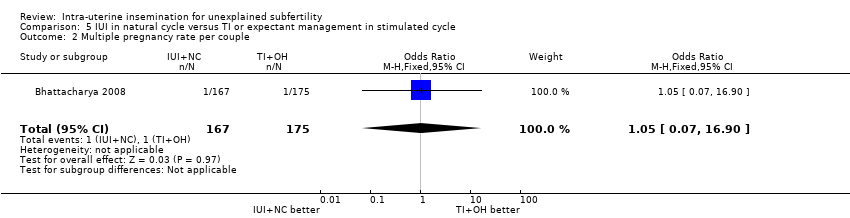 Comparison 5 IUI in natural cycle versus TI or expectant management in stimulated cycle, Outcome 2 Multiple pregnancy rate per couple. | ||||
| 3 Pregnancy rate per couple (all cycles) Show forest plot | 1 | 342 | Odds Ratio (M‐H, Fixed, 95% CI) | 1.77 [1.01, 3.08] |
| Analysis 5.3  Comparison 5 IUI in natural cycle versus TI or expectant management in stimulated cycle, Outcome 3 Pregnancy rate per couple (all cycles). | ||||
| 4 Miscarriage rate per couple Show forest plot | 1 | 342 | Odds Ratio (M‐H, Fixed, 95% CI) | 0.91 [0.32, 2.58] |
| Analysis 5.4 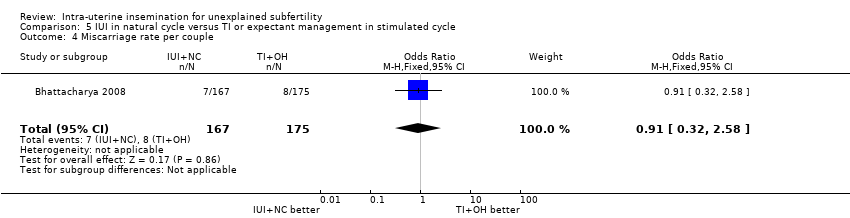 Comparison 5 IUI in natural cycle versus TI or expectant management in stimulated cycle, Outcome 4 Miscarriage rate per couple. | ||||
| 5 Ectopic pregnancy rate per couple Show forest plot | 1 | 342 | Odds Ratio (M‐H, Random, 95% CI) | 5.30 [0.25, 111.26] |
| Analysis 5.5 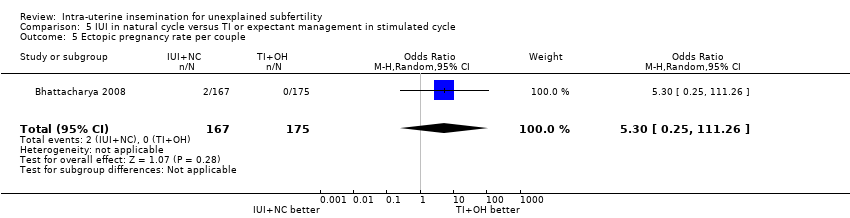 Comparison 5 IUI in natural cycle versus TI or expectant management in stimulated cycle, Outcome 5 Ectopic pregnancy rate per couple. | ||||

Methodological quality graph: review authors' judgements about each methodological quality item presented as percentages across all included studies.
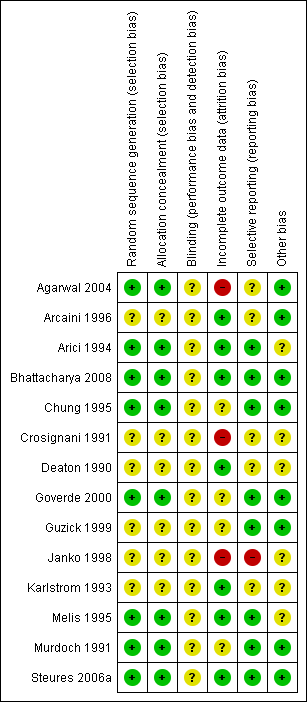
Methodological quality summary: review authors' judgements about each methodological quality item for each included study.

Funnel plot of comparison: 2 IUI versus TI both in stimulated cycle, outcome: 2.3 Pregnancy rate per couple (all cycles).
Comparison 1 IUI versus TI or expectant management both in natural cycle, Outcome 1 Live birth rate per couple (all cycles).
Comparison 1 IUI versus TI or expectant management both in natural cycle, Outcome 2 Multiple pregnancy rate per couple.
Comparison 1 IUI versus TI or expectant management both in natural cycle, Outcome 3 Pregnancy rate per couple (all cycles).
Comparison 1 IUI versus TI or expectant management both in natural cycle, Outcome 4 Miscarriage rate per couple.
Comparison 1 IUI versus TI or expectant management both in natural cycle, Outcome 5 Ectopic pregnancy rate per couple.
Comparison 2 IUI versus TI or expectant management both in stimulated cycle, Outcome 1 Live birth rate per couple (all cycles).
Comparison 2 IUI versus TI or expectant management both in stimulated cycle, Outcome 2 Multiple pregnancy rate per couple.
Comparison 2 IUI versus TI or expectant management both in stimulated cycle, Outcome 3 Pregnancy rate per couple (all cycles).
Comparison 2 IUI versus TI or expectant management both in stimulated cycle, Outcome 4 Moderate or severe ovarian hyperstimulation syndrome rate per woman.
Comparison 2 IUI versus TI or expectant management both in stimulated cycle, Outcome 5 Miscarriage rate per couple.
Comparison 2 IUI versus TI or expectant management both in stimulated cycle, Outcome 6 Ectopic pregnancy rate per couple.
Comparison 3 IUI in natural cycle versus IUI in stimulated cycle, Outcome 1 Live birth rate per couple (all cycles).
Comparison 3 IUI in natural cycle versus IUI in stimulated cycle, Outcome 2 Multiple pregnancy rate per couple.
Comparison 3 IUI in natural cycle versus IUI in stimulated cycle, Outcome 3 Pregnancy rate per couple (all cycles).
Comparison 3 IUI in natural cycle versus IUI in stimulated cycle, Outcome 4 Moderate or severe ovarian hyperstimulation syndrome per woman.
Comparison 3 IUI in natural cycle versus IUI in stimulated cycle, Outcome 5 Miscarriage rate per couple.
Comparison 3 IUI in natural cycle versus IUI in stimulated cycle, Outcome 6 Ectopic pregnancy rate per couple.
Comparison 4 IUI in stimulated cycle versus TI or expectant management in natural cycle, Outcome 1 Live birth rate per couple (all cycles).
Comparison 4 IUI in stimulated cycle versus TI or expectant management in natural cycle, Outcome 2 Multiple pregnancy rate per couple.
Comparison 4 IUI in stimulated cycle versus TI or expectant management in natural cycle, Outcome 3 Pregnancy rate per couple (all cycles).
Comparison 4 IUI in stimulated cycle versus TI or expectant management in natural cycle, Outcome 4 Moderate or severe ovarian hyperstimulation syndrome per woman.
Comparison 4 IUI in stimulated cycle versus TI or expectant management in natural cycle, Outcome 5 Miscarriage rate per couple.
Comparison 5 IUI in natural cycle versus TI or expectant management in stimulated cycle, Outcome 1 Live birth rate per couple (all cycles).
Comparison 5 IUI in natural cycle versus TI or expectant management in stimulated cycle, Outcome 2 Multiple pregnancy rate per couple.
Comparison 5 IUI in natural cycle versus TI or expectant management in stimulated cycle, Outcome 3 Pregnancy rate per couple (all cycles).
Comparison 5 IUI in natural cycle versus TI or expectant management in stimulated cycle, Outcome 4 Miscarriage rate per couple.
Comparison 5 IUI in natural cycle versus TI or expectant management in stimulated cycle, Outcome 5 Ectopic pregnancy rate per couple.
| IUI compared to TI or expectant management both in natural cycle for unexplained subfertility | ||||||
| Patient or population: people with unexplained subfertility | ||||||
| Outcomes | Illustrative comparative risks* (95% CI) | Relative effect | No of Participants | Quality of the evidence | Comments | |
| Assumed risk | Corresponding risk | |||||
| TI or expectant management both in natural cycle | IUI | |||||
| Live birth rate per couple (all cycles) | 156 per 1000 | 228 per 1000 | OR 1.60 | 334 | ⊕⊕⊕⊝ | |
| Multiple pregnancy rate per couple | 12 per 1000 | 6 per 1000 | OR 0.50 | 334 | ⊕⊕⊕⊝ | |
| Pregnancy rate per couple (all cycles) | 162 per 1000 | 228 per 1000 | OR 1.53 | 334 | ⊕⊕⊕⊝ | |
| Ovarian Hyperstimulation Syndrome rate per woman ‐ not reported | Not estimable | ‐ | ||||
| Miscarriage rate per couple | 54 per 1000 | 42 per 1000 | OR 0.77 | 334 | ⊕⊕⊕⊝ | |
| Ectopic pregnancy rate per couple | Not estimable | OR 5.06 | 334 | ⊕⊕⊕⊝ | ||
| *The basis for the assumed risk is the median control group risk across studies. The corresponding risk (and its 95% confidence interval) is based on the assumed risk in the comparison group and the relative effect of the intervention (and its 95% CI). | ||||||
| GRADE Working Group grades of evidence | ||||||
| 1 Small sample size | ||||||
| IUI compared to TI or expectant management both in stimulated cycle for unexplained subfertility | ||||||
| Patient or population: people with unexplained subfertility | ||||||
| Outcomes | Illustrative comparative risks* (95% CI) | Relative effect | No of Participants | Quality of the evidence | Comments | |
| Assumed risk | Corresponding risk | |||||
| TI both in stimulated cycle | IUI | |||||
| Live birth rate per couple (all cycles) | 255 per 1000 | 352 per 1000 | OR 1.59 | 208 | ⊕⊕⊕⊝ | |
| Multiple pregnancy rate per couple | 43 per 1000 | 62 per 1000 | OR 1.46 | 316 | ⊕⊕⊝⊝ | |
| Pregnancy rate per couple (all cycles) | 234 per 1000 | 339 per 1000 | OR 1.69 | 517 | ⊕⊕⊝⊝ | |
| Ovarian Hyperstimulation Syndrome rate per woman | not estimable | OR 2.75 | 68 | ⊕⊕⊝⊝ | ||
| Miscarriage rate per couple | 57 per 1000 | 91 per 1000 | OR 1.66 | 208 | ⊕⊕⊕⊝ | |
| Ectopic pregnancy rate per couple | not estimable | OR 3.06 | 100 | ⊕⊕⊕⊝ | ||
| *The basis for the assumed risk is the median control group risk across studies. The corresponding risk (and its 95% confidence interval) is based on the assumed risk in the comparison group and the relative effect of the intervention (and its 95% CI). | ||||||
| GRADE Working Group grades of evidence | ||||||
| 1 Small sample size | ||||||
| IUI in natural cycle compared to IUI in stimulated cycle for unexplained subfertility | ||||||
| Patient or population: people with unexplained subfertility | ||||||
| Outcomes | Illustrative comparative risks* (95% CI) | Relative effect | No of Participants | Quality of the evidence | Comments | |
| Assumed risk | Corresponding risk | |||||
| IUI in stimulated cycle | IUI in natural cycle | |||||
| Live birth rate per couple (all cycles) | 248 per 1000 | 137 per 1000 | OR 0.48 | 396 | ⊕⊕⊕⊝ | |
| Multiple pregnancy rate per couple | 33 per 1000 | 11 per 1000 | OR 0.33 | 65 | ⊕⊕⊝⊝ | |
| Pregnancy rate per couple (all cycles) | 300 per 1000 | 64 per 1000 | OR 0.16 | 26 | ⊕⊕⊕⊝ | |
| Ovarian Hyperstimulation Syndrome rate per woman5 ‐ not measured | Not estimable3 | ‐ | ||||
| Miscarriage rate per couple | 100 per 1000 | 21 per 1000 | OR 0.19 | 26 | ⊕⊕⊝⊝ | |
| Ectopic pregnancy rate per couple | 23 per 1000 | 4 per 1000 | OR 0.15 | 250 | ⊕⊕⊕⊝ | |
| *The basis for the assumed risk is the median control group risk across studies. The corresponding risk (and its 95% confidence interval) is based on the assumed risk in the comparison group and the relative effect of the intervention (and its 95% CI). | ||||||
| GRADE Working Group grades of evidence | ||||||
| 1 Small sample size | ||||||
| IUI in stimulated cycle compared to TI or expectant management in natural cycle for unexplained subfertility | ||||||
| Patient or population: people with unexplained subfertility | ||||||
| Outcomes | Illustrative comparative risks* (95% CI) | Relative effect | No of Participants | Quality of the evidence | Comments | |
| Assumed risk | Corresponding risk | |||||
| TI or expectant management in natural cycle | IUI in stimulated cycle | |||||
| Live birth rate per couple (all cycles) | 238 per 1000 | 204 per 1000 | OR 0.82 | 253 | ⊕⊕⊕⊝ | |
| Multiple pregnancy rate per couple | 6 per 1000 | 13 per 1000 | OR 2.00 | 304 | ⊕⊕⊕⊝ | |
| Pregnancy rate per couple (all cycles) | 247 per 1000 | 247 per 1000 | OR 1.00 | 304 | ⊕⊕⊕⊝ | |
| Ovarian Hyperstimulation rate per woman ‐ not measured | Not estimable | ‐ | ||||
| Miscarriage rate per couple | 48 per 1000 | 103 per 1000 | OR 2.28 | 253 | ⊕⊕⊕⊝ | |
| Ectopic pregnancy rate per couple ‐ not reported | See comment | See comment | Not estimable | ‐ | See comment | |
| *The basis for the assumed risk is the median control group risk across studies. The corresponding risk (and its 95% confidence interval) is based on the assumed risk in the comparison group and the relative effect of the intervention (and its 95% CI). | ||||||
| GRADE Working Group grades of evidence | ||||||
| 1 Small sample size | ||||||
| IUI in natural cycle compared to TI or expectant management in stimulated cycle for unexplained subfertility | ||||||
| Patient or population: people with unexplained subfertility | ||||||
| Outcomes | Illustrative comparative risks* (95% CI) | Relative effect | No of Participants | Quality of the evidence | Comments | |
| Assumed risk | Corresponding risk | |||||
| TI in stimulated cycle | IUI in natural cycle | |||||
| Live birth rate per couple (all cycles) | 131 per 1000 | 227 per 1000 | OR 1.95 | 342 | ⊕⊕⊕⊝ | |
| Multiple pregnancy rate per couple | 6 per 1000 | 6 per 1000 | OR 1.05 | 342 | ⊕⊕⊕⊝ | |
| Pregnancy rate per couple (all cycles) | 143 per 1000 | 228 per 1000 | OR 1.77 | 342 | ⊕⊕⊕⊝ | |
| Ovarian Hyperstimulation Syndrome rate per woman ‐ not reported | Not estimable | ‐ | ||||
| Miscarriage rate per couple | 46 per 1000 | 42 per 1000 | OR 0.91 | 342 | ⊕⊕⊕⊝ | |
| Ectopic pregnancy rate per couple | Not estimable | OR 5.30 | 342 | ⊕⊕⊕⊝ | ||
| *The basis for the assumed risk is the median control group risk across studies. The corresponding risk (and its 95% confidence interval) is based on the assumed risk in the comparison group and the relative effect of the intervention (and its 95% CI). | ||||||
| GRADE Working Group grades of evidence | ||||||
| 1 Small sample size | ||||||
| Outcome or subgroup title | No. of studies | No. of participants | Statistical method | Effect size |
| 1 Live birth rate per couple (all cycles) Show forest plot | 1 | 334 | Odds Ratio (M‐H, Fixed, 95% CI) | 1.60 [0.92, 2.78] |
| 2 Multiple pregnancy rate per couple Show forest plot | 1 | 334 | Odds Ratio (M‐H, Fixed, 95% CI) | 0.50 [0.04, 5.53] |
| 3 Pregnancy rate per couple (all cycles) Show forest plot | 1 | 334 | Odds Ratio (M‐H, Fixed, 95% CI) | 1.53 [0.88, 2.64] |
| 4 Miscarriage rate per couple Show forest plot | 1 | 334 | Odds Ratio (M‐H, Fixed, 95% CI) | 0.77 [0.28, 2.11] |
| 5 Ectopic pregnancy rate per couple Show forest plot | 1 | 334 | Odds Ratio (M‐H, Fixed, 95% CI) | 5.06 [0.24, 106.21] |
| Outcome or subgroup title | No. of studies | No. of participants | Statistical method | Effect size |
| 1 Live birth rate per couple (all cycles) Show forest plot | 2 | 208 | Odds Ratio (M‐H, Fixed, 95% CI) | 1.59 [0.88, 2.88] |
| 1.1 Gonadotropins | 2 | 208 | Odds Ratio (M‐H, Fixed, 95% CI) | 1.59 [0.88, 2.88] |
| 2 Multiple pregnancy rate per couple Show forest plot | 4 | 316 | Odds Ratio (M‐H, Fixed, 95% CI) | 1.46 [0.55, 3.87] |
| 2.1 Clomiphene Citrate | 1 | 40 | Odds Ratio (M‐H, Fixed, 95% CI) | 0.43 [0.02, 11.18] |
| 2.2 Gonadotropins | 2 | 208 | Odds Ratio (M‐H, Fixed, 95% CI) | 1.61 [0.44, 5.89] |
| 2.3 Clomiphene Citrate and Gonadotropins | 1 | 68 | Odds Ratio (M‐H, Fixed, 95% CI) | 1.88 [0.32, 11.00] |
| 3 Pregnancy rate per couple (all cycles) Show forest plot | 6 | 517 | Odds Ratio (M‐H, Fixed, 95% CI) | 1.69 [1.14, 2.53] |
| 3.1 Clomiphene Citrate | 1 | 40 | Odds Ratio (M‐H, Fixed, 95% CI) | 0.30 [0.03, 2.93] |
| 3.2 Gonadotropins | 4 | 319 | Odds Ratio (M‐H, Fixed, 95% CI) | 1.68 [1.03, 2.75] |
| 3.3 Clomiphene Citrate and Gonadotropins | 1 | 68 | Odds Ratio (M‐H, Fixed, 95% CI) | 2.62 [0.98, 6.98] |
| 3.4 Clomiphene citrate OR Gonadotropins | 1 | 90 | Odds Ratio (M‐H, Fixed, 95% CI) | 1.72 [0.50, 5.89] |
| 4 Moderate or severe ovarian hyperstimulation syndrome rate per woman Show forest plot | 2 | Odds Ratio (M‐H, Fixed, 95% CI) | Subtotals only | |
| 4.1 Gonadotropins | 1 | 108 | Odds Ratio (M‐H, Fixed, 95% CI) | 0.0 [0.0, 0.0] |
| 4.2 Clomiphene Citrate and Gonadotropins | 1 | 68 | Odds Ratio (M‐H, Fixed, 95% CI) | 2.75 [0.11, 69.83] |
| 5 Miscarriage rate per couple Show forest plot | 2 | 208 | Odds Ratio (M‐H, Fixed, 95% CI) | 1.66 [0.56, 4.88] |
| 5.1 Gonadotropins | 2 | 208 | Odds Ratio (M‐H, Fixed, 95% CI) | 1.66 [0.56, 4.88] |
| 6 Ectopic pregnancy rate per couple Show forest plot | 1 | 100 | Odds Ratio (M‐H, Fixed, 95% CI) | 3.06 [0.12, 76.95] |
| 6.1 Gonadotropins | 1 | 100 | Odds Ratio (M‐H, Fixed, 95% CI) | 3.06 [0.12, 76.95] |
| Outcome or subgroup title | No. of studies | No. of participants | Statistical method | Effect size |
| 1 Live birth rate per couple (all cycles) Show forest plot | 4 | 396 | Odds Ratio (M‐H, Fixed, 95% CI) | 0.48 [0.29, 0.82] |
| 1.1 Clomiphene Citrate | 1 | 26 | Odds Ratio (M‐H, Fixed, 95% CI) | 0.27 [0.02, 3.41] |
| 1.2 Gonadotropins | 3 | 370 | Odds Ratio (M‐H, Fixed, 95% CI) | 0.50 [0.29, 0.85] |
| 2 Multiple pregnancy rate per couple Show forest plot | 2 | 65 | Odds Ratio (M‐H, Fixed, 95% CI) | 0.33 [0.01, 8.70] |
| 2.1 Clomiphene Citrate | 1 | 26 | Odds Ratio (M‐H, Fixed, 95% CI) | 0.0 [0.0, 0.0] |
| 2.2 Gonadotropins | 1 | 39 | Odds Ratio (M‐H, Fixed, 95% CI) | 0.33 [0.01, 8.70] |
| 3 Pregnancy rate per couple (all cycles) Show forest plot | 1 | 26 | Odds Ratio (M‐H, Fixed, 95% CI) | 0.16 [0.01, 1.77] |
| 3.1 Clomiphene Citrate | 1 | 26 | Odds Ratio (M‐H, Fixed, 95% CI) | 0.16 [0.01, 1.77] |
| 4 Moderate or severe ovarian hyperstimulation syndrome per woman Show forest plot | 3 | 185 | Odds Ratio (M‐H, Fixed, 95% CI) | 0.0 [0.0, 0.0] |
| 4.1 Clomiphene Citrate | 1 | 26 | Odds Ratio (M‐H, Fixed, 95% CI) | 0.0 [0.0, 0.0] |
| 4.2 Gonadotropins | 2 | 159 | Odds Ratio (M‐H, Fixed, 95% CI) | 0.0 [0.0, 0.0] |
| 5 Miscarriage rate per couple Show forest plot | 1 | 26 | Odds Ratio (M‐H, Fixed, 95% CI) | 0.19 [0.01, 5.20] |
| 5.1 Clomiphene Citrate | 1 | 26 | Odds Ratio (M‐H, Fixed, 95% CI) | 0.19 [0.01, 5.20] |
| 5.2 Gonadotropins | 0 | 0 | Odds Ratio (M‐H, Fixed, 95% CI) | 0.0 [0.0, 0.0] |
| 6 Ectopic pregnancy rate per couple Show forest plot | 2 | 250 | Odds Ratio (M‐H, Fixed, 95% CI) | 0.15 [0.01, 3.02] |
| 6.1 Gonadotropins | 2 | 250 | Odds Ratio (M‐H, Fixed, 95% CI) | 0.15 [0.01, 3.02] |
| Outcome or subgroup title | No. of studies | No. of participants | Statistical method | Effect size |
| 1 Live birth rate per couple (all cycles) Show forest plot | 1 | 253 | Odds Ratio (M‐H, Fixed, 95% CI) | 0.82 [0.45, 1.49] |
| 2 Multiple pregnancy rate per couple Show forest plot | 2 | 304 | Odds Ratio (M‐H, Fixed, 95% CI) | 2.0 [0.18, 22.34] |
| 2.1 Clomiphene Citrate | 1 | 51 | Odds Ratio (M‐H, Fixed, 95% CI) | 0.0 [0.0, 0.0] |
| 2.2 Clomiphene Citrate or Gonadotropins | 1 | 253 | Odds Ratio (M‐H, Fixed, 95% CI) | 2.0 [0.18, 22.34] |
| 3 Pregnancy rate per couple (all cycles) Show forest plot | 2 | 304 | Odds Ratio (M‐H, Fixed, 95% CI) | 1.00 [0.59, 1.67] |
| 3.1 Clomiphene Citrate | 1 | 51 | Odds Ratio (M‐H, Fixed, 95% CI) | 3.2 [0.82, 12.50] |
| 3.2 Clomiphene Citrate or Gonadotropins | 1 | 253 | Odds Ratio (M‐H, Fixed, 95% CI) | 0.80 [0.45, 1.42] |
| 4 Moderate or severe ovarian hyperstimulation syndrome per woman Show forest plot | 1 | Odds Ratio (M‐H, Fixed, 95% CI) | Totals not selected | |
| 4.1 Clomiphene Citrate | 1 | Odds Ratio (M‐H, Fixed, 95% CI) | 0.0 [0.0, 0.0] | |
| 4.2 Clomiphene Citrate or Gonadotropins | 0 | Odds Ratio (M‐H, Fixed, 95% CI) | 0.0 [0.0, 0.0] | |
| 5 Miscarriage rate per couple Show forest plot | 1 | 253 | Odds Ratio (M‐H, Fixed, 95% CI) | 2.28 [0.84, 6.20] |
| Outcome or subgroup title | No. of studies | No. of participants | Statistical method | Effect size |
| 1 Live birth rate per couple (all cycles) Show forest plot | 1 | 342 | Odds Ratio (M‐H, Fixed, 95% CI) | 1.95 [1.10, 3.44] |
| 2 Multiple pregnancy rate per couple Show forest plot | 1 | 342 | Odds Ratio (M‐H, Fixed, 95% CI) | 1.05 [0.07, 16.90] |
| 3 Pregnancy rate per couple (all cycles) Show forest plot | 1 | 342 | Odds Ratio (M‐H, Fixed, 95% CI) | 1.77 [1.01, 3.08] |
| 4 Miscarriage rate per couple Show forest plot | 1 | 342 | Odds Ratio (M‐H, Fixed, 95% CI) | 0.91 [0.32, 2.58] |
| 5 Ectopic pregnancy rate per couple Show forest plot | 1 | 342 | Odds Ratio (M‐H, Random, 95% CI) | 5.30 [0.25, 111.26] |