Inseminación intrauterina versus perfusión de esperma en la trompa de Falopio para la esterilidad no tubaria
References
References to studies included in this review
References to studies excluded from this review
References to studies awaiting assessment
Additional references
Characteristics of studies
Characteristics of included studies [ordered by study ID]
Jump to:
| Methods | Randomisation: blocked computer‐generated sequence of numbers Trial design: cross‐over Concealment of allocation: adequate | |
| Participants | Participants: 56 women; 127 cycles Age of women: 33.2 ± 4.3 years for the total group Duration of subfertility: total group 2.4 ± 1.3 years Type of subfertility: unexplained subfertility (not further defined—mean duration of infertility 2.4 years) | |
| Interventions | Stimulation method: rFSH 75 IU from CD 3 Intervention: IUI or FSP 35 to 37 hours after hCG, with husband's semen Semen preparation: swim‐up Catheter used: IUI: Kremer de la Fontaine Maximum number of cycles per couple: 4 | |
| Outcomes | Clinical pregnancy per couple | |
| Notes | Additional details received from authors. Pre‐cross‐over data available | |
| Risk of bias | ||
| Bias | Authors' judgement | Support for judgement |
| Random sequence generation (selection bias) | Low risk | Computer‐generated sequence of numbers blind to the operators |
| Allocation concealment (selection bias) | Low risk | Adequate |
| Blinding (performance bias and detection bias) | Unclear risk | Blinding not reported |
| Incomplete outcome data (attrition bias) | Low risk | Pre‐cross‐over data reported for all randomised participants (n = 56) |
| Selective reporting (reporting bias) | Unclear risk | Live birth not reported. OHSS not reported |
| Other bias | Low risk | No other potential source of bias noted |
| Methods | Randomisation: block randomisation list Trial design: parallel Concealment of allocation: adequate | |
| Participants | Participants: 96 women; 100 cycles Age of women: IUI 31.5 ± 5.3 years; FSP 32.0 ± 5.2 years Duration of subfertility: IUI 8.6 ± 2.1 years; FSP 7.3 ± 1.9 years Type of subfertility: unexplained subfertility, light peritubal adhesions*, PCO, cervical hostility *19% of participants with light peritubal adhesions or slightly reduced tubal fimbriae and/or moderate loss of gracility of the tubes. Women with obstructed tubes excluded | |
| Interventions | Stimulation method: CC or CC + hMG + hCG Intervention: IUI or FSP 34 to 36 hours after hCG, with husband's semen Semen preparation: swim‐up Catheter used: Frydman catheter (with Allis clamp for FSP) Maximum number of cycles per couple: not stated | |
| Outcomes | Live birth | |
| Notes | ||
| Risk of bias | ||
| Bias | Authors' judgement | Support for judgement |
| Random sequence generation (selection bias) | Low risk | "Blocked randomization list" |
| Allocation concealment (selection bias) | Unclear risk | No details reported |
| Blinding (performance bias and detection bias) | Unclear risk | Blinding not reported |
| Incomplete outcome data (attrition bias) | Low risk | Data reported for all randomised participants (n = 96) |
| Selective reporting (reporting bias) | Low risk | Reported live birth and adverse events |
| Methods | Randomisation: computer‐generated random numbers Trial design: parallel Concealment of allocation: adequate | |
| Participants | Participants: 120 women Age of women: mean 29 years Duration of subfertility: mean 3.4 to 3.6 years Type of subfertility: mild to moderate male factor infertility, defined as sperm count less than 15 × 106/mL, total motility less than 40% or normal forms less than 4%—per WHO criteria. Patients with severe oligospermia (<5 × 10⁶/mL) excluded | |
| Interventions | Stimulation method: CC + hMG Intervention: IUI or FSP 34 to 36 hours after hCG, with partner's semen Semen preparation: double‐wash and swim‐up Catheter used: insulin syringe attached to an artificial insemination catheter for IUI; pediatric Foley catheter for FSP Maximum number of cycles per couple: not stated | |
| Outcomes | Clinical pregnancy (positive β‐hCG test confirmed by ultrasound) | |
| Notes | Author sent data on allocation concealment and live birth by personal communication 4.4.13 | |
| Risk of bias | ||
| Bias | Authors' judgement | Support for judgement |
| Random sequence generation (selection bias) | Low risk | Computer‐generated random numbers |
| Allocation concealment (selection bias) | Low risk | "Closed sealed consecutively numbered opaque envelopes" (personal communication with author) |
| Blinding (performance bias and detection bias) | Unclear risk | Not reported |
| Incomplete outcome data (attrition bias) | Low risk | Data reported for all randomised participants (n = 120) |
| Selective reporting (reporting bias) | Low risk | Reported live birth and adverse events |
| Other bias | Low risk | No other potential source of bias noted |
| Methods | Randomisation: block randomisation list Power analysis: not stated Trial design: parallel Concealment of allocation: not stated | |
| Participants | Participants: 74 women; 100 cycles Age of women: IUI 31.8 ± 4.6 years; FSP 31.8 ± 3.7 years Duration of subfertility: IUI 3.6 ± 1.2; FSP 3.4 ± 1.1 years Type of subfertility: partial tube damage*, idiopathic, cervical, ovulatory *37% of women with partial tube damage. Women with severe tubal damage or obstructed tubes excluded | |
| Interventions | Stimulation method: (1) CC + hMG; (2) hMG alone; (3) FSH, hMG and GnRH agonist Intervention: IUI or FSP 36 hours after hCG with husband's semen Sperm preparation: Percoll gradient Catheter used: Frydman catheter for IUI and FSP with FAST system Maximum number of cycles per couple: not stated | |
| Outcomes | Pregnancy | |
| Notes | ||
| Risk of bias | ||
| Bias | Authors' judgement | Support for judgement |
| Random sequence generation (selection bias) | Low risk | Blocked randomisation list |
| Allocation concealment (selection bias) | Unclear risk | No details reported |
| Blinding (performance bias and detection bias) | Unclear risk | Blinding not reported |
| Incomplete outcome data (attrition bias) | Unclear risk | Data reported for all cycles, but number of women in each group not reported |
| Selective reporting (reporting bias) | Unclear risk | Not stated |
| Other bias | Unclear risk | Unit of analysis error—women randomised, but data reported per cycle. 37% of women had mild tubal damage |
| Methods | Randomisation: block randomisation list Trial design: parallel Concealment of allocation: serial numbered opaque sealed envelopes Pragmatic multicentred study design | |
| Participants | Participants: 417 women; one cycle each Age of women: IUI 33.67 ± 4.87; FSP 34.23 ± 4.62 years Duration of subfertility: (median) IUI 24 (IQR 9 to 42); FSP 24 (IQR 11 to 36) months Type of subfertility: non‐tubal infertility, 10% donor cycles | |
| Interventions | Stimulation method: CC or FSH or letrozole (10% were unstimulated) Intervention: IUI or FSP 34 to 36 hours after hCG, with husband's semen IUI Catheter: Tomcat or Wallace catheter used for the IUI procedure. Inseminate prepared using a density gradient (Puresperm), and spermatozoa re‐suspended in 0.5 mL of medium, as used in the recruiting centre. Catheter passed gently through the cervical canal high up into the uterus, and specimen with a volume of 0.5 mL slowly injected according to standard unit protocol FSP catheter: atraumatic insemination catheter (Cook catheter J‐CHSG‐503000) used for the FSP procedure Sperm preparation: inseminate prepared using a density gradient (Puresperm), and spermatozoa re‐suspended in 4 mL of human tubal fluid or equivalent medium, as used in the recruiting centre. Catheter attached to a 5‐mL syringe Maximum number of cycles per couple: one | |
| Outcomes | Live birth Ectopic pregnancy | |
| Notes | ||
| Risk of bias | ||
| Bias | Authors' judgement | Support for judgement |
| Random sequence generation (selection bias) | Low risk | "computer‐generated randomisation sequence of random blocks of 3 different sizes, chosen randomly (with equal probability of getting 6, 8 or 10 in each block)" |
| Allocation concealment (selection bias) | Low risk | "Allocation numbers were placed in individual, sealed, opaque envelopes that were numbered sequentially" |
| Blinding (performance bias and detection bias) | Unclear risk | No blinding |
| Incomplete outcome data (attrition bias) | Low risk | 6 withdrawals and 1 missing data |
| Selective reporting (reporting bias) | Low risk | No major protocol changes in outcomes |
| Other bias | Low risk | No other potential source of bias noted |
| Methods | Randomisation: computer‐generated algorithm Power analysis: not stated Trial design: cross‐over Concealment of allocation: adequate | |
| Participants | Participants: 106 cycles Age of women: < 40 years Duration of subfertility: at least one year Type of subfertility: unexplained | |
| Interventions | Stimulation method: not stated Intervention: IUI or FSP 36 to 42 hours after hCG Sperm preparation: Percoll gradient Catheter used: Makler cannula for IUI and FSP Maximum number of cycles per couple: 6 | |
| Outcomes | Pregnancy | |
| Notes | Additional details received from authors | |
| Risk of bias | ||
| Bias | Authors' judgement | Support for judgement |
| Random sequence generation (selection bias) | Low risk | Computer‐generated algorithm |
| Allocation concealment (selection bias) | Low risk | After additional information from the author |
| Blinding (performance bias and detection bias) | Unclear risk | No blinding reported |
| Incomplete outcome data (attrition bias) | Unclear risk | Data reported per cycle only—number of couples not reported |
| Selective reporting (reporting bias) | Unclear risk | Adverse events not reported |
| Other bias | High risk | No pre‐cross‐over data reported. Limited information, as study available only as abstract |
| Methods | Randomisation: not stated Power analysis: not stated Trial design: parallel Concealment of allocation: not stated | |
| Participants | Participants: 158 women, 322 cycles Age of women: not stated Duration of subfertility: not stated Type of subfertility: non‐tubal infertility | |
| Interventions | Stimulation method: not stated Intervention: IUI or FSP Sperm preparation: not stated Catheter used: not stated Maximum number of cycles per couple: 3 | |
| Outcomes | Pregnancy | |
| Notes | ||
| Risk of bias | ||
| Bias | Authors' judgement | Support for judgement |
| Random sequence generation (selection bias) | Unclear risk | States "they were randomised" ... no further details |
| Allocation concealment (selection bias) | Unclear risk | No details reported |
| Blinding (performance bias and detection bias) | Unclear risk | No blinding reported |
| Incomplete outcome data (attrition bias) | Low risk | Results reported for all randomised women (n = 158) |
| Selective reporting (reporting bias) | Unclear risk | Live birth and adverse effects not reported. |
| Other bias | Unclear risk | Limited reporting—abstract available only |
| Methods | Randomisation: list of random numbers Trial design: parallel Concealment of allocation: adequate | |
| Participants | Participants: 60 women; 150 cycles Age of women: IUI 30.4 ± 3.5 years; FSP 30.3 ± 3.6 years Duration of subfertility: IUI 6.5 ± 2.1 years; FSP 6.3 ± 2.5 years Type of subfertility: unexplained subfertility Mean duration of unexplained infertility 6.5 years (range 2 to 12 years) | |
| Interventions | Stimulation method: hMG 75 IU from CD 3 Intervention: IUI or FSP 36 hours after hCG with husband's semen Sperm preparation: two‐layer Percoll gradient Catheter used: Makler device for IUI and Frydman catheter (with Allis clamp) for FSP Maximum number of cycles per couple: 3 | |
| Outcomes | Pregnancy | |
| Notes | Additional details received from authors | |
| Risk of bias | ||
| Bias | Authors' judgement | Support for judgement |
| Random sequence generation (selection bias) | Low risk | List of random numbers |
| Allocation concealment (selection bias) | Low risk | Adequate |
| Blinding (performance bias and detection bias) | Unclear risk | No blinding reported |
| Incomplete outcome data (attrition bias) | Low risk | Outcomes reported for all women randomised (n = 60) |
| Selective reporting (reporting bias) | Unclear risk | Live birth not reported, adverse effects not reported |
| Other bias | Unclear risk | Number of motile sperm inseminated was significantly higher in the FSP group |
| Methods | Randomisation method: not stated Trial design: parallel Concealment of allocation: sealed envelopes Power analysis: not stated | |
| Participants | Participants: 60 women; 103 cycles Age of women: IUI 31.8 ± 0.8 years; FSP 31.7 ± 0.6 years Duration of subfertility: > 3 years Type of subfertility: unexplained infertility Minimum duration of unexplained infertility 3 years (range 3 to 6 years) | |
| Interventions | Stimulation method: CC + hMG + hCG Intervention: IUI or FSP 34 to 37 hours after hCG with husband's semen Semen preparation: swim‐up Catheter used: Frydman catheter (with Allis clamp for FSP) Maximum number of cycles per couple: 3 | |
| Outcomes | Clinical pregnancy per woman | |
| Notes | ||
| Risk of bias | ||
| Bias | Authors' judgement | Support for judgement |
| Random sequence generation (selection bias) | Unclear risk | "The women were randomized for treatment with IUI or FSP on the day of HCG administration, by drawing a sealed envelope". No further details provided |
| Allocation concealment (selection bias) | Unclear risk | As above |
| Blinding (performance bias and detection bias) | Unclear risk | No blinding reported |
| Incomplete outcome data (attrition bias) | Low risk | Results reported for 58/60 women randomised (97%). Two women dropped out in IUI group—reasons explained |
| Selective reporting (reporting bias) | Unclear risk | Live birth not reported |
| Other bias | Low risk | No other potential source of bias noted |
| Methods | Randomisation method: not stated Trial design: cross‐over Concealment of allocation: not reported | |
| Participants | 120 couples, moderate male factor infertility (not further defined) | |
| Interventions | Stimulation method: CC 100 mg from day 3 to 8 when one follicle reached 18 mm Intervention: IUI with 0.5 mL of the sample or FSP 4 mL injected intrauterine under pressure after closure of the cervix with husband's semen Semen preparation: swim‐up Catheter used: Frydman catheter (with Allis clamp for FSP) Maximum number of cycles per couple: 3 (on one treatment) | |
| Outcomes | Pregnancy for pre‐cross‐over and post‐cross‐over data | |
| Notes | Crossover: if no pregnancy occurred, method of insemination changed to that of the other group 3 months later | |
| Risk of bias | ||
| Bias | Authors' judgement | Support for judgement |
| Random sequence generation (selection bias) | Unclear risk | States "random cross‐over study"—no further details |
| Allocation concealment (selection bias) | Unclear risk | No details reported |
| Blinding (performance bias and detection bias) | Unclear risk | No blinding reported |
| Incomplete outcome data (attrition bias) | Low risk | Results reported for all women randomised (n = 120) |
| Selective reporting (reporting bias) | Unclear risk | Live birth and adverse effects not reported |
| Other bias | Unclear risk | Limited reporting—abstract available only |
| Methods | Randomisation method: computer‐generated randomisation list Trial design: parallel Concealment of allocation: not stated Follow‐up: 3 cycles Power analysis: yes Intention‐to‐treat analysis: not performed | |
| Participants | Participants: 90 women; 204 cycles Age of women: (1) IUI 32.7 ± 2.4 years; (2) IUI 32.9 ± 2.7 years Duration of subfertility: (1) IUI 4.4 ± 1.7; (2) IUI 4.2 ± 2.1 years 22/90 women had secondary infertility Type of subfertility: male factor (37%), unexplained subfertility and endometriosis Male subfertility not defined. All participants had > 10 million sperm in ejaculate during workup | |
| Interventions | Stimulation method: 150 IU hMG from CD 3, dosage titrated later according to ovarian response; 10.000 IU hCG (1) IUI 38 hours after hCG; (2) FSP 38 hours after hCG; (3) IUI 18 and 38 hours after hCG with partner's semen (Group 3 data not included in this review) Sperm preparation: density gradient centrifugation method IUI procedure: 0.3 to 0.5 mL Maximum number of cycles per couple: 3 | |
| Outcomes | Clinical pregnancy per couple Miscarriage Multiple pregnancy | |
| Notes | Luteal support with 1500 IU hCG on day 5 and day 10 after hCG | |
| Risk of bias | ||
| Bias | Authors' judgement | Support for judgement |
| Random sequence generation (selection bias) | Low risk | Computer‐generated randomisation list |
| Allocation concealment (selection bias) | Unclear risk | No details reported |
| Blinding (performance bias and detection bias) | Unclear risk | No blinding reported |
| Incomplete outcome data (attrition bias) | Low risk | Outcomes reported for all randomised women (n = 90) |
| Selective reporting (reporting bias) | Unclear risk | Live birth not reported |
| Other bias | Unclear risk | Total motile sperm count in first insemination significantly different between IUI group and FSP group |
| Methods | Randomisation method: randomisation tables Trial design: three parallel arms—FSP, IUI and intraperitoneal insemination (IPI)—three cycles Concealment of allocation: not stated Power analysis: not stated Intention‐to‐treat analysis: not performed | |
| Participants | Participants: 71 couples; 101 cycles Age of women: (1) IUI 33.7 ± 1.6 2 years; (2) FSP 35.3 ± 3 years; and (3) IPI 35.3 ± 4.4 years Duration of subfertility: (1) IUI 3.4 ± 1.6 years; (2) FSP 3.3 ± 1.9 years; and (3) IPI 3.3 ± 1.4 years Type of subfertility: male (not further defined), unexplained subfertility; and endometriosis, mixed | |
| Interventions | Stimulation method: recombinant or urinary FSH, dosage titrated later according to the ovarian response; 10,000 UI of hCG administered when 1 follicle > 18 mm and 2 others > 16 mm Sperm preparation: discontinuous density gradient centrifugation method (PureSperm) IUI procedure: Frydman catheter 0.3 to 0.5 mL FSP using a hysterosalpingography (Cervix Adaptor) catheter IPI: direct 2 mL sperm preparation injected into posterior vaginal fornix by a 19‐gauge 2.2‐cm needle Maximum number of cycles per couple: 3 | |
| Outcomes | Clinical pregnancy Multiple pregnancy | |
| Notes | All pregnancies occurred on first cycle | |
| Risk of bias | ||
| Bias | Authors' judgement | Support for judgement |
| Random sequence generation (selection bias) | Low risk | "Couples were randomized by predefined tables of randomization" |
| Allocation concealment (selection bias) | Unclear risk | No details reported |
| Blinding (performance bias and detection bias) | Unclear risk | No blinding reported |
| Incomplete outcome data (attrition bias) | Low risk | Outcomes reported for all randomised participants (n = 71) |
| Selective reporting (reporting bias) | Unclear risk | Live birth not reported. Miscarriage not reported |
| Other bias | Low risk | No other potential source of bias noted |
| Methods | Randomisation: computer‐generated random numbers Trial design: parallel Concealment of allocation: not stated Power analysis: yes | |
| Participants | Participants: 100 women; 100 cycles Age of women: IUI 31.1 ± 4.0 years; FSP 30.2 ± 4.4 years Duration of subfertility: IUI 3.8 ± 2.2 years; FSP 2.9 ± 1.7 years Type of subfertility: male subfertility, unexplained subfertility, mild endometriosis, ovarian dysfunction Duration of unexplained infertility not reported Male subfertility defined as sperm quality before treatment normal or slightly abnormal (> 10 × 106 sperm per mL, > 40% progressive motility [grade A + B], > 30% normal forms and after a Percoll preparation > 1 × 10⁶ progressively motile sperm per mL) | |
| Interventions | Stimulation method: CC + hMG + hCG Intervention: FSP or IUI 36 hours after hCG, type of semen not stated Semen preparation: Percoll gradient Catheter used: Kremer de la Fontaine for IUI; Foley catheter for FSP Maximum number of cycles per couple: 1 | |
| Outcomes | Clinical pregnancy per woman | |
| Notes | ||
| Risk of bias | ||
| Bias | Authors' judgement | Support for judgement |
| Random sequence generation (selection bias) | Low risk | Computer‐generated random numbers |
| Allocation concealment (selection bias) | Unclear risk | No details reported |
| Blinding (performance bias and detection bias) | Unclear risk | No blinding reported |
| Incomplete outcome data (attrition bias) | Low risk | Outcomes reported for all randomised participants (n = 100) |
| Selective reporting (reporting bias) | Unclear risk | Live birth not reported |
| Other bias | Low risk | No other potential source of bias noted |
| Methods | Randomisation: computer‐generated random numbers Trial design: parallel Concealment of allocation: adequate Power analysis: no | |
| Participants | Participants: 100 women; 87 cycles Age of women: not stated Duration of subfertility: at least one year Type of subfertility: mild male subfertility, unexplained subfertility | |
| Interventions | Stimulation method: hMG from CD 5 + hCG Intervention: FSP 34 hours after hCG and IUI 38 hours after hCG; type of semen not stated Semen preparation: Percoll gradient Catheter used: Frydman for IUI; Makler cannula for FSP Maximum number of cycles per couple: 1 | |
| Outcomes | Pregnancy | |
| Notes | Luteal support with 400 mg progesterone. Additional details received from authors | |
| Risk of bias | ||
| Bias | Authors' judgement | Support for judgement |
| Random sequence generation (selection bias) | Low risk | Computer‐generated random numbers |
| Allocation concealment (selection bias) | Low risk | Adequate |
| Blinding (performance bias and detection bias) | Unclear risk | No blinding reported |
| Incomplete outcome data (attrition bias) | Unclear risk | 16 participants did not undergo intervention (reasons given), but intention to treat analysis possible (assuming no pregnancy in those 16 women) |
| Selective reporting (reporting bias) | Unclear risk | Not stated |
| Other bias | Low risk | No other potential source of bias noted |
| Methods | Randomisation: random number generator on computer Trial design: parallel Concealment of allocation: not stated Power analysis: yes | |
| Participants | Participants: 65 women; 132 cycles Age of women: IUI 34.8 ± 4.6 years; FSP 35.5 ± 3.5 years Duration of subfertility: IUI 3.5 ± 1.4 years; FSP 3.4 ± 1.3 years Type of subfertility: unexplained infertility for 2 years | |
| Interventions | Stimulation method: u‐hFSH + hCG Intervention: IUI and FSP 36 hours after hCG with husband's semen Semen preparation: swim‐up Catheter used: Frydman catheter for IUI; FAST system for FSP Maximum number of cycles per couple: 3 | |
| Outcomes | Ongoing pregnancy | |
| Notes | ||
| Risk of bias | ||
| Bias | Authors' judgement | Support for judgement |
| Random sequence generation (selection bias) | Low risk | Random number generator on computer |
| Allocation concealment (selection bias) | Unclear risk | No details reported |
| Blinding (performance bias and detection bias) | Unclear risk | No blinding reported |
| Incomplete outcome data (attrition bias) | Low risk | No losses to follow‐up |
| Selective reporting (reporting bias) | Unclear risk | Not stated |
| Other bias | Low risk | No other potential source of bias noted |
| Methods | Randomisation: random number generator Trial design: parallel Concealment of allocation: third party Power analysis: yes | |
| Participants | Participants: 268 women; 268 cycles Age of women: IUI 33.0 ± 2.7 years; FSP 33.0 ± 2.5 years Duration of subfertility: not stated Type of subfertility: ovulation dysfunction, unexplained infertility, male factor, endometriosis, cervical mucus factor, multiple diagnosis | |
| Interventions | Stimulation method: CC + gonadotropins or gonadotropins alone + hCG Intervention: IUI or FSP 36 hours after hCG with husband's semen Semen preparation: Percoll gradient Catheter used: IUI catheter for IUI; ZUI II catheter for FSP Maximum number of cycles per couple: not stated | |
| Outcomes | Clinical pregnancy | |
| Notes | Duration of infertility unknown | |
| Risk of bias | ||
| Bias | Authors' judgement | Support for judgement |
| Random sequence generation (selection bias) | Low risk | Random number generator |
| Allocation concealment (selection bias) | Low risk | States, "Neither the physicians enrolling the patients nor the physicians performing the inseminations had access to the randomization schedule" |
| Blinding (performance bias and detection bias) | Unclear risk | No blinding reported |
| Incomplete outcome data (attrition bias) | Low risk | Data reported for all women who received interventions, but does not clearly state how many women randomised, so unclear whether any dropped out |
| Selective reporting (reporting bias) | Unclear risk | Does not report live birth, miscarriage or OHSS |
| Other bias | Low risk | No other potential source of bias noted |
CC = clomiphene citrate.
FSH = follicle‐stimulating hormone.
FSP = fallopian sperm perfusion.
GnRH = gonadotrophin‐releasing hormone.
hMG = human menopausal gonadotropin.
IUI = intrauterine insemination.
LBR = live birth rate.
OHSS = ovarian hyperstimulation syndrome.
PR = pregnancy rate.
Characteristics of excluded studies [ordered by study ID]
Jump to:
| Study | Reason for exclusion |
| Randomisation method was not stated, and the groups were not equal (369 in IUI group and 20 in FSP group), which makes adequate randomisation impossible. The author did not reply to our request for further information. Duration of subfertility was not stated | |
| Randomisation method was not stated, and the groups were not equal (95 cycles with IUI and 36 cycles with FSP), which makes adequate randomisation improbable. The author did not reply to our request for further information | |
| The trial was quasi‐randomised. The duration of subfertility was not stated. The author gave additional information regarding data after the first cycle. However, these data consisted of only pregnancies per cycle. Moreover, no data were available on the duration of subfertility | |
| Randomisation method was not stated, but the groups were not equal (369 in IUI group and 20 in FSP group), which makes adequate randomisation improbable. The author did not reply to our request for further information. The duration of subfertility was not stated | |
| The trial did not perform the comparison of interest | |
| Letter | |
| Letter | |
| Letter | |
| Cohort study | |
| Cohort study | |
| This study did not perform the comparison of interest | |
| Both IUI and FSP were performed on two consecutive days after hCG administration. A substantial number of women with tubal subfertility were included. The duration of subfertility was not stated | |
| This study did not perform the comparison of interest | |
| Case report that described a simple non‐invasive method of fallopian tube sperm perfusion. This study did not perform the comparison of interest | |
| The trial was quasi‐randomised | |
| The trial was quasi‐randomised | |
| The trial did not perform the comparison of interest. Intrauterine tuboperitoneal insemination is not the same as fallopian tube sperm perfusion | |
| The trial did not perform the comparison of interest | |
| This study compared conventional IUI with intra‐tubal insemination, which is different from perfusion of the fallopian tubes (FSP) | |
| The method of allocation was not random and used odd and even numbers of the ART register to assign FSP and IUI. Confirmed in writing by author | |
| The trial was a non‐controlled randomised trial | |
| The trial did not perform the comparison of interest |
Characteristics of studies awaiting assessment [ordered by study ID]
Jump to:
| Methods | RCT |
| Participants | 400 couples with unexplained or mild male factor infertility |
| Interventions | IUI versus FSP in natural cycles |
| Outcomes | Clinical pregnancy, ectopic pregnancy, miscarriage |
| Notes | Study completed December 2009. Emailed lead investigator March 2013—no response to date |
Data and analyses
| Outcome or subgroup title | No. of studies | No. of participants | Statistical method | Effect size |
| 1 Live birth per couple Show forest plot | 3 | 633 | Odds Ratio (M‐H, Fixed, 95% CI) | 0.94 [0.59, 1.49] |
| Analysis 1.1  Comparison 1 IUI versus FSP, Outcome 1 Live birth per couple. | ||||
| 2 Clinical pregnancy per couple Show forest plot | 14 | Odds Ratio (M‐H, Random, 95% CI) | Subtotals only | |
| Analysis 1.2  Comparison 1 IUI versus FSP, Outcome 2 Clinical pregnancy per couple. | ||||
| 3 Multiple pregnancy Show forest plot | 8 | Odds Ratio (M‐H, Fixed, 95% CI) | Subtotals only | |
| Analysis 1.3  Comparison 1 IUI versus FSP, Outcome 3 Multiple pregnancy. | ||||
| 3.1 Multiple pregnancy per couple | 7 | 908 | Odds Ratio (M‐H, Fixed, 95% CI) | 0.62 [0.29, 1.32] |
| 3.2 Sensitivity analysis: multiple pregnancy per pregnancy | 8 | 197 | Odds Ratio (M‐H, Fixed, 95% CI) | 0.96 [0.44, 2.07] |
| 4 Miscarriage rate Show forest plot | 7 | Odds Ratio (M‐H, Fixed, 95% CI) | Subtotals only | |
| Analysis 1.4 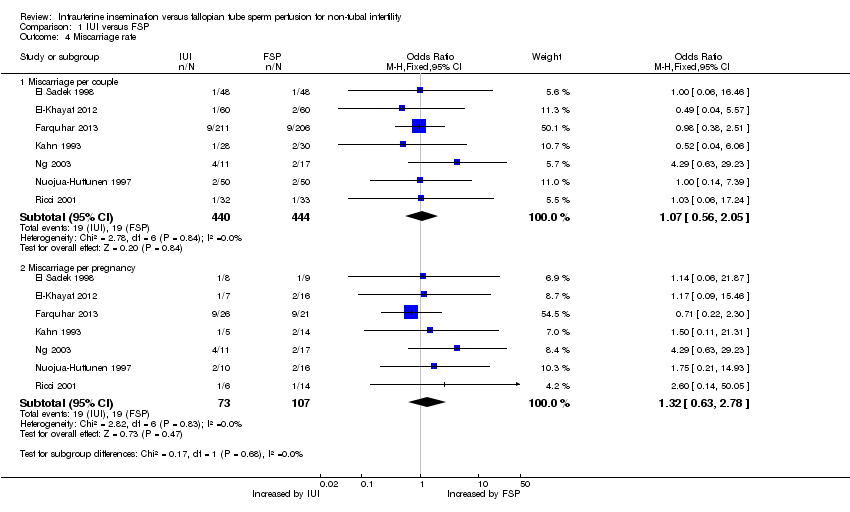 Comparison 1 IUI versus FSP, Outcome 4 Miscarriage rate. | ||||
| 4.1 Miscarriage per couple | 7 | 884 | Odds Ratio (M‐H, Fixed, 95% CI) | 1.07 [0.56, 2.05] |
| 4.2 Miscarriage per pregnancy | 7 | 180 | Odds Ratio (M‐H, Fixed, 95% CI) | 1.32 [0.63, 2.78] |
| 5 Ectopic pregnancy Show forest plot | 4 | Odds Ratio (M‐H, Fixed, 95% CI) | Subtotals only | |
| Analysis 1.5  Comparison 1 IUI versus FSP, Outcome 5 Ectopic pregnancy. | ||||
| 5.1 Ectopic pregnancy per couple | 4 | 643 | Odds Ratio (M‐H, Fixed, 95% CI) | 0.88 [0.24, 3.19] |
| 5.2 Ectopic pregnancy per pregnancy | 4 | 111 | Odds Ratio (M‐H, Fixed, 95% CI) | 1.71 [0.42, 6.88] |
| Outcome or subgroup title | No. of studies | No. of participants | Statistical method | Effect size |
| 1 Unexplained subfertility Show forest plot | 7 | 378 | Odds Ratio (M‐H, Fixed, 95% CI) | 0.63 [0.39, 1.02] |
| Analysis 2.1 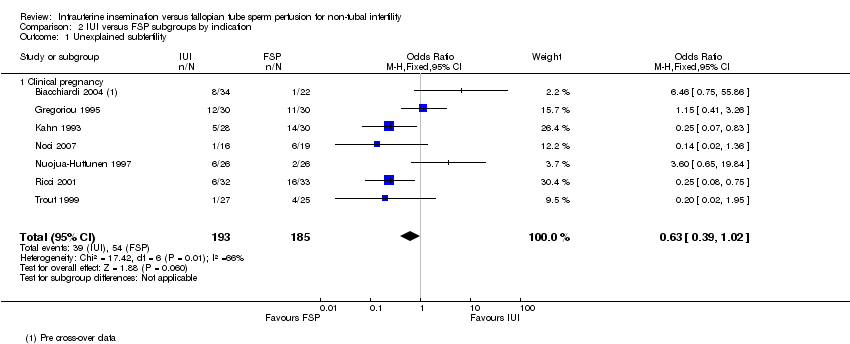 Comparison 2 IUI versus FSP subgroups by indication, Outcome 1 Unexplained subfertility. | ||||
| 1.1 Clinical pregnancy | 7 | 378 | Odds Ratio (M‐H, Fixed, 95% CI) | 0.63 [0.39, 1.02] |
| 2 Mild to moderate male factor subfertility Show forest plot | 5 | Odds Ratio (M‐H, Fixed, 95% CI) | Subtotals only | |
| Analysis 2.2  Comparison 2 IUI versus FSP subgroups by indication, Outcome 2 Mild to moderate male factor subfertility. | ||||
| 2.1 Live birth | 1 | 120 | Odds Ratio (M‐H, Fixed, 95% CI) | 0.40 [0.14, 1.14] |
| 2.2 Clinical pregnancy | 5 | 303 | Odds Ratio (M‐H, Fixed, 95% CI) | 0.53 [0.28, 1.01] |

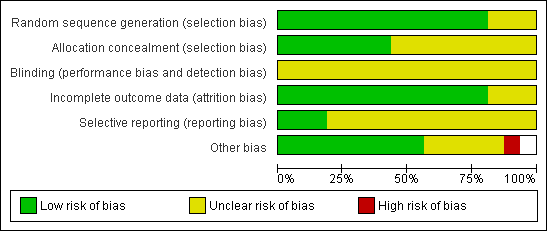
Methodological quality graph: review authors' judgements about all methodological quality items presented as percentages across all included studies.

Methodological quality summary: review authors' judgements about all methodological quality items for each included study.
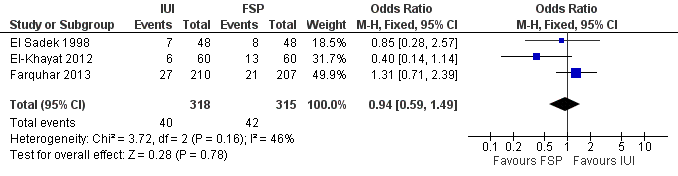
Forest plot of comparison: 1 NEW Intrauterine insemination versus fallopian tube sperm perfusion, outcome: 1.1 Live birth per couple.

Forest plot of comparison: 1 IUI vs FSP: unexplained or mixed (non‐tubal) causes, outcome: 1.2 Clinical pregnancy per couple (unexplained and mixed causes).

Funnel plot of comparison: 1 IUI versus FSP, outcome: 1.2 Clinical pregnancy per couple.
Comparison 1 IUI versus FSP, Outcome 1 Live birth per couple.
Comparison 1 IUI versus FSP, Outcome 2 Clinical pregnancy per couple.
Comparison 1 IUI versus FSP, Outcome 3 Multiple pregnancy.
Comparison 1 IUI versus FSP, Outcome 4 Miscarriage rate.
Comparison 1 IUI versus FSP, Outcome 5 Ectopic pregnancy.
Comparison 2 IUI versus FSP subgroups by indication, Outcome 1 Unexplained subfertility.
Comparison 2 IUI versus FSP subgroups by indication, Outcome 2 Mild to moderate male factor subfertility.
| IUI compared with FSP for non‐tubal infertility | ||||||
| Patient or population: women with non‐tubal infertility | ||||||
| Outcomes | Illustrative comparative risks* (95% CI) | Relative effect | No of participants | Quality of the evidence | Comments | |
| Assumed risk | Corresponding risk | |||||
| FSP | IUI | |||||
| Live birth per couple | 133 per 1000 | 126 per 1000 | OR 0.94 | 633 | ⊕⊕⊝⊝ | |
| Clinical pregnancy per couple | 185 per 1000 | 145 per 1000 | OR 0.75 | 1745 | ⊕⊕⊝⊝ | |
| Multiple pregnancy per couple | 70 per 1000 | 55 per 1000 | OR 0.62 | 908 | ⊕⊕⊝⊝ | |
| Miscarriage per couple | 43 per 1000 | 46 per 1000 | OR 1.07 | 884 | ⊕⊕⊝⊝ | |
| Ectopic pregnancy per couple | 10 per 1000 | 8 per 1000 | OR 0.88 | 643 | ⊕⊝⊝⊝ | |
| *The basis for the assumed risk (the median control group risk across studies) is provided in footnotes. The corresponding risk (and its 95% confidence interval) is based on the assumed risk in the comparison group and the relative effect of the intervention (and its 95% CI). | ||||||
| GRADE Working Group grades of evidence. | ||||||
| 1One of the three studies did not describe method of allocation concealment and 19% of women in this study had mild tubal damage. | ||||||
| Study | Clinical pregnancy per cycle | ||
| IUI | FSP | P value | |
| 10/50 (20%) | 20/50 (40%) | P < 0.04 | |
| 12/59 (20%) | 5/47 (11%) | P > 0.05 | |
| Outcome or subgroup title | No. of studies | No. of participants | Statistical method | Effect size |
| 1 Live birth per couple Show forest plot | 3 | 633 | Odds Ratio (M‐H, Fixed, 95% CI) | 0.94 [0.59, 1.49] |
| 2 Clinical pregnancy per couple Show forest plot | 14 | Odds Ratio (M‐H, Random, 95% CI) | Subtotals only | |
| 3 Multiple pregnancy Show forest plot | 8 | Odds Ratio (M‐H, Fixed, 95% CI) | Subtotals only | |
| 3.1 Multiple pregnancy per couple | 7 | 908 | Odds Ratio (M‐H, Fixed, 95% CI) | 0.62 [0.29, 1.32] |
| 3.2 Sensitivity analysis: multiple pregnancy per pregnancy | 8 | 197 | Odds Ratio (M‐H, Fixed, 95% CI) | 0.96 [0.44, 2.07] |
| 4 Miscarriage rate Show forest plot | 7 | Odds Ratio (M‐H, Fixed, 95% CI) | Subtotals only | |
| 4.1 Miscarriage per couple | 7 | 884 | Odds Ratio (M‐H, Fixed, 95% CI) | 1.07 [0.56, 2.05] |
| 4.2 Miscarriage per pregnancy | 7 | 180 | Odds Ratio (M‐H, Fixed, 95% CI) | 1.32 [0.63, 2.78] |
| 5 Ectopic pregnancy Show forest plot | 4 | Odds Ratio (M‐H, Fixed, 95% CI) | Subtotals only | |
| 5.1 Ectopic pregnancy per couple | 4 | 643 | Odds Ratio (M‐H, Fixed, 95% CI) | 0.88 [0.24, 3.19] |
| 5.2 Ectopic pregnancy per pregnancy | 4 | 111 | Odds Ratio (M‐H, Fixed, 95% CI) | 1.71 [0.42, 6.88] |
| Outcome or subgroup title | No. of studies | No. of participants | Statistical method | Effect size |
| 1 Unexplained subfertility Show forest plot | 7 | 378 | Odds Ratio (M‐H, Fixed, 95% CI) | 0.63 [0.39, 1.02] |
| 1.1 Clinical pregnancy | 7 | 378 | Odds Ratio (M‐H, Fixed, 95% CI) | 0.63 [0.39, 1.02] |
| 2 Mild to moderate male factor subfertility Show forest plot | 5 | Odds Ratio (M‐H, Fixed, 95% CI) | Subtotals only | |
| 2.1 Live birth | 1 | 120 | Odds Ratio (M‐H, Fixed, 95% CI) | 0.40 [0.14, 1.14] |
| 2.2 Clinical pregnancy | 5 | 303 | Odds Ratio (M‐H, Fixed, 95% CI) | 0.53 [0.28, 1.01] |