| Study ID | Number | Male/female | Age in years mean (standard deviation) | Post‐onset mean (standard deviation) (range) | Aphasia severity mean (standard deviation) |
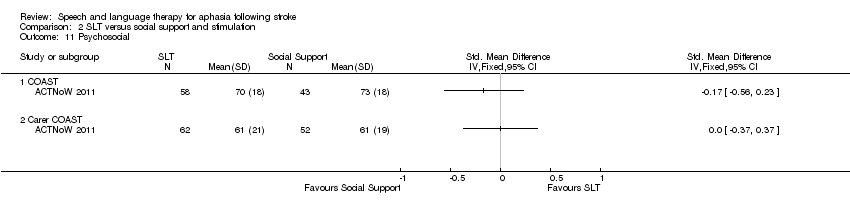
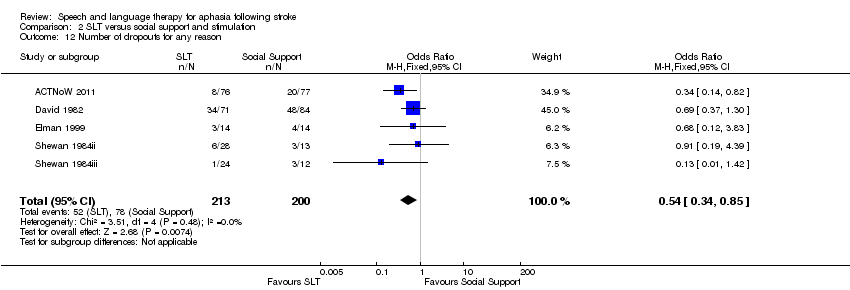
| ACTNoW 2011 | 153 | SLT: 40/36 Social support: 42/35 | SLT: 71 (range 32 to 97) Social support: 70 (range 40 to 92) | Admission to randomisation median 12 (interquartile range 9 to 16) days | TOMs SLT: 1.9 (1.2) (severe n = 47) Social support: 1.9 (1.1) (severe n = 51) |
| Bakheit 2007 | 97 | Intensive: 26/25
Conventional: 21/25 | Intensive: 71.2 (14.9) (range 26 to 92)
Conventional: 69.7 (15) (range 17 to 91) | Intensive: 34.2 (19.1) days
Conventional: 28.1 (14.9) days | WABAQ
Intensive: 44.2 (30.2)
Conventional: 37.9 (27.2) |
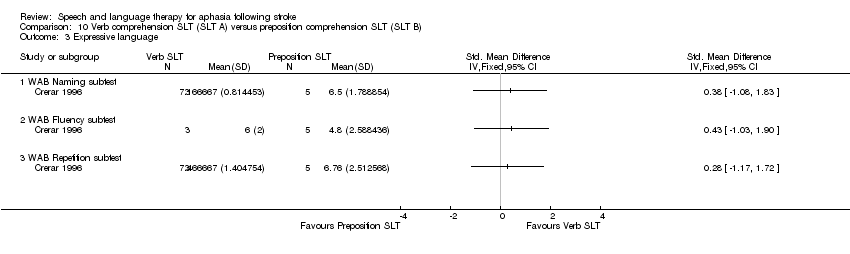
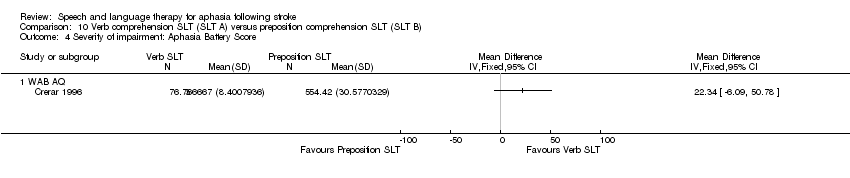
| Crerar 1996 | 8 | Verb SLT: 2/1 Preposition SLT: 5/0 | Verb SLT: 50.3 (8.5) (range 44 to 60) Preposition SLT: 48.8 (13.77) (range 27 to 64) | Verb SLT: 87.33 (40.61) (range 60 to 134) months Preposition SLT: 66.4 (20.96) (range 39 to 86) | WABAQ Verb SLT: 76.2 (9.81) Preposition SLT: 69.3 (16.58) |
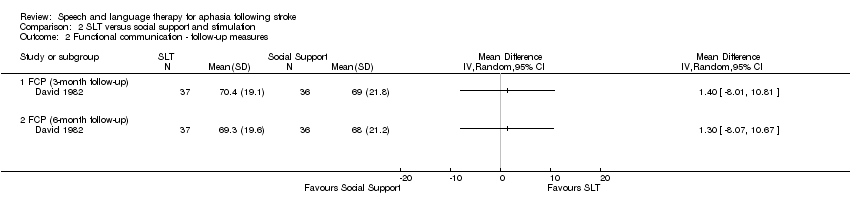
| David 1982 | 133 (of 155 randomised) | Conventional: 35/30
Social support: 42/26 | Conventional: 70 (8.7)
Social support: 65 (10.6) | Conventional: median 4 (range 4 to 266) weeks
Social support: median 5 (range 4 to 432) weeks | Baseline FCP scores for n = 98 retained until post‐therapy test Conventional: 42.4 (20.8)
Social support: 46.1 (20.1) |
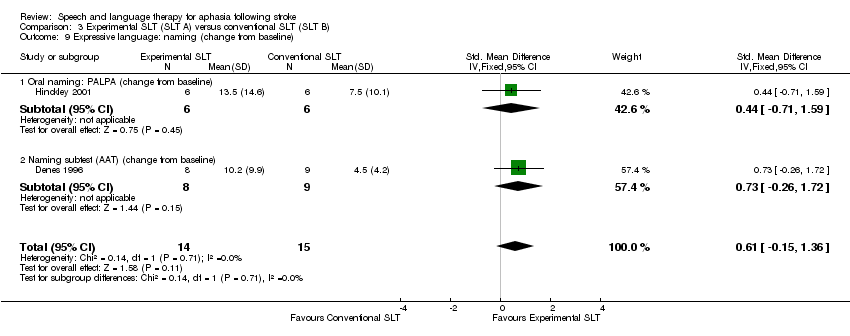
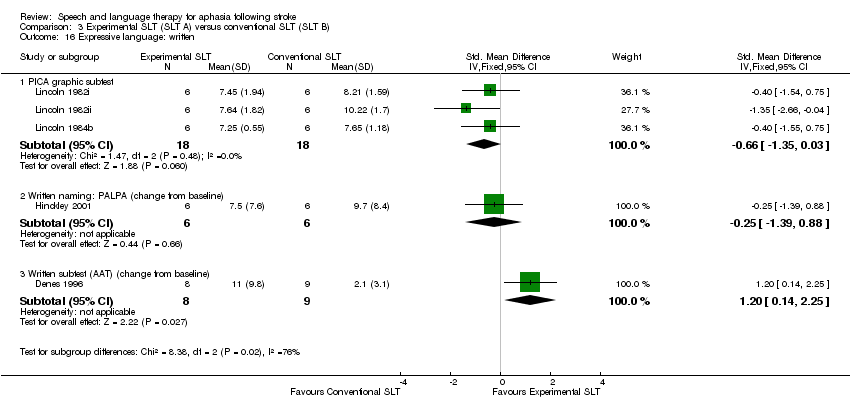
| Denes 1996 | 17 | Intensive: 5/3
Conventional: 3/6 | Intensive: 58.1 (11.8)
Conventional: 62.1 (8.7) | Intensive: 3.2 (1.8) months
Conventional: 3 (1.6) months | AAT
Intensive: severe
Conventional: severe |
| Di Carlo 1980 | 14 | Programmed instruction: 7/0
Non‐programmed instruction: 7/0 | Programmed instruction: 57.6 (9.2) (range 44 to 69)
Non‐programmed instruction: 55.3 (13) (range 32 to 70) | Programmed instruction: 24.7 (23.6) (range 0 to 66) months
Non‐programmed instruction: 16.3 (16.9) (range 1 to 38) months | Programmed instruction: severe
Non‐programmed instruction: severe |
| Doesborgh 2004 | 18 (of 19 randomised) | Computer‐mediated: 4/4
No SLT: 5/5 | Computer‐mediated: 62 (9.0)
No SLT: 65 (12.0) | Computer‐mediated: 13 (range 11 to 16) months
No SLT: 13 (range 11 to 17) months | Computer‐mediated: ANELT‐ A 34 (9); BNT 63 (37)
No SLT: ANELT‐A 29 (12); BNT 74 (35) |
| Drummond 1981 | 8 | Not reported | Gesture cue: 52.9 (6.0)
Conventional: 50.04 (4.5) | Gesture cue: 15.3 (4.1) (range 10 to 20) months
Conventional: 17.8 (7.1) (range 9 to 24) months | Not reported |
| Elman 1999 | 24 | Conventional: 7/5
Social support: 6/6 | Conventional: 58.3 (11.4) (range 38 to 79)
Social support: 60.7 (10.6) (range 47 to 80) | Conventional: 32.5 (28.7) (range 7 to 103) months
Social support: 71.7 (94.2) (range 7 to 336) months | Conventional: SPICA 7 mild to moderate, 7 moderate to severe
Social support: SPICA 7 mild to moderate, 7 moderate to severe |
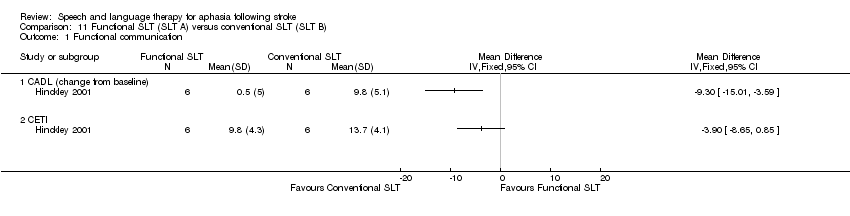
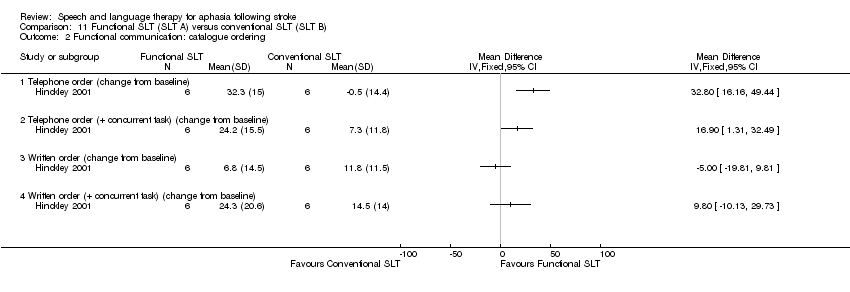
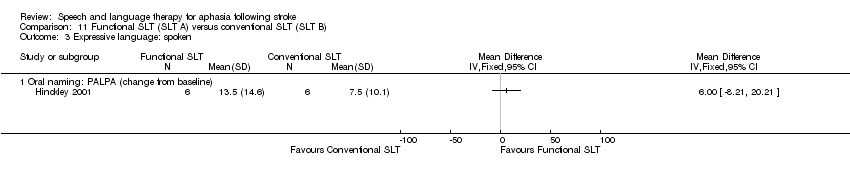
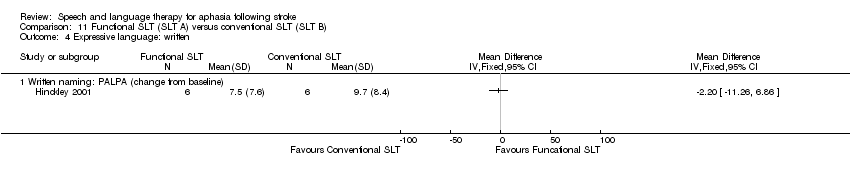
| Hinckley 2001 | 12 | Functional SLT: 5/1
Conventional SLT: 6/0 | Functional: 51.6 (15)
Conventional: 50.3 (13.6) | Functional: 26.8 (20.1) (range 6 to 58) months
Conventional: 26.8 (37.6) (range 4 to 102) months | BDAE Severity Rating
Functional: 2.5 (0.8)
Conventional: 1.83 (0.9) |
| Yao 2005i | 60 | Group SLT: unclear
No SLT: unclear
(Yao 2005: 50/34) | Group SLT: unclear
No SLT: unclear
(Yao 2005: < 40 years = 3; 40s = 23; 50s = 23; 60s = 25; 70s = 8; > 80 years = 2) | Not reported | Not reported |
| Yao 2005ii | 54 | Group SLT: unclear
No SLT: unclear
(Yao 2005: 50/34) | Group SLT: unclear
No SLT: unclear
(Yao 2005: < 40 years = 3; 40s = 23; 50s = 23; 60s = 25; 70s = 8; > 80 years = 2) | Not reported | Not reported |
| Yao 2005iii | 54 | Group SLT: unclear
No SLT: unclear
(Yao 2005: 50/34) | Group SLT: unclear
No SLT: unclear
(Yao 2005: < 40 years = 3; 40s = 23; 50s = 23; 60s = 25; 70s = 8; > 80 years = 2) | Not reported | Not reported |
| Katz 1997i | 42 (reported data on 36) | Computer‐mediated: unclear
No SLT: unclear
(Katz 1997: 44/11) | Computer‐mediated: 61.6 (10)
No SLT: 62.8 (5.1) | Computer‐mediated: 6.2 (5.2) years
No SLT: 8.5 (5.4) years | PICA overall percentile; WABAQ Computer‐mediated: 57.3 (17.9); 68.9 (24.3).
No SLT: 59.5 (16.2); 72.2 (24.8) |
| Katz 1997ii | 40 (of 42 randomised) | Computer‐mediated: unclear
Computer placebo: unclear
(Katz 1997: 44/11) | Computer‐mediated: 61.6 (10)
Computer placebo: 66.4 (6) | Computer‐mediated: 6.2 (5.2) years
Computer placebo: 5.4 (4.6) years | PICA overall percentile; WABAQ Computer‐mediated: 57.3 (17.9); 68.9 (24.3)
Computer‐placebo: 51.9 (20.3); 61.9 (29.5) |
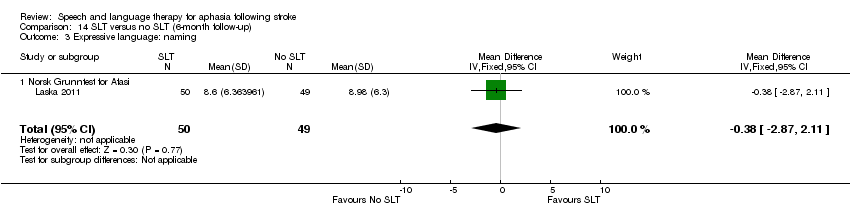
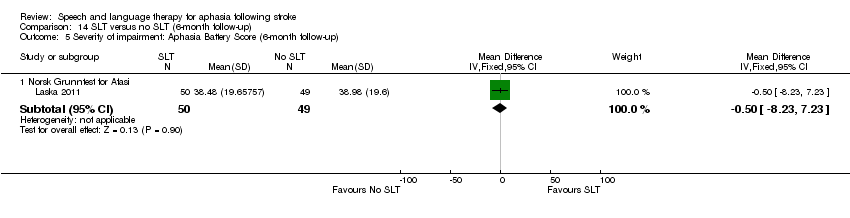
| Laska 2011 | 123 | SLT: 33/29 No SLT: 23/38 | SLT: 76 (range 38 to 94) No SLT: 79 (range 39 to 94) | SLT: 3 (25th‐75th; 2 to 4) days No SLT: 3 (25th‐75th; 2 to 4) days | ANELT‐A median (25th to 75th) SLT: 1 (0 to 1.4) No SLT: 1 (0 to 1.4) |
| Leal 1993 | 94 | Conventional: 38/21 Volunteer‐facilitated: 22/13 | Conventional: 56 (17)
Volunteer‐facilitated: 59 (13) | Within first month after stroke | Conventional: moderate‐severe
Volunteer‐facilitated: moderate‐severe |
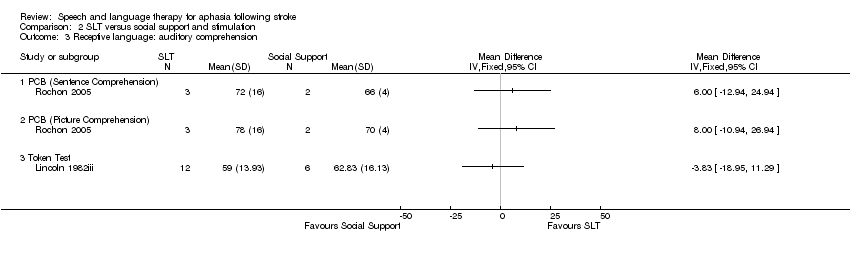
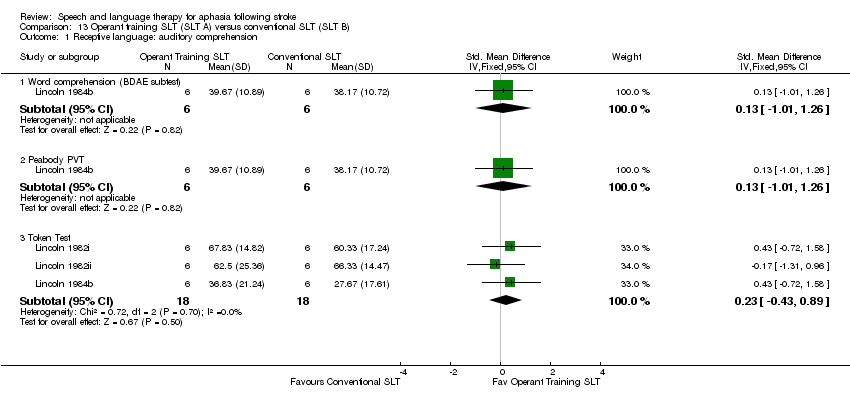
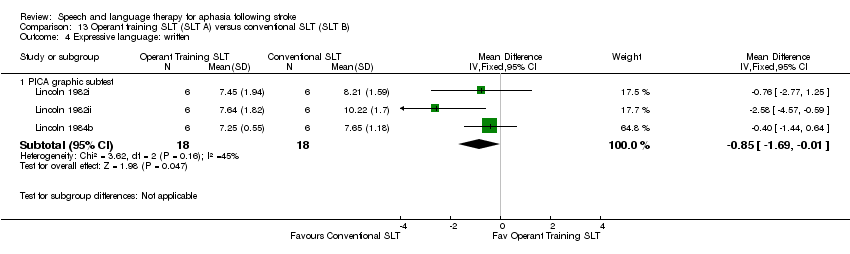
| Lincoln 1982i | 12 | SLT/operant train: 3/3
SLT/Social support: 4/2 | SLT/operant train: 54.33 (6.68) (range 45 to 63) SLT/social support: 51.33 (7.97) (range 39 to 63) | SLT/operant train: 3.17 (1.60) (range 1 to 5) months
SLT/social support: 5.17 (3.43) (range 1 to 10) months | SLT/operant train: moderate
SLT/social support: moderate |
| Lincoln 1982ii | 12 | Operant train/SLT: 5/1
Social support/SLT: 5/1 | Operant train/SLT: 57.67 (5.72) (range 51 to 64)
Social support/SLT: 42.33 (16.91) (range 28 to 60) | Operant train/SLT: 2.33 (1.55) (range 1 to 5) months
Social support/SLT: 8.83 (13.59) (range 1 to 36) months | Operant train/SLT: moderate
Social support/SLT: moderate |
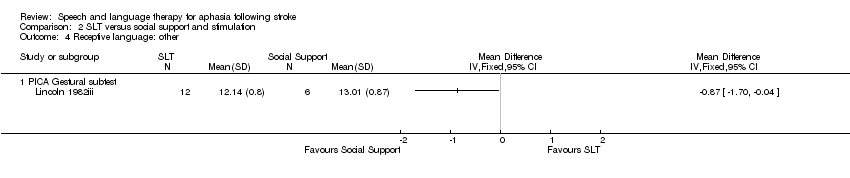
| Lincoln 1982iii | 18 | Conventional SLT: 7/5
Social support: 5/1 | Conventional SLT:52.83 (7.18) (range 39 to 63)
Social support: 42.33 (16.91) (range 28 to 60) | Conventional SLT: 4.17 (2.76) (range 1 to 10) months
Social support: 8.83 (13.59) (range 1 to 36) months | Conventional SLT: moderate
Social support: moderate |
| Lincoln 1984a (data for 58% of randomised participants) | 191
(of 327 randomised) | Conventional: unclear
No SLT: unclear
(Lincoln 1984a:109/ 82) | Conventional: unclear
No SLT: unclear
Lincoln 1984a: 68.2 (10.2) (range 38 to 92) | Conventional: 10 weeks
No SLT: 10 weeks | Not reported |
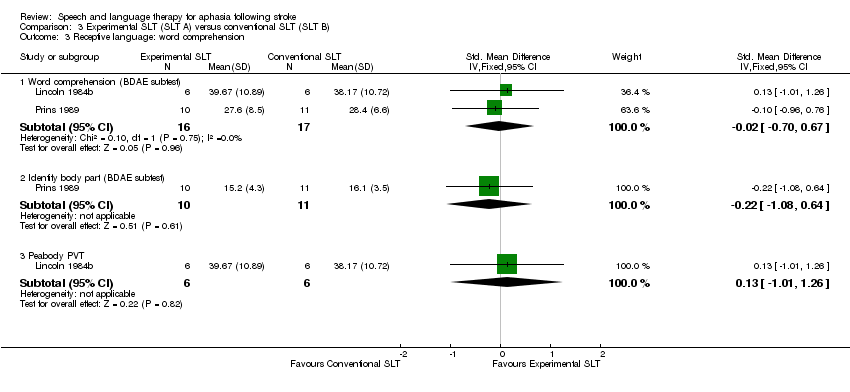
| Lincoln 1984b | 12 | Operant train: 4/2 Placebo: 5/1 | Operant train: 52.33 (11.50) (range 32 to 64)
Placebo: 52.5 (14.9) (range 26 to 66) | Operant train: 5.5 (4.89) (range 1 to 12) months
Placebo: 2.83 (2.32) (range 1 to 7) months | Operant train: severe
Placebo: severe |
| Liu 2006 | 36 | SLT: 9/10 No SLT: 10/7 | SLT: 7 = 40 to 65 years; 12 = 65 to 80 years No SLT: 8 = 40 to 65 years; 9 = 65 to 80 years | SLT: 8 = 7 to 20 days; 11 = 20 to 45 days No SLT: 7 = 7 to 20 days; 10 = 20 to 45 days | BDAE SLT: 60.48 (11.83) No SLT: 58.22 (5.06) |
| Lyon 1997 | 30 | Functional: unclear
No SLT: unclear
(Lyon 1997: person with aphasia: 8/2; carer: 4/6; communication partner: 1/9) | Functional: unclear
No SLT: unclear
(Lyon 1997: person with aphasia: 68.6 (12.1) (range 54 to 86); carer 60.2 (14.9) (range 28 to 84); communication partner: 44.9 (17.5) (range 25 to 74)) | Functional: unclear
No SLT: unclear
(Lyon 1997: 43.5 (32.2) months) | Functional: unclear
No SLT: unclear
(Lyon 1997: receptive = mild; expressive = moderate) |
| MacKay 1988 | 95
(of 96 randomised) | MacKay 1988: 46/49 | MacKay 1988: median 75 | MacKay 1988: mean 30 months | Not reported |
| Meikle 1979 | 31 | Volunteer‐facilitated: 12/3
Conventional: 10/6 | Volunteer‐facilitated: 67.2 (8.6)
Conventional: 64.8 (7.9) | Volunteer‐facilitated: 30.9 (29.5) (range 4 to 115) weeks
Conventional: 39.8 (69.4) (range 4 to 268) weeks | PICA percentile volunteer‐facilitated: 53.9 (23.5)
Conventional: 55.8 (19.78) |
| Meinzer 2007 | 20 | Constraint‐induced: 7/3 Volunteer‐facilitated: 9/1 | Constraint‐induced: 50.2 (10.13)
Volunteer‐facilitated: 62 (8.9) | Constraint‐induced: 30.7 (18.9) (range 6 to 72) months
Volunteer‐facilitated: 46.5 (17.2) (range 24 to 79) months | AAT profile score
Constraint‐induced: 5 mild, 3 moderate, 2 severe
Volunteer‐facilitated: 3 mild, 6 moderate, 1 severe |
| ORLA 2006 | 13 | Intensive SLT: 6
Conventional SLT: 7 | Intensive SLT: 61.4 (9.72) (range 48.44 to 74.5)
Conventional SLT: 53.1 (18.1) (range 31.34 to 77.98). | Intensive SLT: 36.2 (28.2) (range 8.6 to 69.8) months
Conventional SLT: 43.6 (51.1) (range 7.3 to 154) months | WABAQ Intensive SLT: 51.1 (17.8) (range 28.0 to 69.4)
Conventional SLT: 55.1 (18) (range 34.1 to 77.1) |
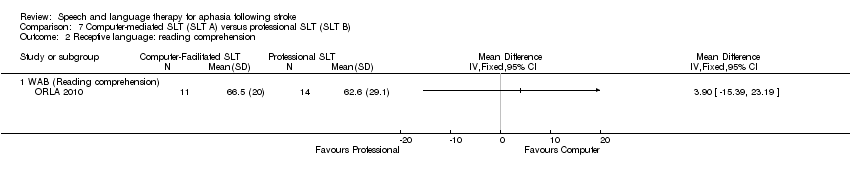
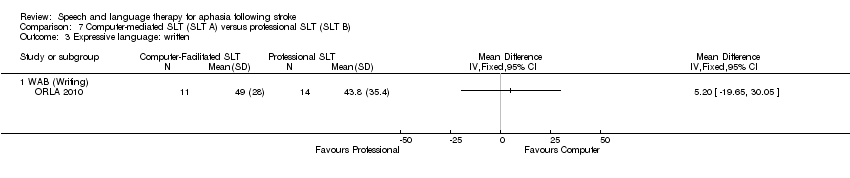
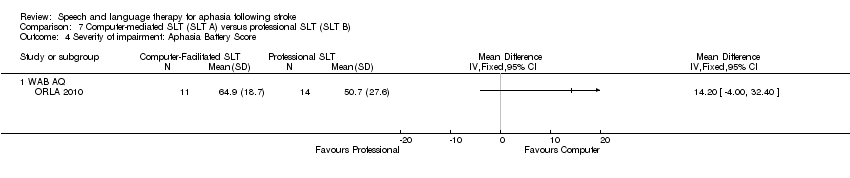
| ORLA 2010 | 25 | Computer: 8/3 Therapist: 8/6 | Computer: 56.6 (9.2) (range 41.7 to 68) Therapist: 61.1 (14.8) (range 35.2 to 81.7) | Computer: 66.7 (71.5) (range 13.8 to 253.2) months Therapist: 41.3 (45.7) (range 12.2 to 166) months | WABAQ Computer: 62.0 (19.9) Therapist: 47.3 (27.9) |
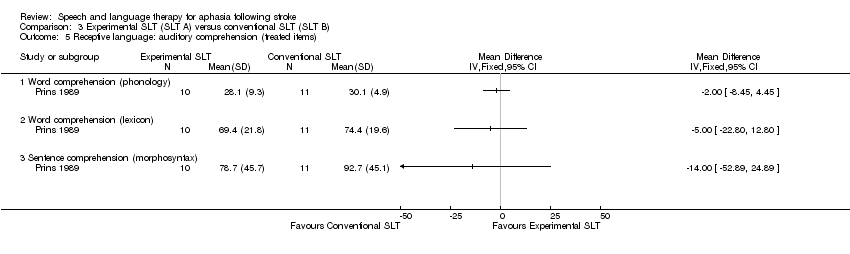
| Prins 1989 | 21 | STACDAP: 5/5
Conventional: 5/6 | STACDAP: 70.3 (range 58 to 83)
Conventional: 66 (range 45 to 78) | STACDAP: 15.2 (range 3 to 35) months
Conventional: 15.2 (range 3 to 36) months | STACDAP: FE‐scale 2.6 (0 to 6), oral comp (BDAE and Token Test) 26.4 (0 to 46)
Conventional: FE‐scale 2.7 (0 to 9), oral comp (BDAE and Token Test) 29.6 (2 to 48) |
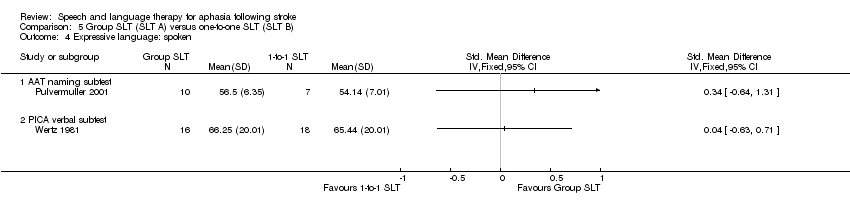
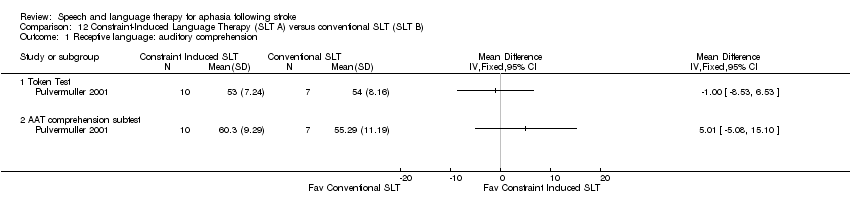
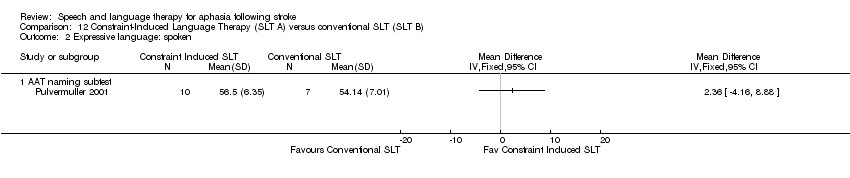
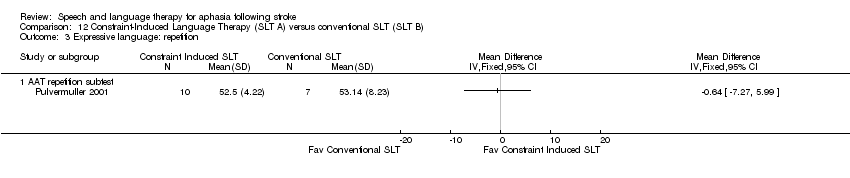
| Pulvermuller 2001 | 17 | Constraint‐induced: 6/4
Conventional: 6/1 | Constraint‐induced: 55.4 (10.9)
Conventional: 53.9 (7.4) | Constraint‐induced: 98.2 (74.2) months
Conventional: 24 (20.6) months | Constraint‐induced: 2 mild, 5 moderate, 3 severe
Conventional: 2 mild, 4 moderate, 1 severe |
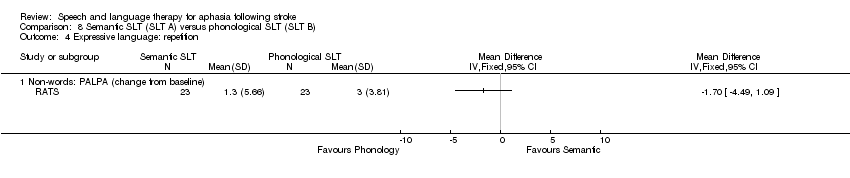
| RATS | 58 | Semantic: 18/11
Phonological: 15/14 | Semantic: 66 (10)
Phonological: 58 (14) | Semantic: mean 4 (range 3 to 5) months
Phonological: mean 4 (range 3 to 5) months | ANELT‐A score
Semantic: 24.8 (11)
Phonological: 23.3 (8) |
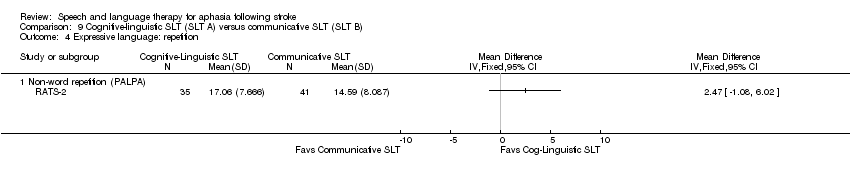
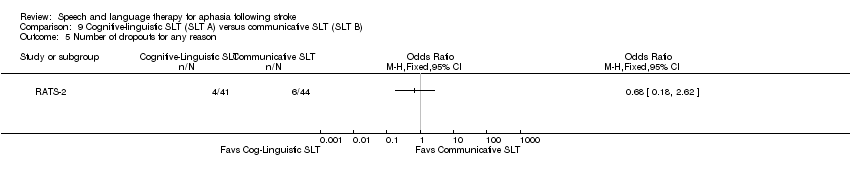
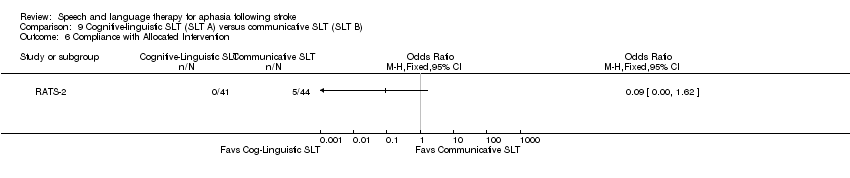
| RATS‐2 | 80 | Cognitive linguistic: 14/24 Communicative: 24/18 | Cognitive linguistic: 68 (13) Communicative: 67 (15) | Cognitive linguistic: 22 (range 11 to 37) days Communicative: 23 (9 to 49) days | ANELT‐A score Cognitive linguistic: 21.4 (11.0) Communicative: 21.0 (11.1) |
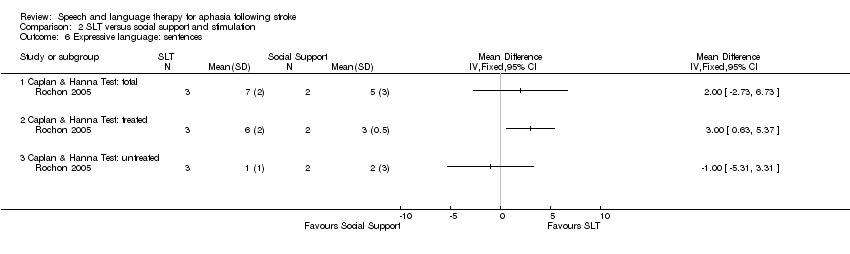
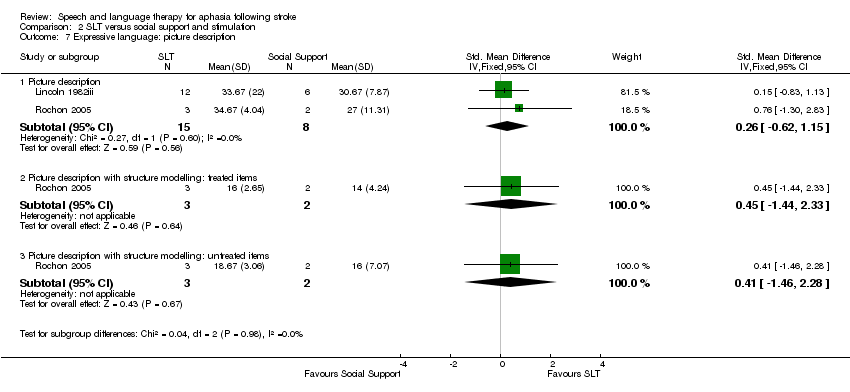
| Rochon 2005 | 5 | Sentence mapping: 0/3
Social support: 0/2 | Sentence mapping: range 31 to 74
Social support: range 32 to 82 | Sentence mapping: range 2 to 9 years
Social support: range 2 to 4 years | Sentence mapping: BDAE 1 to 2, phrase length 2.5 to 4
Social support: BDAE 1 to 2, phrase length 4 |
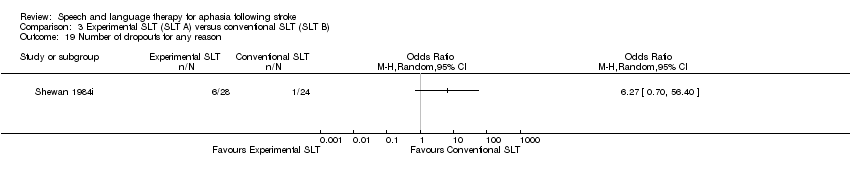
| Shewan 1984i | 52 | Language‐orientated: 18/10
Conventional: 14/10 | Language‐orientated: 62.18 (range 29 to 82)
Conventional: 65.63 (range 48 to 85) | Language‐orientated: range 2 to 4 weeks
Conventional: range 2 to 4 weeks | Language‐orientated: 9 mild, 6 moderate, 13 severe
Conventional: 8 mild, 3 moderate, 13 severe |
| Shewan 1984ii | 53 | Language‐orientated: 18/10
Social support: 14/11 | Language‐orientated: 62.18 (range 29 to 82)
Social support: 66.12 (range 39 to 82) | Language‐orientated: range 2 to 4 weeks
Social support: range 2 to 4 weeks | Language‐orientated: 9 mild, 6 moderate, 13 severe
Social support: 7 mild, 5 moderate, 13 severe |
| Shewan 1984iii | 49 | Conventional: 14/10
Social support: 14/11 | Conventional: 65.63 (range 48 to 85)
Social support: 66.12 (range 39 to 82) | Conventional: range 2 to 4 weeks
Social support: range 2 to 4 weeks | Conventional: 8 mild, 3 moderate, 13 severe
Social support: 7 mild, 5 moderate, 13 severe |
| Smania 2006 | 33 (of 41 randomised) | Conventional: 11/4
No SLT: 12/6 | Conventional: 65.73 (8.78) (range 48 to 77)
No SLT: 65.67 (9.83) (range 41 to 77) | Conventional: 17.4 (24.07) (range 2 to 36) months
No SLT: 10.39 (7.96) (range 3 to 32) months | Aphasia severity: unclear
Neurological severity:
Conventional: 6.07 (4.3) (range 0 to16)
No SLT: 6.94 (5.83) (range 0 to 15) |
| Smith 1981i | 33 | Intensive: 12/4
No SLT: 10/7 | Intensive: 62
No SLT: 65 | Not reported | MTDDA (mean error score percentage)
Intensive: 39
No SLT: 26 |
| Smith 1981ii | 31 | Conventional: 10/4
No SLT: 10/7 | Conventional: 63
No SLT: 65 | Not reported | MTDDA (mean error score percentage)
Conventional: 44
No SLT: 26 |
| Smith 1981iii | 30 | Intensive: 12/4
Conventional: 10/4 | Intensive: 62
Conventional: 63 | Not reported | MTDDA (mean error score percentage)
Intensive: 39
Conventional: 44 |
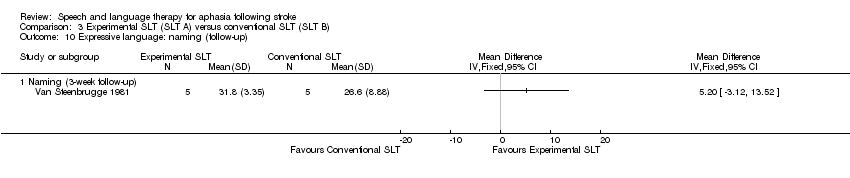
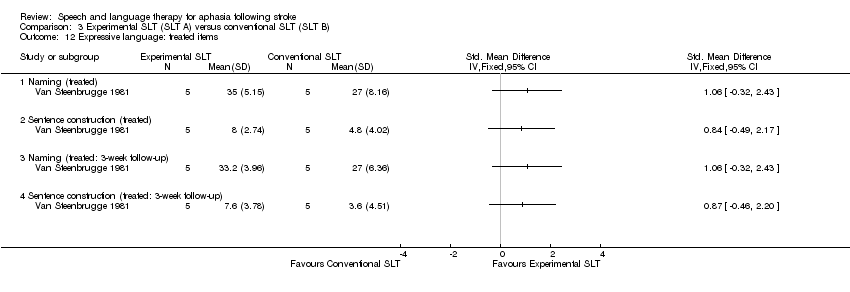
| Van Steenbrugge 1981 | 10 | Task‐specific: 0/5
Conventional: 2/3 | Task‐specific: 61.8 (17.05) (range 40 to 77)
Conventional: 63.6 (10.9) (range 48 to 77) | Task‐specific: 21 (22.4) (range 5 to 60) months
Conventional: 20.6 (23.7) (range 5 to 60) months | FE‐scale and M‐S Comprehension Test
Task‐specific: 4 (1.9)
Conventional: 6 (2.9) |
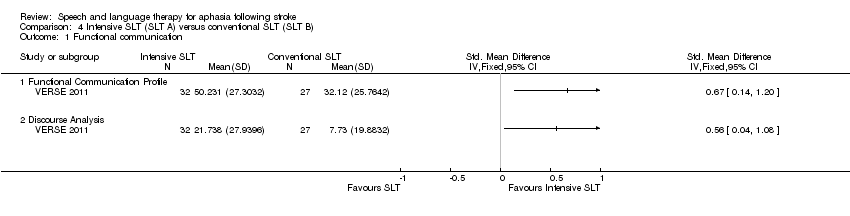
| VERSE 2011 | 59 | Intensive SLT: 14/18 Conventional SLT: 15/12 | Intensive SLT: 70.3 (12.8) Conventional SLT: 67.7 (15.4) | Intensive SLT:3.2 (2.2) days Conventional SLT: 3.4 (2.2) days | WABAQ median (IQR) Intensive SLT: 31.0 (47) Conventional SLT: 9.0 (34.1) |
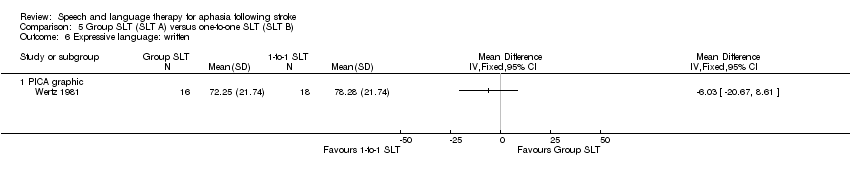
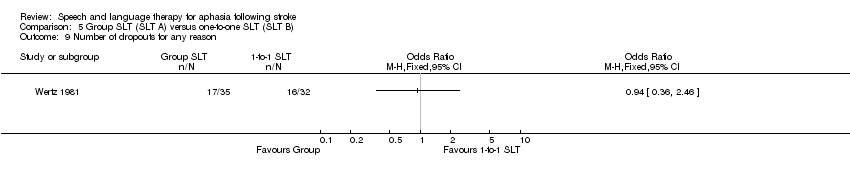
| Wertz 1981 | 67 | Not reported | (15 weeks after stroke)
Group SLT: 60.24 (range 40 to 79)
Conventional: 57.07 (range 41 to 79) | Group SLT: 4 weeks
Conventional: 4 weeks | (15 weeks after stroke)
PICA overall percentile
Group SLT: 45.21 (range 15 to 74)
Conventional: 45.62 (range 16 to 74) |
| Wertz 1986i | 78 | Conventional: unclear
No SLT: unclear | Conventional: 59.2 (6.7)
No SLT: 57.2 (6.8) | Conventional: 6.6 (4.8) weeks
No SLT: 7.8 (6.6) weeks | PICA overall percentile Conventional: 46.59 (16.05)
No SLT: 49.18 (19.46) |
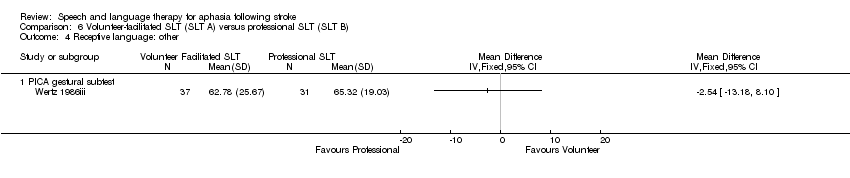
| Wertz 1986ii | 83 | Volunteer‐facilitated: 37/6
No SLT: unclear | Volunteer‐facilitated: 60.2 (6.7)
No SLT: 57.2 (6.8) | Volunteer‐facilitated: 7.1 (5.8) weeks
No SLT: 7.8 (6.6) weeks | PICA overall percentile
Volunteer‐facilitated: 49.97 (22.77)
No SLT: 49.18 (19.46) |
| Wertz 1986iii | 81 | Volunteer‐facilitated: 37/6
Conventional: unclear | Volunteer‐facilitated:60.2 (6.7)
Conventional: 59.2 (6.7) | Volunteer‐facilitated: 7.1 (5.8) weeks
Conventional: 6.6 (4.8) weeks | PICA overall percentile
Volunteer‐facilitated: 49.97 (22.77)
Conventional: 46.59 (16.05) |
| Wu 2004 | 236 | Conventional: unclear
No SLT: unclear
(Wu 2004: 159/ 77) | Conventional: (range 39 to 81)
No SLT: (range 40 to 78) | Not reported | Not reported |
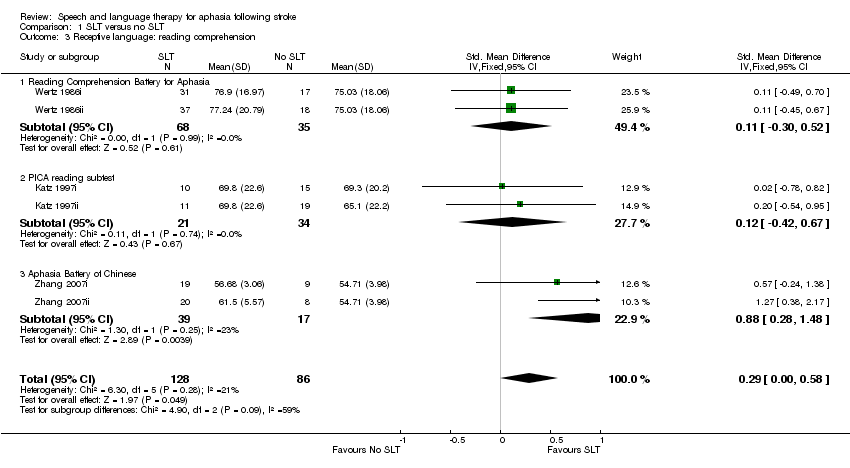
| Zhang 2007i | 36 | SLT: 10/9 No SLT: 11/6 | SLT: 63.40 (7.82) No SLT: 59.36 (7.69) | SLT: 29.45 (10.63) days No SLT: 27.80 (9.79) days | ABC AQ SLT: 48.70 (33.49) No SLT: 49.87 (26.83) |
| Zhang 2007ii | 37 | SLT: 11/9 No SLT: 11/6 | SLT: 60.80 (8.13) No SLT: 59.36 (7.69) | SLT: 28.10 (9.15) days No SLT: 27.80 (9.79) days | ABC AQ SLT: 48.43 (29.18) No SLT: 49.87 (26.83) |
| Zhao 2000 | 138 | Not reported | Not reported | Not reported | Not reported |