Orthophonie dans l'aphasie suite à un AVC
Résumé scientifique
Contexte
L'aphasie est un trouble du langage acquis suite à des lésions cérébrales touchant certaines ou l'ensemble des modalités du langage : l'expression et la compréhension orale, la lecture et l'écriture. Environ un tiers des personnes ayant subi un AVC présentent une aphasie.
Objectifs
Évaluer l'efficacité de l'orthophonie pour le traitement de l'aphasie suite à un AVC.
Stratégie de recherche documentaire
Nous avons effectué des recherches dans le registre des essais du groupe Cochrane sur les accidents vasculaires cérébraux (dernière recherche effectuée en juin 2011), MEDLINE (de 1966 à juillet 2011) et CINAHL (de 1982 à juillet 2011). Afin d'identifier d'autres essais publiés, non publiés et en cours, nous avons effectué des recherches manuelles dans le International Journal of Language and Communication Disorders (de 1969 à 2005) et les listes bibliographiques des articles pertinents. Nous avons également contacté les institutions académiques et d'autres chercheurs. Il n'y avait aucune restriction concernant la langue.
Critères de sélection
Des essais contrôlés randomisés (ECR) comparant l'orthophonie (intervention formelle visant à améliorer les capacités linguistiques et de communication, l'activité et la participation) à (1) l'absence de traitement orthophonique ; (2) une prise en charge sociale ou une stimulation (intervention assurant une prise en charge sociale et une stimulation de la communication, mais qui exclut toute intervention thérapeutique ciblée) ; et (3) une autre intervention orthophonique (différente en termes de durée, d'intensité, de fréquence, de méthodologie d'intervention ou d'approche théorique).
Recueil et analyse des données
Nous avons indépendamment extrait des données et évalué la qualité méthodologique des essais inclus. Nous avons contacté des investigateurs afin d'obtenir des données manquantes.
Résultats principaux
Nous avons inclus 39 ECR (51 comparaisons randomisées) impliquant 2 518 participants dans cette revue. Dix‐neuf comparaisons randomisées (1 414 participants) comparaient l'orthophonie à l'absence de traitement orthophonique dans lesquelles l'orthophonie présentait des effets bénéfiques significatifs au niveau de la communication fonctionnelle du patient (différence moyenne standardisée (DMS) 0,30, IC à 95 % 0,08 à 0,52, P = 0,008) et du langage réceptif et expressif. Sept comparaisons randomisées (432 participants) comparaient l'orthophonie à une prise en charge sociale et à une stimulation, mais n'ont identifié aucune preuve de différence au niveau de la communication fonctionnelle. Vingt‐cinq comparaisons randomisées (910 participants) comparaient deux approches à l'orthophonie. Il n'y avait aucune différence au niveau de la communication fonctionnelle. En général, les essais randomisaient un nombre réduit de participants parmi un éventail de caractéristiques (âge, période depuis l'AVC et profils de gravité), d'interventions et de résultats. Des données statistiques adéquates n'étaient pas disponibles pour plusieurs mesures.
Conclusions des auteurs
Notre revue fournit quelques preuves concernant l'efficacité de l'orthophonie chez les personnes aphasiques suite à un AVC au niveau de la communication fonctionnelle améliorée, du langage réceptif et expressif. Toutefois, la notification de certains essais était médiocre. Les effets bénéfiques potentiels d'un traitement orthophonique intensif par rapport à un traitement orthophonique standard étaient biaisés en raison d'un nombre de sorties d'études significativement supérieures dans le cas d'un traitement orthophonique intensif. Davantage de participants se sont également retirés de la prise en charge sociale par rapport à ceux soumis à des interventions orthophoniques. Les preuves étaient insuffisantes pour tirer des conclusions concernant l'efficacité d'une approche orthophonique spécifique par rapport à une autre.
PICOs
Résumé simplifié
Orthophonie dans l'aphasie suite à un AVC
L'aphasie (ou dysphasie) correspond à des troubles du langage survenant suite à un AVC. Environ un tiers des personnes ayant subi un AVC présentent une aphasie qui peut toucher un ou plusieurs aspects de la communication (parole, compréhension orale, lecture et écriture). Les orthophonistes évaluent, diagnostiquent et traitent l'aphasie à des stades divers et travaillent en étroite collaboration avec la personne aphasique et ses soignants. Il n'existe aucun traitement universellement accepté pouvant être prescrit à chaque personne aphasique. Nous avons identifié 39 essais impliquant 2 518 participants randomisés pouvant être inclus dans cette revue. Dans l'ensemble, cette revue contient des preuves issues d'essais randomisés suggérant que l'orthophonie peut avoir des effets bénéfiques, mais ces preuves étaient insuffisantes quant à la meilleure approche à adopter pour un traitement orthophonique.
Authors' conclusions
Background
Description of the condition
The term aphasia (less commonly referred to as dysphasia) is used to describe an acquired loss or impairment of the language system following brain damage (Benson 1996). Usually associated specifically with language problems arising following a stroke, it excludes other communication difficulties attributed to sensory loss, confusion, dementia or speech difficulties due to muscular weakness or dysfunction such as dysarthria. The most common cause of aphasia is a stroke (or cerebrovascular accident), mainly to the left hemisphere, where the language function of the brain is usually situated for right‐handed people. About one‐third of all people who experience a stroke develop aphasia (Engelter 2006; Laska 2001). The aphasic population is heterogeneous, with individual profiles of language impairment varying in terms of severity and degree of involvement across the modalities of language processing, including the expression and comprehension of speech, reading, writing and gesture (Code 2003; Parr 1997). Variation in the severity of expressive impairments, for example, may range from the individual experiencing occasional word‐finding difficulties to having no effective means of communication. The severity of aphasia can also change over time as one area of language difficulty may improve while others remain impaired. The impact and the consequential implications of having aphasia for the individuals themselves, their families and society highlight the importance of the effective management and rehabilitation of language difficulties caused by aphasia.
Description of the intervention
The primary aim of speech and language therapy (SLT*) in aphasia management and rehabilitation is to maximise individuals' ability to communicate. Speech and language therapists are typically responsible for the assessment, diagnosis and, where appropriate, rehabilitation of aphasia arising as a result of stroke. The ability to successfully communicate a message via spoken, written or non‐verbal modalities (or a combination of these) within day‐to‐day interactions is known as functional communication. Recent developments have seen speech and language therapists working closely with the person with aphasia, and in partnership with their families and carers, to maximise the individual's functional communication.
* For the purposes of clarity within this review we have reserved the abbreviation of SLT for speech and language therapy alone.
Why it is important to do this review
There is no universally accepted treatment that can be applied to every patient with aphasia and typically therapists select from a variety of methods to manage and facilitate rehabilitation including, for example, impairment‐based therapy and social participation approaches. We undertook this review update to incorporate new evidence, new systematic review methodologies and to reflect recent developments in clinical practice. A summary of the differences between this version and the original 1999 review is presented below.
Amendments to the original 1999 review
Following close inspection of the original review (Greener 1999) and detailed discussion among this review team, we made adjustments to the review, many of which reflect changes in Cochrane procedures, review methodologies, and style and structure in the time since the publication of the original review. These amendments were ratified by the Cochrane Stroke Group Editorial Board on 23 November 2006.
Background
We updated the Background section to include a definition of SLT and aphasia, and to reflect current approaches and rationale to SLT interventions and outcomes.
Objectives
We amended the Objectives to a single statement according to the standard format of Cochrane reviews; that is, to examine the effectiveness of SLT interventions for aphasia following stroke.
Types of studies
It was unclear whether or not quasi‐randomised controlled trials were included in the original review. We have excluded quasi‐randomised trials.
Types of interventions
We compressed the Types of interventions into three broad categories: SLT versus no SLT intervention, SLT versus social support or stimulation, and SLT intervention A versus SLT intervention B (where A and B refer to two different types of therapeutic interventions or approaches).
Types of outcome measures
We refined the Types of outcome measures to a single primary outcome measure of functional communication. Secondary outcomes include other measures of communication (receptive or expressive language, or both), psychosocial outcomes, patient satisfaction with the intervention, number of participant dropouts for any reason, non‐compliance with the allocated intervention, economic outcomes (such as cost to the patient, carers, families, health service and society) and carer or family satisfaction. Data relating to death, morbidity and cognitive skills were extracted in the original review but, on reflection, we did not consider these to be relevant indicators of the effectiveness of a SLT intervention and we therefore excluded them from this update. The original review reported overall functional status (e.g. Barthel Index) as one of a number of primary outcomes. As described above, we focused on a single primary outcome (in line with the current review methodology).
Data extraction tool
We could not obtain the original data extraction tool, therefore two of the review authors (HK and MB) created and piloted a new one before use.
Search methods for identification of studies
Re‐running the original search strategy for the MEDLINE and CINAHL databases raised over 12.6 million references. Therefore, Brenda Thomas, the Cochrane Stroke Group Trials Search Co‐ordinator, devised up‐to‐date search strategies. The International Journal of Language and Communication Disorders (previously named the British Journal of Disorders of Communication, the European Journal of Disorders of Communication and the International Journal of Disorders of Communication) was handsearched from 1969 to 2005. This journal has been indexed by MEDLINE since 2006 and was thus included in our electronic searches from this date.
Description of studies
The original 1999 review listed studies other than identified RCTs in the Characteristics of excluded studies table, including single case or case series studies. As there are a vast number of such studies, the updated table now only presents potentially relevant studies that appear to be randomised but which we excluded for other reasons (e.g. quasi‐randomised or where aphasia‐specific data could not be extracted).
Comparisons
Mid‐trial outcome scores were included in the original review. We have focused our reporting on post‐intervention and follow‐up scores. We have not included analysis of the number of participants who deteriorated on particular outcome measures.
Other amendments
As we were unable to obtain the extraction sheets for the trials included in the original review, we cross‐checked the data extracted for the original review with the available published and unpublished data. We made some amendments, including exclusion of some studies and categorising the methods of allocation concealment used in the included trials.
In this review update we took the decision to exclude quasi‐randomised studies and so one study, included in the original review, has been excluded from this review update (Hartman 1987).
After reviewing the data from another trial (Kinsey 1986), we decided that the reported comparison was not a therapy intervention as such, but rather a comparison of task performance (computer‐based or with a therapist). We thus excluded this trial from the review update.
The allocation concealment for one study (MacKay 1988) was considered 'inadequate' in the original review. We failed to get confirmation of the method of allocation from the authors and therefore we amended the allocation for this trial to 'unclear'.
The original review included a matched control group of no SLT intervention for one trial (Prins 1989). However, unlike the other groups in this trial, this group was not randomised, therefore we have excluded it from this update.
Another study (Shewan 1984) had been excluded from the original review on the grounds that it was not a RCT. Discussion with the trialists has since revealed that it was a RCT randomised controlled trial, and we have now included it in the review.
The original 1999 review included outcomes relating to the impact of SLT on the emotional well‐being of family members (Lincoln 1984a). We do not feel that such outcomes directly relate to the aims of this review and so we have not included these measures.
Information added to the 1999 review
Following an extensive search up to April 2009, we identified an additional 20 trials as suitable for inclusion in the review. The 2010 review included data from 30 trials involving 1840 randomised participants (Kelly 2010).
Information added to the 2010 review
Following an extensive search from inception of the electronic databases up to July 2011 we identified an additional nine trials eligible for inclusion in the review. This 2011 review update now includes data from 39 trials involving 2518 randomised participants.
Objectives
To examine the effectiveness of SLT for aphasia after stroke and in particular if:
-
SLT is more effective than no SLT;
-
SLT is more effective than social support and stimulation;
-
one SLT intervention (SLT A) is more effective than another SLT intervention (SLT B).
SLT intervention A or B refers to variations in intervention that differ in duration, intensity, frequency, method or in the theoretical basis of the approach to the intervention (e.g. cognitive neurological‐ versus psychosocial‐based interventions).
Methods
Criteria for considering studies for this review
Types of studies
RCTs that evaluated (one or more) interventions designed to improve language or communication. We included trials that recruited participants with mixed aetiologies or impairments provided it was possible to extract the data specific to individuals with post‐stroke aphasia. We did not employ any language restriction.
Types of participants
Adults who had acquired aphasia as a result of a stroke.
Types of interventions
We compressed the groupings presented in the original review into three broad groups for this review update. We have included trials that reported a comparison between a group that received a SLT intervention designed to have an impact on communication and a group that received:
-
no SLT intervention; or
-
social support and stimulation; or
-
an alternative SLT intervention.
SLT
We considered SLT interventions to be any form of targeted practice tasks or methodologies with the aim of improving language or communication abilities. These are typically delivered by speech and language therapists. In the UK, 'speech and language therapist' is a protected professional title and refers to individuals holding a professional qualification recognised by the Royal College of Speech and Language Therapists and registered with the Health Professions Council, UK. For the purposes of this review we have extended this definition to include therapists belonging to a body of similar professional standing elsewhere in the world.
We are aware that the SLT profession does not exist in many countries and so in trials conducted in such settings where other clinical staff (e.g. medical or nursing staff) led targeted interventions that aimed to improve participants' communicative functioning we have included these interventions within this review as SLT interventions. We planned a sensitivity analysis of the impact of professional SLT training on the provision of an intervention where data allowed.
We also recognise that current rehabilitation practice may include SLT interventions that aim to improve communicative functioning but are delivered by non‐therapists (family members, SLT assistants, SLT students, voluntary support groups). Where those delivering the intervention have received training from a speech and language therapist and deliver an intervention designed by a speech and language therapist, we have described these as volunteer‐facilitated SLT interventions.
Social support and stimulation
Social support and stimulation refers to an intervention that provides social support or stimulation but does not include targeted therapeutic interventions that aim to resolve participants' expressive or receptive speech and language impairments. Interventions in this category might include, for example, emotional, psychological or creative interventions (such as art, dance or music) as delivered by other healthcare professionals (e.g. art, physical or music therapists). Other social stimulation interventions, such as conversation or other informal, unstructured communicative interactions are also included in this category.
We did not include pharmacological interventions for aphasia as they are addressed within a separate review (Greener 2001). In this 2011 review update we also took a decision to exclude magnetic or electrical stimulation interventions (e.g. transcranial direct current stimulation (tDCS), transcranial magnetic stimulation or epidural cortical stimulation) as we considered these to be an adjunct to SLT rather than an SLT approach. The effectiveness of tDCS interventions for aphasia will soon be addressed within a separate review (Elsner 2012).
Types of outcome measures
Primary outcomes
The primary outcome chosen to indicate the effectiveness of an intervention that aims to improve communicative ability must reflect the ability to communicate in real world settings, that is functional communication. Providing a definition for the concept of functional communication is problematic and makes evaluation difficult. The ability to functionally communicate relates to language or communicational skills sufficient to permit the transmission of a message via spoken, written or non‐verbal modalities, or a combination of these channels. Success is typically and naturalistically demonstrated through successful communication of the message ‐ the speaker communicates their message and the listener understands the message communicated. Attempts to measure this communication success formally vary from analysis of discourse interaction in real life to sampling of specific discourse tasks. Other more formal tools might include the Communicative Abilities of Daily Living (CADL) (Holland 1980) or the Communicative Effectiveness Index (CETI) (Lomas 1989).
Secondary outcomes
Given the lack of a comprehensive, reliable, valid and globally accepted functional communication evaluation tool, surrogate outcome measures of communication ability include formal measures of receptive language (oral, written and gestural), expressive language (oral, written and gestural) or overall level of severity of aphasia where receptive and expressive language are measured using language batteries. Such tools might include, for example, the Western Aphasia Battery (WAB) (Kertesz 1982) or the Porch Index of Communicative Abilities (PICA) (Porch 1967). Other secondary outcomes of relevance to this review include psychosocial impact (i.e. impact on psychological or social well‐being including depression, anxiety and distress), patient satisfaction with intervention, number of dropouts (i.e. the number of participants dropping out at treatment or follow‐up phases for any reason), compliance with allocated intervention (i.e. the number of participants voluntarily withdrawing from their allocated intervention), economic outcomes (such as costs to the patient, carers, families, health service and society), and carer and family satisfaction. Measures of overall functional status (e.g. Barthel) were extracted in the original review as one of a number of primary outcomes. We also extracted these data, where available, as an indicator of overall severity of stroke but this information is now presented as a patient descriptor within the Characteristics of included studies table. A full list of outcome measures included in the review and their references can be found in Appendix 1.
Search methods for identification of studies
See the 'Specialized register' section in the Cochrane Stroke Group module. We did not impose any language restrictions.
Electronic searches
We searched the Cochrane Stroke Group Trials Register, which was last searched by the Managing Editor on 6th June 2011. In addition, we searched MEDLINE (1966 to July 2011) (Appendix 2) and CINAHL (1982 to July 2011) (Appendix 3) using comprehensive search strategies. For the original version of the review searches of MEDLINE (1966 to 1998) and CINAHL (1982 to 1998) were carried out using simple combinations of text words describing aphasia and SLT. We also searched major trials registers for ongoing trials including ClinicalTrials.gov (http://www.clinicaltrials.gov/), the Stroke Trials Registry (www.strokecenter.org/trials/) and Current Controlled Trials (www.controlled‐trials.com).
Searching other resources
-
We handsearched the International Journal of Language and Communication Disorders (formerly the International Journal of Disorders of Communication, the European Journal of Disorders of Communication and the British Journal of Disorders of Communication) from 1969 to December 2005. Since 2006 this journal has been indexed in MEDLINE so our comprehensive electronic search identified any relevant trials published in the journal after that date.
-
We checked reference lists of all relevant articles to identify other potentially relevant randomised studies.
-
We contacted all British universities and colleges where SLTs are trained and all relevant 'Special Interest Groups' in the UK to enquire about any relevant published, unpublished or ongoing studies.
-
We approached colleagues and authors of relevant randomised trials to identify additional studies of relevance to this review.
Data collection and analysis
Selection of studies
Our selection criteria for inclusion in this review were:
-
the study participants included people with aphasia as a result of stroke;
-
the SLT intervention was designed to have an impact on communication; and
-
the methodological design was a randomised controlled trial.
One review author (MB) screened titles and abstracts of the records identified through the electronic searches described above and excluded obviously irrelevant studies. We obtained hard copies of all the remaining studies that fulfilled the listed inclusion criteria. Two review authors (MB and HK or PE) independently assessed the studies based on the inclusion criteria and decided whether to include or exclude studies. We resolved any disagreements through discussion. Studies judged ineligible for inclusion, together with reasons for their exclusion, are listed in the Characteristics of excluded studies table.
Data extraction and management
The data extraction form used in the original review was unavailable so we created and piloted another for use in this review update. Two review authors (MB and HK) independently confirmed the data for the trials as included in the original review and extracted the data for the additional trials included in the updates. We resolved any disagreements through discussion. We extracted the following data: number of sites, methods of randomisation, blinding, attrition from intervention, co‐interventions, confounder details, number of participants, age, education, handedness, gender, native language, severity of aphasia, time post‐onset, frequency and duration of therapy, details of intervention, outcome measures used and time points, evidence of an a priori sample size calculation, intention‐to‐treat (ITT) analysis and summary data. We attempted to contact investigators for any missing data (or data in a suitable format) for inclusion in the review.
Where we identified a cross‐over trial, we based decisions relating to the suitability of the data (either up to or beyond the cross‐over phase) on careful consideration in relation to a range of factors including the intervention(s) used, the timing of the intervention(s), the impact of any treatment carry over and whether data from relevant paired comparisons within the trial were available. Whenever possible, in such cases we sought individual patient data.
Assessment of risk of bias in included studies
We assessed the trials for methodological quality, paying attention to whether there was protection from the following types of bias: selection bias (i.e. true random sequencing and true concealment up to the time of allocation), performance bias (i.e. differences in other types of treatment (co‐interventions) between the groups, attrition bias (i.e. withdrawal after trial entry) and detection bias (i.e. 'unmasked' assessment of outcome). We coded concealed allocation as 'low risk', 'unclear' or 'high risk' according to the Cochrane Handbook for Systematic Reviews of Interventions (Higgins 2011). In addition, we extracted information on whether power calculations and ITT analyses were employed. In some cases, for example where all participants were accounted for in the final results, this was not applicable.
Measures of treatment effect
We conducted the review using RevMan 5.1 (RevMan 2011) for statistical analysis. We have recorded descriptive information for each trial (characteristics of participants, interventions and outcomes) in the Characteristics of included studies table and issues relating to the methodological quality of the trial in the 'Risk of bias' tables. Where trials made a similar comparison and were judged sufficiently similar in respect of their descriptive information, we pooled the summary data (where available) using meta‐analysis. We expressed continuous data as differences in means or standardised difference in means and dichotomised data as odds ratios (OR). We used 95% confidence intervals (CI) throughout the review.
The results of the trials in this review reported measures based on differences in final value scores (scores taken at the end of the intervention) and change‐from‐baseline scores (also known as change scores). Although the mean differences (MD) based on change‐from‐baseline scores in randomised trials can generally be assumed to address the same intervention effects as MD analysis based on final value scores, change‐from‐baseline scores are given higher weights in analysis than final value scores (Higgins 2011). For this reason, we have used final value scores within the meta‐analyses wherever possible. We do not report change‐from‐baseline scores unless they were the only available values used to report trial results (Higgins 2011).
Assessment of heterogeneity
We assessed heterogeneity using the I2 statistic where any heterogeneity observed may be considered moderate (an I2 value of 30% to 60%), substantial (50% to 90%) or considerable (75% to 100%) (Higgins 2011). Where we observed important heterogeneity (based of the I2 value together with significant evidence of heterogeneity as per the Chi2 test P value) we used a random‐effects model (Higgins 2011).
Data synthesis
Where a single outcome measure was assessed and reported across trials using different measurement tools, we presented these data in a meta‐analysis using a SMD summary statistic. In cases where the direction of measurement differed it was necessary to adjust the direction of some measures to ensure that all the scales operated in the same direction. For example, measures of comprehension ability generally increase with increasing ability, but in some cases (e.g. the Token Test) improving comprehension skills might be reflected by decreasing scores and so it was necessary to multiply the mean values by ‐1 to ensure that all the scales operated in the same direction. Standard deviation (SD) values were unaffected and we have presented these within the meta‐analysis without the need for a directional change.
In cases where only partial summary data were reported, for example mean final value scores were available but SDs were unavailable (Wertz 1981), we attempted to calculate these values from available information. When this was not possible we imputed the SD to facilitate inclusion of the trial within the review by using a SD value from a similar participant group (Higgins 2011). We have reported details of where the imputed SD values have come from within the text. Where there was a choice of possible SD values, we took the approach of imputing the highest and lowest values to ensure that both methods provided a similar overall conclusion and then used the highest value in the presentation of the trial within the forest plot.
Where results in a particular comparison were only available in a mixture of final value and change‐from‐baseline scores, we presented these data graphically using SMDs but we were unable to pool these results in a meta‐analysis.
Subgroup analysis and investigation of heterogeneity
We did not plan any subgroup analyses.
Sensitivity analysis
The original review did not include any planned sensitivity analyses. However, in this updated review we aimed to reflect developments in clinical practice including trials where SLT interventions were delivered or facilitated by non‐speech and language therapists. We planned to conduct sensitivity analyses to evaluate any impact the inclusion of these groups of trials may have had on the results of the review and the impact of trial quality.
Results
Description of studies
The original 1999 review included 12 trials. We revisited the decision taken in the original review to include Kinsey 1986 and Hartman 1987. We have excluded quasi‐randomised trials such as Hartman 1987 from this review update, while Kinsey 1986 reports a comparison of methods of providing therapy materials rather than a comparison of therapy interventions. Thus of the original 12 trials included in the 1999 review, 10 trials remained in the 2010 review update. We identified an additional 20 trials in the update search and we revised the decision to exclude one other trial (Shewan 1984) from the original review following communication with the trialists who confirmed that it was a RCTl. This review is based on data from a total of 39 included trials.
Results of the search
Our search strategy identified 1961 records within CINAHL database (1982 to July 2011) and 4450 records within the MEDLINE database (1966 to July 2011). Following our 2011 search we identified 15 ongoing studies (CACTUS; Crosson 2007; FUATAC; Godecke 2011; IHCOP; IMITATE; Kukkonen 2007; Maher 2008; MIT Netherlands 1; MIT Netherlands 2; MIT USA; RATS‐3; Raymer; SP‐I‐RiT; Varley 2005); these are likely to be eligible for inclusion in the review at a later date. These studies are detailed in the Characteristics of ongoing studies table. In total we identified nine new trials for inclusion in this review update.
Included studies
We have included a total of 39 trials (which randomised 2518 participants) in this review. Of these, 30 were included in the 2010 review, four trials listed as ongoing in 2010 have since reported and there are five newly identified trials. Six trials randomised individuals across three or more groups (trial arms) but for the purposes of this review and the meta‐analyses we have presented and pooled the data within paired comparisons indicated as i, ii or iii. For example, data from Yao 2005 are presented across three 'trials' of (1) group SLT versus no SLT (Yao 2005i), (2) individual SLT versus no SLT (Yao 2005ii) and (3) group SLT versus individual SLT (Yao 2005iii). Other trials affected were Katz 1997i, Katz 1997ii, Lincoln 1982i, Lincoln 1982ii, Lincoln 1982iii, Shewan 1984i, Shewan 1984ii, Shewan 1984iii, Smith 1981i, Smith 1981ii, Smith 1981iii, Wertz 1986i, Wertz 1986ii, Wertz 1986iii,Zhang 2007i, and Zhang 2007ii. Further details can be found in the Characteristics of included studies. In these trials there was a risk of including the same group of participants (usually the control group) twice in a single meta‐analysis and so we split the number of participants in the control group across the two 'trials' that shared that comparison group (Higgins 2011). In the case of continuous data the mean and SD values remained the same. In the case of dichotomous data both the number of events and total number of patients were split across the relevant number of arms. In keeping with previous reviews where this method has been used and for ease of reading, these paired randomised comparisons will be referred to as trials from this point onwards.
Nine trials employed a cross‐over design (Crerar 1996; Elman 1999; Lincoln 1982i; Lincoln 1982ii; Lincoln 1982iii; Lincoln 1984b; Wertz 1986i; Wertz 1986ii; Wertz 1986iii). We carefully considered the suitability of each cross‐over trial for inclusion within the review. We considered factors including the suitability of the design, the intervention(s) used, the timing of the intervention(s), the impact of any treatment carry over and finally whether data from relevant paired comparisons from the cross‐over data were available. For six trials we only extracted data up to the point of cross‐over (Crerar 1996; Elman 1999; Lincoln 1982iii; Lincoln 1984b; Wertz 1986i; Wertz 1986ii). In some cases though, the treatment that participants were allocated to receive following cross‐over was 'no SLT'. In these cases, the 'no SLT' input after cross‐over could be used as a follow‐up period.
In contrast, Lincoln 1982 was also a cross‐over trial in design with participants randomly allocated to one of four groups with a sequence of interventions that included one active treatment or placebo either preceded by or followed by conventional SLT. We were able to access the unpublished individual patient data for this review. This access to the data, the design, nature and manner of SLT delivery within the trial and the clinical relevance of the comparisons made it possible to include two paired comparisons of those groups within the review:
-
SLT + operant training versus SLT + social support (Lincoln 1982i);
-
operant training + SLT versus social support + SLT (Lincoln 1982ii).
In addition, by taking the individual data at the point of measurement prior to the cross‐over it was also possible to extract and compare the data from those that had received conventional SLT and compare it to those participants that received a social support and stimulation intervention (Lincoln 1982iii).
We have presented data from 51 randomised comparisons as they relate to the effectiveness of SLT for aphasia following stroke, which compare: (1) SLT versus no SLT, (2) SLT versus social support and stimulation and (3) SLT A versus SLT B. We have presented details of data within each comparison below with further details on each trial available in the Characteristics of included studies table. Further participant details can be found in Table 1, an overview of the SLT interventions can be found in Appendix 4, while details of the assessment tools used can be found in Appendix 1. A summary of all the findings of the results is available at the end of the results section.
| Study ID | Number | Male/female | Age in years mean (standard deviation) | Post‐onset mean (standard deviation) (range) | Aphasia severity mean (standard deviation) |
| 153 | SLT: 40/36 Social support: 42/35 | SLT: 71 (range 32 to 97) Social support: 70 (range 40 to 92) | Admission to randomisation median 12 (interquartile range 9 to 16) days | TOMs SLT: 1.9 (1.2) (severe n = 47) Social support: 1.9 (1.1) (severe n = 51) | |
| 97 | Intensive: 26/25 | Intensive: 71.2 (14.9) (range 26 to 92) | Intensive: 34.2 (19.1) days | WABAQ | |
| 8 | Verb SLT: 2/1 Preposition SLT: 5/0 | Verb SLT: 50.3 (8.5) (range 44 to 60) Preposition SLT: 48.8 (13.77) (range 27 to 64) | Verb SLT: 87.33 (40.61) (range 60 to 134) months Preposition SLT: 66.4 (20.96) (range 39 to 86) | WABAQ Verb SLT: 76.2 (9.81) Preposition SLT: 69.3 (16.58) | |
| 133 (of 155 randomised) | Conventional: 35/30 | Conventional: 70 (8.7) | Conventional: median 4 (range 4 to 266) weeks | Baseline FCP scores for n = 98 retained until post‐therapy test Conventional: 42.4 (20.8) | |
| 17 | Intensive: 5/3 | Intensive: 58.1 (11.8) | Intensive: 3.2 (1.8) months | AAT | |
| 14 | Programmed instruction: 7/0 | Programmed instruction: 57.6 (9.2) (range 44 to 69) | Programmed instruction: 24.7 (23.6) (range 0 to 66) months | Programmed instruction: severe | |
| 18 (of 19 randomised) | Computer‐mediated: 4/4 | Computer‐mediated: 62 (9.0) | Computer‐mediated: 13 (range 11 to 16) months | Computer‐mediated: ANELT‐ A 34 (9); BNT 63 (37) | |
| 8 | Not reported | Gesture cue: 52.9 (6.0) | Gesture cue: 15.3 (4.1) (range 10 to 20) months | Not reported | |
| 24 | Conventional: 7/5 | Conventional: 58.3 (11.4) (range 38 to 79) | Conventional: 32.5 (28.7) (range 7 to 103) months | Conventional: SPICA 7 mild to moderate, 7 moderate to severe | |
| 12 | Functional SLT: 5/1 | Functional: 51.6 (15) | Functional: 26.8 (20.1) (range 6 to 58) months | BDAE Severity Rating | |
| 60 | Group SLT: unclear | Group SLT: unclear | Not reported | Not reported | |
| 54 | Group SLT: unclear | Group SLT: unclear | Not reported | Not reported | |
| 54 | Group SLT: unclear | Group SLT: unclear | Not reported | Not reported | |
| 42 (reported data on 36) | Computer‐mediated: unclear | Computer‐mediated: 61.6 (10) | Computer‐mediated: 6.2 (5.2) years | PICA overall percentile; WABAQ Computer‐mediated: 57.3 (17.9); 68.9 (24.3). | |
| 40 (of 42 randomised) | Computer‐mediated: unclear | Computer‐mediated: 61.6 (10) | Computer‐mediated: 6.2 (5.2) years | PICA overall percentile; WABAQ Computer‐mediated: 57.3 (17.9); 68.9 (24.3) | |
| 123 | SLT: 33/29 No SLT: 23/38 | SLT: 76 (range 38 to 94) No SLT: 79 (range 39 to 94) | SLT: 3 (25th‐75th; 2 to 4) days No SLT: 3 (25th‐75th; 2 to 4) days | ANELT‐A median (25th to 75th) SLT: 1 (0 to 1.4) No SLT: 1 (0 to 1.4) | |
| 94 | Conventional: 38/21 Volunteer‐facilitated: 22/13 | Conventional: 56 (17) | Within first month after stroke | Conventional: moderate‐severe | |
| 12 | SLT/operant train: 3/3 | SLT/operant train: 54.33 (6.68) (range 45 to 63) SLT/social support: 51.33 (7.97) (range 39 to 63) | SLT/operant train: 3.17 (1.60) (range 1 to 5) months | SLT/operant train: moderate | |
| 12 | Operant train/SLT: 5/1 | Operant train/SLT: 57.67 (5.72) (range 51 to 64) | Operant train/SLT: 2.33 (1.55) (range 1 to 5) months | Operant train/SLT: moderate | |
| 18 | Conventional SLT: 7/5 | Conventional SLT:52.83 (7.18) (range 39 to 63) | Conventional SLT: 4.17 (2.76) (range 1 to 10) months | Conventional SLT: moderate | |
| (data for 58% of randomised participants) | 191 | Conventional: unclear | Conventional: unclear | Conventional: 10 weeks | Not reported |
| 12 | Operant train: 4/2 Placebo: 5/1 | Operant train: 52.33 (11.50) (range 32 to 64) | Operant train: 5.5 (4.89) (range 1 to 12) months | Operant train: severe | |
| 36 | SLT: 9/10 No SLT: 10/7 | SLT: 7 = 40 to 65 years; 12 = 65 to 80 years No SLT: 8 = 40 to 65 years; 9 = 65 to 80 years | SLT: 8 = 7 to 20 days; 11 = 20 to 45 days No SLT: 7 = 7 to 20 days; 10 = 20 to 45 days | BDAE SLT: 60.48 (11.83) No SLT: 58.22 (5.06) | |
| 30 | Functional: unclear | Functional: unclear | Functional: unclear | Functional: unclear | |
| 95 | MacKay 1988: 46/49 | MacKay 1988: median 75 | MacKay 1988: mean 30 months | Not reported | |
| 31 | Volunteer‐facilitated: 12/3 | Volunteer‐facilitated: 67.2 (8.6) | Volunteer‐facilitated: 30.9 (29.5) (range 4 to 115) weeks | PICA percentile volunteer‐facilitated: 53.9 (23.5) | |
| 20 | Constraint‐induced: 7/3 Volunteer‐facilitated: 9/1 | Constraint‐induced: 50.2 (10.13) | Constraint‐induced: 30.7 (18.9) (range 6 to 72) months | AAT profile score | |
| 13 | Intensive SLT: 6 | Intensive SLT: 61.4 (9.72) (range 48.44 to 74.5) | Intensive SLT: 36.2 (28.2) (range 8.6 to 69.8) months | WABAQ Intensive SLT: 51.1 (17.8) (range 28.0 to 69.4) | |
| 25 | Computer: 8/3 Therapist: 8/6 | Computer: 56.6 (9.2) (range 41.7 to 68) Therapist: 61.1 (14.8) (range 35.2 to 81.7) | Computer: 66.7 (71.5) (range 13.8 to 253.2) months Therapist: 41.3 (45.7) (range 12.2 to 166) months | WABAQ Computer: 62.0 (19.9) Therapist: 47.3 (27.9) | |
| 21 | STACDAP: 5/5 | STACDAP: 70.3 (range 58 to 83) | STACDAP: 15.2 (range 3 to 35) months | STACDAP: FE‐scale 2.6 (0 to 6), oral comp (BDAE and Token Test) 26.4 (0 to 46) | |
| 17 | Constraint‐induced: 6/4 | Constraint‐induced: 55.4 (10.9) | Constraint‐induced: 98.2 (74.2) months | Constraint‐induced: 2 mild, 5 moderate, 3 severe | |
| 58 | Semantic: 18/11 | Semantic: 66 (10) | Semantic: mean 4 (range 3 to 5) months | ANELT‐A score | |
| 80 | Cognitive linguistic: 14/24 Communicative: 24/18 | Cognitive linguistic: 68 (13) Communicative: 67 (15) | Cognitive linguistic: 22 (range 11 to 37) days Communicative: 23 (9 to 49) days | ANELT‐A score Cognitive linguistic: 21.4 (11.0) Communicative: 21.0 (11.1) | |
| 5 | Sentence mapping: 0/3 | Sentence mapping: range 31 to 74 | Sentence mapping: range 2 to 9 years | Sentence mapping: BDAE 1 to 2, phrase length 2.5 to 4 | |
| 52 | Language‐orientated: 18/10 | Language‐orientated: 62.18 (range 29 to 82) | Language‐orientated: range 2 to 4 weeks | Language‐orientated: 9 mild, 6 moderate, 13 severe | |
| 53 | Language‐orientated: 18/10 | Language‐orientated: 62.18 (range 29 to 82) | Language‐orientated: range 2 to 4 weeks | Language‐orientated: 9 mild, 6 moderate, 13 severe | |
| 49 | Conventional: 14/10 | Conventional: 65.63 (range 48 to 85) | Conventional: range 2 to 4 weeks | Conventional: 8 mild, 3 moderate, 13 severe | |
| 33 (of 41 randomised) | Conventional: 11/4 | Conventional: 65.73 (8.78) (range 48 to 77) | Conventional: 17.4 (24.07) (range 2 to 36) months | Aphasia severity: unclear | |
| 33 | Intensive: 12/4 | Intensive: 62 | Not reported | MTDDA (mean error score percentage) | |
| 31 | Conventional: 10/4 | Conventional: 63 | Not reported | MTDDA (mean error score percentage) | |
| 30 | Intensive: 12/4 | Intensive: 62 | Not reported | MTDDA (mean error score percentage) | |
| 10 | Task‐specific: 0/5 | Task‐specific: 61.8 (17.05) (range 40 to 77) | Task‐specific: 21 (22.4) (range 5 to 60) months | FE‐scale and M‐S Comprehension Test | |
| 59 | Intensive SLT: 14/18 Conventional SLT: 15/12 | Intensive SLT: 70.3 (12.8) Conventional SLT: 67.7 (15.4) | Intensive SLT:3.2 (2.2) days Conventional SLT: 3.4 (2.2) days | WABAQ median (IQR) Intensive SLT: 31.0 (47) Conventional SLT: 9.0 (34.1) | |
| 67 | Not reported | (15 weeks after stroke) | Group SLT: 4 weeks | (15 weeks after stroke) | |
| 78 | Conventional: unclear | Conventional: 59.2 (6.7) | Conventional: 6.6 (4.8) weeks | PICA overall percentile Conventional: 46.59 (16.05) | |
| 83 | Volunteer‐facilitated: 37/6 | Volunteer‐facilitated: 60.2 (6.7) | Volunteer‐facilitated: 7.1 (5.8) weeks | PICA overall percentile | |
| 81 | Volunteer‐facilitated: 37/6 | Volunteer‐facilitated:60.2 (6.7) | Volunteer‐facilitated: 7.1 (5.8) weeks | PICA overall percentile | |
| 236 | Conventional: unclear | Conventional: (range 39 to 81) | Not reported | Not reported | |
| 36 | SLT: 10/9 No SLT: 11/6 | SLT: 63.40 (7.82) No SLT: 59.36 (7.69) | SLT: 29.45 (10.63) days No SLT: 27.80 (9.79) days | ABC AQ SLT: 48.70 (33.49) No SLT: 49.87 (26.83) | |
| 37 | SLT: 11/9 No SLT: 11/6 | SLT: 60.80 (8.13) No SLT: 59.36 (7.69) | SLT: 28.10 (9.15) days No SLT: 27.80 (9.79) days | ABC AQ SLT: 48.43 (29.18) No SLT: 49.87 (26.83) | |
| 138 | Not reported | Not reported | Not reported | Not reported |
AAT: Aachen Aphasia Test
ABC: Aphasia Battery of Chinese
ANELT: Amsterdam‐Nijmegen Everyday Language Test
AQ: Aphasia Quotient
BDAE: Boston Diagnostic Aphasia Examination
BNT: Boston Naming Test
FCP: Functional Communication Profile
FE‐scale: Functional‐Expression scale
IQR: interquartile range
MTDDA: Minnesota Test for the Differential Diagnosis of Aphasia
M‐S Comprehension Test: Morpho‐Syntactic Comprehension Test
PICA: Porch Index of Communicative Abilities
SLT: Speech and Language therapy/therapist
SPICA: Shortened Porch Index of Communicative Abilities
STACDAP: Systematic Therapy for Auditory Comprehension Disorders in Aphasic Patients
TOMs: Therapy Outcome Measures
WAB: Western Aphasia Battery
WABAQ: Western Aphasia Battery Aphasia Quotient
1. SLT versus no SLT
We included 19 randomised comparisons in this section (Doesborgh 2004; Katz 1997i; Katz 1997ii; Laska 2011; Lincoln 1984a; Liu 2006; Lyon 1997; MacKay 1988; Smania 2006; Smith 1981i; Smith 1981ii; Wertz 1986i; Wertz 1986ii; Wu 2004; Yao 2005i; Yao 2005ii; Zhang 2007i; Zhang 2007ii; Zhao 2000) involving 1414 randomised participants. The SLT intervention was typically delivered by a speech and language therapist. In two trials therapy was facilitated by a therapist‐trained volunteer (MacKay 1988; Wertz 1986ii). In trials conducted in China the therapy intervention was delivered by a doctor or nurse in four trials (Wu 2004; Yao 2005i; Yao 2005ii; Zhao 2000), other therapists in the rehabilitation setting (Zhang 2007i; Zhang 2007ii) and it was unclear who facilitated the SLT intervention in one further comparison (Liu 2006). Two additional trials (Prins 1989; Shewan 1984) compared groups that did and did not receive SLT but the participants were not randomly assigned to these 'no SLT' groups and they were thus excluded from this review.
The trials in this section employed a range of SLT interventions, namely conventional SLT (Lincoln 1984a; Liu 2006; Smania 2006; Smith 1981ii; Wertz 1986i; Wu 2004; Yao 2005ii; Zhang 2007i; Zhang 2007ii), intensive SLT (Laska 2011; Smith 1981i), group SLT (Yao 2005i), volunteer‐facilitated (MacKay 1988; Wertz 1986ii), computer‐mediated SLT (Doesborgh 2004; Katz 1997i; Katz 1997ii) and functionally‐based SLT involving a communicative partner (Lyon 1997). Laska 2011 also further described their SLT intervention as early language enrichment therapy, delivered two to four days after stroke. An acupuncture co‐intervention was delivered alongside the SLT intervention in two comparisons (Liu 2006; Zhang 2007ii).
Most participants randomised to the 'no SLT' groups received no alternative treatment or support (Doesborgh 2004; Katz 1997i; Laska 2011; Lincoln 1984a; Liu 2006; Lyon 1997; MacKay 1988; Wertz 1986i; Wertz 1986ii; Wu 2004; Yao 2005i; Yao 2005ii). Only seven trials described an intervention within these 'no SLT' groups. In six cases we considered the control interventions to be similar to standard post‐stroke care in the local region ‐ participants were visited at home by a health visitor (Smith 1981i; Smith 1981ii), received limb apraxia therapy (Smania 2006) or medication (Zhang 2007i; Zhang 2007ii; Zhao 2000). In addition, one control group received computer‐based cognitive tasks ('arcade‐style games') (Katz 1997ii) that had been specifically designed not to target language rehabilitation. In all seven cases we included these groups as 'no SLT' control groups in the review.
SLT interventions were delivered across a wide range of times after the onset of aphasia with timings difficult to summarise because of a lack of detailed reporting. Some trialists recruited participants in the early stages after the onset of stroke ‐ within four days (Laska 2011), up to 45 days (Liu 2006), 10 weeks (Lincoln 1984a), three months (Zhang 2007i; Zhang 2007ii) or six months (Wertz 1986i; Wertz 1986ii) after the stroke. Other trials recruited participants longer after stroke, for example between two months and three years after stroke (Smania 2006). Other participants were recruited one year or more after their stroke ‐ up to 17 months (Doesborgh 2004); two years (MacKay 1988) (61% of participants); 10 years (range 13 to 124 months) (Lyon 1997); 19 years (Katz 1997i) or up to 22 years (Katz 1997ii) after the onset of aphasia. Six trials failed to report the timing of the SLT intervention in relation to the onset of participants' aphasia (Smith 1981i; Smith 1981ii; Wu 2004; Yao 2005i; Yao 2005ii; Zhao 2000).
The frequency of SLT was reported as number of times daily or hours per day or per week. SLT was provided daily (duration unclear) within two trials (Yao 2005i; Yao 2005ii). SLT was provided weekly for up to two hours (Doesborgh 2004; Lincoln 1984a; Smith 1981ii), three hours (Katz 1997i; Katz 1997ii; Smania 2006), four hours (Laska 2011; Smith 1981i), six hours (MacKay 1988), eight hours (Lyon 1997) or 10 hours (Wertz 1986i; Wertz 1986ii). An additional five comparisons did not report the frequency of the SLT intervention (Liu 2006; Wu 2004; Zhang 2007i; Zhang 2007ii; Zhao 2000). Where specified, the duration of the SLT intervention varied from three weeks (Laska 2011); two months (Zhao 2000); up to three months (Doesborgh 2004; Smania 2006; Wertz 1986i; Wertz 1986ii; Yao 2005i; Yao 2005ii); between five and six months (Katz 1997i; Katz 1997ii; Lincoln 1984a; Lyon 1997; Wu 2004) or for up to one year (MacKay 1988; Smith 1981i; Smith 1981ii).
The 19 randomised comparisons in this section used a wide range of outcome measures including functional communication, receptive language, expressive language, severity of impairment, psychosocial impact and economic outcomes. One of the 14 trials did not report any outcome measures (Wu 2004). Seven trials carried out follow‐up assessments at two months (Smania 2006), three months (Wertz 1986i; Wertz 1986ii; Yao 2005i; Yao 2005ii), six months (Laska 2011; MacKay 1988) and 12 months (MacKay 1988) after SLT.
2. SLT versus social support and stimulation
We included seven trials in this section (ACTNoW 2011; David 1982; Elman 1999; Lincoln 1982iii; Rochon 2005; Shewan 1984ii; Shewan 1984iii) with 432 randomised participants. A range of SLT approaches were reported including conventional SLT (ACTNoW 2011; David 1982; Lincoln 1982iii; Shewan 1984iii), group SLT (Elman 1999), language‐oriented SLT (Shewan 1984ii) and sentence mapping SLT (Rochon 2005). The social support and stimulation interventions were provided by volunteers not known to the participants with aphasia (ACTNoW 2011; David 1982), nursing staff (Shewan 1984ii; Shewan 1984iii), speech and language therapists (Lincoln 1982iii), a trained research assistant (Rochon 2005) or through other social group activities including movement classes, creative arts groups, church activities or support groups (Elman 1999). All visitors providing the ACTNoW 2011 social support received training and a manual of non‐therapeutic activities, suitable conversation topics and access to equipment. David 1982 provided their volunteers with detailed information on their patient's communication problems and they were instructed to "encourage their patient to communicate as well as possible". Similarly, the nursing staff volunteers (Shewan 1984ii; Shewan 1984iii) were given some information about aphasia and instructed to "stimulate communication to the best of their ability". In all four trials the volunteers were given no guidance or instruction in SLT techniques.
The duration of participants' aphasia varied between trials and was reported as: an average of 12 days (ACTNoW 2011), up to four weeks (Shewan 1984ii; Shewan 1984iii), up to three years (David 1982; Lincoln 1982iii), seven months to 28 years (Elman 1999) or between two and nine years (Rochon 2005). Interventions were provided weekly for up to two (David 1982; Lincoln 1982iii), 2.5 (ACTNoW 2011), three (ACTNoW 2011; Shewan 1984ii; Shewan 1984iii) or five hours (Elman 1999) over the course one (Lincoln 1982iii), four (ACTNoW 2011; Elman 1999), five (David 1982) or 12 months (Shewan 1984ii; Shewan 1984iii).
Outcome measures used in this comparison included measures of functional communication, receptive language, expressive language and levels of severity of impairment. Two trials carried out follow‐up measures at four weeks (Rochon 2005), three months and six months (David 1982) after the treatment period.
3. SLT A versus SLT B
We included 25 trials (910 randomised participants) in this section (Bakheit 2007; Crerar 1996; Denes 1996; Di Carlo 1980; Drummond 1981; Hinckley 2001; Leal 1993; Lincoln 1982i; Lincoln 1982ii; Lincoln 1984b; Meikle 1979; Meinzer 2007; ORLA 2006; ORLA 2010; Prins 1989; Pulvermuller 2001; RATS; RATS‐2; Shewan 1984i; Smith 1981iii; Van Steenbrugge 1981; VERSE 2011; Wertz 1981; Wertz 1986iii; Yao 2005iii). Four trials (Bakheit 2007; ORLA 2006; Prins 1989; Shewan 1984) also reported additional groups but these participants were not adequately randomised to the groups and so they have been excluded from this review.
A wide range of SLT interventions were reported including functional SLT (Hinckley 2001), intensive SLT (Bakheit 2007; Denes 1996; ORLA 2006; Smith 1981iii; VERSE 2011), volunteer‐facilitated SLT (Meikle 1979; Meinzer 2007; Leal 1993; Wertz 1986iii), computer‐facilitated SLT (ORLA 2010), group SLT (Pulvermuller 2001; Wertz 1981; Yao 2005iii) and task‐specific SLT (Drummond 1981; Prins 1989; Pulvermuller 2001; Shewan 1984i; Van Steenbrugge 1981) compared with a more conventional SLT model. Other trials compared verb and preposition therapies (Crerar 1996), semantic and phonological therapies (RATS), cognitive‐linguistic and communicative approaches (RATS‐2), filmed programmed instructions with non‐programmed activity (Di Carlo 1980) or programmed instruction with a placebo (Lincoln 1984b).
The duration of participants' aphasia ranged from less than one week (VERSE 2011) up to one month (Leal 1993; Shewan 1984i; Smith 1981iii; Wertz 1981), two months (Bakheit 2007; RATS‐2), six months (Denes 1996; RATS; Wertz 1986iii), 10 months (Lincoln 1982i), one year (Lincoln 1984b), two years (Drummond 1981), three years (Lincoln 1982ii), five years (Van Steenbrugge 1981; Meikle 1979), six years (Di Carlo 1980; Meinzer 2007), eight years (Hinckley 2001), 11 years (Crerar 1996), 13 years (ORLA 2006), 17 years (Prins 1989), 19 years (Pulvermuller 2001) or 21 years (ORLA 2010) after the onset of aphasia. Yao 2005iii did not report the duration of their participants' aphasia.
Therapy was provided daily (Yao 2005iii) for up to two hours (Crerar 1996), three hours (Meinzer 2007; Pulvermuller 2001) or weekly for up to 30 minutes (Drummond 1981), one hour (Lincoln 1984b), 1.5 hours (Lincoln 1982i; Smith 1981iii), two hours (Prins 1989; Van Steenbrugge 1981), three hours (Di Carlo 1980; RATS; Leal 1993; Shewan 1984i), four hours (Meikle 1979; Smith 1981iii), five hours (Bakheit 2007; Denes 1996; RATS‐2), seven hours (VERSE 2011), eight hours (Wertz 1981), 10 hours (ORLA 2006; Wertz 1986iii) or 20 hours (Hinckley 2001). The duration of therapy ranged from two weeks (Drummond 1981; Meinzer 2007), three weeks (Crerar 1996), four weeks (Lincoln 1984b; VERSE 2011; Yao 2005iii), five weeks (Hinckley 2001; Pulvermuller 2001), six weeks (ORLA 2006), eight weeks (Lincoln 1982i; Lincoln 1982ii), nine weeks (Van Steenbrugge 1981), 12 weeks (Bakheit 2007; Wertz 1986iii), 30 weeks (Di Carlo 1980), five months (Prins 1989), up to six months (Denes 1996; Leal 1993; RATS‐2), nine months (RATS), 10 months (Wertz 1981), one year (Shewan 1984i; Smith 1981iii) or two years (Meikle 1979). The therapy intervention varied across participants in ORLA 2010 with each receiving 24 hours of therapy over a mean treatment duration of 12.62 weeks (range 6 to 22 weeks).
There was a wide range of outcome measures used in this comparison including measures of functional communication, receptive language, expressive language, severity of impairment and psychosocial impact. Follow‐up assessments were carried out at six weeks (Wertz 1986iii), three months (Bakheit 2007; Yao 2005iii) and six months (VERSE 2011) following treatment.
Excluded studies
We excluded 30 studies, which incorporates 14 new exclusions (Breitenfeld 2005; Cherney 2010; Gu 2003; Hagen 1973; Hinckley 2005; Holmqvist 1998; Kurt 2008; Liu 2006a; Luo 2008; Marshall 2001; Thompson 2010; Vines 2007; Weiduschat 2011; Zhang 2004). Reasons for exclusion were primarily due to inadequate randomisation and the unavailability of aphasia specific data (see details in the Characteristics of excluded studies table).
Risk of bias in included studies
Two review authors independently reviewed the methodological quality of the included studies and resolved disagreements through discussion. Details can be found in the 'Risk of bias' tables for each of the trials in the Characteristics of included studies table.
The number of participants randomised across trials included in the review ranged from five to 327 participants. Four comparisons randomised 10 participants or fewer (Crerar 1996; Drummond 1981; Rochon 2005; Van Steenbrugge 1981), 11 randomised between 11 and 20 participants (Denes 1996; Di Carlo 1980; Doesborgh 2004; Hinckley 2001; Lincoln 1982i; Lincoln 1982ii; Lincoln 1982iiiLincoln 1984b; Meinzer 2007; ORLA 2006; Pulvermuller 2001), 15 randomised up to 50 participants (Elman 1999; Katz 1997i; Katz 1997ii; Liu 2006; Lyon 1997; Meikle 1979; ORLA 2010; Prins 1989; Shewan 1984iii; Smania 2006; Smith 1981i; Smith 1981ii; Smith 1981iii; Zhang 2007i; Zhang 2007ii), 15 randomised between 51 and 100 participants (Bakheit 2007; Leal 1993; MacKay 1988; RATS; RATS‐2; Shewan 1984i; Shewan 1984ii; VERSE 2011; Wertz 1981; Wertz 1986i; Wertz 1986ii; Wertz 1986iii; Yao 2005i; Yao 2005ii; Yao 2005iii), two randomised between 101 and 150 (Laska 2011; Zhao 2000) and four randomised more than 150 participants (ACTNoW 2011; David 1982; Lincoln 1984a; Wu 2004) (see Table 1).
Of the 51 randomised comparisons, only 25 listed both inclusion and exclusion criteria. Details of exclusion criteria were unavailable for an additional 23 trials (Crerar 1996; Denes 1996; Di Carlo 1980; Hinckley 2001; Katz 1997i; Katz 1997ii; Lincoln 1984b; Lyon 1997; MacKay 1988; Meikle 1979; ORLA 2006; Prins 1989; Rochon 2005; Van Steenbrugge 1981; Wertz 1981; Wertz 1986i; Wertz 1986ii; Wertz 1986iii; Yao 2005i; Yao 2005ii; Yao 2005iii; Zhang 2007i; Zhang 2007ii). Inclusion and exclusion criteria were unavailable for three trials (Drummond 1981; Wu 2004; Zhao 2000). For details, see the Characteristics of included studies table.
Suitable statistical data for communication outcomes were only available for 39 of the 51 trials. Appropriate statistical data for communication outcomes were not provided or could not be extracted in the remaining 13 trials (Drummond 1981; Elman 1999; Leal 1993; Lyon 1997; MacKay 1988; Shewan 1984i; Shewan 1984ii; Shewan 1984iii; Smania 2006; Smith 1981i; Smith 1981ii; Smith 1981iii; Wu 2004). All but one of these trials (Wu 2004) contributed data on the trial dropouts or withdrawals. Psychosocial data were available for two trials (ACTNoW 2011; Lincoln 1984a).
There was a wide range of variation in the descriptions of the SLT interventions. Most reported the use of a conventional SLT approach or described an intervention, which reflects clinical practice where the therapist was responsible for design and content of the treatment delivered. Other more prescriptive SLT interventions were also evaluated (including volunteer‐facilitated therapy, intensive therapy, constraint‐induced language therapy for example) and these will be detailed further in later sections.
Thirty‐five trials reported similar groups at baseline (ACTNoW 2011; Bakheit 2007; Crerar 1996; Denes 1996; Di Carlo 1980; Doesborgh 2004; Drummond 1981; Elman 1999; Hinckley 2001; Katz 1997i; Katz 1997ii; Laska 2011; Leal 1993; Lincoln 1982i; Lincoln 1982ii; Lincoln 1982iii; Lincoln 1984a; Liu 2006; Meikle 1979; ORLA 2006; ORLA 2010; Rochon 2005; Shewan 1984i; Shewan 1984ii; Shewan 1984iii; Smania 2006; Smith 1981iii; Van Steenbrugge 1981; Wertz 1981; Wertz 1986i; Wertz 1986ii; Wertz 1986iii; Zhang 2007i; Zhang 2007ii; Zhao 2000). Comparison between the groups at baseline was unclear in seven trials (Lincoln 1984b; Lyon 1997; MacKay 1988; Wu 2004; Yao 2005i; Yao 2005ii; Yao 2005iii). For nine trials the groups differed despite randomisation in relation to their time post‐onset (Pulvermuller 2001), the severity of their stroke (VERSE 2011), severity of their aphasia (Smith 1981i; Smith 1981ii), gender (RATS‐2) and age (David 1982; RATS; Meinzer 2007; Prins 1989). In Meikle 1979 the participants that were allocated to SLT received more weeks of the intervention than the volunteer‐facilitated group (P = 0.01).
Allocation
Details of the method of generating the randomisation sequence were only available for 17 of the 51 trials. Ten used random numbers tables (Bakheit 2007; David 1982; Katz 1997i; Katz 1997ii; Lincoln 1982i; Lincoln 1982ii; Lincoln 1982iii; Lincoln 1984a; Lincoln 1984b; Smania 2006), six were computer‐generated (ACTNoW 2011; Doesborgh 2004; Pulvermuller 2001; RATS; RATS‐2; VERSE 2011) and one drew lots (Crerar 1996). The remaining 34 trials stated that participants were randomly allocated but did not report any further details. Five trials described stratifying participants by type and severity of aphasia (ACTNoW 2011; Leal 1993; Shewan 1984i; Shewan 1984ii; Shewan 1984iii) and two stratified by recruitment site (ACTNoW 2011; RATS‐2).
Details of the allocation concealment were available for 16 of the 51 trials. Nine used sequentially numbered sealed envelopes or similar methods of allocation and were considered to be adequately concealed (ACTNoW 2011; Bakheit 2007; David 1982; Doesborgh 2004; Laska 2011; Lincoln 1984a; RATS; RATS‐2; VERSE 2011). Four described using an allocation service that was external to the trial team (ACTNoW 2011; Laska 2011; RATS‐2; VERSE 2011). Two described a trialist‐led allocation method that inadequately concealed allocation to the groups (Crerar 1996; Smania 2006).
Blinding
Due to the nature of SLT it is difficult to blind either the patient or person carrying out the intervention. However, blinding of the outcome assessor is possible and should be in place to avert detection bias. More than half of the included trials (33/51) reported blinding of outcome assessors (ACTNoW 2011; Bakheit 2007; Crerar 1996; Denes 1996; RATS; RATS‐2; Laska 2011; Lincoln 1982i; Lincoln 1982ii; Lincoln 1982iii; Lincoln 1984a; MacKay 1988; Meinzer 2007; ORLA 2010; Pulvermuller 2001; Shewan 1984i; Shewan 1984ii; Shewan 1984iii; Smania 2006; Smith 1981i; Smith 1981ii; Smith 1981iii; VERSE 2011; Wertz 1981; Wertz 1986i; Wertz 1986ii; Wertz 1986iii; Wu 2004; Yao 2005i; Yao 2005ii; Yao 2005iii; Zhang 2007i; Zhang 2007ii). In other cases blinding was partially in place. The method of assessment ensured blinding in some of the outcome measures for three trials (Crerar 1996; Lincoln 1984b; ; RATS‐2), while three additional trials (Katz 1997i; Katz 1997ii; Rochon 2005) ensured blinding of a second assessor who checked a proportion of measurements scores. Two trial reports (ACTNoW 2011; David 1982) acknowledged the possibility that measures may have been confounded to some extent by indications from the participants being assessed as to which group they were attending. This is likely to have occurred across several trials. Blinding, however, was unclear for 11 trials (Di Carlo 1980; Doesborgh 2004; Drummond 1981; Hinckley 2001; Leal 1993; Liu 2006; ORLA 2006; Prins 1989; Rochon 2005; Van Steenbrugge 1981; Zhao 2000) and considered inadequate in seven trials (Doesborgh 2004; Elman 1999; Lyon 1997; Meikle 1979; Smith 1981i; Smith 1981ii; Smith 1981iii).
Incomplete outcome data
Overall, 21% of the 2518 participants randomised across the 51 comparisons included in this review withdrew from the intervention or were lost to follow‐up (437 participants plus 92 at follow‐up). Of the 1414 participants in the SLT versus no SLT comparison, 226 (16%) withdrew from the treatment phase of the studies (114 from the SLT interventions and 112 from the 'no SLT' allocation). In addition, 52 participants were lost during the follow‐up assessment phase (19 withdrawing from the SLT groups and 27 from the 'no SLT' groups).The trials that compared SLT with social support and stimulation randomised a total of 432 participants but 105 participants (24%) were lost during the treatment phase (40 from the SLT group and 65 from the social support groups). Twenty‐five additional participants were not included in the follow‐up (David 1982; Elman 1999). The final comparison of SLT A versus SLT B involved 910 randomised participants. A total of 130 participants (14%) withdrew from these trials during the treatment phase with an additional six withdrawing from the follow‐up phase. Across the review, five participants were reported to have withdrawn from a trial but it was unclear which group(s) those participants were allocated to (Smith 1981i; Smith 1981ii; Smith 1981iii). Participants in Meikle 1979 remained in the trial until two successful estimations on an outcome measure showed no appreciable improvement, participants requested withdrawal or until the end of the trial, however no further details were given. Where available, details of dropouts are presented in Table 2.
| Study ID | Dropouts by intervention | Reasons | Follow‐up | Reasons |
| Conventional: 8 Social support: 20 | Conventional: 4 died, 3 declined, 1 post‐randomisation exclusion, 2 non‐study SLT Social support: 7 died, 12 declined, 1 post‐randomisation exclusion, 18 non‐study SLT | No follow‐up | N/A | |
| Intensive: 16 | Intensive: 2 died, 14 withdrew | Intensive: 4 | Not reported | |
| Conventional: 23 | Conventional: 4 died, 5 new stroke, 2 self discharge, 5 illness, 3 moved, 4 other | Conventional: 11 | Not reported | |
| Computer‐mediated: 1 | Computer‐mediated: 1 illness | No follow‐up | N/A | |
| Conventional: 2 | Conventional: 1 transport, 1 time constraints, | Conventional: 0 | ||
| Computer‐mediated: 0 | Prolonged illness, new stroke, death | Computer‐mediated: 0 | ||
| Computer‐mediated: 0 | Prolonged illness, new stroke, death | Computer‐mediated: 0 | ||
| SLT: 3 No SLT: 6 | SLT: 1 death, 2 illness No SLT: 3 declined, 3 illness | At 6 months SLT: 9 No SLT: 6 | SLT: 4 death, 2 declined, 3 illness No SLT: 6 death | |
| Conventional: 21 | Conventional: 2 death, 3 new stroke, 3 transport, 4 declined, 2 moved, 5 illness, 2 transfer | Conventional: 0 | ||
| Social support: ? | Homesickness, illness | No follow‐up | N/A | |
| Social support: ? | Homesickness, illness | No follow‐up | N/A | |
| Social support: ? | Homesickness, illness | No follow‐up | N/A | |
| Conventional: 78 | Death, refused, illness, recovered, unsuitable, relocated | No follow‐up | N/A | |
| Volunteer‐facilitated: 0 | Not reported | No follow‐up | N/A | |
| Conventional: 0 | Conventional: 0 | No follow‐up | N/A | |
| Semantic: 6 | Semantic: 4 received < 40 hours treatment, 2 severe neurological illness | No follow‐up | N/A | |
| Cognitive linguistic: 4 Communicative: 6 | Cognitive linguistic: 3 illness, 1 refusal by therapist Communicative: 1 illness, 5 declined | No follow‐up | N/A | |
| Language orientated: 6 | Language orientated: 1 death, 2 relocation, 3 withdrew | No follow‐up | N/A | |
| Language orientated: 6 | Language orientated: 1 death, 2 relocation, 3 withdrew | No follow‐up | N/A | |
| Conventional: 1 | Conventional: 1 death | No follow‐up | N/A | |
| Conventional: 5 | Conventional: 3 uncooperative, 2 illness | Conventional: 7 | Conventional: 3 illness, 4 refused | |
| Intensive: 6 | Reasons not detailed | Intensive: 4 | Not reported | |
| Conventional: 2 | Reasons not detailed | Conventional: 4 | Not reported | |
| Intensive: 6 | Reasons not detailed | Intensive: 4 | Not reported | |
| Intensive: 7 Conventional: 1 | Intensive: 4 declined, 2 discharged early, 1 died. Conventional: 1 declined | Intensive: 4 Conventional: 2 | Intensive: 4 refused Conventional: 1 refused, 1 death | |
| Group: 17 | 22 self‐discharged (return home or declined to travel), 4 illness, 2 stroke, 3 died, 2 returned to work | No follow‐up | N/A | |
| Conventional: 7 | Illness, new stroke | Conventional: 2 | Illness, new stroke | |
| Volunteer‐facilitated: 6 | Illness, new stroke | Volunteer‐facilitated: 1 | Illness, new stroke | |
| Conventional: 7 | Illness, new stroke | Conventional: 2 | Illness, new stroke |
ANELT: Amsterdam‐Nijmegen Everyday Language Test
SLT: speech and language therapy
Selective reporting
Recruitment and retention of stroke rehabilitation trial participants is known to be a challenge and the trials in this review were no exception. However, seven trials only reported data (including demographic data) from participants that remained in the trial at the end of treatment or at follow‐up. David 1982 reported data from 133 of 155 randomised participants, Doesborgh 2004 reported 18 of 19 randomised participants, Katz 1997i reported 36 of 42 randomised participants, Katz 1997ii reported 40 of 42 randomised participants, Lincoln 1984a reported 191 of 327 randomised participants, MacKay 1988 reported 95 of 96 randomised participants and Smania 2006 reported 33 of 41 randomised participants. Six trials reported using ITT analysis (ACTNoW 2011; Bakheit 2007; Laska 2011; RATS; RATS‐2; VERSE 2011) but not all participants appeared to be included in the final analyses within two trials (Bakheit 2007; RATS). In addition, 21 trials that reported participants that had dropped out did not report using ITT analysis (David 1982; Doesborgh 2004; Elman 1999; Katz 1997i; Katz 1997ii; Leal 1993; Lincoln 1982i; Lincoln 1984a; MacKay 1988; Meikle 1979; Shewan 1984i; Shewan 1984ii; Shewan 1984iii; Smania 2006; Smith 1981i; Smith 1981ii; Smith 1981iii; Wertz 1981; Wertz 1986i; Wertz 1986ii; Wertz 1986iii). All randomised participants were included in the final analyses for the remaining 24 trials.
Other potential sources of bias
Co‐interventions were reported by some trialists that compared the effects of SLT with no SLT. Two groups that received SLT also received acupuncture (Liu 2006; Zhang 2007ii). Some participants in Doesborgh 2004 also received psychosocial group therapy and some (or all) of the participants reported in Smith 1981i may have benefited from other intensive treatment as part of the larger multidisciplinary stroke trial. In both cases the number and allocation of the participants and specific details of the co‐intervention were unavailable. In other cases, not all participants received the planned number of treatment sessions (Laska 2011; Lincoln 1984a; Smith 1981i; Smith 1981ii).
Similarly, seven trials that compared two different approaches with SLT provision reported that not all participants received the planned number of treatment sessions (Bakheit 2007; Lincoln 1982i; Lincoln 1982ii;Meikle 1979;RATS‐2; Smith 1981iii; VERSE 2011). Meikle 1979 reported that five of the 16 participants receiving conventional SLT missed up to half of their possible treatment. Four trials comparing a high intensity SLT with a low intensity SLT also reported difficulties providing intensive SLT interventions as planned. Bakheit 2007 reported that only 13 of the 51 participants received 80% or more of the planned intensive intervention. Smith 1981iii reported that participants allocated to intensive therapy only received an average of 21 hours of therapy compared to the planned minimum of 50 hours during the first three months. Such difficulties in maintaining a clear distinction between the two treatment groups has significant implications when evaluating the results and considering the clinical implications of such treatment regimens. Similarly, VERSE 2011 found that six individuals did not reach the intensive SLT intervention target of 2.5 hours but they also reported that resource limitations in the conventional acute care service meant that 23 individuals in the usual care group failed to receive the maximum once weekly therapy, as allocated. Difficulty maintaining a consistent intensity of treatment across two treatment arms was reported by ORLA 2010 with some participants choosing to have more of the allocated 24 treatment sessions per week than others.
Though all the speech and language therapists in Hinckley 2001 were trained in the characteristics of the two treatment approaches being compared, treatment review processes were in place to ensure any possible risk of overlap in therapy approach was minimised. ACTNoW 2011 employed a similar monitoring approach to ensure fidelity to the planned interventions. Data from three randomised comparisons (Smith 1981i; Smith 1981ii; Smith 1981iii) were subgroups of participants with aphasia extracted from within a larger trial examining models of stroke care. Being part of a larger stroke trial may have affected their levels of fatigue and ability to participate fully in the SLT intervention. The main trial described the inclusion of 20 participants with mild dementia but it is unclear whether any of these individuals were included in the aphasia‐specific data.
Effects of interventions
The results of this review are presented below within the three comparisons: (1) SLT versus no SLT, (2) SLT versus social support and stimulation, and (3) SLT A versus SLT B. Where data availability permitted, results from meta‐analyses are also reported. As described in the Measures of treatment effect section, we extracted the final value scores for inclusion within this review whenever possible. Final value scores were available for 23 of the 51 trials and these have been included within the review. Only change‐from‐baseline data were available for an additional three trials (Denes 1996; Hinckley 2001; RATS). Where change‐from‐baseline data are used they are clearly marked and the data are not pooled within the meta‐analyses with final value scores.
Comparison 1: SLT versus no SLT
A total of 1414 participants were randomised across 19 randomised comparisons that contrasted SLT with no SLT (Doesborgh 2004; Katz 1997i; Katz 1997ii; Laska 2011; Lincoln 1984a; Liu 2006; Lyon 1997; MacKay 1988; Smania 2006; Smith 1981i; Smith 1981ii; Wertz 1986i; Wertz 1986ii; Wu 2004; Yao 2005i; Yao 2005ii; Zhang 2007i; Zhang 2007ii; Zhao 2000). Reporting of age and other descriptions of the participants across trials varied, making it difficult to give an overview of the participants involved in this comparison. Only five trials reported age ranges, spanning 38 to 94 years of age (Laska 2011; Lincoln 1984a; Lyon 1997; Smania 2006; Wu 2004), while others reported participants' mean age or age bands. Details can be found in Table 1. Thirteen trials gave an indication of the length of time since participants had experienced the onset of their aphasia: the widest range of time post‐onset reported spanned two to 36 months (Smania 2006). The shortest mean length of time since the onset of participants' aphasia was three days (range two to four days) (Laska 2011). Severity of aphasia was reported by 11 trials (Doesborgh 2004; Katz 1997i; Katz 1997ii; Laska 2011; Liu 2006; Smith 1981i; Smith 1981ii; Wertz 1986i; Wertz 1986ii; Zhang 2007i; Zhang 2007ii), although two additional trials provided some indication of severity of impairment (Lyon 1997; Smania 2006).
Among the SLT interventions compared to a 'no SLT' group were interventions considered to be conventional SLT (Liu 2006; Smania 2006; Smith 1981ii; Wertz 1986i; Wu 2004; Yao 2005ii; Zhang 2007i; Zhang 2007ii; Zhao 2000), computer‐mediated SLT (Doesborgh 2004; Katz 1997i; Katz 1997ii), group SLT (Yao 2005i), functional SLT (Lyon 1997), intensive SLT (Laska 2011; Smith 1981i), language enrichment therapy (Laska 2011), SLT plus operant training (Lincoln 1984a) and volunteer‐facilitated SLT (MacKay 1988; Wertz 1986ii). We planned to conduct a sensitivity analysis on trials that involved the provision of SLT by non‐speech and language therapists (Liu 2006; MacKay 1988; Wertz 1986ii; Yao 2005i; Yao 2005ii; Zhang 2007i; Zhang 2007ii; Zhao 2000) but because of the present availability of data within each outcome it was not useful to undertake this analysis.
Appropriate summary data for communication outcomes (allowing inclusion in the meta‐analyses) were available for 13 of the 19 trials (Doesborgh 2004; Katz 1997i; Katz 1997ii; Liu 2006; Lincoln 1984a; Smania 2006; Wertz 1986i; Wertz 1986ii; Yao 2005i; Yao 2005ii; Zhang 2007i; Zhang 2007ii; Zhao 2000). In addition, Lincoln 1984a also reported statistical data for psychosocial outcomes. Suitable summary data were not reported (or available on request) for the remaining five trials (Lyon 1997; MacKay 1988;Smith 1981i;Smith 1981ii;Wu 2004). Where data for this comparison were available they are presented below in relation to the following: (1) functional communication, (2) receptive language, (3) expressive language, (4) severity of impairment, (5) psychosocial, (6) number of dropouts, (7) compliance with allocated intervention and (8) economic outcomes.
1. Functional communication
Eleven trials compared participants that received SLT with those that did not, by measuring functional communication outcomes (Doesborgh 2004; Katz 1997i; Katz 1997ii; Laska 2011; Lincoln 1984a; Lyon 1997;MacKay 1988; Wertz 1986i; Wertz 1986ii; Zhang 2007i; Zhang 2007ii). Tools used included the spontaneous speech subtest of the Western Aphasia Battery (WAB) (Katz 1997i; Katz 1997ii), the Amsterdam‐Nijmegen Everyday Language Test (ANELT) (Doesborgh 2004; Laska 2011), the Communication Activities of Daily Living (CADL) (Wertz 1986i; Wertz 1986ii), the Functional Communication Profile (FCP) (Lincoln 1984a; Wertz 1986i; Wertz 1986ii) and the Chinese Functional Communication Profile (Zhang 2007i; Zhang 2007ii). Eight trials provided suitable statistical data permitting inclusion within the meta‐analyses (Doesborgh 2004; Katz 1997i; Katz 1997ii; Laska 2011; Wertz 1986i; Wertz 1986ii; Zhang 2007i; Zhang 2007ii).
Spontaneous speech
Four trials evaluated the impact of SLT by contrasting the spontaneous speech of participants who received computer‐mediated SLT (Doesborgh 2004; Katz 1997i; Katz 1997ii) or language enrichment therapy (Laska 2011) with those who did not (Doesborgh 2004; Katz 1997i; Laska 2011) or received computer‐mediated non‐linguistic tasks (Katz 1997ii). Comparisons were made using a subtest of the WAB (Katz 1997i; Katz 1997ii) or the ANELT (Doesborgh 2004; Laska 2011).
Communication Activities of Daily Living (CADL)
Four trials used the CADL to compare the functional communication skills of participants that received SLT (conventional SLT (Wertz 1986i), volunteer‐facilitated SLT (MacKay 1988; Wertz 1986ii) and functional SLT (Lyon 1997)), and those that received no SLT intervention. Two trials provided statistical data that allowed inclusion within a meta‐analysis (Wertz 1986i; Wertz 1986ii). There was no evidence of a difference between the groups provided with SLT and those that were not (Analysis 1.1).
Functional Communication Profile (FCP)
Three trials (Lincoln 1984a; Wertz 1986i;Wertz 1986ii) compared the pragmatic provision of SLT (approach tailored to individual participants' needs) to a deferred SLT intervention using the FCP. Appropriate summary data for Lincoln 1984a on this outcome measure were not available. There was no evidence of a difference between the groups.
Chinese Functional Communication Profile (CFCP)
Zhang 2007i and Zhang 2007ii used the CFCP to compare groups that received SLT and no SLT. One SLT group also received an acupuncture co‐intervention and were found to have better scores on the CFCP than those that had received no SLT (Zhang 2007ii).
The results of functional communication measures reported across the trials were pooled within a meta‐analysis. Only one set of functional communication measures from Wertz 1986i and Wertz 1986ii could be included at a time. Both pooling approaches demonstrated that those participants that received SLT performed better on measures of functional communication that those that did not receive SLT (by including the CADL data P = 0.02, SMD 0.26, 95% CI 0.03 to 0.48; including FCP data P = 0.008, SMD 0.30, 95% CI 0.08 to 0.52). We have chosen to present the data from the FCP within the forest plot (Analysis 1.1).
2. Receptive language
Eight of the 19 trials measured participants' receptive language skills (Katz 1997i; Katz 1997ii; Laska 2011; Smania 2006; Wertz 1986i;Wertz 1986ii; Zhang 2007i; Zhang 2007ii) and all reported statistical data, which permitted inclusion in the meta‐analyses. Auditory comprehension was measured using the Token Test and subtests of the WAB, the Norsk Grunntest for Afasi (NGA), the Aphasia Battery of Chinese (ABC) and the PICA. Reading comprehension was measured using the Reading Comprehension Battery for Aphasia (RCBA), the reading subtests of the PICA and the ABC. Gesture comprehension was measured using an unnamed assessment.
Auditory comprehension
Three trials used the Token Test to measure changes in participants' auditory comprehension (Smania 2006; Wertz 1986i; Wertz 1986ii). Laska 2011 reported using the NGA to capture data on auditory comprehension. Two trials used the ABC auditory comprehension subtest (Zhang 2007i; Zhang 2007ii). Two trials used both the WAB and PICA subtests to measure participants' auditory comprehension (Katz 1997i; Katz 1997ii). As for the functional communication data above, both sets of data from Katz 1997i and Katz 1997ii could not be included in the same meta‐analysis. On pooling the data within two separate meta‐analyses, there was no evidence of a significant difference between the groups (by including the WAB data P = 0.67, SMD 0.05, 95% CI ‐0.17 to 0.26; by including the PICA data P = 0.59, SMD 0.06, 95% CI ‐0.15 to 0.27). We have chosen to present the PICA data within the forest plot (Analysis 1.2).
Reading comprehension
Reading comprehension was measured by six trials (Katz 1997i; Katz 1997ii; Wertz 1986i; Wertz 1986ii; Zhang 2007i; Zhang 2007ii) that compared participants that received SLT and those that did not. Two trials used the RCBA to compare participants that received volunteer‐facilitated SLT with those that received no SLT (Wertz 1986i; Wertz 1986ii). Similarly, two trials used the PICA reading subtest to compare participants that received computer‐mediated SLT to those that received no treatment (Katz 1997i) or computer‐mediated non‐linguistic tasks (Katz 1997ii). Lastly, two trials used the reading subtest of the ABC to compare those that received SLT with those that did not (Zhang 2007i; Zhang 2007ii). The participants that received SLT in Zhang 2007ii also received an acupuncture co‐intervention. On pooling of the data the participants that received SLT performed better on tests of reading comprehension than those that did not receive SLT (P = 0.05, SMD 0.29, 95% CI 0 to 0.58 (Analysis 1.3). Plotting these outcome measures against the estimated standard errors within a funnel plots we found that one of the trials based on the ABC fell out with the 95% CI (Figure 1). This issue will be considered further in the Discussion section.

Funnel plot of comparison: 1 SLT versus no SLT, outcome: 1.3 Receptive language: reading comprehension.
Other comprehension
The PICA gestural subtest was used by four trials (Katz 1997i; Katz 1997ii; Wertz 1986i; Wertz 1986ii) and measures gestural abilities alongside auditory and written comprehension skills. Following pooling, participants that received SLT had achieved higher scores on measures of gesture use than the groups that received no SLT (P = 0.02, MD 8.04, 95% CI 1.55 to 14.52) (Analysis 1.4).
Gesture comprehension
Smania 2006 used an unnamed gesture comprehension assessment tool to compare a group that received conventional SLT and those that received limb apraxia therapy at two time points: after intervention and again two months later. There was no evidence of a difference between the two groups’ comprehension of gestures at either time point (Analysis 1.5).
3. Expressive language
Eight trials (Doesborgh 2004; Katz 1997i; Katz 1997ii; Laska 2011; Wertz 1986i; Wertz 1986ii; Zhang 2007i; Zhang 2007ii) formally evaluated participants' expressive language skills using single word picture naming (Boston Naming Test (BNT), the WAB and NGA naming subtests), repetition (WAB and NGA repetition subtests) and other verbal expression (PICA and ABC sub tests) skills. Written language expressive skills were measured using the PICA copying and writing sub tests and the ABC writing subtest while the ability to communicate using gesture was measured using the PICA gesture subtest.
Expressive language: naming
Participants' naming abilities were measured by four trials (Doesborgh 2004; Katz 1997i; Katz 1997ii; Laska 2011). Doesborgh 2004 used the BNT to compare a group receiving computer‐mediated SLT and a group that did not receive SLT. Similarly, Katz 1997i and Katz 1997ii employed the WAB naming subtest while Laska 2011 used the NGA naming subtest. On pooling there was no evidence of a difference between the groups (Analysis 1.6).
Expressive language: general
Four trials used the PICA verbal subtest to compare the spoken language skills of patient groups that received SLT and those that did not (Katz 1997i; Katz 1997ii; Wertz 1986i; Wertz 1986ii). Two additional trials captured participants' expressive language skills using a subtest of the ABC (Zhang 2007i; Zhang 2007ii). On pooling the data using SMDs there was evidence of significant statistical heterogeneity between the groups (P = 0.0009, I2 = 76%) and so a random‐effects model was used to pool the data. Those participants that had received SLT scored significantly better on general measures of expressive language skills (P = 0.02, SMD 0.77, 95% CI 0.14 to 1.39) (Analysis 1.7). Conducting a sensitivity analysis we found that when both Zhang 2007i and Zhang 2007ii were removed from the analysis the heterogeneity was removed (I2 = 0%) and the pooled results no longer demonstrated a significant difference between the groups. Plotting the outcome measures against the estimated standard errors within a funnel plot (Figure 2) we found that one of the trials based on the ABC fell out with the 95% CI. This issue will be considered further in the Discussion section.

Funnel plot of comparison: 1 SLT versus no SLT, outcome: 1.7 Expressive language: general.
Expressive language: written
Six trials reported used writing subtests of the PICA (Katz 1997i; Katz 1997ii), the ABC (Zhang 2007i; Zhang 2007ii) and the PICA graphic subtest (Wertz 1986i; Wertz 1986ii) to compare a group receiving SLT with a group receiving no SLT. Following pooling those participants that had received SLT had performed better on the writing subtests than those that had not received SLT (P = 0.002, SMD 0.45, 95% CI 0.16 to 0.74) (Analysis 1.8). Plotting these outcome measures against the estimated standard errors within a funnel plot (Figure 3) we found that one of the trials based on the ABC fell out with the 95% CI. This issue will be considered further in the Discussion section.

Funnel plot of comparison: 1 SLT versus no SLT, outcome: 1.8 Expressive language: written.
Expressive language: copying text
Two trials compared a group receiving computer‐mediated SLT with a group receiving no SLT (Katz 1997i) or a group receiving computer‐mediated non‐linguistic tasks (Katz 1997ii) using the PICA copying subtest. There was no evidence of a difference between the groups' copying skills (Analysis 1.9).
Expressive language: Repetition
Three trials compared participants that received SLT and those that did not by measuring their repetition skills on the WAB subtest (Katz 1997i; Katz 1997ii) and the NGA subtest (Laska 2011). Following pooling of the available data there was no evidence of a difference in the participants' repetition skills (Analysis 1.10).
4. Severity of impairment
Fifteen trials compared a group that received SLT with one that did not receive any SLT by measuring the severity of the participants' aphasia impairment. Language assessment batteries included the PICA (Katz 1997i; Katz 1997ii; Lincoln 1984a; Wertz 1986i; Wertz 1986ii), the Boston Diagnostic Aphasia Examination (BDAE) (Liu 2006; Lyon 1997), the Chinese Aphasia Measurement (Zhao 2000), WAB (Katz 1997i; Katz 1997ii), the Minnesota Test for Differential Diagnosis of Aphasia (MTDDA) (Smith 1981i; Smith 1981ii), NGA (Laska 2011), the Chinese Rehabilitation Research Centre Aphasia Examination (CRRCAE) (Yao 2005i; Yao 2005ii) and the Aphasia Battery of Chinese (ABC) (Zhang 2007i; Zhang 2007ii). Trials included compared the severity of participants' aphasia between groups that received group SLT (Yao 2005i), computer‐mediated SLT (Katz 1997i; Katz 1997ii), conventional SLT (Liu 2006; Wertz 1986i; Yao 2005ii; Zhang 2007i; Zhang 2007ii; Zhao 2000) and volunteer‐facilitated SLT (Wertz 1986ii) with groups that received no SLT or a computer‐mediated non‐SLT intervention (Katz 1997ii). We were able to obtain statistical summary data suitable for inclusion within a meta‐analysis from all but four trials (Lincoln 1984a; Lyon 1997; Smith 1981i; Smith 1981ii).
Pooling the available data (selectively including the PICA data from Katz 1997i; Katz 1997ii) using SMDs we observed significant heterogeneity (I2 = 93%, P < 0.00001). Thus, the data were pooled using a random‐effects model. The heterogeneity remained. There was no evidence of a significant difference between the groups that received SLT and those that did not (Analysis 1.11). On conducting a sensitivity analysis to identify the source of the heterogeneity we observed that removing the Zhao 2000 data from the meta‐analysis removed the heterogeneity (I2 = 0%). The pooled data also demonstrated no significant difference between the aphasia severity ratings between the groups regardless of whether the PICA data from Katz 1997i and Katz 1997ii were included (P = 0.08, SMD 0.17, 95% CI ‐0.02 to 0.36). Conducting the same analysis but including the WAB data from Katz 1997i and Katz 1997ii resulted in no evidence of a significant difference between the groups (P = 0.09, SMD 0.15, 95% CI ‐0.04 to 0.34). We have chosen to present the PICA data (Analysis 1.11). The funnel plot of this Analysis 1.11 (Figure 4) found that the outcome based on the Chinese Aphasia Measurement fell out with the 95% CI. This issue will be returned to within the Discussion section.
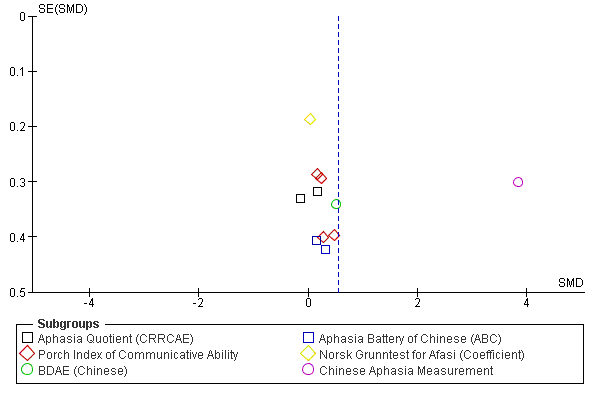
Funnel plot of comparison: 1 SLT versus no SLT, outcome: 1.11 Severity of impairment: Aphasia Battery Score (+ PICA).
Yao 2005i and Yao 2005ii also repeated the comparison of participants who received group SLT and conventional SLT with those who had not received any SLT on measures of aphasia severity at a three‐month follow‐up. The group that received group SLT scored significantly higher than those that received no SLT but on pooling (using a random‐effects model in the presence of significant statistical heterogeneity P = 0.02; I2 = 82%) there was no evidence of a difference between the groups (Analysis 1.12).
5. Psychosocial
Five trials compared the benefits of SLT intervention to no SLT by employing psychosocial measures including the Multiple Affect Adjective Checklist (MAACL), the General Health Questionnaire (GHQ), the Affect Balance Scale (ABS), the Psychological Wellbeing Index, the EuroQoL and the Nottingham Health Profile (NHP) (Laska 2011; Lincoln 1984a; Lyon 1997; Smith 1981i; Smith 1981ii).
Lyon 1997 used the ABS and Psychological Wellbeing Index to compare a group of triads (person with aphasia, caregiver and communication partner) that received functional SLT that aimed to establish and maximise effective means of communication between communication partners and a group that received no SLT. The GHQ was used to compare groups that received either intensive SLT (Smith 1981i) or conventional SLT (Smith 1981ii) with a group that received no treatment while Laska 2001 reported capturing data using the EuroQol and the NHP. No suitable data were available from these trials. In contrast, Lincoln 1984a used the anxiety, depression and hostility scales of the MAACL to compare the psychosocial well‐being of a group that received SLT (determined by the therapist) with a group that received no SLT. Comparison of the groups failed to show any evidence of a difference in the participants' anxiety, depression or hostility as measured on these scales (Analysis 1.13).
6. Number of dropouts
Information relating to the numbers of participant dropouts (where they occurred) was available for all 19 trials in this comparison. A total of 226 individuals withdrew during the treatment phase and an additional 46 were lost at the follow‐up phase. No withdrawals were reported in eight trials (Liu 2006; Lyon 1997; Wu 2004; Yao 2005i; Yao 2005ii; Zhang 2007i; Zhang 2007ii; Zhao 2000). An additional five participants withdrew from Smith 1981i and Smith 1981ii (group allocation is unclear but these withdrawals are included in the number above) and they failed to report the number of withdrawals from the 'no SLT' group. There was a range of reasons for the attrition of participants from the trials (see Table 2 for details). On pooling of the available data relating to dropouts there was no evidence of a difference between the groups (Analysis 1.14).
7. Compliance with allocated intervention
Only three of the 11 trials reporting participant dropouts also described the reasons for the 54 participants' withdrawal (Doesborgh 2004; Laska 2011; Smania 2006). Of these, a total of 12 participants were described as withdrawing because they were unco‐operative or they refused the allocated treatment (all from Smania 2006) with seven withdrawing from the conventional SLT group and five withdrawing from the 'no SLT' group. Four participants in Laska 2011 refused testing (one from the SLT group; three from the no SLT group). Details can be found in Table 2. On pooling there was no indication of a difference between compliance rates between the groups.
8. Economic outcomes
Only one of the 19 randomised comparisons described the measurement of economic outcomes using structured questionnaires (MacKay 1988) but neither the questionnaire nor the results were available for this review.
Comparison 2: SLT versus social support and stimulation
Seven trials compared the provision of SLT to the provision of informal social support and stimulation among a total of 279 participants (ACTNoW 2011; David 1982; Elman 1999; Lincoln 1982iii; Rochon 2005; Shewan 1984ii; Shewan 1984iii). As described above, the description of participant groups within trials was variable and so it is difficult to give a precise overview of the participants included in this comparison. Most trials described the participants' age range, which spanned from 18 to 97 years (ACTNoW 2011; Elman 1999; Lincoln 1982iii; Rochon 2005; Shewan 1984ii; Shewan 1984iii). David 1982 reported participants in the SLT and social support and stimulation groups had a mean age (± SD) of 70 (± 8.7) years and 65 (± 10.6) years, respectively, indicating a significant difference between the groups (P = 0.003). Details can be found in Table 1. All seven trials detailed the length of time since the onset of participants' aphasia. Participants with the most acute aphasia were randomised by ACTNoW 2011 with aphasia that had an interquartile range of nine to 16 days duration. Similarly, Shewan 1984ii and Shewan 1984iii recruited people who were two to four weeks post onset of aphasia. In contrast, Lincoln 1982iii recruited participants between one and 36 months' post‐stroke while some of the other trials recruited participants much later following stroke with ranges from two to nine years (Rochon 2005) or seven months to 28 years (Elman 1999). Severity of aphasia was reported by all seven trials in varying degrees of detail. Lincoln 1982iii recruited participants with moderate degrees of aphasia. The remaining six trials described the recruitment of participants with a range of mild to severe aphasia (ACTNoW 2011; David 1982; Elman 1999; Rochon 2005; Shewan 1984ii; Shewan 1984iii) (see Table 1 for details).
There were a number of approaches to the provision of SLT interventions in the trials: four provided conventional SLT (ACTNoW 2011; David 1982; Lincoln 1982iii; Shewan 1984iii) and the others provided group SLT (Elman 1999), sentence‐mapping SLT (Rochon 2005) and language‐orientated SLT (Shewan 1984ii). These SLT interventions were then compared to the provision of social support and stimulation, which also took a variety of formats. Unstructured support and communicative stimulation was provided by nurses (Shewan 1984ii; Shewan 1984iii), a trained research assistant (Rochon 2005), a clinical psychologist (Lincoln 1982iii), other volunteers (ACTNoW 2011; David 1982) or through attendance at an externally organised support group or class, for example dance classes or church groups (Elman 1999). Some volunteers had been given detailed information about their own participant's particular presentation of aphasia (David 1982) but were not given any training in SLT techniques (ACTNoW 2011; David 1982; Lincoln 1982iii; Shewan 1984ii; Shewan 1984iii). Two trials had a specific non‐therapeutic intervention protocol for the people providing the social support and stimulation intervention, which detailed the role and suitable non‐communication therapy activities (ACTNoW 2011; Lincoln 1982iii). Intervention fidelity monitoring was described in four trials (ACTNoW 2011; David 1982 (partial); Shewan 1984ii; Shewan 1984iii). The participants in these groups received social support for up to one hour (ACTNoW 2011; Rochon 2005), two hours (David 1982; Lincoln 1982iii) or three hours (Elman 1999; Shewan 1984ii; Shewan 1984iii), each week over a period of up to one month (Lincoln 1982iii), 2.5 months (Rochon 2005), four months (ACTNoW 2011; Elman 1999), five months (David 1982) or one year (Shewan 1984ii; Shewan 1984iii). Statistical data for communication outcomes were available for four of the included trials (ACTNoW 2011; David 1982; Lincoln 1982iii; Rochon 2005). Suitable data allowing inclusion within the meta‐analyses were unavailable for the remaining three trials (Elman 1999; Shewan 1984ii; Shewan 1984iii). The comparisons made (with meta‐analysis where possible) are reported below as they relate to measures of: (1) functional communication, (2) receptive language, (3) expressive language, (4) severity of impairment, (5) psychosocial, (6) number of dropouts, (7) compliance with allocated intervention and (8) economic outcomes.
1. Functional communication
Three trials measured functional communication (ACTNoW 2011; David 1982; Elman 1999) using the FCP, the CADL, the CETI and the Therapy Outcome Measures (TOMs).
Functional Communication Profile (FCP)
David 1982 used the FCP to compare a group who received conventional SLT with a group that received communication treatment by volunteers. There was no evidence of a difference between the groups neither was there any evidence of a difference at three and six‐month follow‐up (Analysis 2.1).
Communication Abilities of Daily Living (CADL) and the Communicative Effectiveness Index (CETI)
Elman 1999 used the CADL, the CETI and measures of connected speech to compare the functional communication skills of participants that received conventional SLT and those that did not but who attended social groups and activities instead. No suitable summary data were provided and so the data could not be included in the meta‐analysis.
Therapy Outcome Measures (TOMs)
ACTNoW 2011 used the TOMs to compare blinded ratings of video‐recorded samples of participants' functional communication skills that had received conventional SLT and those that had received social support and stimulation from a volunteer.
On pooling the available data using SMDs ( ACTNoW 2011; David 1982) there was no evidence of a significant difference between the groups that had received SLT and those that had received informal social support (Analysis 2.1).
David 1982 also reported data from a cohort that were assessed three and six months following intervention. There was no evidence of a difference at either time point between the group that received SLT and those that received social support (Analysis 2.2).
2. Receptive language
Four of the seven trials that compared participants that received SLT or a social support and stimulation intervention did so by comparing the groups' receptive language skills (Lincoln 1982iii; Rochon 2005; Shewan 1984ii; Shewan 1984iii). Measures used included the Philadelphia Comprehension Battery (PCB), the Auditory Comprehension Test for Sentences (ACTS), the Token Test and the PICA Gestural subtest.
Philadelphia Comprehension Battery (PCB)
Rochon 2005 measured participants' receptive language skills on the PCB, which includes subtests for sentence comprehension and picture comprehension. There was no evidence of a difference between the receptive language skills of the participants that received sentence‐mapping SLT and those that received unstructured social support and stimulation (Analysis 2.3).
Auditory Comprehension Test for Sentences (ACTS)
Two additional trials measured receptive language skills of a group that received either language‐oriented therapy (Shewan 1984ii) or conventional SLT (Shewan 1984iii) and compared their auditory comprehension of sentences with participants that received an intervention that provided unstructured social support. Both trials used the ACTS to make this comparison but the manner in which the data are reported prevented inclusion within the meta‐analysis.
Token Test
Lincoln 1982iii measured participants' receptive language skills using the Token Test. There was no evidence of a difference between the groups (Analysis 2.3).
Receptive language: other comprehension
Participants' auditory and written comprehension skills were measured using the PICA Gestural subtest by Lincoln 1982iii and those that had access to social support and stimulation performed significantly better on these measures than those that had access to SLT (P = 0.04, MD ‐0.87, 95% CI ‐1.70 to ‐0.04) (Analysis 2.4).
3. Expressive language
Three of the seven trials that compared participants that received SLT or a social support and stimulation intervention did so by comparing the groups' expressive language skills (Elman 1999; Lincoln 1982iii; Rochon 2005). Measures used included the Object Naming Test (ONT), Caplan and Hanna Sentence Production Test (CHSPT), the Picture Description with Structured Modeling (PDSM) and the PICA.
Expressive language: single words
Lincoln 1982iii measured participants' naming skills on the ONT and a word fluency test and found those participants that received social support and stimulation performed significantly better on these tests than those that had received conventional SLT (P = 0.003, MD ‐7.00, 95% CI ‐11.67 to ‐2.33, and P < 0.0001, MD ‐14.00, 95% CI ‐20.35 to ‐7.65 respectively) (Analysis 2.5).
Expressive language: sentences
Rochon 2005 compared the participants who received sentence‐mapping SLT and a group receiving unstructured social support and stimulation. Comparison of the two groups showed no evidence of a difference between the groups' performance on the CHSPT scores. Those that had received SLT did perform significantly better on treated items from the test (P = 0.01, MD 3, 95% CI 0.63 to 5.37) than the participants that received social support but there was no evidence of a difference between the groups on the untreated items (Analysis 2.6).
Expressive language: picture description
Two trials elicited samples of participants' connected speech using picture description tasks (Lincoln 1982iii; Rochon 2005). There was no evidence of a difference between the two groups. Rochon 2005 also reported the two groups' scores on the treated and untreated items but there was no evidence of a between‐group difference on the treated or untreated items (Analysis 2.7).
Expressive language: general
Lincoln 1982iii and Elman 1999 compared the groups' performances on the PICA verbal subtest. Suitable statistical data were unavailable from Elman 1999 and so it could not be included in the meta‐analysis. Participants that had received social support and stimulation scored significantly better than those that received SLT (P = 0.0007, MD ‐1.56, 95% CI ‐2.46 to ‐0.66) (Analysis 2.8).
Expressive language: written
Similarly, Lincoln 1982iii compared the groups' performances on the PICA graphic subtests and found participants that received social support performed significantly better than those that had received SLT (P = 0.01, MD ‐1.39, 95% CI ‐2.49 to ‐0.29) (Analysis 2.9).
4. Severity of impairment
Elman 1999, Lincoln 1982iii, Shewan 1984ii and Shewan 1984iii compared groups that had access to SLT and those that received social support and stimulation by measuring participants' aphasia severity. The assessments used included the PICA and the Western Aphasia Battery‐Aphasia Quotient (WABAQ).
PICA
Two trials used the Shortened PICA to compare participants that had received group SLT and those that had attended other social activities or groups that provided social support and stimulation (Elman 1999; Lincoln 1982iii). Suitable statistical data were unavailable from Elman 1999 and so it could not be included in the meta‐analysis. Lincoln 1982iii found that participants provided with social support and stimulation were less impaired as a result of aphasia (as measured on the PICA) than those that received SLT (P = 0.005, MD ‐1.13, 95% CI ‐1.91 to ‐0.35). Suitable summary data were not available from Elman 1999 to allow inclusion within the meta‐analysis (Analysis 2.10).
WAB
Two additional trials (Shewan 1984ii; Shewan 1984iii) compared groups based on the severity of participants' aphasia using the WAB. They compared participants who received language‐oriented SLT (Shewan 1984ii) or conventional SLT (Shewan 1984iii) with a group who received psychological support and unstructured communication provided by trained nurses. Suitable summary data were unavailable and so it could not be included in the meta‐analysis.
5. Psychosocial
ACTNoW 2011 and Elman 1999 compared participants that had received SLT and those that had received social support and stimulation using measures of psychosocial impact using the ABS and the Communication Outcomes After STroke (COAST) scale from both the patients' and carers' perspectives.
Affect Balance Scale
Elman 1999 compared participants that had received SLT and those that had received social support using the ABS but appropriate summary values were unavailable and so it could not be included in the meta‐analysis.
COAST
Participants and carers completed separate versions of the COAST scale to indicate the impact of the participant's aphasia on their functional communication and quality of life (ACTNoW 2011). Measures were then used to compare the participants that had received SLT and those that had received social support. There was no evidence of a difference between the groups on this measure as reported by the participants or by the carers (Analysis 2.11).
6. Number of dropouts
Dropouts from the original participants randomised were reported by six of the seven trials in this section (ACTNoW 2011; David 1982; Elman 1999; Lincoln 1982iii; Shewan 1984ii; Shewan 1984iii). In the main Lincoln 1982 trial (from which the randomised comparison Lincoln 1982iii has been extracted) 13 participants were excluded for failing to complete the full treatment intervention. It is unclear which intervention arms these participants were randomised to and so these dropouts cannot be included in this meta‐analysis. In the remaining trials, a total of 52 participants were lost from the groups allocated to SLT (40 from treatment or post‐treatment assessment and 12 at follow‐up) while 78 were lost to the social support and stimulation interventions (65 during or at assessment following the intervention and 11 at follow‐up). Fewer participants allocated to SLT were lost to the trial than those that were allocated to social support and stimulation (P = 0.007, OR 0.54 95% CI 0.34 to 0.87) (Analysis 2.12).
7. Compliance with allocated intervention
Five trials that experienced dropouts also described the reasons for the dropouts so that those who had voluntarily withdrawn from the allocated intervention could be identified. A total of 11 participants in the groups allocated to receive SLT and 45 participants allocated to receive social support and stimulation interventions did not adhere to the allocated intervention (ACTNoW 2011; David 1982; Elman 1999; Shewan 1984ii; Shewan 1984iii). In addition, David 1982 also described the withdrawal of four more participants from the social support group because of 'volunteer problems' (details can be found in Table 2). Significantly more participants allocated to the social support and stimulation interventions voluntarily broke protocol and did not continue in the study (P < 0.00001, OR 0.18, 95% CI 0.09 to 0.37).
8. Economic outcomes
Only one of the seven trials measured economic outcomes (ACTNoW 2011). The cost favoured the provision of SLT (P < 0.00001, MD ‐3035.00, 95% CI ‐4342.44 to ‐1727.56) while the while the utility data favoured the social support intervention (P = 0.02, MD 0.06, 95% CI 0.01 to 0.11).
Comparisons: SLT A versus SLT B
A total of 910 participants were included in 25 randomised comparisons of one SLT intervention (SLT A) with another SLT intervention (SLT B) (Bakheit 2007; Crerar 1996; Denes 1996; Di Carlo 1980; Drummond 1981; Hinckley 2001; Leal 1993; Lincoln 1982i; Lincoln 1982ii; Lincoln 1984b; Meikle 1979; Meinzer 2007; ORLA 2006; ORLA 2010; Prins 1989; Pulvermuller 2001; RATS; RATS‐2; Shewan 1984i; Smith 1981iii; Van Steenbrugge 1981; VERSE 2011; Yao 2005iii; Wertz 1981; Wertz 1986iii). As within other sections of this review, descriptions of the participants' age and other characteristics across trials varied. Participants' age ranges spanning 17 to 92 years were available for 13 trials while the remaining nine trials reported mean ages (Denes 1996; Drummond 1981; Hinckley 2001; Leal 1993; RATS; RATS‐2; Smith 1981iii; VERSE 2011; Wertz 1986iii) or the number of participants within age bands (Yao 2005iii). See Table 1 for details.
All but two trials (Smith 1981iii; Yao 2005iii) reported the length of time since their participants had experienced the onset of aphasia, ranging from a few days (VERSE 2011) or within one month of stroke onset (Bakheit 2007; Leal 1993; Shewan 1984i; Wertz 1981) up to one year or more after stroke (Drummond 1981; Hinckley 2001; Meinzer 2007; ORLA 2006; ORLA 2010; Pulvermuller 2001; Prins 1989; Van Steenbrugge 1981). Similarly, almost all trials reported the severity of aphasia with only two failing to give an indication of how severe participants' aphasia was (Drummond 1981; Yao 2005iii). In most cases trials reported the range of participants' aphasia severity as measured on a suitable assessment tool but in some cases this was reported in more general terms (details can be found in Table 1). Some trials focused specifically on participants with severe aphasia (Denes 1996; Di Carlo 1980; Lincoln 1984b) while others focused on moderate to severe presentations of aphasia (Lincoln 1982i; Leal 1993).
Many of the trials included in this section compared an experimental SLT approach to the delivery of a more conventional SLT intervention where the two interventions differed in the theoretical underpinnings of the therapy delivered, the communication components targeted, the therapy regimen (duration, frequency, intensity), the nature of the interaction (one‐to‐one or group therapy) or manner of facilitation (volunteers or computers). In four cases the experimental SLT approaches were the standard SLT intervention plus an experimental adjunct of filmed programmed instruction (Di Carlo 1980), operant training (Lincoln 1982i; Lincoln 1982ii) or operant training with programmed instruction (Lincoln 1984b). They each included a placebo adjunct to conventional SLT in the form of 'non‐programmed activity' (viewing slides and bibliotherapy; Di Carlo 1980), an attention placebo (Lincoln 1984b), which in two cases was a social support and stimulation interaction (Lincoln 1982i; Lincoln 1982ii). These comparisons are described further below. A total of 21 of the 25 trials reported suitable communication summary data that permitted inclusion in the meta‐analyses (Bakheit 2007; Crerar 1996; Denes 1996; Di Carlo 1980; Hinckley 2001; Lincoln 1982i; Lincoln 1982ii; Lincoln 1984b; Meikle 1979; Meinzer 2007; ORLA 2006; ORLA 2010; Prins 1989; Pulvermuller 2001; RATS; RATS‐2; Van Steenbrugge 1981; VERSE 2011; Wertz 1981; Wertz 1986iii; Yao 2005iii). Where data were available they are presented below within the comparisons: 3. Experimental SLT versus conventional SLT; 4. High‐intensity SLT versus low‐intensity SLT; 5. Volunteer‐facilitated SLT versus conventional SLT; 6. Computer‐facilitated SLT versus conventional SLT; 7. group SLT versus one‐to‐one SLT (note: for consistency with the analyses this list starts at number 3).
3. Experimental SLT (SLT A) versus conventional SLT (SLT B)
Eleven trials compared the use of an experimental approach to SLT with a more conventional SLT approach (Denes 1996; Di Carlo 1980; Drummond 1981; Hinckley 2001; Lincoln 1982i; Lincoln 1982ii; Lincoln 1984b; Prins 1989; Pulvermuller 2001; Shewan 1984i; Van Steenbrugge 1981). The experimental SLT interventions included a conversational 'ecological' approach (Denes 1996), AMERIND signs used as cues for word‐finding impairment (Drummond 1981), functional SLT approach (Hinckley 2001), operant training (Lincoln 1982i; Lincoln 1982ii), operant training with programmed instruction (Lincoln 1984b), Systematic Therapy for Auditory Comprehension Disorders in Aphasic Patients (STACDAP) (Prins 1989), constraint‐induced therapy (Pulvermuller 2001), language‐oriented SLT (Shewan 1984i) and SLT for naming and constructing sentences (Van Steenbrugge 1981) or filmed programmed instruction intervention (Di Carlo 1980).
Within this comparison we have included data from Lincoln 1982i, Lincoln 1982ii and Lincoln 1984b, which has been extracted from two cross‐over trials (described earlier). Lincoln 1982i and Lincoln 1982ii randomised participants across four groups that compared SLT including an operant training adjunct to SLT with a social support and stimulation adjunct. In both of these trials the means and SD have been extracted from the unpublished individual patient data and is inclusive of the treatment cross‐over period. Given the complementary nature of the cross‐over intervention (SLT plus operant training) or (SLT plus social support) and the clinically relevant nature of the cross‐over treatments we felt it was appropriate to include these data within this section of the review. As recommended, we have also analysed and presented the cross‐over inclusive data from these trials in a graphical format in separate meta‐analyses for readers' information (Analysis 13.1; Analysis 13.2; Analysis 13.3; Analysis 13.4; Analysis 13.5).
All 11 trials evaluating the impact of these specialised SLT interventions did so by comparing them with a conventional SLT approach. However, in Lincoln 1984b the conventional SLT group also had a non‐verbal tasks (matching, copying and recall of designs plus manual dexterity tasks) that acted as a control for the specialist intervention. Similarly, in Lincoln 1982i and Lincoln 1982ii the participants in the conventional SLT group also had access to additional structured social stimulation in the form of topic‐led conversations with the therapist.
A range of outcome measures were used by these trials: (a) functional communication, (b) receptive language, (c) expressive language, (d) severity of impairment, (e) number of dropouts and (f) compliance with allocated intervention. They did not address participants' psychosocial or economic outcomes.
(a) Functional communication
Participants' functional communication skills were measured on the CADL, CETI and the Functional Expression Scale in order to compare the impact of a functional SLT approach and a conventional SLT approach.
CADL
Hinckley 2001 only reported the participants' change‐from‐baseline scores on the CADL, which demonstrated that participants in the conventional SLT group performed significantly better on the CADL than those participants in the functional SLT group (P = 0.001, MD ‐9.30, 95% CI ‐15.01 to ‐3.59). As these were change‐from‐baseline scores they were not included within the meta‐analysis.
CETI
The CETI was used by Hinckley 2001 to compare the groups' functional communication skills as perceived by their carer. Final value scores were reported and are included in the meta‐analysis.
Functional Expression Scale
Two trials reported functional communication skills of participants that had received STACDAP (Prins 1989) or SLT for naming and sentence construction (Van Steenbrugge 1981) as measured on the Functional Expression Scale (Prins 1989; Van Steenbrugge 1981).
Communication Activity Log (CAL)
Pulvermuller 2001 measured functional skills using the CAL but these data were unavailable for inclusion within the review.
No individual trial results available for inclusion within the review demonstrated a significant difference between participants' functional communication skills. On pooling the data using SMD, there was no evidence of a difference between the groups (Analysis 3.1).
Functional communication: catalogue ordering
Hinckley 2001 also developed a functional catalogue ordering task to compare the two groups' functional communication skills using change‐from‐baseline scores. Participants were required to order clothes from a catalogue by telephone (spoken modality) or in writing (written modality). In each modality participants were required to complete the tasks with or without a concurrent task. Participants that received functional SLT performed significantly better on the spoken telephone order task (no concurrent task P = 0.0001, MD 32.80, 95% CI 16.16 to 49.44; with concurrent task P = 0.03, MD 16.90, 95% CI 1.31 to 32.49) than the participants that received the conventional SLT intervention. There was no evidence of any difference between the groups' performance on the written order tasks (Analysis 3.2).
(b) Receptive language
Seven of the 11 trials considered participants' language comprehension skills across a range of comprehension complexities and modalities (Di Carlo 1980; Lincoln 1982i; Lincoln 1982ii; Lincoln 1984b; Prins 1989; Pulvermuller 2001; Shewan 1984i).
Receptive language: word comprehension
Two trials measured participants' ability to understand single words using the Word Naming BDAE subtest (Lincoln 1984b; Prins 1989), the Body Part Identification BDAE subtest (Prins 1989) and the Peabody Picture Vocabulary Test (Lincoln 1984b). After pooling the results where appropriate, there was no indication of a difference between the groups (Analysis 3.3).
Receptive language: other auditory comprehension
Two trials measured participants' ability to comprehend sentences using Miscellaneous Commands (Prins 1989) and the Aphasia Comprehension Test for Sentences (Shewan 1984i). In addition, Prins 1989 measured participants' comprehension skills across a range of levels of complexity on the Amsterdam Aphasia Test (AmAT) Comprehension Subtest while Pulvermuller 2001 tested participants' auditory comprehension skills on the AAT subtest. Appropriate statistical data from Shewan 1984i were unavailable and so could not be included in the meta‐analysis.
Five trials evaluated comprehension skills using the Token Test (Lincoln 1982i; Lincoln 1982ii; Lincoln 1984b; Prins 1989; Pulvermuller 2001). On pooling of the available data there was no evidence of a difference between the participants' auditory comprehension skills based on whether they had received an experimental SLT intervention or a conventional SLT intervention (Analysis 3.4).
Receptive language: auditory comprehension of treated item
Prins 1989 also reported separate results for components of word and sentence comprehension that had been targeted within the experimental STACDAP SLT intervention. Participants' ability to comprehend three tests of word or sentence comprehension that depended on phoneme recognition, lexicon and morphological skills were compared using the Visual Comprehension of Words and Sentences test. There was no evidence of a difference between the groups' performance on treated items during STADCAP SLT or conventional SLT (Analysis 3.5).
Receptive language: reading comprehension
Two trials measured participants' ability to comprehend written words using the Reading Recognition and Reading Comprehension Test (Di Carlo 1980) and the Visual Comprehension of Words and Sentences (Prins 1989). There was no evidence of a difference between the groups on either of these measures (Analysis 3.6).
Receptive language: other comprehension
Three trials measured 'gestural skills' on the PICA subtest, which incorporates subtests of auditory comprehension and reading abilities in addition to measures of gesture abilities (Lincoln 1982i; Lincoln 1982ii; Lincoln 1984b). Following pooling of these data there was no evidence of a difference in the 'gestural' skills of participants that received SLT with operant training and those that received SLT with a placebo adjunct (Analysis 3.7).
(c) Expressive language
Participants' expressive language skills were considered by 10 trials (Denes 1996; Di Carlo 1980; Drummond 1981; Hinckley 2001; Lincoln 1982i; Lincoln 1982ii; Lincoln 1984b; Prins 1989; Pulvermuller 2001; Van Steenbrugge 1981) across a range of levels of complexity from object naming to sentence construction tasks, both oral and written modalities and a range of expressive skills including fluency and repetition.
Expressive language: spoken naming
Seven trials asked participants to name a variety of nouns using the ONT (Lincoln 1982i; Lincoln 1982ii), the AmAT Naming Test (Prins 1989; Van Steenbrugge 1981), 20 items from the Taylor Aphasia Therapy Kit (Drummond 1981), the AAT Naming Subtest (Pulvermuller 2001) and a vocabulary test constructed by Di Carlo 1980 from the Thorndike‐Lorge Word List (Thorndike 1944). We were unable to obtain suitable summary data from Drummond 1981, which prevented inclusion of the data within the meta‐analysis. On pooling, there was no evidence of a difference between the groups' naming skills (Analysis 3.8).
Both Hinckley 2001 and Denes 1996 reported change‐from‐baseline data on their participants' naming skills and this has been presented and pooled within a separate meta‐analysis (Analysis 3.9). Van Steenbrugge 1981 also compared participants' naming skills at a three‐week follow up but again there was no evidence of a difference between the groups (Analysis 3.10).
Expressive language: spoken sentence construction
Prins 1989 and Van Steenbrugge 1981 compared participants' ability to construct sentences but there was no evidence of a difference between the groups neither was there any indication of a difference between the groups at three‐week follow‐up (Van Steenbrugge 1981) (Analysis 3.11).
Expressive language: spoken (treated items)
Participants' expressive language skills on items that had been treated within the specialist Naming and Sentence Construction SLT intervention were compared to participants' abilities following conventional SLT (Van Steenbrugge 1981). There was some trend towards better naming of treated items (P = 0.06) by those that had received task‐specific SLT, with a similar trend observed at three‐week follow‐up but there was no evidence of a difference between the groups' sentence construction skills (Analysis 3.12).
Expressive language: connected discourse
Lincoln 1982i, Lincoln 1982ii and Lincoln 1984b used the PICA Verbal subtest and a picture description task (Lincoln 1982i; Lincoln 1982ii) to compare participants that received an operant training adjunct to SLT and conventional SLT interventions. On pooling of the data there was no evidence of a difference between the groups on these measures (Analysis 3.13).
Expressive language: word fluency
Lincoln 1982i and Lincoln 1982ii compared participants' expressive language skills using word fluency tasks and on pooling found those that received conventional SLT performed better than those that had received an operant training adjunct to SLT (P = 0.005, MD ‐8.19, 95% CI ‐13.90 to ‐2.47) (Analysis 3.14).
Expressive language: repetition
Pulvermuller 2001 and Denes 1996 compared participants' repetition skills following experimental or conventional SLT interventions reporting final value (Pulvermuller 2001) and change‐from‐baseline scores (Denes 1996). The data could not be pooled but there was no evidence of a difference between the groups (Analysis 3.15).
Expressive language: written
Five trials measured participants' written language expressive skills on the PICA Graphic subtest (Lincoln 1982i; Lincoln 1982ii; Lincoln 1984b), the Psycholinguistic Assessments of Language Processing in Aphasia (PALPA) Written Naming subtest (Hinckley 2001) and the AAT Written subtest (Denes 1996). On pooling the PICA data there was some indication of a trend towards better writing skills among the participants that received conventional SLT than those that had received the experimental SLT intervention (P = 0.06, SMD ‐0.66, 95% CI ‐1.35 to 0.03) (Analysis 3.16). Both Hinckley 2001 and Denes 1996 reported change‐from‐baseline data and while there was a significant difference between the groups in Denes 1996 (P = 0.03, SMD 1.20, 95% CI 0.14 to 2.25) on pooling of the data with the Hinckley 2001 data there was no evidence of a significant difference between the groups.
(d) Severity of impairment
Participants' overall severity of aphasia impairment was considered by six trials using the PICA (Lincoln 1982i; Lincoln 1982ii; Lincoln 1984b), the AAT (Denes 1996; Pulvermuller 2001) and the WAB (Shewan 1984i). Suitable data from Shewan 1984i were unavailable while data from Denes 1996 reported change‐from‐baseline scores and so this data could not be included in the meta‐analysis. Following pooling of the data there was no evidence of a difference between the groups (Analysis 3.17). The change‐from‐baseline data from Denes 1996 is presented separately in Analysis 3.18.
(e) Number of dropouts
Only three trials reported a loss of participants during the study (Lincoln 1982i; Lincoln 1982ii; Shewan 1984i). No participants were lost from the other eight trials. Thirteen participants were lost across the four groups in Lincoln 1982i and Lincoln 1982ii but it is unclear which groups these participants had been randomised to. In contrast, Shewan 1984i reported that six participants dropped out from the language‐orientated SLT intervention while only one dropped out of the conventional SLT group. There was no significant difference between the numbers of participants lost to each intervention (Analysis 3.19).
(f) Compliance with allocated intervention
As described above, only one trial provided details of the participants that dropped out of their trial (Shewan 1984i) with three withdrawing from the language‐orientated SLT intervention and none voluntarily withdrawing from the conventional SLT group (Analysis 3.20).
4. High‐intensity SLT (SLT A) versus low‐intensity SLT (SLT B)
Six trials compared a high‐intensity SLT intervention with a low‐intensity SLT intervention (Bakheit 2007; Denes 1996; ORLA 2006; Pulvermuller 2001; Smith 1981ii; VERSE 2011). The number of weekly hours in therapy for participants in the high‐intensity SLT groups was 400 minutes (VERSE 2011), four hours (Smith 1981ii), five hours (Bakheit 2007; Denes 1996), 10 hours (ORLA 2006), or up to 20 hours (Pulvermuller 2001) each week while the low‐intensity SLT groups received one hour (VERSE 2011), 1.5 hours (Smith 1981iii), two hours (Bakheit 2007), three hours (Denes 1996), four hours (ORLA 2006) or 15 hours (Pulvermuller 2001) each week. Statistical data for communication outcomes were only available for five trials (Bakheit 2007; Denes 1996; ORLA 2006;Pulvermuller 2001; VERSE 2011) and comparisons were made by measuring participants' (a) functional communication, (b) receptive language, (c) expressive language, (d) severity of impairment, (e) psychosocial impact, (f) number of dropouts and (g) compliance with allocated intervention. Economic outcome measures were not reported.
(a) Functional communication
VERSE 2011 measured participants' functional communication using the FCP and Discourse Analysis (DA) scores relating to informativeness and efficiency (Nicholas 1995) at acute hospital discharge and again at six months post onset. The group that received high‐intensity SLT had better function communication as measured on the FCP (P = 0.01) and using DA (P = 0.04) than those that had SLT of low intensity (Analysis 4.1). These differences no longer remained at the six‐month follow‐up point though a trend towards improved FCP scores for the group that had under gone high‐intensity SLT remained (P = 0.06).
(b) Receptive language
Measures of participants' receptive language skills were only available for Denes 1996 and Pulvermuller 2001. Both trials measured participants' auditory comprehension using the Aachen Aphasia Test (AAT) comprehension subtest and the Token Test. The final value scores reported by Pulvermuller 2001 are presented separately (Analysis 4.3) from the change‐from‐baseline scores reported by Denes 1996 (Analysis 4.4). There was no indication of a significant difference between the comprehension skills of those participants that had received high‐intensity SLT and those that had received low‐intensity SLT.
(c) Expressive language
Two trials compared the expressive language skills of participants that received a high‐intensity SLT with those that received a low‐intensity SLT intervention (Denes 1996; Pulvermuller 2001) on naming, repetition and writing tests.
Expressive language: spoken
Pulvermuller 2001 reported the findings from the AAT Naming and Repetition subtests. There was no indication of a difference between the groups (Analysis 4.5). Though Denes 1996 also measured expressive language skills using the AAT Naming and Repetition subtests only the groups' change‐from‐baseline scores were available and so they could not be pooled with the data from Pulvermuller 2001 (Analysis 4.6). There was no evidence of a difference between the groups on either of these measures.
Expressive language: written
Denes 1996 used the AAT Written subtest to compare changes‐from‐baseline in participants' written language (including reading aloud and writing subtests). The group that was given high‐intensity SLT achieved significantly higher scores on this subtest than the group that received the low‐intensity SLT intervention (P = 0.01, MD 8.9, 95% CI 1.81 to 15.99) (Analysis 4.7).
(d) Severity of impairment
Six trials (Bakheit 2007; Denes 1996; ORLA 2006; Pulvermuller 2001; Smith 1981iii; VERSE 2011) compared participants' overall level of aphasia severity following interventions that varied in intensity by using the WAB and the AAT. Smith 1981iii used the MTDDA to measure participants' aphasia severity but suitable statistical data allowing inclusion in the meta‐analysis were unavailable and so it could not be included within this comparison. The groups that received high‐intensity SLT performed significantly better on measures of aphasia severity than those that received a low‐intensity SLT intervention (P = 0.03, SMD 0.35, 95% CI 0.04 to 0.66) (Analysis 4.8).
Denes 1996 provided change‐from‐baseline scores on the AAT and these could not be pooled with the final value scores reported above. There was no indication of a difference between the groups on this measure (Analysis 4.9).
On follow‐up measures at three months there was no evidence of a difference between the groups within the Bakheit 2007 trial but the participants that received the high‐intensity SLT in the VERSE 2011 trial continued to perform significantly better than the usual SLT group even at six‐month follow‐up (P = 0.04, MD 19.86, 95% CI 0.81 to 38.90) (Analysis 4.10).
(d) Psychosocial
Smith 1981iii used the GHQ to compare groups receiving high‐intensity SLT and low‐intensity SLT. Appropriate summary data for these groups were unavailable and so the results could not be presented here.
(e) Number of dropouts
Data relating to number of participants that dropped out of the trials were available for Bakheit 2007, Denes 1996, ORLA 2006, Pulvermuller 2001 and VERSE 2011 and were partially available for Smith 1981iii. No participants appear to have been lost from the treatment or follow‐up time points in the Denes 1996, ORLA 2006 or Pulvermuller 2001 studies. Five additional participants were excluded from the final analysis in Smith 1981iii (three were found not to have aphasia and two died) but their group allocation was unclear. These data were not included in this overview.
Across the trials significantly more participants (41 participants) were lost to the high‐intensity SLT intervention groups in comparison to those lost to low‐intensity SLT interventions (23 participants) (P = 0.03, OR 2.01, 95% CI 1.07 to 3.79). Of these, some were lost at follow‐up (seven from high‐intensity SLT and six from the low‐intensity SLT group; Bakheit 2007 and VERSE 2011) (Analysis 4.11).
(f) Compliance with allocated intervention
Bakheit 2007 (in part) and VERSE 2011 reported the reasons for loss of participants from within the study. Of these, five participants voluntarily withdrew from the high intensity SLT group during the treatment phase while one withdrew from the low intensity groups. There was no significant difference between the groups on this measure.
5. Group SLT (SLT A) versus one‐to‐one SLT (SLT B)
Three trials compared a group‐based SLT intervention with conventional one‐to‐one SLT (Pulvermuller 2001; Wertz 1981; Yao 2005iii). Within the group SLT interventions, participants received SLT in groups of three plus a therapist (Pulvermuller 2001), between three to seven (Wertz 1981) or 10 patients (Yao 2005iii). Participants allocated to group SLT in Pulvermuller 2001 received a constraint‐induced language therapy approach to SLT (only verbal responses were allowed). In contrast, the group SLT intervention in Wertz 1981 encouraged group discussion and recreational activities with a therapist while Yao 2005iii focused on 'collective language strengthening training'. In all cases the patients in the one‐to‐one SLT intervention received conventional SLT (stimulus‐response treatment across all modalities). Between‐intervention comparisons were made on a variety of measures: (a) functional communication, (b) receptive language, (c) expressive language, (d) severity of impairment, (e) number of dropouts and (f) compliance with allocated intervention. Psychosocial and economic measures were not compared.
(a) Functional communication
Two trials measured change in functional communication using the CAL (Pulvermuller 2001), the Conversational Rating Scale (CRS) (Wertz 1981) and the Informants Rating of Functional Language (adapted form of the FCP) (Wertz 1981). However, suitable statistical data were unavailable from these measures and so could not be included within the review. A later study took a subset of data from the Wertz 1981 trial and evaluated their functional communication using the Pragmatic Protocol at one month, six months and 12 months after the intervention. There was no evidence of a difference between the groups' performance on this measure.
(b) Receptive language
Receptive language: auditory comprehension
Two trials measured participants' receptive language skills using the Token Test (Pulvermuller 2001; Wertz 1981) and the language comprehension subtest of the AAT (Pulvermuller 2001). Mean values were reported for Wertz 1981 but the SD values were unavailable. To facilitate inclusion of these data within the review, the SD value (13.93) has been imputed from the Lincoln 1982 Token Test summary data. The reason for choosing this value was both Wertz 1981 and Lincoln 1982 used the same form of the Token Test and used it to measure the language skills of similar participant groups. On pooling these data with the Token Test data from the Pulvermuller 2001 comparison, there was no evidence of a difference between the groups' auditory comprehension skills, neither was there any indication of a difference between the groups on the AAT comprehension subtest (Pulvermuller 2001) (Analysis 5.2).
Receptive language: other
Wertz 1981 used the PICA Gestural subtest to compare participants that had received group SLT and those that had received one‐to‐one SLT. Though the mean values were available to the review the SD values were unavailable. A SD value (25.67) was identified and imputed from Wertz 1986 where the highest of three possible values in this trial from relevant clinical groups was chosen to facilitate inclusion of the study within the review. There was no evidence of a difference between the groups (Analysis 5.3).
(c) Expressive language
Expressive language: spoken
Pulvermuller 2001 and Wertz 1981 measured participants' expressive language skills using the naming subtest of the AAT, measures of word fluency, and the PICA verbal subtest. Using the AAT naming subtest Pulvermuller 2001 found no evidence of a difference between the groups' expressive language skills. Wertz 1981 used the verbal subtest of the PICA to measure participants' language comprehension skills. The mean scores of participants that received group SLT and those that received one‐to‐one SLT were available but SD data were not. A SD value (20.01) was identified and imputed from Wertz 1986 where the highest of three possible values in this trial from relevant clinical groups was chosen to facilitate inclusion of the study within the review. There was no evidence of a difference between the groups (Analysis 5.4).
Expressive language: word fluency
Measures of word fluency were used by Wertz 1981 to compare participants' word‐finding skills. Mean values for the participants receiving group SLT and those receiving one‐to‐one SLT were reported but no SDs were available and so these data could not be included in this review.
Expressive language: repetition
Participants' repetition abilities were compared by Pulvermuller 2001 using the AAT repetition subtest and no evidence of a difference between the groups was found (Analysis 5.5).
Expressive language: written
Wertz 1981 used the Graphic subtest of the PICA to compare participants' written language skills. Mean values for those participants that received group SLT and those that received one‐to‐one SLT were reported but SDs were unavailable. As with the other PICA data from Wertz 1981, a SDvalue (21.74) was identified and imputed from Wertz 1986 where the highest of three possible values in this trial from relevant clinical groups was chosen to facilitate inclusion of the study within the review (Analysis 5.6). There was no evidence of a difference between the groups.
(d) Severity of impairment
Three trials measured the severity of participants' aphasia following one‐to‐one and group SLT interventions using the CRRCAE (Yao 2005iii), the PICA (Wertz 1981) and the AAT (Pulvermuller 2001). Summary data from Yao 2005iii and Pulvermuller 2001 were available for inclusion within the meta‐analysis. Though the mean values for Wertz 1981 trial were available, the SD data were missing. We imputed a SD value (24.64) from Wertz 1986 to facilitate inclusion of the data within the review. There was no evidence of a difference between the scores of participants that received group SLT and those that received one‐to‐one SLT on this measure (Analysis 5.7). On follow‐up at three months the participants that had received group SLT performed significantly better on the CRRCAE than those that had received one‐to‐one SLT (P < 0.0001, MD 33.41, 95% CI 16.76 to 50.06) (Analysis 5.8).
(e) Number of dropouts
Information on the number of participants leaving during the trials were available for all three trials (Pulvermuller 2001; Wertz 1981; Yao 2005iii). Two trials experienced no dropouts (Pulvermuller 2001; Yao 2005iii). In contrast, almost half of those randomised in Wertz 1981 failed to remain in the study (33 dropouts) but there was no evidence of a difference in the numbers lost to each intervention (Analysis 5.9).
(f) Compliance with allocated intervention
Twenty‐two participants in the Wertz 1981 trial were reported to have returned home or declined to travel to receive the allocated treatment intervention (see Table 2) but further details on the exact number of participants declining the interventions or how these numbers are split across groups was unavailable.
6. Volunteer‐facilitated SLT (SLT A) versus professional‐facilitated SLT (SLT B)
Four trials compared participants that received volunteer‐facilitated SLT and participants that received SLT provided directly by a professional therapist (Leal 1993; Meikle 1979; Meinzer 2007; Wertz 1986iii). In most cases professional SLT was delivered by a speech and language therapist (Leal 1993; Meikle 1979; Wertz 1986iii) though delivery of the constraint‐induced SLT intervention in Meinzer 2007 was delivered by a specialist psychologist. We believed that this trial was suitable for inclusion in this comparison as it compared interventions delivered by a professional clinician with delivery facilitated by a trained volunteer.
Most volunteers were family members (Leal 1993; Meinzer 2007; Wertz 1986iii) although some trialists also engaged friends (Wertz 1986iii) or recruited volunteers unknown to the participants (Meikle 1979; Wertz 1986iii). Volunteer groups across the trials all received SLT training, information on their patient's communication impairment, access to working materials or equipment, and ongoing support or supervision. Most studies indicated that the professional therapist was accountable for, or informed the design and content of, the volunteer‐facilitated SLT (Meikle 1979; Meinzer 2007; Wertz 1986iii).
The professional therapists were based in a formal or clinical setting (Leal 1993; Meikle 1979; Meinzer 2007; Wertz 1986iii). The duration of the professional SLT interventions varied from three hours daily for 10 consecutive days (Meinzer 2007) or up to three hours (Leal 1993), four hours (Meikle 1979) or 10 hours weekly for approximately three months (Wertz 1986iii), six months (Leal 1993) or an average of nine months (SD 22 weeks) (Meikle 1979). The duration of volunteer‐facilitated SLT and professionally delivered SLT was the same for two trials (Meinzer 2007; Wertz 1986iii). The volunteers in Meikle 1979 visited participants four times weekly over a shorter period of time (average of five months (SD 13.5 weeks)) while the duration of the volunteer‐facilitated SLT in Leal 1993 is unclear. The four trials used a range of measures to compare volunteer‐facilitated SLT with professional SLT delivery including (a) functional communication, (b) receptive language, (c) expressive language, (d) written language, (e) severity of impairment, (f) number of dropouts and (g) compliance with allocation. Psychosocial and economic measures were not compared.
(a) Functional communication
Only Wertz 1986iii formally measured the functional communication skills of the participants that received volunteer‐facilitated SLT or professional SLT using the CADL and the FCP. There was no evidence of a difference between the groups (Analysis 6.1).
(b) Receptive language
Receptive language: auditory comprehension
Three trials evaluated participants' language comprehension abilities using the Token Test (Leal 1993; Meinzer 2007; Wertz 1986iii) but suitable statistical data were unavailable for Leal 1993. Meinzer 2007 and Wertz 1986iii used the Token Test to measure differences in the auditory comprehension of participants that received volunteer‐facilitated SLT and those that received professional therapy input. There was no significant difference between the two groups' auditory comprehension (Analysis 6.2). The comprehension subtest of the AAT measures both auditory and reading comprehension and was used by Meinzer 2007 to compare a group receiving volunteer‐facilitated SLT or SLT delivered by experienced professionals. There was no evidence of a difference between the groups' comprehension on these measures (Analysis 6.2).
Receptive language: reading comprehension
Wertz 1986iii measured participants' reading comprehension using the RCBA. There was no evidence of a difference between the groups. Data from the AAT that Meinzer 2007 used to measure both auditory and reading comprehension is also presented (but not pooled) in this section (Analysis 6.3).
Receptive language: other
Wertz 1986iii compared participants' receptive language skills using the PICA Gestural subtest. There was no evidence of a difference between the groups (Analysis 6.4).
(c) Expressive language
Expressive language: spoken
Meinzer 2007 measured expressive language skills using the Naming subtest of the AAT while Wertz 1986iii used the PICA Verbal subtest to compare participants that received volunteer‐facilitated SLT and those that received professional SLT. There was no evidence of a difference between the groups (Analysis 6.5).
Expressive language: repetition
The group that received the volunteer‐facilitated SLT intervention in Meinzer 2007 scored significantly higher on the Repetition subtest (AAT) than those that received SLT from a professional therapist (P = 0.05, MD 13.50, 95% CI 0.19 to 26.81) (Analysis 6.6).
Expressive language: written
The Written Language subtest of the AAT measures reading aloud and writing to dictation. Meinzer 2007 compared the groups that received volunteer‐facilitated SLT and those that received professionally delivered SLT using this measure. Similarly, Wertz 1986iii used the PICA Graphic subtest to compare the groups. They found no evidence of a difference (Analysis 6.7).
(d) Severity of impairment
Four trials compared the two groups using measures of overall severity of aphasia following either volunteer‐facilitated SLT or professional SLT using the PICA (Meikle 1979; Wertz 1986iii), an AQ (Leal 1993) and the AAT profile (Meinzer 2007). Summary data from the groups' performance was unavailable for Leal 1993 preventing inclusion within the review. There was no evidence of a difference between the two groups following pooling of data from the PICA and AAT profile (Analysis 6.8).
(e) Number of dropouts
All four trials reported the number of participants that were lost to the trial following randomisation. Across three trials a total of 30 participants were lost from the groups that experienced volunteer‐facilitated SLT while 22 participants were lost from the groups that received professional SLT interventions (Leal 1993; Meikle 1979; Wertz 1986iii). Meinzer 2007 experienced no participant withdrawals. An additional participant that had received volunteer‐facilitated SLT and two participants that had received professional SLT were lost at follow‐up (Wertz 1986iii). No participants were reported lost at follow‐up from Leal 1993. Overall, there was no evidence of a difference in the numbers of dropouts between the groups that received volunteer‐facilitated SLT and those that had professionally delivered SLT (Analysis 6.9).
(f) Compliance with allocated intervention
Only two of the three trials provided details for participant withdrawals (Leal 1993; Meikle 1979). Overall there was no difference between the groups. Five participants declined to continue participating in the volunteer‐facilitated SLT groups while four declined in the professional SLT groups (Analysis 6.10).
7. Computer‐facilitated SLT (SLT A) versus professional‐facilitated SLT (SLT B)
One RCT evaluated the SLT delivered by a computer interface with SLT delivered by a professional therapist (ORLA 2010). All 25 participants received 24 one‐hour sessions of an Oral Reading for Language in Aphasia (ORLA) treatment. The rate of delivery of therapy varied from one session per week up to four sessions per week for one participant with an overall mean of 12.26 weeks (range six to 22 weeks). There was no significant difference in the number of treatment weeks between the groups. All participants had aphasia for at least 12 months. The trial compared computer‐facilitated SLT with professional SLT delivery across a range of measures including (a) functional communication, (b) receptive language, (c) expressive language, (d) severity of impairment and (f) number of dropouts. Psychosocial and economic measures were not captured.
(a) Functional communication
ORLA 2010 reported two measures of discourse efficiency on picture description and narrative discourse tasks ‐ words per minute and content information units per minute (Nicholas 1995). There was no indication of a difference between the two groups discourse efficiency on connected speech samples (Analysis 7.1).
(b) Receptive language
Participants' reading comprehension was compared using the WAB Reading Comprehension subtest. There was no indication of a difference between the reading skills of participants that had followed a computer‐facilitated SLT intervention with those that had followed a professional therapist‐facilitated SLT intervention (Analysis 7.2).
(c) Expressive language
The expressive language skills of the two groups were compared using the WAB Writing subtest. There was no evidence of a difference between the two groups (Analysis 7.3).
(d) Severity of impairment
The WABAQ demonstrated no significant difference between the participants that had followed the ORLA SLT via a computer interface and those that had accessed it via a professional therapist (Analysis 7.4).
(f) Number of dropouts
No participants randomised to the ORLA 2010 were lost during the study.
8. Semantic SLT (SLT A) versus phonological SLT (SLT B)
RATS randomised 58 participants to receive either semantic SLT or phonological SLT. The semantic SLT approach focused on improving semantic processing by employing semantic decision tasks at word, sentence and text level while the phonological SLT approach focused on sound structure by targeting phonological input and output. Between‐group comparisons were made on the basis of (a) functional communication, (b) receptive language, (c) expressive language, (d) number of dropouts and (e) compliance with allocated intervention. The psychosocial impact, severity of impairment and economic outcomes were not measured.
(a) Functional communication
RATS used the ANELT‐A to compare groups that received semantic SLT to those that received phonological SLT. There was no evidence of a difference between the two groups' functional communication skills (Analysis 8.1).
(b) Receptive language
Receptive language: auditory comprehension
Participants' auditory comprehension skills were measured by RATS using the Semantic Association Test (SAT) and the Auditory Lexical Decision subtests of the PALPA. Using change‐from‐baseline values there was no evidence of a difference between the groups on the SAT but the group that received the phonological SLT improved significantly more on the Auditory Lexical Decision subtest than those that received semantic SLT (P = 0.01, MD ‐3.50, 95% CI ‐6.23 to ‐0.77) (Analysis 8.2).
Receptive language: reading
RATS also measured the two groups' synonym judgements using a subtest of the PALPA. This test required both synonym judgement and reading comprehension abilities. There was no evidence of a difference between the groups (Analysis 8.3).
(c) Expressive language: repetition
The only measure of expressive skill used by RATS was that of the PALPA Non‐Word Repetition subtest. There was no evidence of a difference between the two groups (Analysis 8.4).
(d) Number of dropouts
RATS reported the loss from follow‐up of a total of 12 participants. Equal numbers were lost from both the semantic SLT and the phonological SLT groups (Analysis 8.5).
(e) Compliance with allocated intervention
Reasons for the loss of 12 participants from the treatment phase were given by RATS. Within the semantic SLT group four participants received less than 40 hours of the planned treatment intervention while in the phonological SLT group two participants received less than 40 hours of treatment and two participants declined to complete the final assessment. There was no evidence of a difference between the groups.
9. Cognitive‐linguistic SLT (SLT A) versus communicative SLT (SLT B)
RATS‐2 randomised 80 participants to receive a cognitive‐linguistic approach to SLT (SLT A) or a communicative approach to SLT. The cognitive‐linguistic SLT approach focused on improving linguistic aspects of language impairment by employing semantic, phonological or syntax tasks while the communicative therapy focused on improving information exchange using compensation strategies and residual language skills. Between‐group comparisons were made on the basis of (a) functional communication, (b) receptive language, (c) expressive language, (d) number of dropouts and (e) compliance with allocated intervention. The psychosocial impact, severity of impairment and economic outcomes were not measured.
(a) Functional communication
The ANELT‐A was used to compare participants that received cognitive‐linguistic SLT to those that received communicative SLT. There was no evidence of a difference between the two groups' functional communication skills at the end of treatment (Analysis 9.1).
(b) Receptive language
The participants' receptive language skills were compared on the Token Test, the SAT, the PALPA Sematic Association and the Auditory Lexical Decision subtests. There was no evidence of a difference between the groups on any of these measures (Analysis 9.2).
(c) Expressive language
RATS‐2 compared the word fluency (letters and semantic) and repetition skills of participants that had received a cognitive‐linguistic SLT intervention and those that had received a communicative SLT intervention. There was no evidence of a significant difference between the groups on either of these measures (Analysis 9.3; Analysis 9.4).
(d) Number of dropouts
A total of 10 individuals dropped out from the trial with fewer participants lost from the cognitive‐linguistic SLT group (four participants) than the communicative SLT group (six participants). There was no significant difference between the numbers lost from each group (Analysis 9.5).
(e) Compliance with allocated intervention
Five individuals across the trial declined to continue therapy and all had been allocated to the communicative SLT group. One participant's therapist refused to provide the allocated cognitive‐linguistic SLT intervention. This difference did not reach a level of statistical significance (Analysis 9.6).
10. Verb comprehension SLT (SLT A) versus preposition comprehension SLT (SLT B)
Crerar 1996 compared a computer‐mediated verb comprehension SLT with a computer‐mediated preposition comprehension SLT. The trial was a cross‐over design and only data collected prior to the point of cross‐over have been included in the review. The participant group included people with acquired language impairment as a result of other neurological causes and some participants in the main trial were not truly randomly allocated to an intervention, undergoing a quasi‐random allocation as a result of their language impairment profile, transport situation or geographical location. Only the data from participants with aphasia as a result of stroke that underwent an adequate randomisation procedure were extracted and included in the review. The comparisons between the group that received verb comprehension therapy (n = 3) and those that received preposition comprehension therapy (n = 5) were made on measures of (a) receptive language, (b) expressive language, (c) severity of impairment and (d) number of dropouts. Functional outcomes, psychosocial impact, severity of impairment and economic outcomes were not measured.
(a) Receptive language
Participants' receptive language skills were compared using the WAB Auditory Comprehension subtest and a range of reading comprehension tests based on treated and untreated verb and preposition items. There was no evidence of a significant difference between those individuals that had undergone verb comprehension SLT and those that had undergone preposition SLT on any of these measures (Analysis 10.1; Analysis 10.2).
(b) Expressive language
The expressive language skills of participants were compared using the WAB Naming, Fluency and Repetition subtests. There was no evidence of a difference between the two groups' naming or fluency skills as measured on these subtests (Analysis 10.3).
(c) Severity of impairment
Crerar 1996 used the WABAQ to compare participants overall aphasia severity following verb or preposition comprehension therapy. There was no evidence of a significant difference between the two groups on this measure (Analysis 10.4).
(d) Number of dropouts
No randomised participants were reported to have dropped out from Crerar 1996.
11. Functional SLT (SLT A) versus conventional SLT (SLT B)
The randomised comparisons of a functional SLT intervention with a conventional SLT intervention are presented separately within the data and analysis tables (Analysis 11.1 to Analysis 11.4) for information purposes.
12. Constraint‐inducted language therapy (SLT A) versus conventional SLT (SLT B)
The randomised comparisons of a constraint‐induced language therapy SLT intervention with a conventional SLT intervention are presented separately within the data analysis tables (Analysis 12.1 to Analysis 12.4) for information purposes.
13. Operant training SLT (SLT A) versus conventional SLT (SLT B)
The randomised comparisons taken from the cross‐over trials which compared an operant training SLT intervention with a conventional SLT intervention plus an attention control are presented separately within the data and analysis tables (Analysis 13.1 to Analysis 13.5) for information purposes.
Summary of results
1. SLT versus no SLT (19 trials)
-
Functional communication: 11 trials (data from eight) five measures; functional communication favours SLT (P = 0.008).
-
Receptive language: eight trials (data from eight); eight measures; reading comprehension favours SLT (P = 0.05); PICA gestural subtest favours SLT (P = 0.02).
-
Expressive language: eight trials (data from eight) eleven measures; expressive language general subtest favours SLT (P = 0.02); expressive language written subtest favours SLT (P = 0.002).
-
Severity of impairment: 15 trials (data from 11) eight measures; no evidence of a difference.
-
Psychosocial impact: five trials (data from one); six measures; no evidence of a difference.
-
Dropouts: 19 trials (data from 19); no evidence of a difference.
-
Compliance: 11 trials (data from three); no evidence of a difference.
-
Economic outcomes: one trial (no data).
2. SLT versus social support and stimulation (seven trials)
-
Functional communication: three trials (data from two); four measures; no evidence of a difference.
-
Receptive language: four trials (data from two); five measures; PICA subtest favours social support and stimulation group (P = 0.04); no other evidence of a difference.
-
Expressive language: three trials (data from two); six measures; ONT and Word Fluency favours social support and stimulation group (P = 0.003 and P < 0.0001); CHSPT (treated items) favours SLT (P = 0.01); PICA Verbal and Graphic subtests favour social support and stimulation group (P = 0.0007 and P = 0.01).
-
Severity: four trials (data from one); two measures; PICA favours social support and stimulation group (P = 0.005).
-
Psychosocial impact: two trials (data from one); no evidence of a difference.
-
Dropouts: seven trials (data from six); dropouts favour SLT (P = 0.007).
-
Compliance: five trials (data from five); dropouts favour SLT (P < 0.00001).
-
Economic outcomes: not measured.
3. SLT A versus SLT B (25 trials)
Experimental SLT versus conventional SLT (11 trials)
-
Functional communication: four trials (data from three); six measures; telephone ordering favours functional SLT; no other evidence of a difference.
-
Receptive language: seven trials (data from five); 12 measures; no evidence of a difference.
-
Expressive language: 10 trials (data from nine); 16 measures; word fluency favours conventional SLT (P = 0.005); no other evidence of a difference.
-
Severity of impairment: six trials (data from five); three measures; no evidence of a difference.
-
Psychosocial impact: not measured.
-
Dropouts: 11 trials (data from 9); no evidence of a difference.
-
Compliance: one trial (data from one); no evidence of a difference.
-
Economic outcomes: not measured.
Intensive versus conventional SLT (six trials)
-
Functional communication: one trial (data from one) two measures; favours intensive SLT (P = 0.01 and P = 0.04).
-
Receptive language: two trials (data from two); two measures; no evidence of a difference.
-
Expressive language: two trials (data from two); three measures; written language favours intensive SLT (P = 0.01); no other evidence of a difference.
-
Severity of impairment: six trials (data from five); three measures; favours intensive SLT (P = 0.03) and at six‐month follow‐up (P = 0.04).
-
Psychosocial impact: one trial (no data).
-
Dropouts: six trials (data from six); favours less intensive SLT (P = 0.03).
-
Compliance: two trials (data from two); no evidence of a difference.
-
Economic outcomes: not measured.
Group SLT versus conventional SLT (three trials)
-
Functional communication: two trials (no data); four measures; no evidence of a difference.
-
Receptive language: two trials (data from two); three measures; no evidence of a difference.
-
Expressive language: two trials (data from two); five measures; no evidence of a difference.
-
Severity of impairment: three trials (data from three); three measures; CRRCAE favoured group SLT at three‐month follow‐up (P < 0.0001); no other evidence of a difference.
-
Psychosocial impact: not measured.
-
Dropouts: three trials (data from three); no evidence of a difference.
-
Compliance: one trial (no data).
-
Economic outcomes: not measured.
Volunteer‐facilitated SLT versus professional SLT (four trials)
-
Functional communication: one trial (data from one); two measures; no evidence of a difference.
-
Receptive language: three trials (data from two); four measures; no evidence of a difference.
-
Expressive language: two trials (data from two); five measures; AAT Repetition subtest favoured volunteer‐facilitated SLT (P = 0.05); no other evidence of a difference.
-
Severity of impairment: four trials (data from three); three measures; no evidence of a difference.
-
Psychosocial impact: not measured.
-
Dropouts: four trials (data from four); no evidence of a difference.
-
Compliance: three trials (data from two); no evidence of a difference.
-
Economic outcomes: not measured.
Computer‐mediated SLT versus professional SLT (one trial)
-
Functional communication: one trial (data from one); two measures; no evidence of a difference.
-
Receptive language: one trial (data from one); one measure; no evidence of a difference.
-
Expressive language: one trial (data from one); one measure; no evidence of a difference.
-
Severity of impairment: one trial (data from one); one measure; no evidence of a difference.
-
Psychosocial impact: not measured.
-
Dropouts: one trial (data from one); no evidence of a difference.
-
Compliance: no evidence of a difference.
-
Economic outcomes: not measured.
Semantic SLT versus phonological SLT (one trial)
-
Functional communication: one trial (data from one); one measure; no evidence of a difference.
-
Receptive language: one trial (data from one); three measures; Auditory Lexical Decision favoured phonological SLT (P = 0.01); no other evidence of a difference.
-
Expressive language: one trial (data from one); one measure; no evidence of a difference.
-
Severity of impairment: not measured.
-
Psychosocial impact: not measured.
-
Dropouts: one trial (data from one); no evidence of a difference.
-
Compliance: one trial (data from one); no evidence of a difference.
-
Economic outcomes: not measured.
Cognitive‐linguistic SLT versus communicative SLT (one trial)
-
Functional communication: one trial (data from one); one measure; no evidence of a difference.
-
Receptive language: one trial (data from one); four measures; no evidence of a difference.
-
Expressive language: one trial (data from one); three measures; no evidence of a difference.
-
Severity of impairment: not measured.
-
Psychosocial impact: not measured.
-
Dropouts: one trial (data from one); no evidence of a difference.
-
Compliance: one trial (data from one); no evidence of a difference.
-
Economic outcomes: not measured.
Verb comprehension SLT versus preposition comprehension SLT (one trial)
-
Functional communication: not measured
-
Receptive language: one trial (data from one); 10 measures; no evidence of a difference.
-
Expressive language: one trial (data from one); three measures; no evidence of a difference.
-
Severity of impairment: one trial (data from one); one measure; no evidence of a difference.
-
Psychosocial impact: not measured.
-
Dropouts: one trial (no dropouts); no evidence of a difference.
-
Compliance: one trial (no dropouts); no evidence of a difference.
-
Economic outcomes: not measured.
Functional SLT versus conventional SLT (one trial)
-
Functional communication: one trial (data from one); six measures; CADL change‐from‐baseline favours conventional SLT (P = 0.001); Telephone Ordering Task (with and without concurrent task) favours functional SLT (P = 0.0001 and P = 0.03).
-
Receptive language: not measured.
-
Expressive language: one trial (data from one); two measures; no evidence of a difference.
-
Severity of impairment: not measured.
-
Psychosocial impact: not measured.
-
Dropouts: one trial (data from one); no dropouts.
-
Compliance: not applicable.
-
Economic outcomes: not measured.
Constraint‐induced language therapy (SLT A) versus conventional SLT (one trial)
-
Functional communication: not measured
-
Receptive language: one trial (data from one); two measures; no evidence of a difference.
-
Expressive language: one trial (data from one); two measures; no evidence of a difference.
-
Severity of impairment: one trial (data from one); one measure; no evidence of a difference.
-
Psychosocial impact: not measured.
-
Dropouts: one trial (data from one); no dropouts.
-
Compliance: one trial (no data).
-
Economic outcomes: not measured
Operant training versus conventional SLT (three trials)
-
Functional communication: not measured
-
Receptive language: three trials (data from three); four measures; no evidence of a difference.
-
Expressive language: three trials (data from three); five measures; word fluency and PICA Graphic subtest favours conventional SLT (P = 0.02 and P = 0.05); no other evidence of a difference.
-
Severity of impairment: three trials (data from three); one measure; favours conventional SLT (P = 0.05).
-
Psychosocial impact: not measured.
-
Dropouts: two trials (no data).
-
Compliance: two trials (no data).
-
Economic outcomes: not measured.
Discussion
We updated this complex review of the effectiveness of SLT interventions for people with aphasia following stroke to reflect new evidence and developments in clinical practice. We assessed whether (1) SLT is more effective than no SLT, (2) SLT is more effective than social support and stimulation and (3) one SLT intervention is more effective than another. The data from nine additional trials were identified, synthesised and presented together with data from 30 trials included in the 2010 review.
Summary of main results
SLT versus no SLT
A total of 2518 participants were randomised across 51 randomised comparisons. Nineteen compared participants who received SLT with those who did not. Significant differences between the groups' scores were evident in measures of functional communication, receptive language and expressive language, all of which favoured the provision of SLT. However, significant differences were not evident across all measures, sample sizes remain small and there is some indication of one or two trials' highly significant findings impacting upon the meta‐analyses.
We observed notable statistical heterogeneity among some of the SLT versus no SLT comparisons (e.g. expressive language: general I2 = 76% and the severity of impairment comparison I2 = 93%). In addition, we also noted measures based on either the Aphasia Battery of Chinese or the Chinese Aphasia Measurement tools fell out with the associated funnel plots' 95% CI. While we might expect that a proportion (5%) of the results would be observed in this manner by chance, the frequency of the observation is above what we might expect to occur by chance alone.
There are a number of possible explanations for these observations and the Cochrane Handbook for Systematic Reviews of Interventions suggests consideration of several possible sources of heterogeneity and such asymmetry in funnel plots including selection bias, poor methodological quality, true heterogeneity, artefact or chance (Higgins 2011). Zhang 2007i, Zhang 2007ii and Zhao 2000 are based in China where SLT interventions are delivered by doctors and nurses rather than by professional therapists as might be observed within the other trials in this meta‐analysis. Other aspects of stroke care may also have differed. We also have limited information on the study populations included within these trials, particularly from the Zhao 2000 trial, which does not report time post onset, patient demographics or aphasia severity. Information on the methodological design is also very limited particularly in relation to the randomisation, concealment of allocation and blinding of outcome assessors.
Abstracts of these Chinese trials were published in English, which may have required the contribution of professional translators unfamiliar with some of the technical specifications of methodological terms used in health services research. Within the articles it is simply reported that the participants within these trials were randomised to the different interventions and thus they were eligible for inclusion within this review. Our attempts to access trial details similarly required translation of the trial reports, which may also have introduced some discrepancies between the original meaning of the trialists and our translations. The exact nature of the randomisation processes is unclear and if we look at the sample sizes of the groups within Zhao 2000 there is considerable imbalance between the numbers that received SLT (98 participants) and those that did not (40 participants), which raises further questions regarding the randomisation process employed within this particular study.
Some of the tools (and subtests of these tools) used within these trials (such as the Aphasia Battery of Chinese or the Chinese Aphasia Measurement) are unknown to us. Our pooling of data relating to 'verbal presentation' may not exactly capture the same aspects of verbal expression as other tools within our meta‐analysis. Similarly issues relating to the tools' validity and reliability are unclear.
Despite our best efforts we have failed to communicate with the Zhang 2007i, Zhang 2007ii or Zhao 2000 trialists to confirm or obtain clarification on any of these issues. In the meantime the reader should be mindful of the inconsistencies observed within our meta‐analyses when interpreting the findings from this section of the review. We look forward to the availability of some of the currently ongoing trials in the future, which will further inform this comparison.
SLT versus social support
Seven trials compared groups who received SLT with groups who received social support and stimulation. Though several significant differences were observed in the performance of the groups on various measures of language performance, which favoured the group that received social support over those that received SLT, most of these findings were derived from one small trial of 18 participants (Lincoln 1982iii). The more recent large, rigorously conducted ACTNoW trial found no evidence of a significant difference between the functional language skills of the two groups (ACTNoW 2011). Additional data are required to confirm whether social support and stimulation provides benefits to some aspects of participants' language skills and on measures of severity of aphasia impairment. Other significant differences observed and informed by five of the seven trials in this comparison are also important to note. We found that significantly more participants allocated to social support and stimulation interventions dropped out or did not adhere to the intervention when compared with the participants allocated to SLT interventions. While social support and stimulation may be beneficial to some aspects of participants' language performance we need additional evidence to support this. Where social support and stimulation interventions are being delivered clear explanation of the nature and purpose of the support should be provided to individuals to reduce any dissatisfaction that might be experienced and which may have resulted in the significantly higher dropout rates observed.
SLT A versus SLT B
Twenty‐five trials compared two different types of SLT. In general, comparisons were based on a small number of trials involving few participants (typically less than 20) and we observed few differences between approaches. Additional data are required to further inform these comparisons. The effectiveness of popular SLT approaches such as functional SLT or constraint‐induced language therapy were informed by few trials and did not demonstrate clear evidence of the effectiveness of these approaches over conventional SLT approaches. Some of the data from these trials were unavailable to this review and so could not be included in the meta‐analyses and while we hope that this may become available in the future we also look forward to the availability of additional trials currently ongoing which will further inform these comparisons.
In contrast, high‐intensity SLT was compared with low‐intensity SLT by six trials. There was some indication of benefits to participants' functional and written language skills though these findings derived from one trial. Based on pooled data from five different trials improvements in severity of aphasia were also observed following high‐intensity SLT; however, the number of participants dropping out from the high‐intensity SLT groups was significantly higher than in the low‐intensity SLT groups confounding the results and suggesting that high‐intensity approaches to therapy (seven to 20 hours per week) may not be suited to all patients.
We observed little evidence of any difference between group SLT and one‐to‐one SLT or between computer‐facilitated SLT versus professional SLT though both of these comparisons were based on very limited data. Differences in the data from participants that received volunteer‐facilitated SLT and those that received professional SLT were also limited. This is unsurprising as the volunteers providing the SLT interventions were trained by the professional therapists, had been given access to the relevant therapy materials and the plan for therapeutic interventions was developed by (or under the direction of) the professional therapist.
Overall completeness and applicability of evidence
We identified a substantial number of trials of relevance to our review question and most were eligible for inclusion within the review. Across the included trials there was a lack of comprehensive data collection, a wide range of outcome tools employed and disappointingly inadequate reporting of outcome measures.
Within the review, just over half of the trials described measuring receptive (n = 28) and expressive language skills (n = 28) but not all reported suitable data in a published format that permitted inclusion within this review. Thanks to several trialists' generous contributions of unpublished data we were able to include approximately 86% and 93% of the receptive measures fully (n = 24) and expressive measures (n = 26) within the review. The severity of participants' aphasia impairment was evaluated by 36 trials but unfortunately we were only able to included suitable data from 26 trials. Similarly, while two trials reported measuring economic outcomes, only data from one were available. Few trials measured participants' functional and psychosocial outcomes, measures that are probably most closely aligned to the patients' sense of recovery and return to 'normal'. From the total of 51 randomised comparisons, less than half (n = 23) described measuring changes in functional communication and of these only 17 reported data that could be included within the review. Even fewer trials measured psychosocial outcomes (n = 6) and only two reported data suitable for inclusion within the review. It is of note that of the additional trial data available since the last update of this review, we were able to access suitable data for all of the measures of relevance to this review.
The degree to which the models of conventional SLT employed within the trials are reflective of therapists' current practice should be carefully considered across individual treatments in terms of the frequency, duration and the extent of therapeutic intervention. Participants came from across a wide age range and were experiencing a range of aphasia impairments. However, the length of time since participants' stroke raises questions of how clinically relevant some recruitment parameters were to a SLT clinical population.
A quarter of the included trials (n = 13) recruited participants within the first few weeks following their stroke (a participant group of high clinical relevance) of which two recruited participants just days after their stroke. Most recruited participants more than one month (in some cases many years) following their stroke (n = 30). Recruitment procedures involving participants up to 28 years after the onset of their aphasia are of limited application to either a clinical or treatment evaluation setting and raise the question of whether such inclusion criteria is likely to demonstrate effectiveness of a given SLT intervention. However, it is encouraging to note that of the newly completed trials included in this review update, eight recruited participants in the first weeks after their stroke.
Quality of the evidence
This update adds a significant amount of data and so, together with newly improved systematic review methodologies, we are in a better position to draw conclusions regarding the effectiveness of SLT for aphasia following stroke. This review included a total of 51 randomised comparisons involving data from 2518 individual patients.
Methods of random sequence generation and concealment of allocation were considered adequate in 18 and 10 trials, respectively (Figure 5 and Figure 6). The randomisation methodology for all the remaining trials had been inadequately described and so it was not possible to judge the quality of randomisation. Similarly, information on allocation concealment for all but six trials was unreported. The lack of description and detail does not necessarily mean inadequate procedures were in place but rather a lack of reporting of this detail (Soares 2004). The prevalence of good methodology in relation to blinding of outcome assessors supports this interpretation. Blinding of the outcome assessors was more widely reported with more than half of the trials within the review (n = 27) describing adequate blinding procedures. Only eight were considered to have inadequately blinded assessors while 16 provided too little detail to make a judgement.

'Risk of bias' graph: review authors' judgements about each 'Risk of bias' item presented as percentages across all included studies.
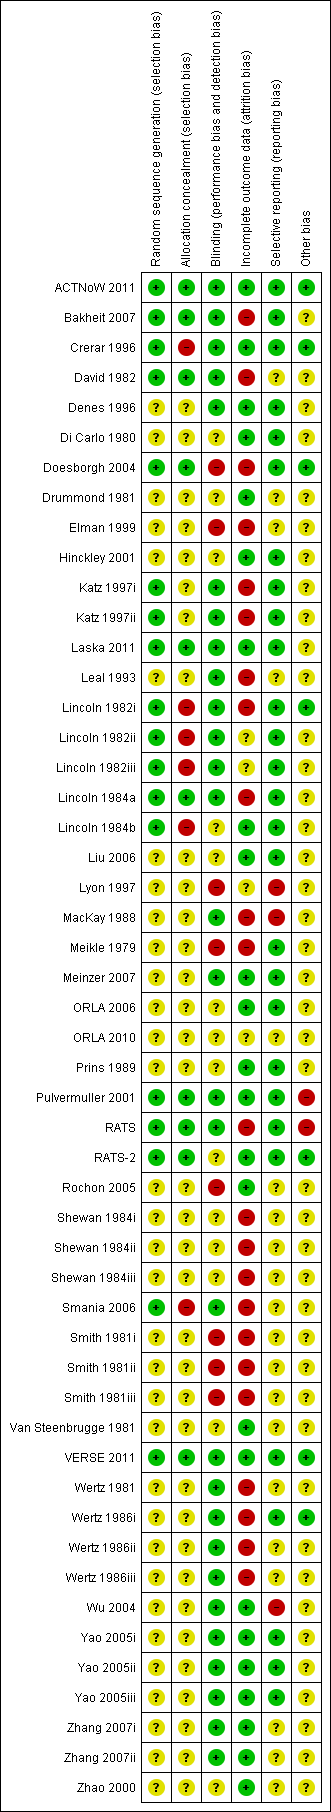
'Risk of bias' summary: review authors' judgements about each 'Risk of bias' item for each included study.
Almost 60% of the trials in this review (n = 30) were published before the CONSORT statement (Consolidated Standards of Reporting Trials) (Altman 2001; Moher 2001). Disappointingly, of the 16 trials published since 2005 (and after the implementation of the CONSORT statement) only six reported the method of generating the randomisation sequence and the methods of concealing allocation. Of the 10 that failed to adhere to the CONSORT statement six were published in Chinese medicine or nursing journals. Of the trials reporting in 2011 (ACTNoW 2011; Laska 2011; RATS‐2; VERSE 2011) all reported adequate methods of randomisation and concealment of allocation and thus there is some indication of improvements in the quality of the trial methodologies employed or of their reporting emerging.
Five trials reported an a priori power size calculation (ACTNoW 2011; Doesborgh 2004; Laska 2011; RATS; RATS‐2), which is reflected in the small numbers of randomised participants across the trials included in the review: four randomised 10 or fewer participants; 26 randomised up to 50 participants; 15 randomised between 50 and 100 participants; four randomised over 100 participants and only two over 200 individuals. The randomisation of such small numbers of participants reduces the power of the statistical analyses, raises questions of the reliability of findings and (given the complexity of various aphasia impairments) causes difficulties in ensuring the comparability of the groups at baseline. Nine of the included trials had groups that significantly differed at baseline and group comparability was unclear for another eight.
Despite these reporting and methodological limitations we have synthesised a large number of trials that address the effectiveness of SLT for aphasia following stroke across a number of outcome measures. Across these measures there is some emerging indication of the effectiveness of SLT for people with aphasia. While the consistency in the direction of results observed in the previous version of this review remains following the inclusion of additional trial data, most of the significant differences between pooled data from patients that received SLT and those that did not are reliant upon a single three‐armed trial (Zhang 2007i; Zhang 2007ii). Extreme caution is required in interpreting this evidence as the randomisation procedure, concealment of allocation, blinding and even details of the SLT intervention evaluated (contents, duration, frequency, intensity) are unclear.
With at least 15 additional trials of relevance to this review currently ongoing or about to report, the picture based on the current evidence for SLT for aphasia following stroke will develop further over time. We can be hopeful that with the availability of additional data the evidence will become more conclusive in relation to the effectiveness of SLT, social support and different approaches to SLT provision.
Twenty of the 51 trials in this review included all randomised participants in their final analyses. The remaining 26 trials lost participants during the treatment or follow‐up phases but only four employed an ITT analysis. All four were published from 2011 onwards. In some cases large proportions of participants withdrew from some interventions and in some this appeared to be linked to the intervention itself, with significantly more participants withdrawing from both intensive SLT and social support interventions than from SLT interventions. There was a similar suggestion (and a consistency in direction) of less adherence to social support interventions or intensive SLTs though the latter did not reach significance. Unfortunately few trials gave detailed reasons for withdrawals and so it was not possible to explore these findings further.
Potential biases in the review process
Within this review we refined the original search strategy and conducted a comprehensive search for high‐quality trials that evaluated the effectiveness of SLT for aphasia following stroke. While we are confident we have identified most published trials of relevance to the review it is possible, despite our efforts, that we may be unaware of additional unpublished work. Our search strategy and study selection criteria were agreed in advance and applied to all identified trials. Our data extraction processes were completed independently and then compared. Whenever possible we extracted all relevant data and sought missing data directly from the trialists for inclusion within the review. We considered it appropriate to include cross‐over data within our review given the nature of the comparisons, the points at which the data were extracted and, in some cases, the availability of individual patient data.
This review has been informed by the availability of individual patient data (n = 305). In three trials the individual data were presented within the associated publications, while for the remaining nine trials we are very grateful to the trialists for the unpublished data thus allowing inclusion within the review. In addition, other trialists generously contributed the relevant summary values thus permitting (for the first time) the full inclusion of important trials from this field (e.g. Wertz 1986i; Wertz 1986ii; Wertz 1986iii) within a systematic review. However, there still remain a number of other relevant trials that could not be fully included.
Agreements and disagreements with other studies or reviews
One of the first reviews in this area was Robey 1994 who reviewed 21 published studies (restricted to English language but not to RCTs). They identified at least 19 more studies that they were unable to include because of the manner in which the data had been reported. They concluded that the provision of SLT in the acute stages of aphasia following stroke was twice as effective as natural recovery patterns. Therapy started after that acute period had less of an impact but was still evident. They called for better reporting of data and the use of large sample sizes. This team later updated this review (Robey 1998a), employing the same methodologies and included 55 studies looking specifically at the amount and type of SLT intervention and the impact of the severity and type of aphasia. Again, they concluded that SLT was effective, particularly SLT in the acute stages following stroke and if two or more hours of therapy were provided each week. However, they again did not have access to all the relevant data and some key trials, such as Wertz 1986, were excluded.
Bhogal 2003 reviewed 10 English language publications of controlled trials from a MEDLINE search (1975 to 2002) and associated references. They found that intensive SLT delivered significant treatment effects (when at least nine hours per week were delivered) and that studies that failed to demonstrate a treatment effect had only provided about two hours of SLT per week. The total duration of SLT provision was also negatively correlated with language outcomes. Cherney 2008 also reviewed 10 English language publications (1990 to 2006; 15 electronic databases; not all RCTs) and found modest evidence for intensive SLT and benefits of constraint‐induced language therapy.
In contrast, Moss 2006 reviewed 23 single patient reports involving the provision by a therapist on a one‐to‐one basis of SLT that targeted spoken output or auditory comprehension in 57 participants identified following a systematic search (1985 to 2003) of published or indexed work. They concluded that time since stroke (and aphasia onset) is not linked to the response to SLT though they indicate (based on their data) that response to SLT may decline eight years after stroke. However, the highly selected nature of participants in published single cases studies means that reviews based on such a population group are of questionable applicability to a general clinical population. Individuals (and their carers) within such reports are likely to be highly motivated, educated, dedicated and reliable therapy participants (Moss 2006).
Funnel plot of comparison: 1 SLT versus no SLT, outcome: 1.3 Receptive language: reading comprehension.
Funnel plot of comparison: 1 SLT versus no SLT, outcome: 1.7 Expressive language: general.
Funnel plot of comparison: 1 SLT versus no SLT, outcome: 1.8 Expressive language: written.
Funnel plot of comparison: 1 SLT versus no SLT, outcome: 1.11 Severity of impairment: Aphasia Battery Score (+ PICA).
'Risk of bias' graph: review authors' judgements about each 'Risk of bias' item presented as percentages across all included studies.
'Risk of bias' summary: review authors' judgements about each 'Risk of bias' item for each included study.

Comparison 1 SLT versus no SLT, Outcome 1 Functional communication.

Comparison 1 SLT versus no SLT, Outcome 2 Receptive language: auditory comprehension.
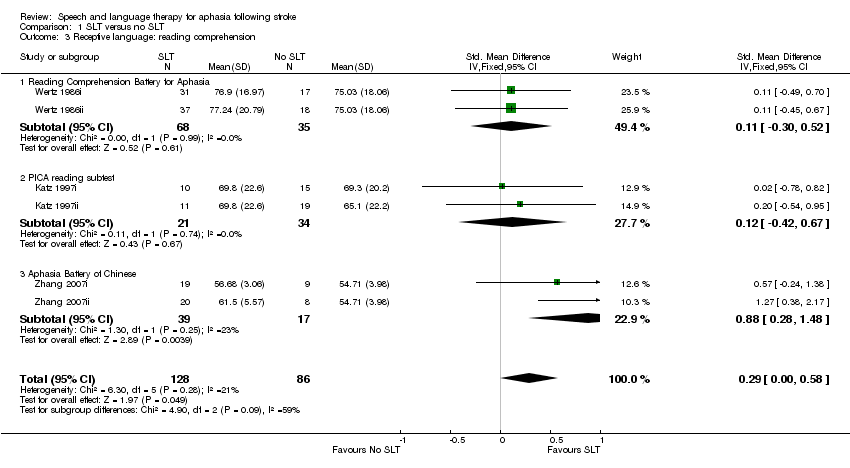
Comparison 1 SLT versus no SLT, Outcome 3 Receptive language: reading comprehension.
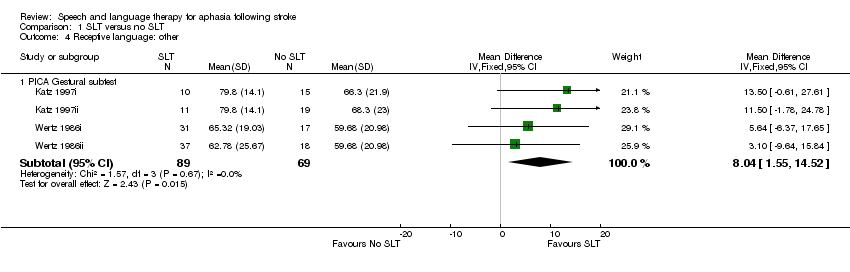
Comparison 1 SLT versus no SLT, Outcome 4 Receptive language: other.

Comparison 1 SLT versus no SLT, Outcome 5 Receptive language: gesture comprehension (unnamed).
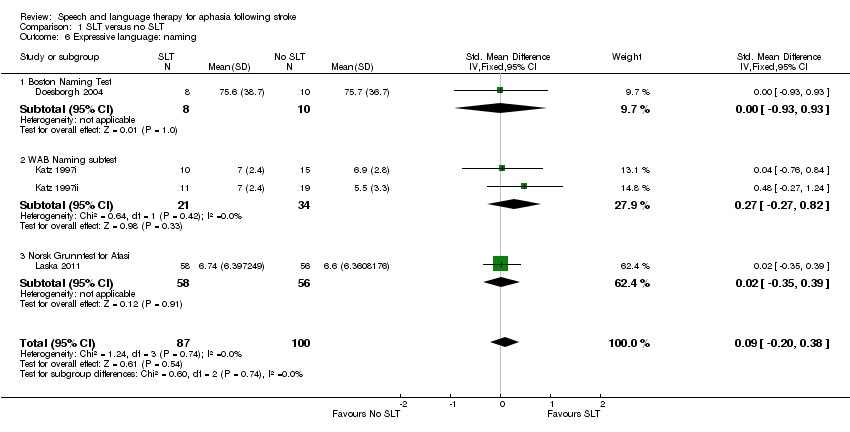
Comparison 1 SLT versus no SLT, Outcome 6 Expressive language: naming.

Comparison 1 SLT versus no SLT, Outcome 7 Expressive language: general.

Comparison 1 SLT versus no SLT, Outcome 8 Expressive language: written.

Comparison 1 SLT versus no SLT, Outcome 9 Expressive language: written copying.

Comparison 1 SLT versus no SLT, Outcome 10 Expressive language: repetition.
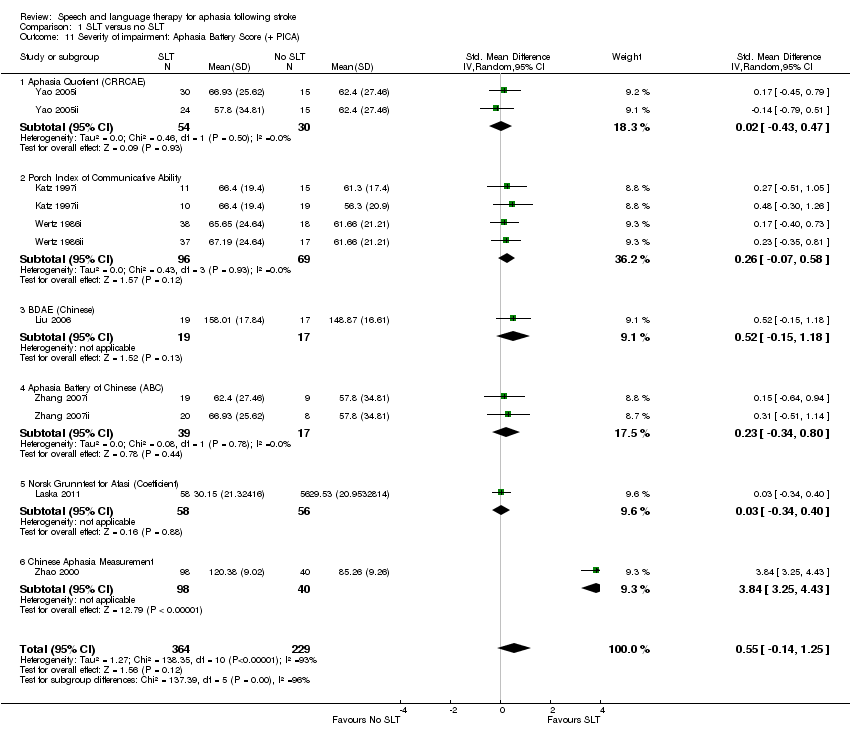
Comparison 1 SLT versus no SLT, Outcome 11 Severity of impairment: Aphasia Battery Score (+ PICA).
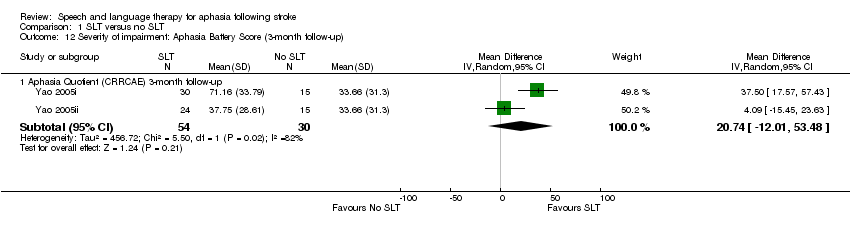
Comparison 1 SLT versus no SLT, Outcome 12 Severity of impairment: Aphasia Battery Score (3‐month follow‐up).

Comparison 1 SLT versus no SLT, Outcome 13 Psychosocial: MAACL.
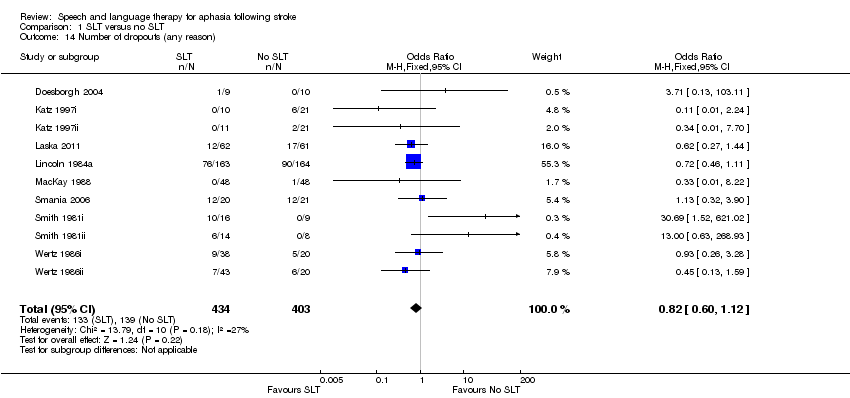
Comparison 1 SLT versus no SLT, Outcome 14 Number of dropouts (any reason).

Comparison 1 SLT versus no SLT, Outcome 15 Compliance with Allocated Intervention.

Comparison 2 SLT versus social support and stimulation, Outcome 1 Functional communication.
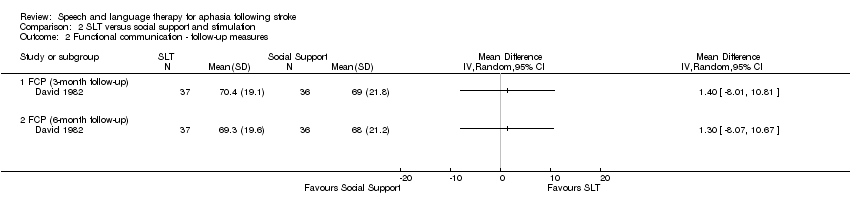
Comparison 2 SLT versus social support and stimulation, Outcome 2 Functional communication ‐ follow‐up measures.
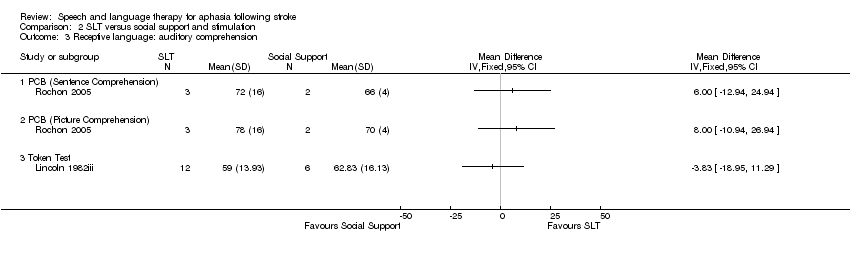
Comparison 2 SLT versus social support and stimulation, Outcome 3 Receptive language: auditory comprehension.
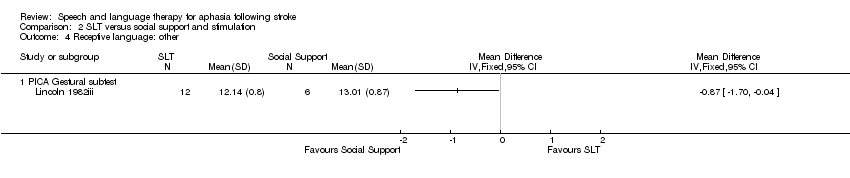
Comparison 2 SLT versus social support and stimulation, Outcome 4 Receptive language: other.

Comparison 2 SLT versus social support and stimulation, Outcome 5 Expressive language: single words.
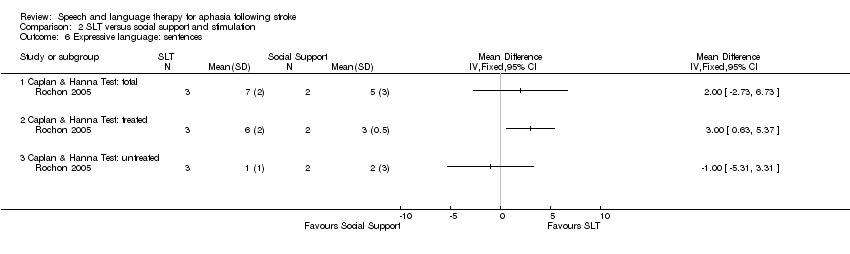
Comparison 2 SLT versus social support and stimulation, Outcome 6 Expressive language: sentences.
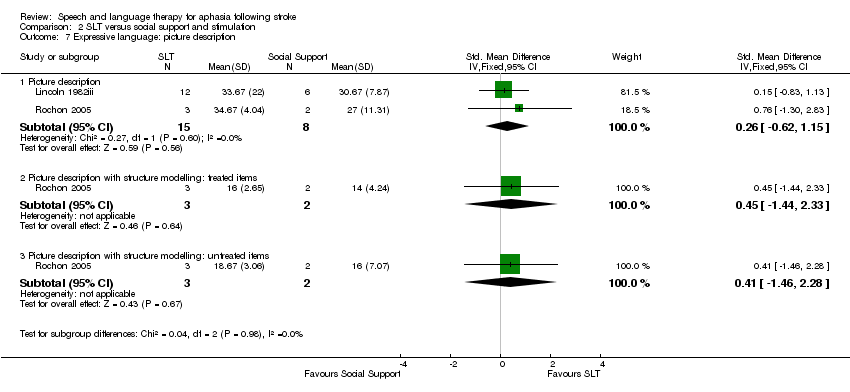
Comparison 2 SLT versus social support and stimulation, Outcome 7 Expressive language: picture description.

Comparison 2 SLT versus social support and stimulation, Outcome 8 Expressive language: overall spoken.

Comparison 2 SLT versus social support and stimulation, Outcome 9 Expressive language: written.

Comparison 2 SLT versus social support and stimulation, Outcome 10 Severity of impairment: Aphasia Battery Score.
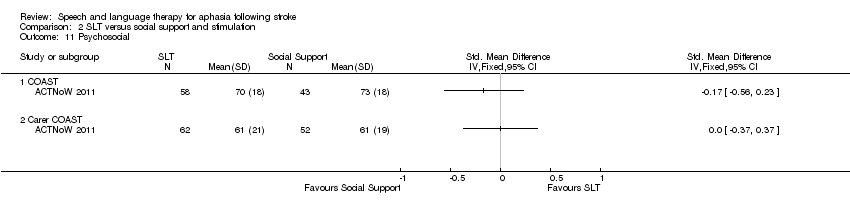
Comparison 2 SLT versus social support and stimulation, Outcome 11 Psychosocial.
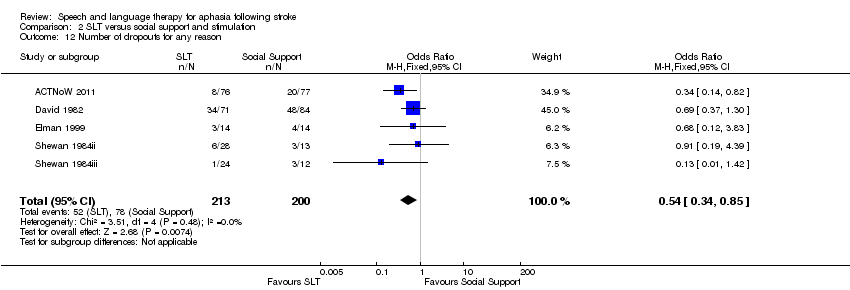
Comparison 2 SLT versus social support and stimulation, Outcome 12 Number of dropouts for any reason.

Comparison 2 SLT versus social support and stimulation, Outcome 13 Compliance with Allocated Intervention.

Comparison 2 SLT versus social support and stimulation, Outcome 14 Economic outcomes.

Comparison 3 Experimental SLT (SLT A) versus conventional SLT (SLT B), Outcome 1 Functional communication.

Comparison 3 Experimental SLT (SLT A) versus conventional SLT (SLT B), Outcome 2 Functional communication: catalogue ordering.
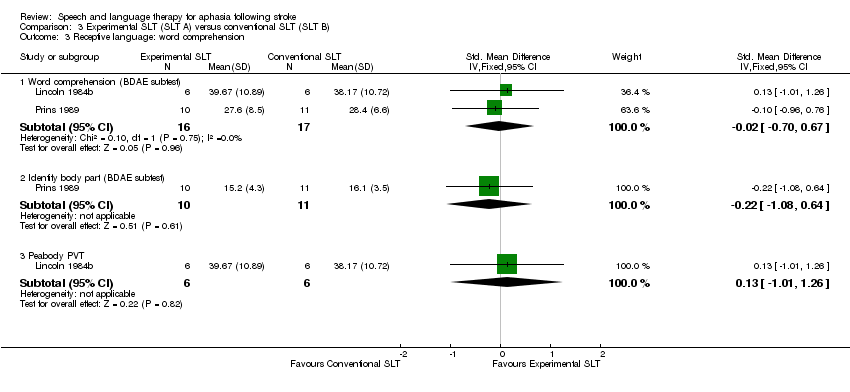
Comparison 3 Experimental SLT (SLT A) versus conventional SLT (SLT B), Outcome 3 Receptive language: word comprehension.

Comparison 3 Experimental SLT (SLT A) versus conventional SLT (SLT B), Outcome 4 Receptive language: other auditory comprehension.
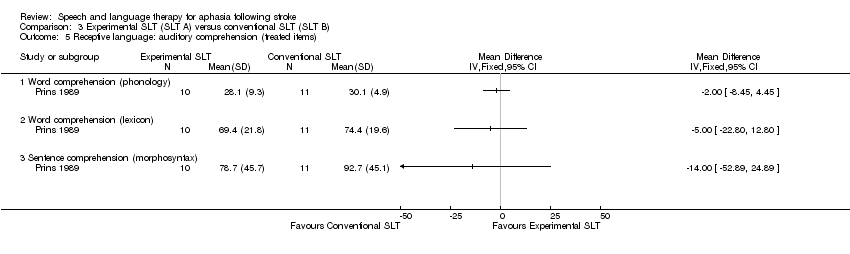
Comparison 3 Experimental SLT (SLT A) versus conventional SLT (SLT B), Outcome 5 Receptive language: auditory comprehension (treated items).

Comparison 3 Experimental SLT (SLT A) versus conventional SLT (SLT B), Outcome 6 Receptive language: reading comprehension.
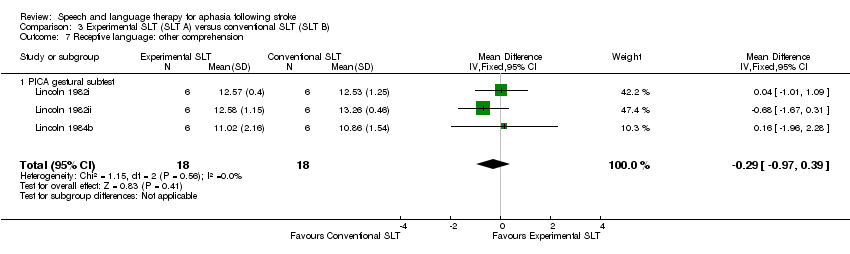
Comparison 3 Experimental SLT (SLT A) versus conventional SLT (SLT B), Outcome 7 Receptive language: other comprehension.

Comparison 3 Experimental SLT (SLT A) versus conventional SLT (SLT B), Outcome 8 Expressive language: naming.
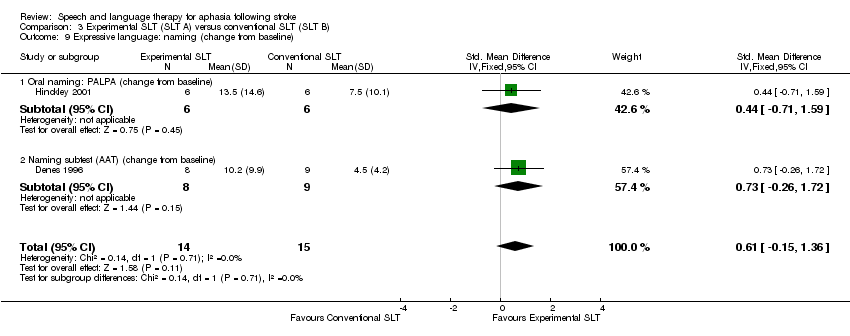
Comparison 3 Experimental SLT (SLT A) versus conventional SLT (SLT B), Outcome 9 Expressive language: naming (change from baseline).
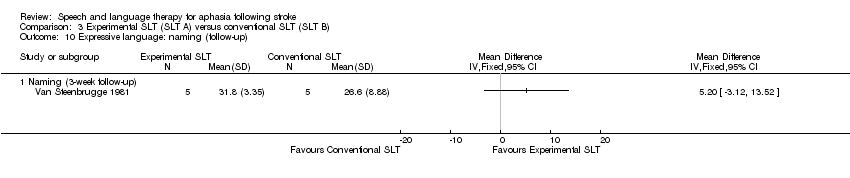
Comparison 3 Experimental SLT (SLT A) versus conventional SLT (SLT B), Outcome 10 Expressive language: naming (follow‐up).

Comparison 3 Experimental SLT (SLT A) versus conventional SLT (SLT B), Outcome 11 Expressive language: spoken sentence.
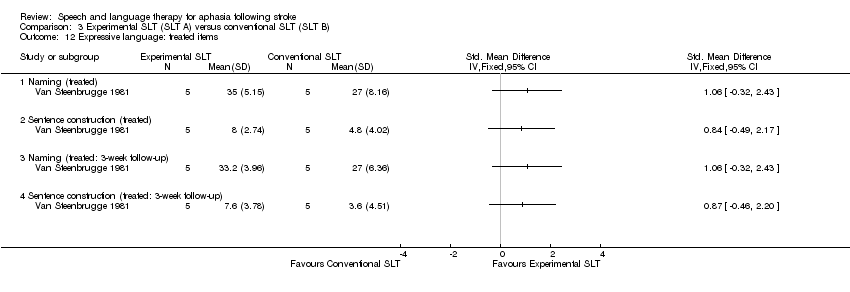
Comparison 3 Experimental SLT (SLT A) versus conventional SLT (SLT B), Outcome 12 Expressive language: treated items.

Comparison 3 Experimental SLT (SLT A) versus conventional SLT (SLT B), Outcome 13 Expressive language: connected discourse.

Comparison 3 Experimental SLT (SLT A) versus conventional SLT (SLT B), Outcome 14 Expressive language: fluency.

Comparison 3 Experimental SLT (SLT A) versus conventional SLT (SLT B), Outcome 15 Expressive language: repetition.
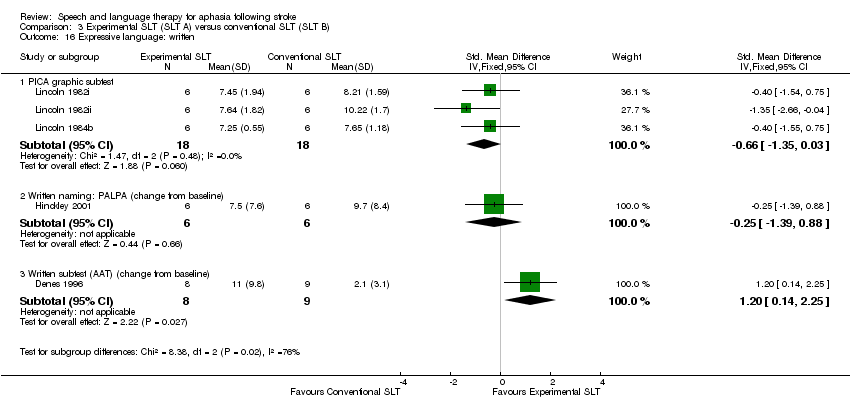
Comparison 3 Experimental SLT (SLT A) versus conventional SLT (SLT B), Outcome 16 Expressive language: written.

Comparison 3 Experimental SLT (SLT A) versus conventional SLT (SLT B), Outcome 17 Severity of impairment: Aphasia Battery Score.

Comparison 3 Experimental SLT (SLT A) versus conventional SLT (SLT B), Outcome 18 Severity of impairment: change from baseline.
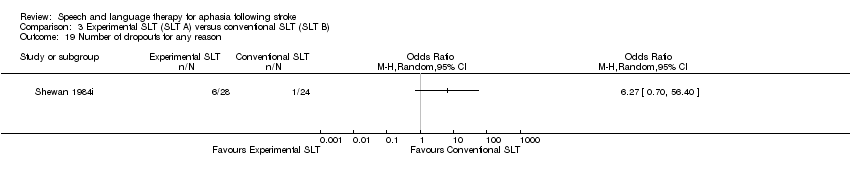
Comparison 3 Experimental SLT (SLT A) versus conventional SLT (SLT B), Outcome 19 Number of dropouts for any reason.

Comparison 3 Experimental SLT (SLT A) versus conventional SLT (SLT B), Outcome 20 Compliance with Allocated Intervention.
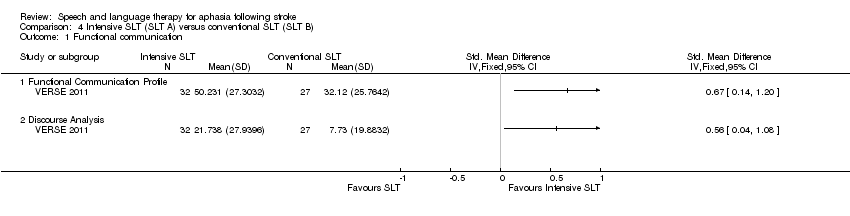
Comparison 4 Intensive SLT (SLT A) versus conventional SLT (SLT B), Outcome 1 Functional communication.

Comparison 4 Intensive SLT (SLT A) versus conventional SLT (SLT B), Outcome 2 Functional communication (follow‐up).
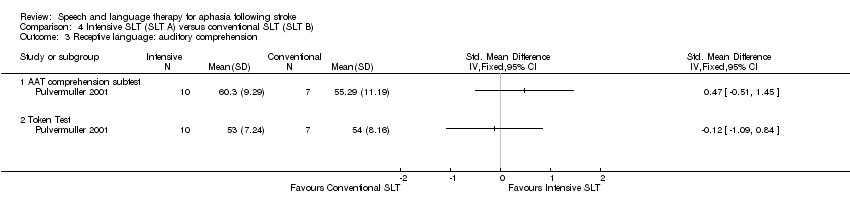
Comparison 4 Intensive SLT (SLT A) versus conventional SLT (SLT B), Outcome 3 Receptive language: auditory comprehension.

Comparison 4 Intensive SLT (SLT A) versus conventional SLT (SLT B), Outcome 4 Receptive language: auditory comprehension (change from baseline).

Comparison 4 Intensive SLT (SLT A) versus conventional SLT (SLT B), Outcome 5 Expressive language: spoken.
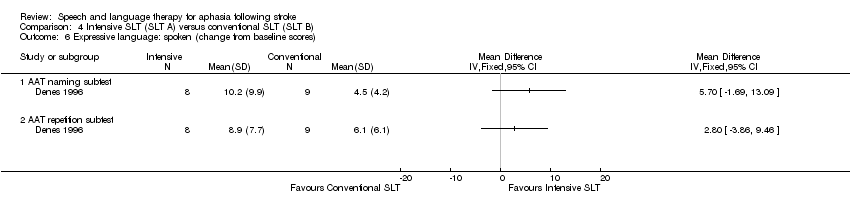
Comparison 4 Intensive SLT (SLT A) versus conventional SLT (SLT B), Outcome 6 Expressive language: spoken (change from baseline scores).
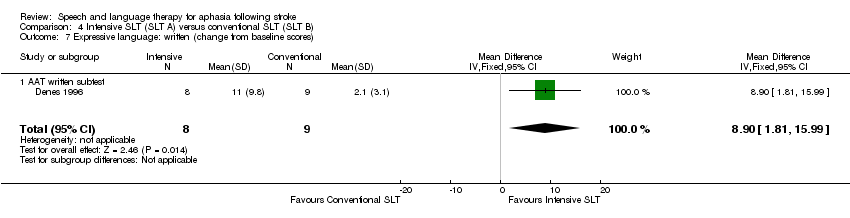
Comparison 4 Intensive SLT (SLT A) versus conventional SLT (SLT B), Outcome 7 Expressive language: written (change from baseline scores).
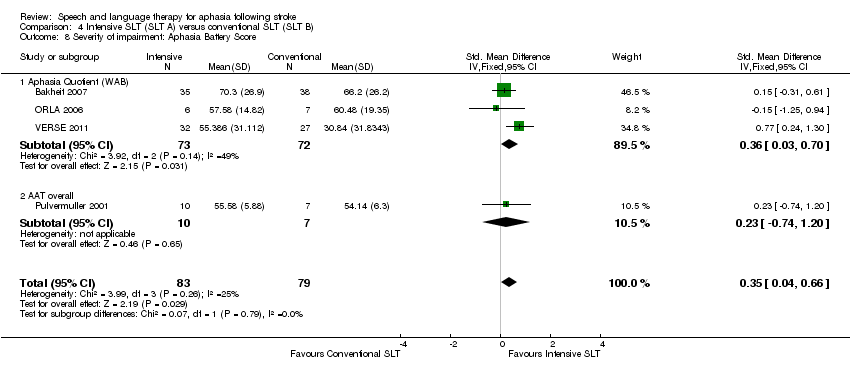
Comparison 4 Intensive SLT (SLT A) versus conventional SLT (SLT B), Outcome 8 Severity of impairment: Aphasia Battery Score.

Comparison 4 Intensive SLT (SLT A) versus conventional SLT (SLT B), Outcome 9 Severity of impairment: Aphasia Battery Score (change from baseline).

Comparison 4 Intensive SLT (SLT A) versus conventional SLT (SLT B), Outcome 10 Severity of impairment: Aphasia Battery Score (follow‐up).

Comparison 4 Intensive SLT (SLT A) versus conventional SLT (SLT B), Outcome 11 Number of dropouts for any reason.

Comparison 4 Intensive SLT (SLT A) versus conventional SLT (SLT B), Outcome 12 Compliance with Allocated Intervention.

Comparison 5 Group SLT (SLT A) versus one‐to‐one SLT (SLT B), Outcome 1 Functional communication.

Comparison 5 Group SLT (SLT A) versus one‐to‐one SLT (SLT B), Outcome 2 Receptive language: auditory comprehension.

Comparison 5 Group SLT (SLT A) versus one‐to‐one SLT (SLT B), Outcome 3 Receptive language: other.
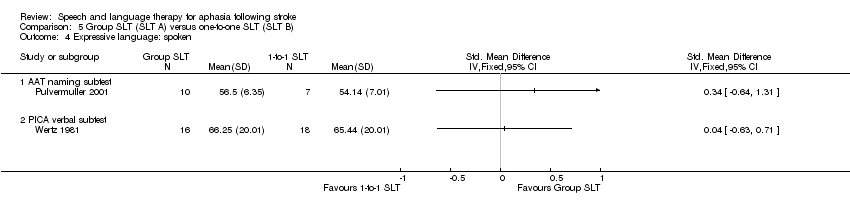
Comparison 5 Group SLT (SLT A) versus one‐to‐one SLT (SLT B), Outcome 4 Expressive language: spoken.

Comparison 5 Group SLT (SLT A) versus one‐to‐one SLT (SLT B), Outcome 5 Expressive language: repetition.
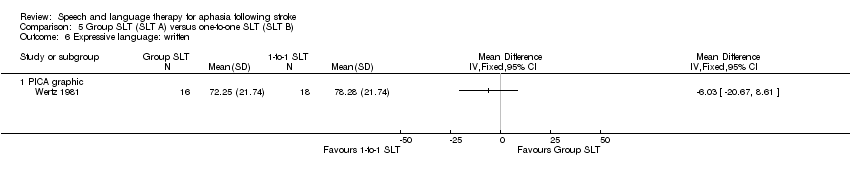
Comparison 5 Group SLT (SLT A) versus one‐to‐one SLT (SLT B), Outcome 6 Expressive language: written.

Comparison 5 Group SLT (SLT A) versus one‐to‐one SLT (SLT B), Outcome 7 Severity of impairment: Aphasia Battery Score.

Comparison 5 Group SLT (SLT A) versus one‐to‐one SLT (SLT B), Outcome 8 Severity of impairment: Aphasia Battery Score (3‐month follow‐up).
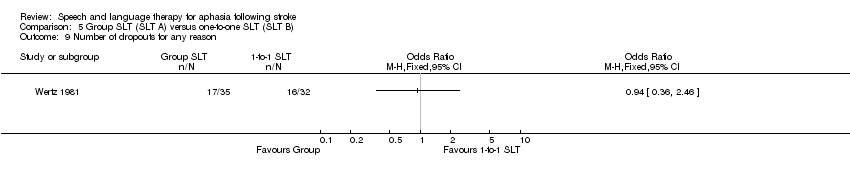
Comparison 5 Group SLT (SLT A) versus one‐to‐one SLT (SLT B), Outcome 9 Number of dropouts for any reason.

Comparison 6 Volunteer‐facilitated SLT (SLT A) versus professional SLT (SLT B), Outcome 1 Functional communication.

Comparison 6 Volunteer‐facilitated SLT (SLT A) versus professional SLT (SLT B), Outcome 2 Receptive language: auditory comprehension.

Comparison 6 Volunteer‐facilitated SLT (SLT A) versus professional SLT (SLT B), Outcome 3 Receptive language: reading comprehension.
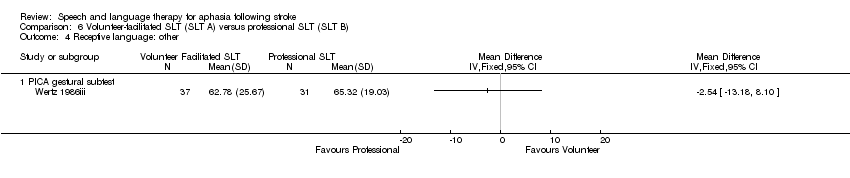
Comparison 6 Volunteer‐facilitated SLT (SLT A) versus professional SLT (SLT B), Outcome 4 Receptive language: other.
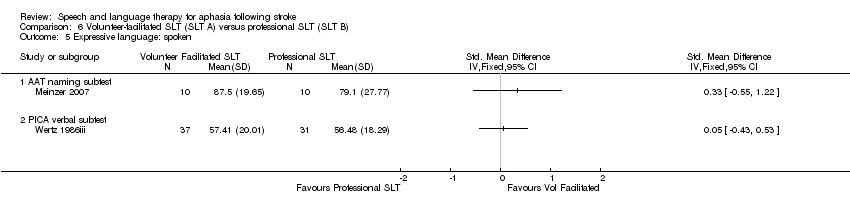
Comparison 6 Volunteer‐facilitated SLT (SLT A) versus professional SLT (SLT B), Outcome 5 Expressive language: spoken.
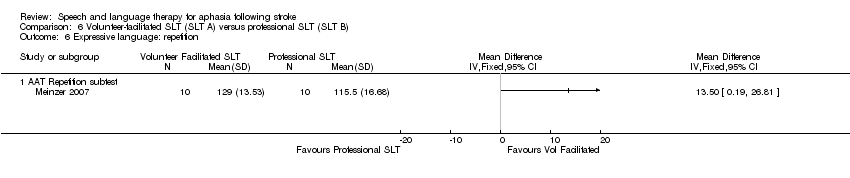
Comparison 6 Volunteer‐facilitated SLT (SLT A) versus professional SLT (SLT B), Outcome 6 Expressive language: repetition.
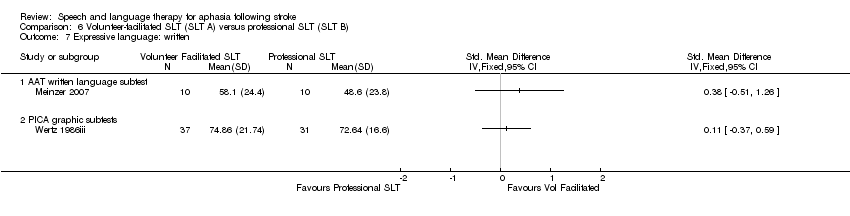
Comparison 6 Volunteer‐facilitated SLT (SLT A) versus professional SLT (SLT B), Outcome 7 Expressive language: written.
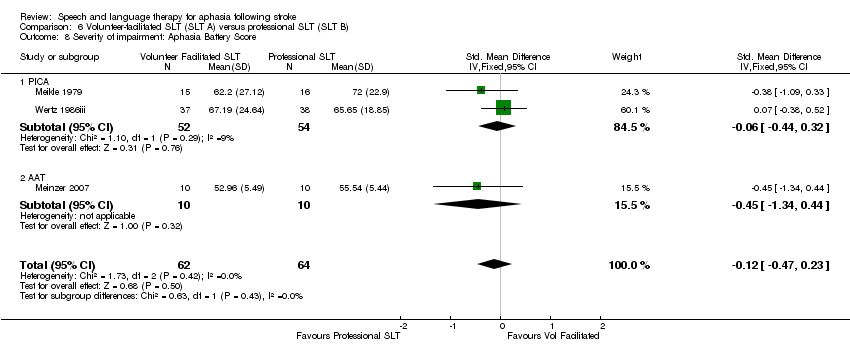
Comparison 6 Volunteer‐facilitated SLT (SLT A) versus professional SLT (SLT B), Outcome 8 Severity of impairment: Aphasia Battery Score.

Comparison 6 Volunteer‐facilitated SLT (SLT A) versus professional SLT (SLT B), Outcome 9 Number of dropouts for any reason.

Comparison 6 Volunteer‐facilitated SLT (SLT A) versus professional SLT (SLT B), Outcome 10 Compliance with allocated intervention.

Comparison 7 Computer‐mediated SLT (SLT A) versus professional SLT (SLT B), Outcome 1 Functional communication.
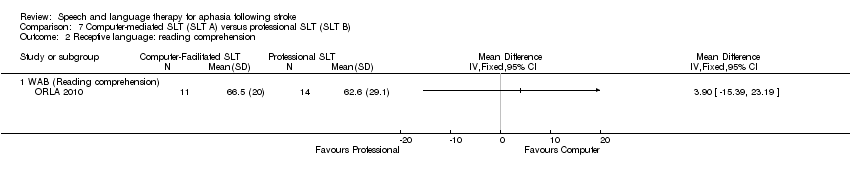
Comparison 7 Computer‐mediated SLT (SLT A) versus professional SLT (SLT B), Outcome 2 Receptive language: reading comprehension.
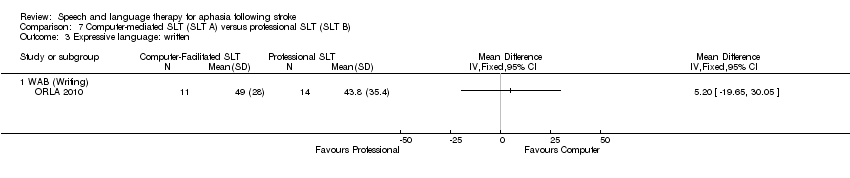
Comparison 7 Computer‐mediated SLT (SLT A) versus professional SLT (SLT B), Outcome 3 Expressive language: written.
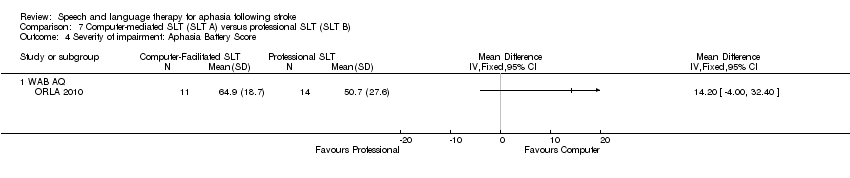
Comparison 7 Computer‐mediated SLT (SLT A) versus professional SLT (SLT B), Outcome 4 Severity of impairment: Aphasia Battery Score.

Comparison 8 Semantic SLT (SLT A) versus phonological SLT (SLT B), Outcome 1 Functional communication.

Comparison 8 Semantic SLT (SLT A) versus phonological SLT (SLT B), Outcome 2 Receptive language: auditory.

Comparison 8 Semantic SLT (SLT A) versus phonological SLT (SLT B), Outcome 3 Receptive language: reading.
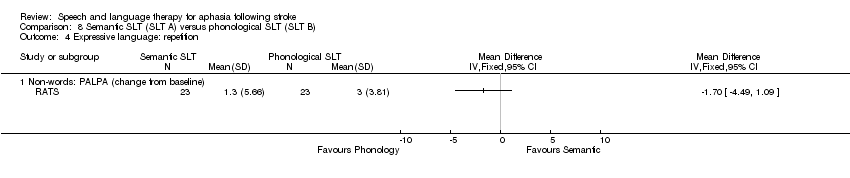
Comparison 8 Semantic SLT (SLT A) versus phonological SLT (SLT B), Outcome 4 Expressive language: repetition.

Comparison 8 Semantic SLT (SLT A) versus phonological SLT (SLT B), Outcome 5 Number of dropouts for any reason.

Comparison 9 Cognitive‐linguistic SLT (SLT A) versus communicative SLT (SLT B), Outcome 1 Functional communication.

Comparison 9 Cognitive‐linguistic SLT (SLT A) versus communicative SLT (SLT B), Outcome 2 Receptive language: other comprehension.

Comparison 9 Cognitive‐linguistic SLT (SLT A) versus communicative SLT (SLT B), Outcome 3 Expressive language: fluency.
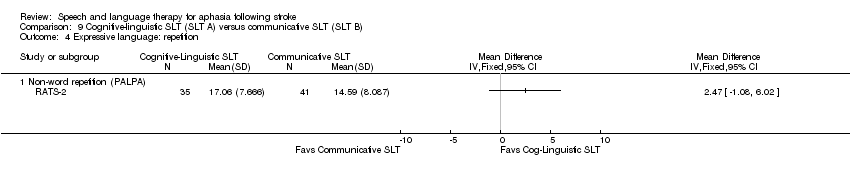
Comparison 9 Cognitive‐linguistic SLT (SLT A) versus communicative SLT (SLT B), Outcome 4 Expressive language: repetition.
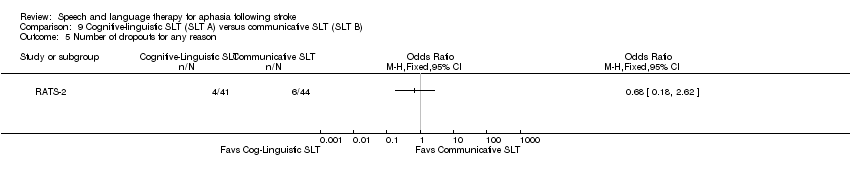
Comparison 9 Cognitive‐linguistic SLT (SLT A) versus communicative SLT (SLT B), Outcome 5 Number of dropouts for any reason.
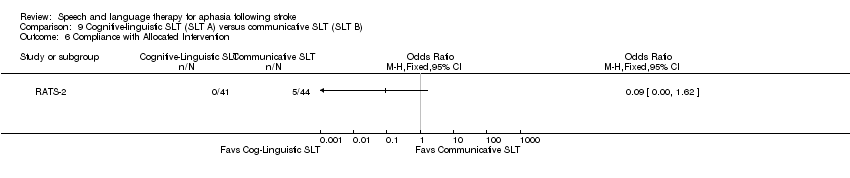
Comparison 9 Cognitive‐linguistic SLT (SLT A) versus communicative SLT (SLT B), Outcome 6 Compliance with Allocated Intervention.

Comparison 10 Verb comprehension SLT (SLT A) versus preposition comprehension SLT (SLT B), Outcome 1 Receptive language: auditory comprehension.

Comparison 10 Verb comprehension SLT (SLT A) versus preposition comprehension SLT (SLT B), Outcome 2 Receptive language: reading.
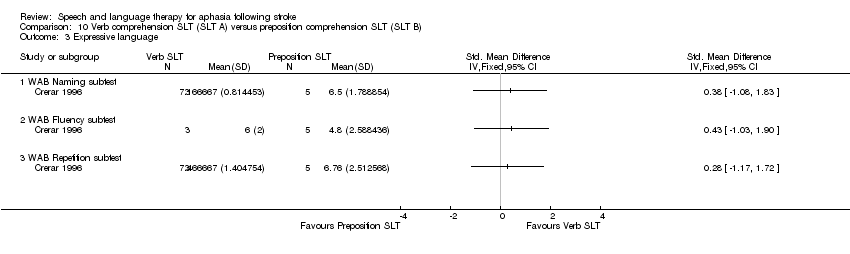
Comparison 10 Verb comprehension SLT (SLT A) versus preposition comprehension SLT (SLT B), Outcome 3 Expressive language.
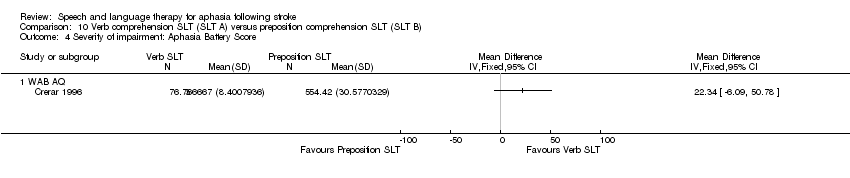
Comparison 10 Verb comprehension SLT (SLT A) versus preposition comprehension SLT (SLT B), Outcome 4 Severity of impairment: Aphasia Battery Score.
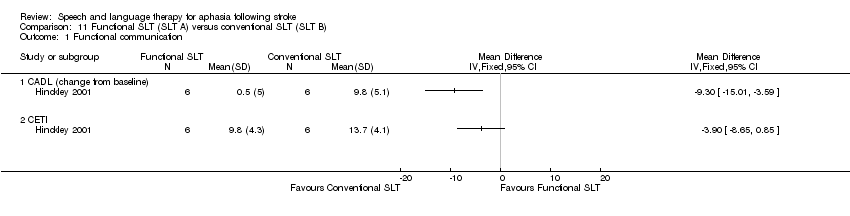
Comparison 11 Functional SLT (SLT A) versus conventional SLT (SLT B), Outcome 1 Functional communication.
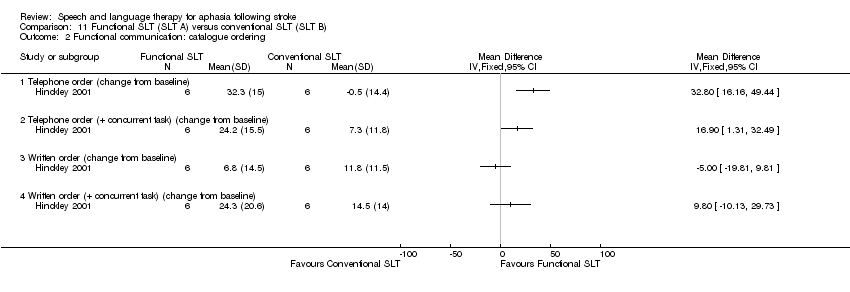
Comparison 11 Functional SLT (SLT A) versus conventional SLT (SLT B), Outcome 2 Functional communication: catalogue ordering.
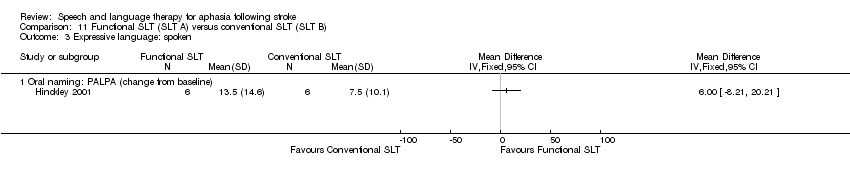
Comparison 11 Functional SLT (SLT A) versus conventional SLT (SLT B), Outcome 3 Expressive language: spoken.
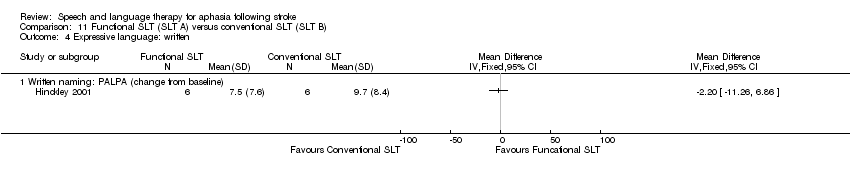
Comparison 11 Functional SLT (SLT A) versus conventional SLT (SLT B), Outcome 4 Expressive language: written.
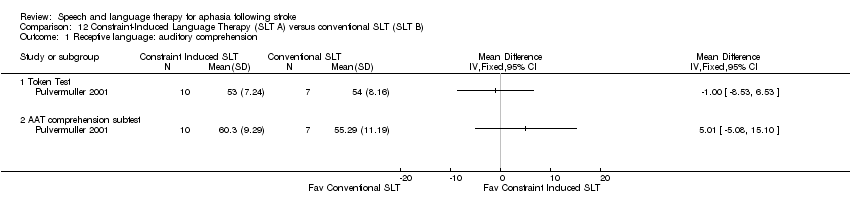
Comparison 12 Constraint‐Induced Language Therapy (SLT A) versus conventional SLT (SLT B), Outcome 1 Receptive language: auditory comprehension.
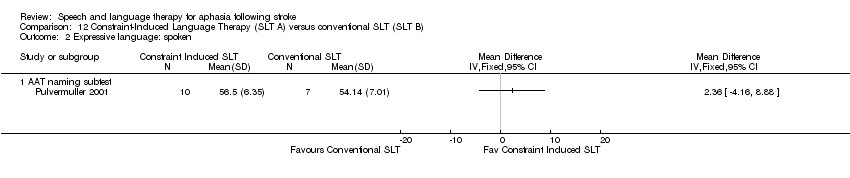
Comparison 12 Constraint‐Induced Language Therapy (SLT A) versus conventional SLT (SLT B), Outcome 2 Expressive language: spoken.
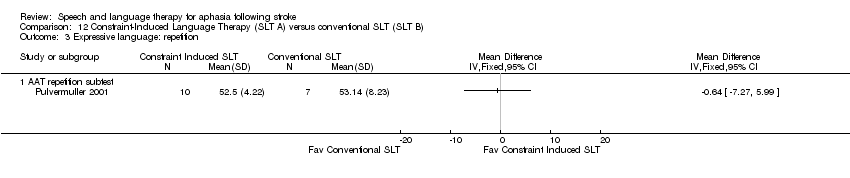
Comparison 12 Constraint‐Induced Language Therapy (SLT A) versus conventional SLT (SLT B), Outcome 3 Expressive language: repetition.

Comparison 12 Constraint‐Induced Language Therapy (SLT A) versus conventional SLT (SLT B), Outcome 4 Severity of impairment: Aphasia Battery Score.
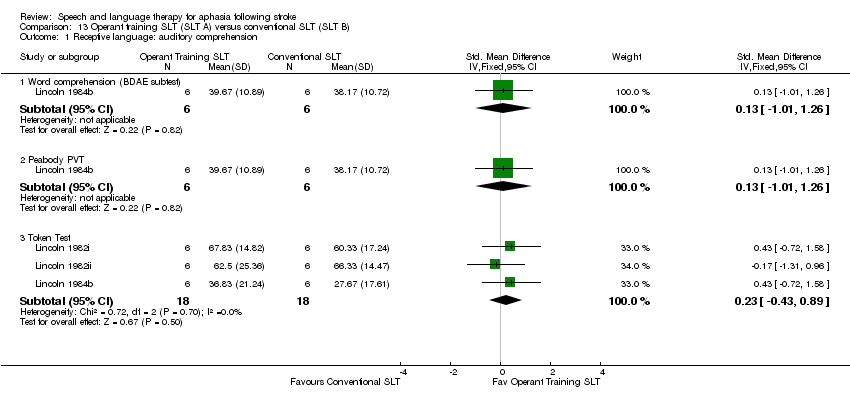
Comparison 13 Operant training SLT (SLT A) versus conventional SLT (SLT B), Outcome 1 Receptive language: auditory comprehension.

Comparison 13 Operant training SLT (SLT A) versus conventional SLT (SLT B), Outcome 2 Receptive language: other.

Comparison 13 Operant training SLT (SLT A) versus conventional SLT (SLT B), Outcome 3 Expressive language: spoken.
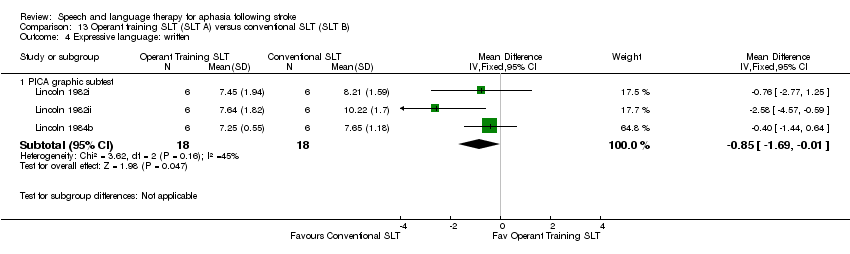
Comparison 13 Operant training SLT (SLT A) versus conventional SLT (SLT B), Outcome 4 Expressive language: written.

Comparison 13 Operant training SLT (SLT A) versus conventional SLT (SLT B), Outcome 5 Severity of impairment.

Comparison 14 SLT versus no SLT (6‐month follow‐up), Outcome 1 Functional communication.

Comparison 14 SLT versus no SLT (6‐month follow‐up), Outcome 2 Receptive language: auditory comprehension.
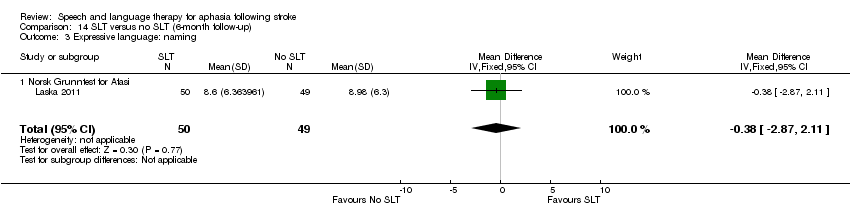
Comparison 14 SLT versus no SLT (6‐month follow‐up), Outcome 3 Expressive language: naming.

Comparison 14 SLT versus no SLT (6‐month follow‐up), Outcome 4 Expressive language: repetition.
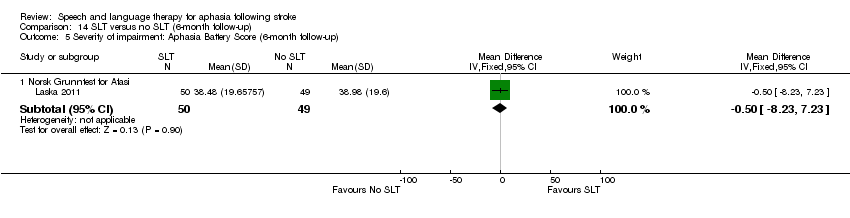
Comparison 14 SLT versus no SLT (6‐month follow‐up), Outcome 5 Severity of impairment: Aphasia Battery Score (6‐month follow‐up).
| Study ID | Number | Male/female | Age in years mean (standard deviation) | Post‐onset mean (standard deviation) (range) | Aphasia severity mean (standard deviation) |
| 153 | SLT: 40/36 Social support: 42/35 | SLT: 71 (range 32 to 97) Social support: 70 (range 40 to 92) | Admission to randomisation median 12 (interquartile range 9 to 16) days | TOMs SLT: 1.9 (1.2) (severe n = 47) Social support: 1.9 (1.1) (severe n = 51) | |
| 97 | Intensive: 26/25 | Intensive: 71.2 (14.9) (range 26 to 92) | Intensive: 34.2 (19.1) days | WABAQ | |
| 8 | Verb SLT: 2/1 Preposition SLT: 5/0 | Verb SLT: 50.3 (8.5) (range 44 to 60) Preposition SLT: 48.8 (13.77) (range 27 to 64) | Verb SLT: 87.33 (40.61) (range 60 to 134) months Preposition SLT: 66.4 (20.96) (range 39 to 86) | WABAQ Verb SLT: 76.2 (9.81) Preposition SLT: 69.3 (16.58) | |
| 133 (of 155 randomised) | Conventional: 35/30 | Conventional: 70 (8.7) | Conventional: median 4 (range 4 to 266) weeks | Baseline FCP scores for n = 98 retained until post‐therapy test Conventional: 42.4 (20.8) | |
| 17 | Intensive: 5/3 | Intensive: 58.1 (11.8) | Intensive: 3.2 (1.8) months | AAT | |
| 14 | Programmed instruction: 7/0 | Programmed instruction: 57.6 (9.2) (range 44 to 69) | Programmed instruction: 24.7 (23.6) (range 0 to 66) months | Programmed instruction: severe | |
| 18 (of 19 randomised) | Computer‐mediated: 4/4 | Computer‐mediated: 62 (9.0) | Computer‐mediated: 13 (range 11 to 16) months | Computer‐mediated: ANELT‐ A 34 (9); BNT 63 (37) | |
| 8 | Not reported | Gesture cue: 52.9 (6.0) | Gesture cue: 15.3 (4.1) (range 10 to 20) months | Not reported | |
| 24 | Conventional: 7/5 | Conventional: 58.3 (11.4) (range 38 to 79) | Conventional: 32.5 (28.7) (range 7 to 103) months | Conventional: SPICA 7 mild to moderate, 7 moderate to severe | |
| 12 | Functional SLT: 5/1 | Functional: 51.6 (15) | Functional: 26.8 (20.1) (range 6 to 58) months | BDAE Severity Rating | |
| 60 | Group SLT: unclear | Group SLT: unclear | Not reported | Not reported | |
| 54 | Group SLT: unclear | Group SLT: unclear | Not reported | Not reported | |
| 54 | Group SLT: unclear | Group SLT: unclear | Not reported | Not reported | |
| 42 (reported data on 36) | Computer‐mediated: unclear | Computer‐mediated: 61.6 (10) | Computer‐mediated: 6.2 (5.2) years | PICA overall percentile; WABAQ Computer‐mediated: 57.3 (17.9); 68.9 (24.3). | |
| 40 (of 42 randomised) | Computer‐mediated: unclear | Computer‐mediated: 61.6 (10) | Computer‐mediated: 6.2 (5.2) years | PICA overall percentile; WABAQ Computer‐mediated: 57.3 (17.9); 68.9 (24.3) | |
| 123 | SLT: 33/29 No SLT: 23/38 | SLT: 76 (range 38 to 94) No SLT: 79 (range 39 to 94) | SLT: 3 (25th‐75th; 2 to 4) days No SLT: 3 (25th‐75th; 2 to 4) days | ANELT‐A median (25th to 75th) SLT: 1 (0 to 1.4) No SLT: 1 (0 to 1.4) | |
| 94 | Conventional: 38/21 Volunteer‐facilitated: 22/13 | Conventional: 56 (17) | Within first month after stroke | Conventional: moderate‐severe | |
| 12 | SLT/operant train: 3/3 | SLT/operant train: 54.33 (6.68) (range 45 to 63) SLT/social support: 51.33 (7.97) (range 39 to 63) | SLT/operant train: 3.17 (1.60) (range 1 to 5) months | SLT/operant train: moderate | |
| 12 | Operant train/SLT: 5/1 | Operant train/SLT: 57.67 (5.72) (range 51 to 64) | Operant train/SLT: 2.33 (1.55) (range 1 to 5) months | Operant train/SLT: moderate | |
| 18 | Conventional SLT: 7/5 | Conventional SLT:52.83 (7.18) (range 39 to 63) | Conventional SLT: 4.17 (2.76) (range 1 to 10) months | Conventional SLT: moderate | |
| (data for 58% of randomised participants) | 191 | Conventional: unclear | Conventional: unclear | Conventional: 10 weeks | Not reported |
| 12 | Operant train: 4/2 Placebo: 5/1 | Operant train: 52.33 (11.50) (range 32 to 64) | Operant train: 5.5 (4.89) (range 1 to 12) months | Operant train: severe | |
| 36 | SLT: 9/10 No SLT: 10/7 | SLT: 7 = 40 to 65 years; 12 = 65 to 80 years No SLT: 8 = 40 to 65 years; 9 = 65 to 80 years | SLT: 8 = 7 to 20 days; 11 = 20 to 45 days No SLT: 7 = 7 to 20 days; 10 = 20 to 45 days | BDAE SLT: 60.48 (11.83) No SLT: 58.22 (5.06) | |
| 30 | Functional: unclear | Functional: unclear | Functional: unclear | Functional: unclear | |
| 95 | MacKay 1988: 46/49 | MacKay 1988: median 75 | MacKay 1988: mean 30 months | Not reported | |
| 31 | Volunteer‐facilitated: 12/3 | Volunteer‐facilitated: 67.2 (8.6) | Volunteer‐facilitated: 30.9 (29.5) (range 4 to 115) weeks | PICA percentile volunteer‐facilitated: 53.9 (23.5) | |
| 20 | Constraint‐induced: 7/3 Volunteer‐facilitated: 9/1 | Constraint‐induced: 50.2 (10.13) | Constraint‐induced: 30.7 (18.9) (range 6 to 72) months | AAT profile score | |
| 13 | Intensive SLT: 6 | Intensive SLT: 61.4 (9.72) (range 48.44 to 74.5) | Intensive SLT: 36.2 (28.2) (range 8.6 to 69.8) months | WABAQ Intensive SLT: 51.1 (17.8) (range 28.0 to 69.4) | |
| 25 | Computer: 8/3 Therapist: 8/6 | Computer: 56.6 (9.2) (range 41.7 to 68) Therapist: 61.1 (14.8) (range 35.2 to 81.7) | Computer: 66.7 (71.5) (range 13.8 to 253.2) months Therapist: 41.3 (45.7) (range 12.2 to 166) months | WABAQ Computer: 62.0 (19.9) Therapist: 47.3 (27.9) | |
| 21 | STACDAP: 5/5 | STACDAP: 70.3 (range 58 to 83) | STACDAP: 15.2 (range 3 to 35) months | STACDAP: FE‐scale 2.6 (0 to 6), oral comp (BDAE and Token Test) 26.4 (0 to 46) | |
| 17 | Constraint‐induced: 6/4 | Constraint‐induced: 55.4 (10.9) | Constraint‐induced: 98.2 (74.2) months | Constraint‐induced: 2 mild, 5 moderate, 3 severe | |
| 58 | Semantic: 18/11 | Semantic: 66 (10) | Semantic: mean 4 (range 3 to 5) months | ANELT‐A score | |
| 80 | Cognitive linguistic: 14/24 Communicative: 24/18 | Cognitive linguistic: 68 (13) Communicative: 67 (15) | Cognitive linguistic: 22 (range 11 to 37) days Communicative: 23 (9 to 49) days | ANELT‐A score Cognitive linguistic: 21.4 (11.0) Communicative: 21.0 (11.1) | |
| 5 | Sentence mapping: 0/3 | Sentence mapping: range 31 to 74 | Sentence mapping: range 2 to 9 years | Sentence mapping: BDAE 1 to 2, phrase length 2.5 to 4 | |
| 52 | Language‐orientated: 18/10 | Language‐orientated: 62.18 (range 29 to 82) | Language‐orientated: range 2 to 4 weeks | Language‐orientated: 9 mild, 6 moderate, 13 severe | |
| 53 | Language‐orientated: 18/10 | Language‐orientated: 62.18 (range 29 to 82) | Language‐orientated: range 2 to 4 weeks | Language‐orientated: 9 mild, 6 moderate, 13 severe | |
| 49 | Conventional: 14/10 | Conventional: 65.63 (range 48 to 85) | Conventional: range 2 to 4 weeks | Conventional: 8 mild, 3 moderate, 13 severe | |
| 33 (of 41 randomised) | Conventional: 11/4 | Conventional: 65.73 (8.78) (range 48 to 77) | Conventional: 17.4 (24.07) (range 2 to 36) months | Aphasia severity: unclear | |
| 33 | Intensive: 12/4 | Intensive: 62 | Not reported | MTDDA (mean error score percentage) | |
| 31 | Conventional: 10/4 | Conventional: 63 | Not reported | MTDDA (mean error score percentage) | |
| 30 | Intensive: 12/4 | Intensive: 62 | Not reported | MTDDA (mean error score percentage) | |
| 10 | Task‐specific: 0/5 | Task‐specific: 61.8 (17.05) (range 40 to 77) | Task‐specific: 21 (22.4) (range 5 to 60) months | FE‐scale and M‐S Comprehension Test | |
| 59 | Intensive SLT: 14/18 Conventional SLT: 15/12 | Intensive SLT: 70.3 (12.8) Conventional SLT: 67.7 (15.4) | Intensive SLT:3.2 (2.2) days Conventional SLT: 3.4 (2.2) days | WABAQ median (IQR) Intensive SLT: 31.0 (47) Conventional SLT: 9.0 (34.1) | |
| 67 | Not reported | (15 weeks after stroke) | Group SLT: 4 weeks | (15 weeks after stroke) | |
| 78 | Conventional: unclear | Conventional: 59.2 (6.7) | Conventional: 6.6 (4.8) weeks | PICA overall percentile Conventional: 46.59 (16.05) | |
| 83 | Volunteer‐facilitated: 37/6 | Volunteer‐facilitated: 60.2 (6.7) | Volunteer‐facilitated: 7.1 (5.8) weeks | PICA overall percentile | |
| 81 | Volunteer‐facilitated: 37/6 | Volunteer‐facilitated:60.2 (6.7) | Volunteer‐facilitated: 7.1 (5.8) weeks | PICA overall percentile | |
| 236 | Conventional: unclear | Conventional: (range 39 to 81) | Not reported | Not reported | |
| 36 | SLT: 10/9 No SLT: 11/6 | SLT: 63.40 (7.82) No SLT: 59.36 (7.69) | SLT: 29.45 (10.63) days No SLT: 27.80 (9.79) days | ABC AQ SLT: 48.70 (33.49) No SLT: 49.87 (26.83) | |
| 37 | SLT: 11/9 No SLT: 11/6 | SLT: 60.80 (8.13) No SLT: 59.36 (7.69) | SLT: 28.10 (9.15) days No SLT: 27.80 (9.79) days | ABC AQ SLT: 48.43 (29.18) No SLT: 49.87 (26.83) | |
| 138 | Not reported | Not reported | Not reported | Not reported | |
| AAT: Aachen Aphasia Test | |||||
| Study ID | Dropouts by intervention | Reasons | Follow‐up | Reasons |
| Conventional: 8 Social support: 20 | Conventional: 4 died, 3 declined, 1 post‐randomisation exclusion, 2 non‐study SLT Social support: 7 died, 12 declined, 1 post‐randomisation exclusion, 18 non‐study SLT | No follow‐up | N/A | |
| Intensive: 16 | Intensive: 2 died, 14 withdrew | Intensive: 4 | Not reported | |
| Conventional: 23 | Conventional: 4 died, 5 new stroke, 2 self discharge, 5 illness, 3 moved, 4 other | Conventional: 11 | Not reported | |
| Computer‐mediated: 1 | Computer‐mediated: 1 illness | No follow‐up | N/A | |
| Conventional: 2 | Conventional: 1 transport, 1 time constraints, | Conventional: 0 | ||
| Computer‐mediated: 0 | Prolonged illness, new stroke, death | Computer‐mediated: 0 | ||
| Computer‐mediated: 0 | Prolonged illness, new stroke, death | Computer‐mediated: 0 | ||
| SLT: 3 No SLT: 6 | SLT: 1 death, 2 illness No SLT: 3 declined, 3 illness | At 6 months SLT: 9 No SLT: 6 | SLT: 4 death, 2 declined, 3 illness No SLT: 6 death | |
| Conventional: 21 | Conventional: 2 death, 3 new stroke, 3 transport, 4 declined, 2 moved, 5 illness, 2 transfer | Conventional: 0 | ||
| Social support: ? | Homesickness, illness | No follow‐up | N/A | |
| Social support: ? | Homesickness, illness | No follow‐up | N/A | |
| Social support: ? | Homesickness, illness | No follow‐up | N/A | |
| Conventional: 78 | Death, refused, illness, recovered, unsuitable, relocated | No follow‐up | N/A | |
| Volunteer‐facilitated: 0 | Not reported | No follow‐up | N/A | |
| Conventional: 0 | Conventional: 0 | No follow‐up | N/A | |
| Semantic: 6 | Semantic: 4 received < 40 hours treatment, 2 severe neurological illness | No follow‐up | N/A | |
| Cognitive linguistic: 4 Communicative: 6 | Cognitive linguistic: 3 illness, 1 refusal by therapist Communicative: 1 illness, 5 declined | No follow‐up | N/A | |
| Language orientated: 6 | Language orientated: 1 death, 2 relocation, 3 withdrew | No follow‐up | N/A | |
| Language orientated: 6 | Language orientated: 1 death, 2 relocation, 3 withdrew | No follow‐up | N/A | |
| Conventional: 1 | Conventional: 1 death | No follow‐up | N/A | |
| Conventional: 5 | Conventional: 3 uncooperative, 2 illness | Conventional: 7 | Conventional: 3 illness, 4 refused | |
| Intensive: 6 | Reasons not detailed | Intensive: 4 | Not reported | |
| Conventional: 2 | Reasons not detailed | Conventional: 4 | Not reported | |
| Intensive: 6 | Reasons not detailed | Intensive: 4 | Not reported | |
| Intensive: 7 Conventional: 1 | Intensive: 4 declined, 2 discharged early, 1 died. Conventional: 1 declined | Intensive: 4 Conventional: 2 | Intensive: 4 refused Conventional: 1 refused, 1 death | |
| Group: 17 | 22 self‐discharged (return home or declined to travel), 4 illness, 2 stroke, 3 died, 2 returned to work | No follow‐up | N/A | |
| Conventional: 7 | Illness, new stroke | Conventional: 2 | Illness, new stroke | |
| Volunteer‐facilitated: 6 | Illness, new stroke | Volunteer‐facilitated: 1 | Illness, new stroke | |
| Conventional: 7 | Illness, new stroke | Conventional: 2 | Illness, new stroke | |
| ANELT: Amsterdam‐Nijmegen Everyday Language Test | ||||
| Outcome or subgroup title | No. of studies | No. of participants | Statistical method | Effect size |
| 1 Functional communication Show forest plot | 8 | 346 | Std. Mean Difference (IV, Fixed, 95% CI) | 0.30 [0.08, 0.52] |
| 1.1 WAB (Spontaneous Speech) | 2 | 55 | Std. Mean Difference (IV, Fixed, 95% CI) | 0.14 [‐0.40, 0.69] |
| 1.2 ANELT‐A | 1 | 18 | Std. Mean Difference (IV, Fixed, 95% CI) | 0.88 [‐0.10, 1.87] |
| 1.3 ANELT | 1 | 114 | Std. Mean Difference (IV, Fixed, 95% CI) | 0.15 [‐0.22, 0.52] |
| 1.4 Functional Communication Profile | 2 | 103 | Std. Mean Difference (IV, Fixed, 95% CI) | 0.25 [‐0.16, 0.66] |
| 1.5 Chinese Functional Communication Examination | 2 | 56 | Std. Mean Difference (IV, Fixed, 95% CI) | 0.77 [0.18, 1.37] |
| 2 Receptive language: auditory comprehension Show forest plot | 8 | 361 | Std. Mean Difference (IV, Fixed, 95% CI) | 0.06 [‐0.15, 0.27] |
| 2.1 PICA subtest | 2 | 55 | Std. Mean Difference (IV, Fixed, 95% CI) | 0.15 [‐0.40, 0.69] |
| 2.2 Token Test | 3 | 136 | Std. Mean Difference (IV, Fixed, 95% CI) | 0.08 [‐0.27, 0.43] |
| 2.3 Aphasia Battery of Chinese | 2 | 56 | Std. Mean Difference (IV, Fixed, 95% CI) | 0.08 [‐0.49, 0.65] |
| 2.4 Norsk Grunntest for Afasi | 1 | 114 | Std. Mean Difference (IV, Fixed, 95% CI) | ‐0.01 [‐0.38, 0.36] |
| 3 Receptive language: reading comprehension Show forest plot | 6 | 214 | Std. Mean Difference (IV, Fixed, 95% CI) | 0.29 [0.00, 0.58] |
| 3.1 Reading Comprehension Battery for Aphasia | 2 | 103 | Std. Mean Difference (IV, Fixed, 95% CI) | 0.11 [‐0.30, 0.52] |
| 3.2 PICA reading subtest | 2 | 55 | Std. Mean Difference (IV, Fixed, 95% CI) | 0.12 [‐0.42, 0.67] |
| 3.3 Aphasia Battery of Chinese | 2 | 56 | Std. Mean Difference (IV, Fixed, 95% CI) | 0.88 [0.28, 1.48] |
| 4 Receptive language: other Show forest plot | 4 | Mean Difference (IV, Fixed, 95% CI) | Subtotals only | |
| 4.1 PICA Gestural subtest | 4 | 158 | Mean Difference (IV, Fixed, 95% CI) | 8.04 [1.55, 14.52] |
| 5 Receptive language: gesture comprehension (unnamed) Show forest plot | 1 | Mean Difference (IV, Fixed, 95% CI) | Totals not selected | |
| 5.1 Gesture (unnamed) | 1 | Mean Difference (IV, Fixed, 95% CI) | 0.0 [0.0, 0.0] | |
| 5.2 Gesture (unnamed) 2‐month follow‐up | 1 | Mean Difference (IV, Fixed, 95% CI) | 0.0 [0.0, 0.0] | |
| 6 Expressive language: naming Show forest plot | 4 | 187 | Std. Mean Difference (IV, Fixed, 95% CI) | 0.09 [‐0.20, 0.38] |
| 6.1 Boston Naming Test | 1 | 18 | Std. Mean Difference (IV, Fixed, 95% CI) | ‐0.00 [‐0.93, 0.93] |
| 6.2 WAB Naming subtest | 2 | 55 | Std. Mean Difference (IV, Fixed, 95% CI) | 0.27 [‐0.27, 0.82] |
| 6.3 Norsk Grunntest for Afasi | 1 | 114 | Std. Mean Difference (IV, Fixed, 95% CI) | 0.02 [‐0.35, 0.39] |
| 7 Expressive language: general Show forest plot | 6 | 214 | Std. Mean Difference (IV, Random, 95% CI) | 0.77 [0.14, 1.39] |
| 7.1 PICA Verbal subtest | 4 | 158 | Std. Mean Difference (IV, Random, 95% CI) | 0.26 [‐0.07, 0.59] |
| 7.2 Aphasia Battery of Chinese (verbal presentation) | 2 | 56 | Std. Mean Difference (IV, Random, 95% CI) | 1.99 [1.03, 2.95] |
| 8 Expressive language: written Show forest plot | 6 | 214 | Std. Mean Difference (IV, Fixed, 95% CI) | 0.45 [0.16, 0.74] |
| 8.1 PICA Writing subtest | 2 | 55 | Std. Mean Difference (IV, Fixed, 95% CI) | 0.34 [‐0.21, 0.89] |
| 8.2 PICA Graphic | 2 | 103 | Std. Mean Difference (IV, Fixed, 95% CI) | 0.25 [‐0.16, 0.66] |
| 8.3 Aphasia Battery of Chinese (Writing) | 2 | 56 | Std. Mean Difference (IV, Fixed, 95% CI) | 1.02 [0.41, 1.63] |
| 9 Expressive language: written copying Show forest plot | 2 | Mean Difference (IV, Fixed, 95% CI) | Subtotals only | |
| 9.1 PICA Copying subtest | 2 | 55 | Mean Difference (IV, Fixed, 95% CI) | 3.88 [‐5.75, 13.50] |
| 10 Expressive language: repetition Show forest plot | 3 | 169 | Std. Mean Difference (IV, Fixed, 95% CI) | 0.06 [‐0.24, 0.37] |
| 10.1 WAB Repetition subtest | 2 | 55 | Std. Mean Difference (IV, Fixed, 95% CI) | 0.28 [‐0.27, 0.82] |
| 10.2 Norsk Grunntest for Afasi | 1 | 114 | Std. Mean Difference (IV, Fixed, 95% CI) | ‐0.04 [‐0.40, 0.33] |
| 11 Severity of impairment: Aphasia Battery Score (+ PICA) Show forest plot | 11 | 593 | Std. Mean Difference (IV, Random, 95% CI) | 0.55 [‐0.14, 1.25] |
| 11.1 Aphasia Quotient (CRRCAE) | 2 | 84 | Std. Mean Difference (IV, Random, 95% CI) | 0.02 [‐0.43, 0.47] |
| 11.2 Porch Index of Communicative Ability | 4 | 165 | Std. Mean Difference (IV, Random, 95% CI) | 0.26 [‐0.07, 0.58] |
| 11.3 BDAE (Chinese) | 1 | 36 | Std. Mean Difference (IV, Random, 95% CI) | 0.52 [‐0.15, 1.18] |
| 11.4 Aphasia Battery of Chinese (ABC) | 2 | 56 | Std. Mean Difference (IV, Random, 95% CI) | 0.23 [‐0.34, 0.80] |
| 11.5 Norsk Grunntest for Afasi (Coefficient) | 1 | 114 | Std. Mean Difference (IV, Random, 95% CI) | 0.03 [‐0.34, 0.40] |
| 11.6 Chinese Aphasia Measurement | 1 | 138 | Std. Mean Difference (IV, Random, 95% CI) | 3.84 [3.25, 4.43] |
| 12 Severity of impairment: Aphasia Battery Score (3‐month follow‐up) Show forest plot | 2 | Mean Difference (IV, Random, 95% CI) | Subtotals only | |
| 12.1 Aphasia Quotient (CRRCAE) 3‐month follow‐up | 2 | 84 | Mean Difference (IV, Random, 95% CI) | 20.74 [‐12.01, 53.48] |
| 13 Psychosocial: MAACL Show forest plot | 1 | Mean Difference (IV, Fixed, 95% CI) | Totals not selected | |
| 13.1 Anxiety Scale (MAACL) | 1 | Mean Difference (IV, Fixed, 95% CI) | 0.0 [0.0, 0.0] | |
| 13.2 Depression Scale (MAACL) | 1 | Mean Difference (IV, Fixed, 95% CI) | 0.0 [0.0, 0.0] | |
| 13.3 Hostility Scale (MAACL) | 1 | Mean Difference (IV, Fixed, 95% CI) | 0.0 [0.0, 0.0] | |
| 14 Number of dropouts (any reason) Show forest plot | 11 | 837 | Odds Ratio (M‐H, Fixed, 95% CI) | 0.82 [0.60, 1.12] |
| 15 Compliance with Allocated Intervention Show forest plot | 2 | 164 | Odds Ratio (M‐H, Fixed, 95% CI) | 1.04 [0.34, 3.15] |
| Outcome or subgroup title | No. of studies | No. of participants | Statistical method | Effect size |
| 1 Functional communication Show forest plot | 2 | 232 | Std. Mean Difference (IV, Fixed, 95% CI) | 0.04 [‐0.22, 0.29] |
| 1.1 Functional Communication Profile | 1 | 96 | Std. Mean Difference (IV, Fixed, 95% CI) | ‐0.10 [‐0.50, 0.30] |
| 1.2 TOMs | 1 | 136 | Std. Mean Difference (IV, Fixed, 95% CI) | 0.13 [‐0.20, 0.47] |
| 2 Functional communication ‐ follow‐up measures Show forest plot | 1 | Mean Difference (IV, Random, 95% CI) | Totals not selected | |
| 2.1 FCP (3‐month follow‐up) | 1 | Mean Difference (IV, Random, 95% CI) | 0.0 [0.0, 0.0] | |
| 2.2 FCP (6‐month follow‐up) | 1 | Mean Difference (IV, Random, 95% CI) | 0.0 [0.0, 0.0] | |
| 3 Receptive language: auditory comprehension Show forest plot | 2 | Mean Difference (IV, Fixed, 95% CI) | Totals not selected | |
| 3.1 PCB (Sentence Comprehension) | 1 | Mean Difference (IV, Fixed, 95% CI) | 0.0 [0.0, 0.0] | |
| 3.2 PCB (Picture Comprehension) | 1 | Mean Difference (IV, Fixed, 95% CI) | 0.0 [0.0, 0.0] | |
| 3.3 Token Test | 1 | Mean Difference (IV, Fixed, 95% CI) | 0.0 [0.0, 0.0] | |
| 4 Receptive language: other Show forest plot | 1 | Mean Difference (IV, Fixed, 95% CI) | Totals not selected | |
| 4.1 PICA Gestural subtest | 1 | Mean Difference (IV, Fixed, 95% CI) | 0.0 [0.0, 0.0] | |
| 5 Expressive language: single words Show forest plot | 1 | Mean Difference (IV, Fixed, 95% CI) | Totals not selected | |
| 5.1 Object Naming Test (ONT) | 1 | Mean Difference (IV, Fixed, 95% CI) | 0.0 [0.0, 0.0] | |
| 5.2 Word fluency | 1 | Mean Difference (IV, Fixed, 95% CI) | 0.0 [0.0, 0.0] | |
| 6 Expressive language: sentences Show forest plot | 1 | Mean Difference (IV, Fixed, 95% CI) | Totals not selected | |
| 6.1 Caplan & Hanna Test: total | 1 | Mean Difference (IV, Fixed, 95% CI) | 0.0 [0.0, 0.0] | |
| 6.2 Caplan & Hanna Test: treated | 1 | Mean Difference (IV, Fixed, 95% CI) | 0.0 [0.0, 0.0] | |
| 6.3 Caplan & Hanna Test: untreated | 1 | Mean Difference (IV, Fixed, 95% CI) | 0.0 [0.0, 0.0] | |
| 7 Expressive language: picture description Show forest plot | 2 | Std. Mean Difference (IV, Fixed, 95% CI) | Subtotals only | |
| 7.1 Picture description | 2 | 23 | Std. Mean Difference (IV, Fixed, 95% CI) | 0.26 [‐0.62, 1.15] |
| 7.2 Picture description with structure modelling: treated items | 1 | 5 | Std. Mean Difference (IV, Fixed, 95% CI) | 0.45 [‐1.44, 2.33] |
| 7.3 Picture description with structure modelling: untreated items | 1 | 5 | Std. Mean Difference (IV, Fixed, 95% CI) | 0.41 [‐1.46, 2.28] |
| 8 Expressive language: overall spoken Show forest plot | 1 | Mean Difference (IV, Fixed, 95% CI) | Totals not selected | |
| 8.1 PICA verbal subtest | 1 | Mean Difference (IV, Fixed, 95% CI) | 0.0 [0.0, 0.0] | |
| 9 Expressive language: written Show forest plot | 1 | Mean Difference (IV, Fixed, 95% CI) | Totals not selected | |
| 9.1 PICA graphic subtests | 1 | Mean Difference (IV, Fixed, 95% CI) | 0.0 [0.0, 0.0] | |
| 10 Severity of impairment: Aphasia Battery Score Show forest plot | 1 | Mean Difference (IV, Fixed, 95% CI) | Totals not selected | |
| 10.1 PICA | 1 | Mean Difference (IV, Fixed, 95% CI) | 0.0 [0.0, 0.0] | |
| 11 Psychosocial Show forest plot | 1 | Std. Mean Difference (IV, Fixed, 95% CI) | Totals not selected | |
| 11.1 COAST | 1 | Std. Mean Difference (IV, Fixed, 95% CI) | 0.0 [0.0, 0.0] | |
| 11.2 Carer COAST | 1 | Std. Mean Difference (IV, Fixed, 95% CI) | 0.0 [0.0, 0.0] | |
| 12 Number of dropouts for any reason Show forest plot | 5 | 413 | Odds Ratio (M‐H, Fixed, 95% CI) | 0.54 [0.34, 0.85] |
| 13 Compliance with Allocated Intervention Show forest plot | 5 | 409 | Odds Ratio (M‐H, Fixed, 95% CI) | 0.18 [0.09, 0.37] |
| 14 Economic outcomes Show forest plot | 1 | Mean Difference (IV, Fixed, 95% CI) | Totals not selected | |
| 14.1 Cost Data | 1 | Mean Difference (IV, Fixed, 95% CI) | 0.0 [0.0, 0.0] | |
| 14.2 Utility Data | 1 | Mean Difference (IV, Fixed, 95% CI) | 0.0 [0.0, 0.0] | |
| Outcome or subgroup title | No. of studies | No. of participants | Statistical method | Effect size |
| 1 Functional communication Show forest plot | 3 | 43 | Std. Mean Difference (IV, Fixed, 95% CI) | ‐0.41 [‐1.02, 0.21] |
| 1.1 CETI | 1 | 12 | Std. Mean Difference (IV, Fixed, 95% CI) | ‐0.86 [‐2.06, 0.35] |
| 1.2 Functional expression | 2 | 31 | Std. Mean Difference (IV, Fixed, 95% CI) | ‐0.25 [‐0.96, 0.46] |
| 2 Functional communication: catalogue ordering Show forest plot | 1 | Mean Difference (IV, Fixed, 95% CI) | Totals not selected | |
| 2.1 Telephone order (change from baseline) | 1 | Mean Difference (IV, Fixed, 95% CI) | 0.0 [0.0, 0.0] | |
| 2.2 Telephone order (+ concurrent task) (change from baseline) | 1 | Mean Difference (IV, Fixed, 95% CI) | 0.0 [0.0, 0.0] | |
| 2.3 Written order (change from baseline) | 1 | Mean Difference (IV, Fixed, 95% CI) | 0.0 [0.0, 0.0] | |
| 2.4 Written order (+ concurrent task) (change from baseline) | 1 | Mean Difference (IV, Fixed, 95% CI) | 0.0 [0.0, 0.0] | |
| 3 Receptive language: word comprehension Show forest plot | 2 | Std. Mean Difference (IV, Fixed, 95% CI) | Subtotals only | |
| 3.1 Word comprehension (BDAE subtest) | 2 | 33 | Std. Mean Difference (IV, Fixed, 95% CI) | ‐0.02 [‐0.70, 0.67] |
| 3.2 Identify body part (BDAE subtest) | 1 | 21 | Std. Mean Difference (IV, Fixed, 95% CI) | ‐0.22 [‐1.08, 0.64] |
| 3.3 Peabody PVT | 1 | 12 | Std. Mean Difference (IV, Fixed, 95% CI) | 0.13 [‐1.01, 1.26] |
| 4 Receptive language: other auditory comprehension Show forest plot | 5 | Std. Mean Difference (IV, Fixed, 95% CI) | Subtotals only | |
| 4.1 Sentence comprehension | 1 | 21 | Std. Mean Difference (IV, Fixed, 95% CI) | ‐0.51 [‐1.39, 0.36] |
| 4.2 AAT comprehension subtest | 1 | 17 | Std. Mean Difference (IV, Fixed, 95% CI) | 0.47 [‐0.51, 1.45] |
| 4.3 Token Test | 5 | 74 | Std. Mean Difference (IV, Fixed, 95% CI) | ‐0.00 [‐0.46, 0.46] |
| 5 Receptive language: auditory comprehension (treated items) Show forest plot | 1 | Mean Difference (IV, Fixed, 95% CI) | Totals not selected | |
| 5.1 Word comprehension (phonology) | 1 | Mean Difference (IV, Fixed, 95% CI) | 0.0 [0.0, 0.0] | |
| 5.2 Word comprehension (lexicon) | 1 | Mean Difference (IV, Fixed, 95% CI) | 0.0 [0.0, 0.0] | |
| 5.3 Sentence comprehension (morphosyntax) | 1 | Mean Difference (IV, Fixed, 95% CI) | 0.0 [0.0, 0.0] | |
| 6 Receptive language: reading comprehension Show forest plot | 1 | Mean Difference (IV, Fixed, 95% CI) | Totals not selected | |
| 6.1 Reading comprehension | 1 | Mean Difference (IV, Fixed, 95% CI) | 0.0 [0.0, 0.0] | |
| 7 Receptive language: other comprehension Show forest plot | 3 | 36 | Mean Difference (IV, Fixed, 95% CI) | ‐0.29 [‐0.97, 0.39] |
| 7.1 PICA gestural subtest | 3 | 36 | Mean Difference (IV, Fixed, 95% CI) | ‐0.29 [‐0.97, 0.39] |
| 8 Expressive language: naming Show forest plot | 7 | 98 | Std. Mean Difference (IV, Fixed, 95% CI) | 0.09 [‐0.31, 0.50] |
| 8.1 Object Naming Test (ONT) | 3 | 36 | Std. Mean Difference (IV, Fixed, 95% CI) | ‐0.25 [‐0.92, 0.41] |
| 8.2 AmAT naming test | 2 | 31 | Std. Mean Difference (IV, Fixed, 95% CI) | 0.30 [‐0.41, 1.01] |
| 8.3 Thorndike‐Lorge Word List | 1 | 14 | Std. Mean Difference (IV, Fixed, 95% CI) | 0.23 [‐0.83, 1.28] |
| 8.4 AAT naming subtest | 1 | 17 | Std. Mean Difference (IV, Fixed, 95% CI) | 0.34 [‐0.64, 1.31] |
| 9 Expressive language: naming (change from baseline) Show forest plot | 2 | 29 | Std. Mean Difference (IV, Fixed, 95% CI) | 0.61 [‐0.15, 1.36] |
| 9.1 Oral naming: PALPA (change from baseline) | 1 | 12 | Std. Mean Difference (IV, Fixed, 95% CI) | 0.44 [‐0.71, 1.59] |
| 9.2 Naming subtest (AAT) (change from baseline) | 1 | 17 | Std. Mean Difference (IV, Fixed, 95% CI) | 0.73 [‐0.26, 1.72] |
| 10 Expressive language: naming (follow‐up) Show forest plot | 1 | Mean Difference (IV, Fixed, 95% CI) | Totals not selected | |
| 10.1 Naming (3‐week follow‐up) | 1 | Mean Difference (IV, Fixed, 95% CI) | 0.0 [0.0, 0.0] | |
| 11 Expressive language: spoken sentence Show forest plot | 2 | Mean Difference (IV, Fixed, 95% CI) | Subtotals only | |
| 11.1 Sentence construction (AmAT) | 2 | 31 | Mean Difference (IV, Fixed, 95% CI) | ‐0.15 [‐3.26, 2.95] |
| 11.2 Sentence construction (AmAT) 3‐week follow‐up | 1 | 10 | Mean Difference (IV, Fixed, 95% CI) | ‐0.60 [‐3.27, 2.07] |
| 12 Expressive language: treated items Show forest plot | 1 | Std. Mean Difference (IV, Fixed, 95% CI) | Totals not selected | |
| 12.1 Naming (treated) | 1 | Std. Mean Difference (IV, Fixed, 95% CI) | 0.0 [0.0, 0.0] | |
| 12.2 Sentence construction (treated) | 1 | Std. Mean Difference (IV, Fixed, 95% CI) | 0.0 [0.0, 0.0] | |
| 12.3 Naming (treated: 3‐week follow‐up) | 1 | Std. Mean Difference (IV, Fixed, 95% CI) | 0.0 [0.0, 0.0] | |
| 12.4 Sentence construction (treated: 3‐week follow‐up) | 1 | Std. Mean Difference (IV, Fixed, 95% CI) | 0.0 [0.0, 0.0] | |
| 13 Expressive language: connected discourse Show forest plot | 3 | Std. Mean Difference (IV, Fixed, 95% CI) | Subtotals only | |
| 13.1 Picture description | 2 | 24 | Std. Mean Difference (IV, Fixed, 95% CI) | ‐0.20 [‐1.04, 0.64] |
| 13.2 PICA verbal subtest | 3 | 36 | Std. Mean Difference (IV, Fixed, 95% CI) | ‐0.31 [‐0.99, 0.37] |
| 14 Expressive language: fluency Show forest plot | 2 | Mean Difference (IV, Fixed, 95% CI) | Subtotals only | |
| 14.1 Word fluency | 2 | 24 | Mean Difference (IV, Fixed, 95% CI) | ‐8.19 [‐13.90, ‐2.47] |
| 15 Expressive language: repetition Show forest plot | 2 | Std. Mean Difference (IV, Fixed, 95% CI) | Totals not selected | |
| 15.1 AAT repetition subtest | 1 | Std. Mean Difference (IV, Fixed, 95% CI) | 0.0 [0.0, 0.0] | |
| 15.2 AAT repetition subtest (change from baseline) | 1 | Std. Mean Difference (IV, Fixed, 95% CI) | 0.0 [0.0, 0.0] | |
| 16 Expressive language: written Show forest plot | 5 | Std. Mean Difference (IV, Fixed, 95% CI) | Subtotals only | |
| 16.1 PICA graphic subtest | 3 | 36 | Std. Mean Difference (IV, Fixed, 95% CI) | ‐0.66 [‐1.35, 0.03] |
| 16.2 Written naming: PALPA (change from baseline) | 1 | 12 | Std. Mean Difference (IV, Fixed, 95% CI) | ‐0.25 [‐1.39, 0.88] |
| 16.3 Written subtest (AAT) (change from baseline) | 1 | 17 | Std. Mean Difference (IV, Fixed, 95% CI) | 1.20 [0.14, 2.25] |
| 17 Severity of impairment: Aphasia Battery Score Show forest plot | 4 | 53 | Std. Mean Difference (IV, Fixed, 95% CI) | ‐0.24 [‐0.80, 0.32] |
| 17.1 PICA overall | 3 | 36 | Std. Mean Difference (IV, Fixed, 95% CI) | ‐0.47 [‐1.15, 0.22] |
| 17.2 AAT overall | 1 | 17 | Std. Mean Difference (IV, Fixed, 95% CI) | 0.23 [‐0.74, 1.20] |
| 18 Severity of impairment: change from baseline Show forest plot | 1 | Mean Difference (IV, Fixed, 95% CI) | Totals not selected | |
| 18.1 AAT overall (change from baseline) | 1 | Mean Difference (IV, Fixed, 95% CI) | 0.0 [0.0, 0.0] | |
| 19 Number of dropouts for any reason Show forest plot | 1 | Odds Ratio (M‐H, Random, 95% CI) | Totals not selected | |
| 20 Compliance with Allocated Intervention Show forest plot | 1 | Odds Ratio (M‐H, Fixed, 95% CI) | Totals not selected | |
| Outcome or subgroup title | No. of studies | No. of participants | Statistical method | Effect size |
| 1 Functional communication Show forest plot | 1 | Std. Mean Difference (IV, Fixed, 95% CI) | Totals not selected | |
| 1.1 Functional Communication Profile | 1 | Std. Mean Difference (IV, Fixed, 95% CI) | 0.0 [0.0, 0.0] | |
| 1.2 Discourse Analysis | 1 | Std. Mean Difference (IV, Fixed, 95% CI) | 0.0 [0.0, 0.0] | |
| 2 Functional communication (follow‐up) Show forest plot | 1 | Std. Mean Difference (IV, Fixed, 95% CI) | Totals not selected | |
| 2.1 Functional Communication Profile (6‐month follow‐up) | 1 | Std. Mean Difference (IV, Fixed, 95% CI) | 0.0 [0.0, 0.0] | |
| 2.2 Discourse Analysis (6‐month follow‐up) | 1 | Std. Mean Difference (IV, Fixed, 95% CI) | 0.0 [0.0, 0.0] | |
| 3 Receptive language: auditory comprehension Show forest plot | 1 | Std. Mean Difference (IV, Fixed, 95% CI) | Totals not selected | |
| 3.1 AAT comprehension subtest | 1 | Std. Mean Difference (IV, Fixed, 95% CI) | 0.0 [0.0, 0.0] | |
| 3.2 Token Test | 1 | Std. Mean Difference (IV, Fixed, 95% CI) | 0.0 [0.0, 0.0] | |
| 4 Receptive language: auditory comprehension (change from baseline) Show forest plot | 1 | Std. Mean Difference (IV, Fixed, 95% CI) | Totals not selected | |
| 4.1 AAT Comprehension subtest | 1 | Std. Mean Difference (IV, Fixed, 95% CI) | 0.0 [0.0, 0.0] | |
| 4.2 Token Test | 1 | Std. Mean Difference (IV, Fixed, 95% CI) | 0.0 [0.0, 0.0] | |
| 5 Expressive language: spoken Show forest plot | 1 | Mean Difference (IV, Fixed, 95% CI) | Totals not selected | |
| 5.1 AAT naming subtest | 1 | Mean Difference (IV, Fixed, 95% CI) | 0.0 [0.0, 0.0] | |
| 5.2 AAT repetition subtest | 1 | Mean Difference (IV, Fixed, 95% CI) | 0.0 [0.0, 0.0] | |
| 6 Expressive language: spoken (change from baseline scores) Show forest plot | 1 | Mean Difference (IV, Fixed, 95% CI) | Totals not selected | |
| 6.1 AAT naming subtest | 1 | Mean Difference (IV, Fixed, 95% CI) | 0.0 [0.0, 0.0] | |
| 6.2 AAT repetition subtest | 1 | Mean Difference (IV, Fixed, 95% CI) | 0.0 [0.0, 0.0] | |
| 7 Expressive language: written (change from baseline scores) Show forest plot | 1 | 17 | Mean Difference (IV, Fixed, 95% CI) | 8.9 [1.81, 15.99] |
| 7.1 AAT written subtest | 1 | 17 | Mean Difference (IV, Fixed, 95% CI) | 8.9 [1.81, 15.99] |
| 8 Severity of impairment: Aphasia Battery Score Show forest plot | 4 | 162 | Std. Mean Difference (IV, Fixed, 95% CI) | 0.35 [0.04, 0.66] |
| 8.1 Aphasia Quotient (WAB) | 3 | 145 | Std. Mean Difference (IV, Fixed, 95% CI) | 0.36 [0.03, 0.70] |
| 8.2 AAT overall | 1 | 17 | Std. Mean Difference (IV, Fixed, 95% CI) | 0.23 [‐0.74, 1.20] |
| 9 Severity of impairment: Aphasia Battery Score (change from baseline) Show forest plot | 1 | Mean Difference (IV, Fixed, 95% CI) | Totals not selected | |
| 9.1 AAT profile (change from baseline) | 1 | Mean Difference (IV, Fixed, 95% CI) | 0.0 [0.0, 0.0] | |
| 10 Severity of impairment: Aphasia Battery Score (follow‐up) Show forest plot | 2 | Mean Difference (IV, Fixed, 95% CI) | Totals not selected | |
| 10.1 Aphasia Quotient (WAB) 3‐month follow‐up | 1 | Mean Difference (IV, Fixed, 95% CI) | 0.0 [0.0, 0.0] | |
| 10.2 Aphasia Quotient (WAB) 6‐month follow‐up | 1 | Mean Difference (IV, Fixed, 95% CI) | 0.0 [0.0, 0.0] | |
| 11 Number of dropouts for any reason Show forest plot | 3 | 186 | Odds Ratio (M‐H, Fixed, 95% CI) | 2.01 [1.07, 3.79] |
| 12 Compliance with Allocated Intervention Show forest plot | 2 | 166 | Odds Ratio (M‐H, Fixed, 95% CI) | 5.13 [0.84, 31.18] |
| Outcome or subgroup title | No. of studies | No. of participants | Statistical method | Effect size |
| 1 Functional communication Show forest plot | 1 | Mean Difference (IV, Fixed, 95% CI) | Totals not selected | |
| 1.1 Pragmatic Protocol ‐ 1 month | 1 | Mean Difference (IV, Fixed, 95% CI) | 0.0 [0.0, 0.0] | |
| 1.2 Pragmatic Protocol ‐ 6 months | 1 | Mean Difference (IV, Fixed, 95% CI) | 0.0 [0.0, 0.0] | |
| 1.3 Pragmatic Protocol ‐ 12 months | 1 | Mean Difference (IV, Fixed, 95% CI) | 0.0 [0.0, 0.0] | |
| 2 Receptive language: auditory comprehension Show forest plot | 2 | Std. Mean Difference (IV, Fixed, 95% CI) | Subtotals only | |
| 2.1 Token Test | 2 | 51 | Std. Mean Difference (IV, Fixed, 95% CI) | 0.25 [‐0.30, 0.81] |
| 2.2 AAT comprehension subtest | 1 | 17 | Std. Mean Difference (IV, Fixed, 95% CI) | 0.47 [‐0.51, 1.45] |
| 3 Receptive language: other Show forest plot | 1 | Mean Difference (IV, Fixed, 95% CI) | Totals not selected | |
| 3.1 PICA gestural subtest | 1 | Mean Difference (IV, Fixed, 95% CI) | 0.0 [0.0, 0.0] | |
| 4 Expressive language: spoken Show forest plot | 2 | Std. Mean Difference (IV, Fixed, 95% CI) | Totals not selected | |
| 4.1 AAT naming subtest | 1 | Std. Mean Difference (IV, Fixed, 95% CI) | 0.0 [0.0, 0.0] | |
| 4.2 PICA verbal subtest | 1 | Std. Mean Difference (IV, Fixed, 95% CI) | 0.0 [0.0, 0.0] | |
| 5 Expressive language: repetition Show forest plot | 1 | Mean Difference (IV, Fixed, 95% CI) | Totals not selected | |
| 5.1 AAT repetition subtest | 1 | Mean Difference (IV, Fixed, 95% CI) | 0.0 [0.0, 0.0] | |
| 6 Expressive language: written Show forest plot | 1 | Mean Difference (IV, Fixed, 95% CI) | Totals not selected | |
| 6.1 PICA graphic | 1 | Mean Difference (IV, Fixed, 95% CI) | 0.0 [0.0, 0.0] | |
| 7 Severity of impairment: Aphasia Battery Score Show forest plot | 3 | 105 | Std. Mean Difference (IV, Fixed, 95% CI) | 0.17 [‐0.22, 0.56] |
| 7.1 Aphasia Quotient CRRCAE | 1 | 54 | Std. Mean Difference (IV, Fixed, 95% CI) | 0.30 [‐0.24, 0.84] |
| 7.2 PICA overall | 1 | 34 | Std. Mean Difference (IV, Fixed, 95% CI) | ‐0.06 [‐0.73, 0.61] |
| 7.3 AAT overall | 1 | 17 | Std. Mean Difference (IV, Fixed, 95% CI) | 0.23 [‐0.74, 1.20] |
| 8 Severity of impairment: Aphasia Battery Score (3‐month follow‐up) Show forest plot | 1 | Mean Difference (IV, Fixed, 95% CI) | Totals not selected | |
| 8.1 Aphasia Quotient CRRCAE (3‐month follow‐up) | 1 | Mean Difference (IV, Fixed, 95% CI) | 0.0 [0.0, 0.0] | |
| 9 Number of dropouts for any reason Show forest plot | 1 | Odds Ratio (M‐H, Fixed, 95% CI) | Totals not selected | |
| Outcome or subgroup title | No. of studies | No. of participants | Statistical method | Effect size |
| 1 Functional communication Show forest plot | 1 | Std. Mean Difference (IV, Fixed, 95% CI) | Totals not selected | |
| 1.1 CADL | 1 | Std. Mean Difference (IV, Fixed, 95% CI) | 0.0 [0.0, 0.0] | |
| 1.2 Functional Communication Profile | 1 | Std. Mean Difference (IV, Fixed, 95% CI) | 0.0 [0.0, 0.0] | |
| 2 Receptive language: auditory comprehension Show forest plot | 2 | Std. Mean Difference (IV, Fixed, 95% CI) | Subtotals only | |
| 2.1 Token Test | 2 | 88 | Std. Mean Difference (IV, Fixed, 95% CI) | 0.06 [‐0.36, 0.47] |
| 2.2 AAT subtest | 1 | 20 | Std. Mean Difference (IV, Fixed, 95% CI) | ‐0.37 [‐1.25, 0.52] |
| 3 Receptive language: reading comprehension Show forest plot | 2 | Std. Mean Difference (IV, Fixed, 95% CI) | Totals not selected | |
| 3.1 Reading Comprehension Battery for Aphasia | 1 | Std. Mean Difference (IV, Fixed, 95% CI) | 0.0 [0.0, 0.0] | |
| 3.2 AAT subtest | 1 | Std. Mean Difference (IV, Fixed, 95% CI) | 0.0 [0.0, 0.0] | |
| 4 Receptive language: other Show forest plot | 1 | Mean Difference (IV, Fixed, 95% CI) | Totals not selected | |
| 4.1 PICA gestural subtest | 1 | Mean Difference (IV, Fixed, 95% CI) | 0.0 [0.0, 0.0] | |
| 5 Expressive language: spoken Show forest plot | 2 | Std. Mean Difference (IV, Fixed, 95% CI) | Totals not selected | |
| 5.1 AAT naming subtest | 1 | Std. Mean Difference (IV, Fixed, 95% CI) | 0.0 [0.0, 0.0] | |
| 5.2 PICA verbal subtest | 1 | Std. Mean Difference (IV, Fixed, 95% CI) | 0.0 [0.0, 0.0] | |
| 6 Expressive language: repetition Show forest plot | 1 | Mean Difference (IV, Fixed, 95% CI) | Totals not selected | |
| 6.1 AAT Repetition subtest | 1 | Mean Difference (IV, Fixed, 95% CI) | 0.0 [0.0, 0.0] | |
| 7 Expressive language: written Show forest plot | 2 | Std. Mean Difference (IV, Fixed, 95% CI) | Totals not selected | |
| 7.1 AAT written language subtest | 1 | Std. Mean Difference (IV, Fixed, 95% CI) | 0.0 [0.0, 0.0] | |
| 7.2 PICA graphic subtests | 1 | Std. Mean Difference (IV, Fixed, 95% CI) | 0.0 [0.0, 0.0] | |
| 8 Severity of impairment: Aphasia Battery Score Show forest plot | 3 | 126 | Std. Mean Difference (IV, Fixed, 95% CI) | ‐0.12 [‐0.47, 0.23] |
| 8.1 PICA | 2 | 106 | Std. Mean Difference (IV, Fixed, 95% CI) | ‐0.06 [‐0.44, 0.32] |
| 8.2 AAT | 1 | 20 | Std. Mean Difference (IV, Fixed, 95% CI) | ‐0.45 [‐1.34, 0.44] |
| 9 Number of dropouts for any reason Show forest plot | 3 | 206 | Odds Ratio (M‐H, Random, 95% CI) | 0.95 [0.49, 1.85] |
| 10 Compliance with allocated intervention Show forest plot | 2 | 125 | Odds Ratio (M‐H, Random, 95% CI) | 1.98 [0.52, 7.46] |
| Outcome or subgroup title | No. of studies | No. of participants | Statistical method | Effect size |
| 1 Functional communication Show forest plot | 1 | Mean Difference (IV, Fixed, 95% CI) | Totals not selected | |
| 1.1 Discourse (words per minute) | 1 | Mean Difference (IV, Fixed, 95% CI) | 0.0 [0.0, 0.0] | |
| 1.2 Discourse (content information units per minute) | 1 | Mean Difference (IV, Fixed, 95% CI) | 0.0 [0.0, 0.0] | |
| 2 Receptive language: reading comprehension Show forest plot | 1 | Mean Difference (IV, Fixed, 95% CI) | Totals not selected | |
| 2.1 WAB (Reading comprehension) | 1 | Mean Difference (IV, Fixed, 95% CI) | 0.0 [0.0, 0.0] | |
| 3 Expressive language: written Show forest plot | 1 | Mean Difference (IV, Fixed, 95% CI) | Totals not selected | |
| 3.1 WAB (Writing) | 1 | Mean Difference (IV, Fixed, 95% CI) | 0.0 [0.0, 0.0] | |
| 4 Severity of impairment: Aphasia Battery Score Show forest plot | 1 | Mean Difference (IV, Fixed, 95% CI) | Totals not selected | |
| 4.1 WAB AQ | 1 | Mean Difference (IV, Fixed, 95% CI) | 0.0 [0.0, 0.0] | |
| Outcome or subgroup title | No. of studies | No. of participants | Statistical method | Effect size |
| 1 Functional communication Show forest plot | 1 | Mean Difference (IV, Fixed, 95% CI) | Totals not selected | |
| 1.1 ANELT‐A | 1 | Mean Difference (IV, Fixed, 95% CI) | 0.0 [0.0, 0.0] | |
| 2 Receptive language: auditory Show forest plot | 1 | Mean Difference (IV, Fixed, 95% CI) | Totals not selected | |
| 2.1 Semantic Association Test: PALPA (change from baseline) | 1 | Mean Difference (IV, Fixed, 95% CI) | 0.0 [0.0, 0.0] | |
| 2.2 Auditory lexical decision: PALPA (change from baseline) | 1 | Mean Difference (IV, Fixed, 95% CI) | 0.0 [0.0, 0.0] | |
| 3 Receptive language: reading Show forest plot | 1 | Mean Difference (IV, Fixed, 95% CI) | Totals not selected | |
| 3.1 Synonym judgement: PALPA (change from baseline) | 1 | Mean Difference (IV, Fixed, 95% CI) | 0.0 [0.0, 0.0] | |
| 4 Expressive language: repetition Show forest plot | 1 | Mean Difference (IV, Fixed, 95% CI) | Totals not selected | |
| 4.1 Non‐words: PALPA (change from baseline) | 1 | Mean Difference (IV, Fixed, 95% CI) | 0.0 [0.0, 0.0] | |
| 5 Number of dropouts for any reason Show forest plot | 1 | Odds Ratio (M‐H, Fixed, 95% CI) | Totals not selected | |
| Outcome or subgroup title | No. of studies | No. of participants | Statistical method | Effect size |
| 1 Functional communication Show forest plot | 1 | Mean Difference (IV, Fixed, 95% CI) | Totals not selected | |
| 1.1 ANELT‐A | 1 | Mean Difference (IV, Fixed, 95% CI) | 0.0 [0.0, 0.0] | |
| 2 Receptive language: other comprehension Show forest plot | 1 | Std. Mean Difference (IV, Fixed, 95% CI) | Totals not selected | |
| 2.1 Token Test | 1 | Std. Mean Difference (IV, Fixed, 95% CI) | 0.0 [0.0, 0.0] | |
| 2.2 Semantic Association Test (Verbal) | 1 | Std. Mean Difference (IV, Fixed, 95% CI) | 0.0 [0.0, 0.0] | |
| 2.3 Semantic Association (PALPA) | 1 | Std. Mean Difference (IV, Fixed, 95% CI) | 0.0 [0.0, 0.0] | |
| 2.4 Auditory Lexical Decision (PALPA) | 1 | Std. Mean Difference (IV, Fixed, 95% CI) | 0.0 [0.0, 0.0] | |
| 3 Expressive language: fluency Show forest plot | 1 | Std. Mean Difference (IV, Fixed, 95% CI) | Totals not selected | |
| 3.1 Word fluency (letters) | 1 | Std. Mean Difference (IV, Fixed, 95% CI) | 0.0 [0.0, 0.0] | |
| 3.2 Word fluency (semantic) | 1 | Std. Mean Difference (IV, Fixed, 95% CI) | 0.0 [0.0, 0.0] | |
| 4 Expressive language: repetition Show forest plot | 1 | Mean Difference (IV, Fixed, 95% CI) | Totals not selected | |
| 4.1 Non‐word repetition (PALPA) | 1 | Mean Difference (IV, Fixed, 95% CI) | 0.0 [0.0, 0.0] | |
| 5 Number of dropouts for any reason Show forest plot | 1 | Odds Ratio (M‐H, Fixed, 95% CI) | Totals not selected | |
| 6 Compliance with Allocated Intervention Show forest plot | 1 | Odds Ratio (M‐H, Fixed, 95% CI) | Totals not selected | |
| Outcome or subgroup title | No. of studies | No. of participants | Statistical method | Effect size |
| 1 Receptive language: auditory comprehension Show forest plot | 1 | Mean Difference (IV, Fixed, 95% CI) | Totals not selected | |
| 1.1 WAB Auditory Comprehension | 1 | Mean Difference (IV, Fixed, 95% CI) | 0.0 [0.0, 0.0] | |
| 2 Receptive language: reading Show forest plot | 1 | Std. Mean Difference (IV, Fixed, 95% CI) | Totals not selected | |
| 2.1 Computer‐Based Verb Test (treated items) | 1 | Std. Mean Difference (IV, Fixed, 95% CI) | 0.0 [0.0, 0.0] | |
| 2.2 Computer‐Based Verb Test (untreated items) | 1 | Std. Mean Difference (IV, Fixed, 95% CI) | 0.0 [0.0, 0.0] | |
| 2.3 Real World Verb Test (treated items) | 1 | Std. Mean Difference (IV, Fixed, 95% CI) | 0.0 [0.0, 0.0] | |
| 2.4 Real World Verb Test (untreated items) | 1 | Std. Mean Difference (IV, Fixed, 95% CI) | 0.0 [0.0, 0.0] | |
| 2.5 Computer‐Based Preposition Test (treated items) | 1 | Std. Mean Difference (IV, Fixed, 95% CI) | 0.0 [0.0, 0.0] | |
| 2.6 Computer‐Based Preposition Test (untreated items) | 1 | Std. Mean Difference (IV, Fixed, 95% CI) | 0.0 [0.0, 0.0] | |
| 2.7 Real World Preposition Test (treated items) | 1 | Std. Mean Difference (IV, Fixed, 95% CI) | 0.0 [0.0, 0.0] | |
| 2.8 Real World Preposition Test (untreated items) | 1 | Std. Mean Difference (IV, Fixed, 95% CI) | 0.0 [0.0, 0.0] | |
| 2.9 Morphology | 1 | Std. Mean Difference (IV, Fixed, 95% CI) | 0.0 [0.0, 0.0] | |
| 3 Expressive language Show forest plot | 1 | Std. Mean Difference (IV, Fixed, 95% CI) | Totals not selected | |
| 3.1 WAB Naming subtest | 1 | Std. Mean Difference (IV, Fixed, 95% CI) | 0.0 [0.0, 0.0] | |
| 3.2 WAB Fluency subtest | 1 | Std. Mean Difference (IV, Fixed, 95% CI) | 0.0 [0.0, 0.0] | |
| 3.3 WAB Repetition subtest | 1 | Std. Mean Difference (IV, Fixed, 95% CI) | 0.0 [0.0, 0.0] | |
| 4 Severity of impairment: Aphasia Battery Score Show forest plot | 1 | Mean Difference (IV, Fixed, 95% CI) | Totals not selected | |
| 4.1 WAB AQ | 1 | Mean Difference (IV, Fixed, 95% CI) | 0.0 [0.0, 0.0] | |
| Outcome or subgroup title | No. of studies | No. of participants | Statistical method | Effect size |
| 1 Functional communication Show forest plot | 1 | Mean Difference (IV, Fixed, 95% CI) | Totals not selected | |
| 1.1 CADL (change from baseline) | 1 | Mean Difference (IV, Fixed, 95% CI) | 0.0 [0.0, 0.0] | |
| 1.2 CETI | 1 | Mean Difference (IV, Fixed, 95% CI) | 0.0 [0.0, 0.0] | |
| 2 Functional communication: catalogue ordering Show forest plot | 1 | Mean Difference (IV, Fixed, 95% CI) | Totals not selected | |
| 2.1 Telephone order (change from baseline) | 1 | Mean Difference (IV, Fixed, 95% CI) | 0.0 [0.0, 0.0] | |
| 2.2 Telephone order (+ concurrent task) (change from baseline) | 1 | Mean Difference (IV, Fixed, 95% CI) | 0.0 [0.0, 0.0] | |
| 2.3 Written order (change from baseline) | 1 | Mean Difference (IV, Fixed, 95% CI) | 0.0 [0.0, 0.0] | |
| 2.4 Written order (+ concurrent task) (change from baseline) | 1 | Mean Difference (IV, Fixed, 95% CI) | 0.0 [0.0, 0.0] | |
| 3 Expressive language: spoken Show forest plot | 1 | Mean Difference (IV, Fixed, 95% CI) | Totals not selected | |
| 3.1 Oral naming: PALPA (change from baseline) | 1 | Mean Difference (IV, Fixed, 95% CI) | 0.0 [0.0, 0.0] | |
| 4 Expressive language: written Show forest plot | 1 | Mean Difference (IV, Fixed, 95% CI) | Totals not selected | |
| 4.1 Written naming: PALPA (change from baseline) | 1 | Mean Difference (IV, Fixed, 95% CI) | 0.0 [0.0, 0.0] | |
| Outcome or subgroup title | No. of studies | No. of participants | Statistical method | Effect size |
| 1 Receptive language: auditory comprehension Show forest plot | 1 | Mean Difference (IV, Fixed, 95% CI) | Totals not selected | |
| 1.1 Token Test | 1 | Mean Difference (IV, Fixed, 95% CI) | 0.0 [0.0, 0.0] | |
| 1.2 AAT comprehension subtest | 1 | Mean Difference (IV, Fixed, 95% CI) | 0.0 [0.0, 0.0] | |
| 2 Expressive language: spoken Show forest plot | 1 | Mean Difference (IV, Fixed, 95% CI) | Totals not selected | |
| 2.1 AAT naming subtest | 1 | Mean Difference (IV, Fixed, 95% CI) | 0.0 [0.0, 0.0] | |
| 3 Expressive language: repetition Show forest plot | 1 | Mean Difference (IV, Fixed, 95% CI) | Totals not selected | |
| 3.1 AAT repetition subtest | 1 | Mean Difference (IV, Fixed, 95% CI) | 0.0 [0.0, 0.0] | |
| 4 Severity of impairment: Aphasia Battery Score Show forest plot | 1 | Mean Difference (IV, Fixed, 95% CI) | Totals not selected | |
| 4.1 AAT overall | 1 | Mean Difference (IV, Fixed, 95% CI) | 0.0 [0.0, 0.0] | |
| Outcome or subgroup title | No. of studies | No. of participants | Statistical method | Effect size |
| 1 Receptive language: auditory comprehension Show forest plot | 3 | Std. Mean Difference (IV, Fixed, 95% CI) | Subtotals only | |
| 1.1 Word comprehension (BDAE subtest) | 1 | 12 | Std. Mean Difference (IV, Fixed, 95% CI) | 0.13 [‐1.01, 1.26] |
| 1.2 Peabody PVT | 1 | 12 | Std. Mean Difference (IV, Fixed, 95% CI) | 0.13 [‐1.01, 1.26] |
| 1.3 Token Test | 3 | 36 | Std. Mean Difference (IV, Fixed, 95% CI) | 0.23 [‐0.43, 0.89] |
| 2 Receptive language: other Show forest plot | 3 | Mean Difference (IV, Fixed, 95% CI) | Subtotals only | |
| 2.1 PICA gestural subtest | 3 | 36 | Mean Difference (IV, Fixed, 95% CI) | ‐0.29 [‐0.97, 0.39] |
| 3 Expressive language: spoken Show forest plot | 3 | Std. Mean Difference (IV, Fixed, 95% CI) | Subtotals only | |
| 3.1 Naming | 3 | 36 | Std. Mean Difference (IV, Fixed, 95% CI) | ‐0.25 [‐0.92, 0.41] |
| 3.2 Word fluency | 2 | 24 | Std. Mean Difference (IV, Fixed, 95% CI) | ‐1.05 [‐1.93, ‐0.17] |
| 3.3 Picture description | 2 | 24 | Std. Mean Difference (IV, Fixed, 95% CI) | ‐0.20 [‐1.04, 0.64] |
| 3.4 PICA verbal subtest | 3 | 36 | Std. Mean Difference (IV, Fixed, 95% CI) | ‐0.31 [‐0.99, 0.37] |
| 4 Expressive language: written Show forest plot | 3 | Mean Difference (IV, Fixed, 95% CI) | Subtotals only | |
| 4.1 PICA graphic subtest | 3 | 36 | Mean Difference (IV, Fixed, 95% CI) | ‐0.85 [‐1.69, ‐0.01] |
| 5 Severity of impairment Show forest plot | 3 | Mean Difference (IV, Fixed, 95% CI) | Subtotals only | |
| 5.1 PICA overall | 3 | 36 | Mean Difference (IV, Fixed, 95% CI) | ‐0.74 [‐1.50, 0.01] |
| Outcome or subgroup title | No. of studies | No. of participants | Statistical method | Effect size |
| 1 Functional communication Show forest plot | 1 | 99 | Mean Difference (IV, Fixed, 95% CI) | ‐0.32 [‐1.03, 0.39] |
| 1.1 ANELT | 1 | 99 | Mean Difference (IV, Fixed, 95% CI) | ‐0.32 [‐1.03, 0.39] |
| 2 Receptive language: auditory comprehension Show forest plot | 1 | 99 | Mean Difference (IV, Fixed, 95% CI) | 0.12 [‐3.25, 3.49] |
| 2.1 Norsk Grunntest for Afasi | 1 | 99 | Mean Difference (IV, Fixed, 95% CI) | 0.12 [‐3.25, 3.49] |
| 3 Expressive language: naming Show forest plot | 1 | 99 | Mean Difference (IV, Fixed, 95% CI) | ‐0.38 [‐2.87, 2.11] |
| 3.1 Norsk Grunntest for Afasi | 1 | 99 | Mean Difference (IV, Fixed, 95% CI) | ‐0.38 [‐2.87, 2.11] |
| 4 Expressive language: repetition Show forest plot | 1 | 98 | Mean Difference (IV, Fixed, 95% CI) | ‐0.40 [‐2.73, 1.93] |
| 4.1 Norsk Grunntest for Afasi | 1 | 98 | Mean Difference (IV, Fixed, 95% CI) | ‐0.40 [‐2.73, 1.93] |
| 5 Severity of impairment: Aphasia Battery Score (6‐month follow‐up) Show forest plot | 1 | Mean Difference (IV, Fixed, 95% CI) | Subtotals only | |
| 5.1 Norsk Grunntest for Afasi | 1 | 99 | Mean Difference (IV, Fixed, 95% CI) | ‐0.5 [‐8.23, 7.23] |