Inositol in preterm infants at risk for or having respiratory distress syndrome
References
References to studies included in this review
References to studies awaiting assessment
References to ongoing studies
Additional references
References to other published versions of this review
Characteristics of studies
Characteristics of included studies [ordered by study ID]
Jump to:
| Methods | Randomised, placebo‐controlled trial | |
| Participants | Preterm infants (birth weight < 1500 g) with a diagnosis of RDS, requiring mechanical ventilation 24 infants were randomised to high concentration inositol formula (SC 30) and 24 infants were randomised to a low concentration of inositol formula (SC 24). Randomisation ended when the high‐inositol formula was no longer available Location: 2 NICUs in the US. Study period: October 1994 to June 1998 | |
| Interventions | The study group was enterally fed high‐inositol formula (2500 µmol/L inositol) , while the control group was given low‐inositol formula (242 µmol/L) enterally | |
| Outcomes | Neonatal deaths, infant deaths, infants with bacteraemia, necrotizing enterocolitis (radio graphically documented), IVH > grade 2, BPD (oxygen therapy > 30 days), duration of mechanical ventilation, ROP (reported in unpublished data from 1995) | |
| Notes | The results of this study have been reported 3 times; in abstract form in 1995 after 37 infants were enrolled; in a personal communication report to us in 1995 when 41 infants had been enrolled and in a final published report in 2000 when 48 infants had been entered | |
| Risk of bias | ||
| Bias | Authors' judgement | Support for judgement |
| Random sequence generation (selection bias) | Unclear risk | No information provided |
| Allocation concealment (selection bias) | Unclear risk | Infants were allocated to one of the two groups by sequential random card selection. No information provided whether the cards were enclosed in opaque and numbered envelopes |
| Blinding (performance bias and detection bias) | Unclear risk | Infants were blinded but no information provided whether the clinical staff and the researchers were |
| Incomplete outcome data (attrition bias) | Low risk | Outcomes provided for all 48 infants randomised |
| Selective reporting (reporting bias) | Low risk | Outcomes were reported as per the methods section |
| Other bias | High risk | The results of this study have been reported 3 times: in abstract form in 1995 after 37 infants were enrolled; in a personal communication report to us in 1995 when 41 infants had been enrolled; and in a final published report in 2000 when 48 infants had been entered |
| Methods | Randomised, placebo‐controlled, double blind trial. Enrolment from 1983 to 1985 | |
| Participants | Preterm infants (birth weight < 2000 g) with a diagnosis of RDS, requiring mechanical ventilation Location: One NICU in Helsinki, Finland. Study period: January 1983 to August 1985 | |
| Interventions | IV or po supplemental inositol or placebo (5% glucose) given daily for ten days | |
| Outcomes | Neonatal deaths, infant deaths, BPD (supplemental oxygen at 28 days and x‐ray findings compatible with BPD), IVH, ROP (ophthalmological exam at PMA of 9 and 13 months), NEC (clinical findings and abdominal x‐ray showing pneumatosis intestinalis and air in the portal circulation, and sepsis | |
| Notes | ||
| Risk of bias | ||
| Bias | Authors' judgement | Support for judgement |
| Random sequence generation (selection bias) | Unclear risk | No information provided |
| Allocation concealment (selection bias) | Low risk | "Infants were randomly and blindly assigned to be treated with inositol or placebo (glucose) after their parents had consented to their participation". For further details see "Blinding" below |
| Blinding (performance bias and detection bias) | Low risk | Each set of solutions, containing either inositol or glucose (5% weight/volume each) had a code number. Only the pharmacist preparing the doses knew the contents of the drug packages |
| Incomplete outcome data (attrition bias) | Low risk | Of the 83 infants who entered the trial, nine did not fulfil the entrance criteria and were excluded from the final analysis. An explanation was provided for each excluded infant |
| Selective reporting (reporting bias) | Low risk | Outcomes of interest listed in the methods section were reported on |
| Other bias | High risk | The present report represents the third interim analysis and the researchers may have been influenced by the results of the two previous interim analyses. The study was not registered in a trials registry |
| Methods | Randomised, placebo‐controlled, double blind trial, occurring between 1985 to 1989 | |
| Participants | Preterm infants (birth weight < 2000 g and a PMA of 24.0 to 31.9 weeks at birth) with evidence of RDS, requiring mechanical ventilation | |
| Interventions | The study group received IV inositol daily for five days, with repeated courses at day 10 and day 20 if necessary (infant continued to require ventilation, required supplemental O2 or did not tolerate enteral feeds). The control group received 5% glucose | |
| Outcomes | Neonatal death, infant death, BPD (supplemental oxygen at 28 days of age), BPD (supplemental oxygen at 38 weeks PMA or the week of discharge from hospital, ROP (as per International Classification assessed from 4 to 6 weeks and ending at 12 months), IVH (all grades, grade > 2), NEC (no definition provided), and sepsis (no definition provided) | |
| Notes | ||
| Risk of bias | ||
| Bias | Authors' judgement | Support for judgement |
| Random sequence generation (selection bias) | Unclear risk | No information provided |
| Allocation concealment (selection bias) | Unclear risk | Unclear |
| Blinding (performance bias and detection bias) | Unclear risk | 5% glucose was given as placebo, but no information provided on whether staff was blinded to study drugs or not |
| Incomplete outcome data (attrition bias) | Low risk | Four infants in the placebo group and three in the inositol group died before receiving any treatment, two had lethal malformations (one in each group), and three did not have RDS (two in the placebo group and one in the inositol group). These 12 infants were included only in the safety analysis |
| Selective reporting (reporting bias) | Unclear risk | This study was not registered in a trials registry. Outcomes of interest are listed in the methods section |
| Other bias | High risk | Interim analyses were to be performed after enrolment of 100, 200, 300 patients. Early termination of the trial was recommended by the monitoring committee after the second interim analysis, when the Chi2 test revealed a significant increase in neonatal survival without BPD and no trend towards serious morbidity in one study group. One interim analysis previously reported, Hallman 1992 (published in Lung 1990;168 Suppl:877‐82) |
| Methods | Randomised, double masked, placebo‐controlled pharmacokinetic (PK) study. Enrolment between June 2006 and December 2007. The trial was conducted by the National Institues of Child Health and Human Development Neonatal Research Network. Ten of the Neonatal Research Network Centers participated | |
| Participants | Eligable subjects were of 23 0/7 to 29 6/7 weeks PMA and ≥ 600 g BW, had no major congenital anomalies, were between 12 hours and 6 days of age at randomisation, and had received no human milk or formula feedings since birth | |
| Interventions | Inositol was given as a single low (60 mg/kg) (n = 25) or high (120 mg/kg) (n = 24) dose of 5% myo‐inositol IV over 20 min in a 1:1:1 randomisation with placebo delivered in one of two volumes to maintain masking (5% glucose) (n = 25). Drug or placebo was dispensed from the respective pharmacies in unit doses labelled as 'inositol study drug', and all clinical and research personnel except the pharmacist were masked to the study group | |
| Outcomes | Pharmacokinetic data for inositol (central volume of distribution, clearance, endogenous production, the half‐life, renal inositol excretion during the first 12 h and after 48 h and diuretic side effect | |
| Notes | Abbott Nutrition Division, Abbott Laboratories, supplied the inositol drug used in the study Portions of this study were presented at the 2010 Pediatric Academic Societies Annual Meeting, Vancouver, Canada, May 1–4, 2010 (Abstract 3737.387) | |
| Risk of bias | ||
| Bias | Authors' judgement | Support for judgement |
| Random sequence generation (selection bias) | Low risk | Randomisation was performed centrally via computer within two pre‐specified PMA strata (23 0/7 to 26 6/7 weeks and 27 0/7 to 29 6/7 weeks) |
| Allocation concealment (selection bias) | Low risk | There was central allocation to study group |
| Blinding (performance bias and detection bias) | Low risk | Drug or placebo was dispensed from the respective pharmacies in unit doses labelled as 'inositol study drug', and all clinical and research personnel except the pharmacist were masked to the study group |
| Incomplete outcome data (attrition bias) | Low risk | Consent was obtained for 79 infants, 76 infants were randomised, and 74 infants received study drug. Two infants did not complete the minimum of four specified blood samples (three post drug infusion), and their randomisations were replaced with two additional enrollees from the same centre and of the same gestational age (GA) stratum, per protocol. Available data from the two replaced infants were included in the PK and safety analyses. One infant received placebo instead of the assigned 120 mg/kg dose, and for the PK analysis, this infant’s serum and urine data were included in the placebo group. However, this subject’s data on adverse events and clinical outcomes were included as randomised (intention to treat) |
| Selective reporting (reporting bias) | Low risk | The study was registered with ClinicalTrials.gov (NCT00349726) and there does not appear to be any deviations from the protocol |
| Other bias | Low risk | Appears free of other bias |
BW = birth weight
PMA = postmenstrual age
PK = pharmacokinetics
Characteristics of studies awaiting assessment [ordered by study ID]
Jump to:
| Methods | Randomised controlled trial |
| Participants | 122 infants of 23 0/7 to 29 6/7 weeks PMA and BW ≥ 400 g |
| Interventions | Infants were randomised to placebo, 10, 40 or 80 mg/kg/day of IV inositol (divided every 12 hours) from enrolment on day 1 to 3 to 10 weeks of age, to 34 weeks PMA or to discharge. Once feedings were established the same dose of study drug was given enterally |
| Outcomes | Pharmacokinetics (PK) and adverse events (no data for clinical outcomes were presented) |
| Notes | This study has been published in abstract form only and we decided not to complete the risk of bias table as enough information was not provided in the abstract |
Characteristics of ongoing studies [ordered by study ID]
Jump to:
| Trial name or title | Inositol to reduce retinopathy of prematurity (INS‐3) |
| Methods | This is a phase 3, randomised, double masked, placebo‐controlled study designed to determine the effectiveness of inositol in premature infants < 28 0/7 weeks gestation |
| Participants | 1760 preterm infants < 28 0/7 weeks PMA |
| Interventions | Experimental: myo‐inositol 5% injection: within 12 to 72 hours of birth, infants will receive 80 mg myo‐inositol 5% injection/kg/day, administered in divided doses every 12 hours (40 mg/kg/dose). Study drug will be administered daily and continued until the earliest of 34 completed weeks PMA, 10 weeks (70 days) chronological age, or the time of discharge. Myo‐inositol 5% injection will be administered IV until enteral feedings are established, at which time the same dose and formulation will be administered enterally every 12 hours Placebo comparator: 5% glucose (dextrose) ‐ within 12 to 72 hours of birth, infants will receive 80 mg 5% glucose (dextrose) USP for intravenous infusion per kilogram per day, administered in divided doses every 12 hours (40 mg/kg/dose). Study drug will be administered daily and continued until the earliest of 34 completed weeks PMA, 10 weeks (70 days) chronological age, or the time of discharge. Myo‐inositol 5% Injection will be administered IV until enteral feedings are established, at which time the same dose and formulation will be administered enterally every 12 hours |
| Outcomes | Incidence of survival without severe retinopathy of prematurity (ROP) through acute and final ROP determination up to 55 weeks PMA |
| Starting date | April 2014 |
| Contact information | Dale L Phelps, MD; phone: 707‐897‐9063; email: [email protected] |
| Notes | Final data collection date for primary outcome measure: January 2017. ClinicalTrials.gov identifier: NCT01954082 |
BW = birth weight
PMA = postmenstrual age
Data and analyses
| Outcome or subgroup title | No. of studies | No. of participants | Statistical method | Effect size |
| 1 Neonatal death (age < 28 days) Show forest plot | 3 | 355 | Risk Ratio (M‐H, Fixed, 95% CI) | 0.53 [0.31, 0.91] |
| Analysis 1.1  Comparison 1 Inositol supplementation versus control, Outcome 1 Neonatal death (age < 28 days). | ||||
| 2 Infant death (age < one year) Show forest plot | 3 | 355 | Risk Ratio (M‐H, Fixed, 95% CI) | 0.55 [0.40, 0.77] |
| Analysis 1.2  Comparison 1 Inositol supplementation versus control, Outcome 2 Infant death (age < one year). | ||||
| 3 Bronchopulmonary dysplasia (at 28 to 30 days of age) Show forest plot | 3 | 343 | Risk Ratio (M‐H, Fixed, 95% CI) | 0.78 [0.54, 1.13] |
| Analysis 1.3  Comparison 1 Inositol supplementation versus control, Outcome 3 Bronchopulmonary dysplasia (at 28 to 30 days of age). | ||||
| 4 Bronchopulmonary dysplasia (at 36 to 38 weeks PMA) Show forest plot | 1 | 177 | Risk Ratio (M‐H, Fixed, 95% CI) | 1.30 [0.64, 2.64] |
| Analysis 1.4  Comparison 1 Inositol supplementation versus control, Outcome 4 Bronchopulmonary dysplasia (at 36 to 38 weeks PMA). | ||||
| 5 Retinopathy of prematurity, stage ≥ 3 Show forest plot | 2 | 262 | Risk Ratio (M‐H, Fixed, 95% CI) | 0.09 [0.01, 0.67] |
| Analysis 1.5  Comparison 1 Inositol supplementation versus control, Outcome 5 Retinopathy of prematurity, stage ≥ 3. | ||||
| 6 Retinopathy of prematurity, any stage Show forest plot | 3 | 336 | Risk Ratio (M‐H, Fixed, 95% CI) | 0.62 [0.38, 1.01] |
| Analysis 1.6 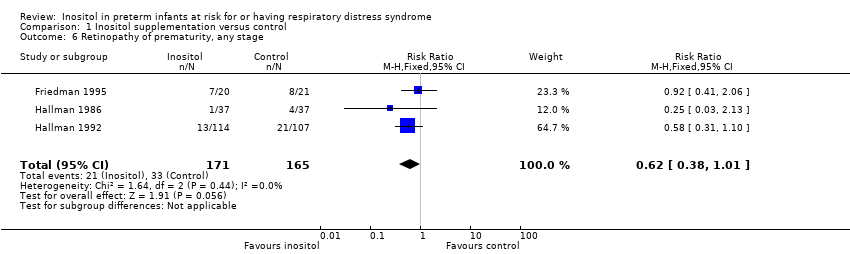 Comparison 1 Inositol supplementation versus control, Outcome 6 Retinopathy of prematurity, any stage. | ||||
| 7 Necrotizing enterocolitis Show forest plot | 3 | 355 | Risk Ratio (M‐H, Fixed, 95% CI) | 1.17 [0.51, 2.70] |
| Analysis 1.7  Comparison 1 Inositol supplementation versus control, Outcome 7 Necrotizing enterocolitis. | ||||
| 8 Sepsis Show forest plot | 2 | 307 | Risk Ratio (M‐H, Fixed, 95% CI) | 0.83 [0.51, 1.37] |
| Analysis 1.8  Comparison 1 Inositol supplementation versus control, Outcome 8 Sepsis. | ||||
| 9 Intraventricular haemorrhage, grade > 2 Show forest plot | 3 | 355 | Risk Ratio (M‐H, Fixed, 95% CI) | 0.53 [0.31, 0.90] |
| Analysis 1.9  Comparison 1 Inositol supplementation versus control, Outcome 9 Intraventricular haemorrhage, grade > 2. | ||||
| 10 Intraventricular haemorrhage, all grades Show forest plot | 2 | 307 | Risk Ratio (M‐H, Fixed, 95% CI) | 0.82 [0.61, 1.11] |
| Analysis 1.10  Comparison 1 Inositol supplementation versus control, Outcome 10 Intraventricular haemorrhage, all grades. | ||||
| 11 Minor neural developmental impairment at one year corrected age Show forest plot | 1 | 169 | Risk Ratio (M‐H, Fixed, 95% CI) | 0.84 [0.38, 1.86] |
| Analysis 1.11  Comparison 1 Inositol supplementation versus control, Outcome 11 Minor neural developmental impairment at one year corrected age. | ||||
| 12 Major neural developmental impairment at one year corrected age Show forest plot | 1 | 169 | Risk Ratio (M‐H, Fixed, 95% CI) | 0.53 [0.24, 1.16] |
| Analysis 1.12  Comparison 1 Inositol supplementation versus control, Outcome 12 Major neural developmental impairment at one year corrected age. | ||||
| Outcome or subgroup title | No. of studies | No. of participants | Statistical method | Effect size |
| 1 Death during hospital stay Show forest plot | 1 | 74 | Risk Ratio (M‐H, Fixed, 95% CI) | 1.19 [0.34, 4.21] |
| Analysis 2.1 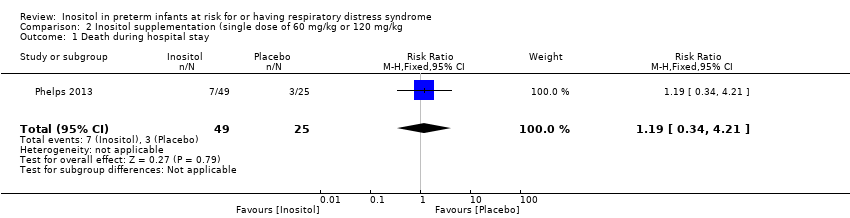 Comparison 2 Inositol supplementation (single dose of 60 mg/kg or 120 mg/kg, Outcome 1 Death during hospital stay. | ||||
| 2 Bronchopulmonary dysplasia at 36 weeks PMA Show forest plot | 1 | 65 | Risk Ratio (M‐H, Fixed, 95% CI) | 2.74 [0.88, 8.48] |
| Analysis 2.2  Comparison 2 Inositol supplementation (single dose of 60 mg/kg or 120 mg/kg, Outcome 2 Bronchopulmonary dysplasia at 36 weeks PMA. | ||||
| 3 Retinopathy of prematurity (infants who underwent surgery for ROP) Show forest plot | 1 | 25 | Risk Ratio (M‐H, Fixed, 95% CI) | 0.35 [0.10, 1.22] |
| Analysis 2.3  Comparison 2 Inositol supplementation (single dose of 60 mg/kg or 120 mg/kg, Outcome 3 Retinopathy of prematurity (infants who underwent surgery for ROP). | ||||
| 4 Necrotizing enterocolitis (stage 2A or worse) Show forest plot | 1 | 74 | Risk Ratio (M‐H, Fixed, 95% CI) | 0.41 [0.12, 1.39] |
| Analysis 2.4  Comparison 2 Inositol supplementation (single dose of 60 mg/kg or 120 mg/kg, Outcome 4 Necrotizing enterocolitis (stage 2A or worse). | ||||
| 5 Necrotizing enterocolitis (infants who underwent surgery for NEC) Show forest plot | 1 | 74 | Risk Ratio (M‐H, Fixed, 95% CI) | 0.51 [0.08, 3.41] |
| Analysis 2.5 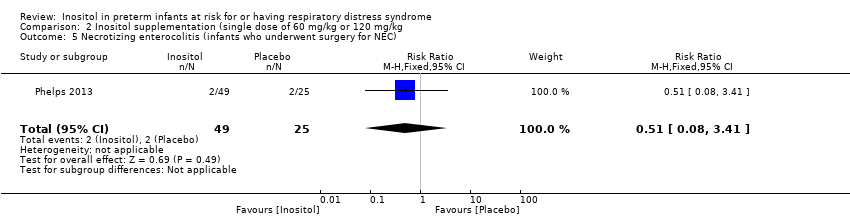 Comparison 2 Inositol supplementation (single dose of 60 mg/kg or 120 mg/kg, Outcome 5 Necrotizing enterocolitis (infants who underwent surgery for NEC). | ||||
| 6 Sepsis (late onset) Show forest plot | 1 | 74 | Risk Ratio (M‐H, Fixed, 95% CI) | 1.46 [0.71, 2.97] |
| Analysis 2.6 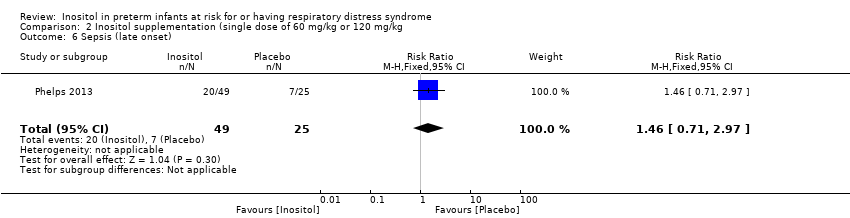 Comparison 2 Inositol supplementation (single dose of 60 mg/kg or 120 mg/kg, Outcome 6 Sepsis (late onset). | ||||
| 7 Intraventricular haemorrhage (grade 3 or 4) Show forest plot | 1 | 72 | Risk Ratio (M‐H, Fixed, 95% CI) | 1.06 [0.29, 3.90] |
| Analysis 2.7  Comparison 2 Inositol supplementation (single dose of 60 mg/kg or 120 mg/kg, Outcome 7 Intraventricular haemorrhage (grade 3 or 4). | ||||
| 8 Hearing test (failed both ears) Show forest plot | 1 | 57 | Risk Ratio (M‐H, Fixed, 95% CI) | 0.58 [0.09, 3.84] |
| Analysis 2.8  Comparison 2 Inositol supplementation (single dose of 60 mg/kg or 120 mg/kg, Outcome 8 Hearing test (failed both ears). | ||||

Forest plot of comparison: 1 Inositol supplementation versus control, outcome: 1.1 Neonatal death (age < 28 days).
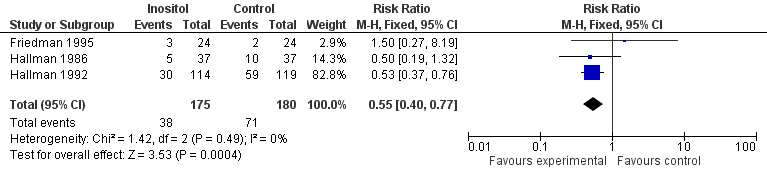
Forest plot of comparison: 1 Inositol supplementation versus control, outcome: 1.2 Infant death (age < one year).

Forest plot of comparison: 1 Inositol supplementation versus control, outcome: 1.5 Retinopathy of prematurity, stage ≥ 3.
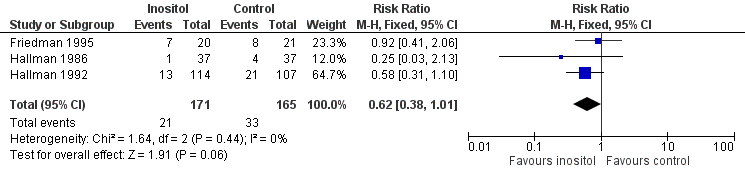
Forest plot of comparison: 1 Inositol supplementation versus control, outcome: 1.6 Retinopathy of prematurity, any stage.

Forest plot of comparison: 1 Inositol supplementation versus control, outcome: 1.9 Intraventricular haemorrhage, grade > 2.
Comparison 1 Inositol supplementation versus control, Outcome 1 Neonatal death (age < 28 days).
Comparison 1 Inositol supplementation versus control, Outcome 2 Infant death (age < one year).
Comparison 1 Inositol supplementation versus control, Outcome 3 Bronchopulmonary dysplasia (at 28 to 30 days of age).
Comparison 1 Inositol supplementation versus control, Outcome 4 Bronchopulmonary dysplasia (at 36 to 38 weeks PMA).
Comparison 1 Inositol supplementation versus control, Outcome 5 Retinopathy of prematurity, stage ≥ 3.
Comparison 1 Inositol supplementation versus control, Outcome 6 Retinopathy of prematurity, any stage.
Comparison 1 Inositol supplementation versus control, Outcome 7 Necrotizing enterocolitis.
Comparison 1 Inositol supplementation versus control, Outcome 8 Sepsis.
Comparison 1 Inositol supplementation versus control, Outcome 9 Intraventricular haemorrhage, grade > 2.
Comparison 1 Inositol supplementation versus control, Outcome 10 Intraventricular haemorrhage, all grades.
Comparison 1 Inositol supplementation versus control, Outcome 11 Minor neural developmental impairment at one year corrected age.
Comparison 1 Inositol supplementation versus control, Outcome 12 Major neural developmental impairment at one year corrected age.
Comparison 2 Inositol supplementation (single dose of 60 mg/kg or 120 mg/kg, Outcome 1 Death during hospital stay.
Comparison 2 Inositol supplementation (single dose of 60 mg/kg or 120 mg/kg, Outcome 2 Bronchopulmonary dysplasia at 36 weeks PMA.
Comparison 2 Inositol supplementation (single dose of 60 mg/kg or 120 mg/kg, Outcome 3 Retinopathy of prematurity (infants who underwent surgery for ROP).
Comparison 2 Inositol supplementation (single dose of 60 mg/kg or 120 mg/kg, Outcome 4 Necrotizing enterocolitis (stage 2A or worse).
Comparison 2 Inositol supplementation (single dose of 60 mg/kg or 120 mg/kg, Outcome 5 Necrotizing enterocolitis (infants who underwent surgery for NEC).
Comparison 2 Inositol supplementation (single dose of 60 mg/kg or 120 mg/kg, Outcome 6 Sepsis (late onset).
Comparison 2 Inositol supplementation (single dose of 60 mg/kg or 120 mg/kg, Outcome 7 Intraventricular haemorrhage (grade 3 or 4).
Comparison 2 Inositol supplementation (single dose of 60 mg/kg or 120 mg/kg, Outcome 8 Hearing test (failed both ears).
| Outcome or subgroup title | No. of studies | No. of participants | Statistical method | Effect size |
| 1 Neonatal death (age < 28 days) Show forest plot | 3 | 355 | Risk Ratio (M‐H, Fixed, 95% CI) | 0.53 [0.31, 0.91] |
| 2 Infant death (age < one year) Show forest plot | 3 | 355 | Risk Ratio (M‐H, Fixed, 95% CI) | 0.55 [0.40, 0.77] |
| 3 Bronchopulmonary dysplasia (at 28 to 30 days of age) Show forest plot | 3 | 343 | Risk Ratio (M‐H, Fixed, 95% CI) | 0.78 [0.54, 1.13] |
| 4 Bronchopulmonary dysplasia (at 36 to 38 weeks PMA) Show forest plot | 1 | 177 | Risk Ratio (M‐H, Fixed, 95% CI) | 1.30 [0.64, 2.64] |
| 5 Retinopathy of prematurity, stage ≥ 3 Show forest plot | 2 | 262 | Risk Ratio (M‐H, Fixed, 95% CI) | 0.09 [0.01, 0.67] |
| 6 Retinopathy of prematurity, any stage Show forest plot | 3 | 336 | Risk Ratio (M‐H, Fixed, 95% CI) | 0.62 [0.38, 1.01] |
| 7 Necrotizing enterocolitis Show forest plot | 3 | 355 | Risk Ratio (M‐H, Fixed, 95% CI) | 1.17 [0.51, 2.70] |
| 8 Sepsis Show forest plot | 2 | 307 | Risk Ratio (M‐H, Fixed, 95% CI) | 0.83 [0.51, 1.37] |
| 9 Intraventricular haemorrhage, grade > 2 Show forest plot | 3 | 355 | Risk Ratio (M‐H, Fixed, 95% CI) | 0.53 [0.31, 0.90] |
| 10 Intraventricular haemorrhage, all grades Show forest plot | 2 | 307 | Risk Ratio (M‐H, Fixed, 95% CI) | 0.82 [0.61, 1.11] |
| 11 Minor neural developmental impairment at one year corrected age Show forest plot | 1 | 169 | Risk Ratio (M‐H, Fixed, 95% CI) | 0.84 [0.38, 1.86] |
| 12 Major neural developmental impairment at one year corrected age Show forest plot | 1 | 169 | Risk Ratio (M‐H, Fixed, 95% CI) | 0.53 [0.24, 1.16] |
| Outcome or subgroup title | No. of studies | No. of participants | Statistical method | Effect size |
| 1 Death during hospital stay Show forest plot | 1 | 74 | Risk Ratio (M‐H, Fixed, 95% CI) | 1.19 [0.34, 4.21] |
| 2 Bronchopulmonary dysplasia at 36 weeks PMA Show forest plot | 1 | 65 | Risk Ratio (M‐H, Fixed, 95% CI) | 2.74 [0.88, 8.48] |
| 3 Retinopathy of prematurity (infants who underwent surgery for ROP) Show forest plot | 1 | 25 | Risk Ratio (M‐H, Fixed, 95% CI) | 0.35 [0.10, 1.22] |
| 4 Necrotizing enterocolitis (stage 2A or worse) Show forest plot | 1 | 74 | Risk Ratio (M‐H, Fixed, 95% CI) | 0.41 [0.12, 1.39] |
| 5 Necrotizing enterocolitis (infants who underwent surgery for NEC) Show forest plot | 1 | 74 | Risk Ratio (M‐H, Fixed, 95% CI) | 0.51 [0.08, 3.41] |
| 6 Sepsis (late onset) Show forest plot | 1 | 74 | Risk Ratio (M‐H, Fixed, 95% CI) | 1.46 [0.71, 2.97] |
| 7 Intraventricular haemorrhage (grade 3 or 4) Show forest plot | 1 | 72 | Risk Ratio (M‐H, Fixed, 95% CI) | 1.06 [0.29, 3.90] |
| 8 Hearing test (failed both ears) Show forest plot | 1 | 57 | Risk Ratio (M‐H, Fixed, 95% CI) | 0.58 [0.09, 3.84] |