Electrocardiograma (ECG) fetal para la monitorización del feto durante el trabajo de parto
References
References to studies included in this review
References to studies excluded from this review
References to studies awaiting assessment
References to ongoing studies
Additional references
References to other published versions of this review
Characteristics of studies
Characteristics of included studies [ordered by study ID]
| Methods | Random allocation through computer‐generated random numbers table, triggered by switching on the software in the fetal monitoring equipment. | |
| Participants | 4966 women in labour at > 36 weeks with singleton pregnancies, cephalic presentation and perceived need for continuous fetal heart rate monitoring via a fetal scalp electrode ‐ high‐risk pregnancies, suspicious or abnormal CTG, induced labour, oxytocin augmentation, meconium‐stained amniotic fluid or epidural analgesia. The trial took place between 1998 and 2000 in 3 Swedish centres, Lund, Malmo, Gothenburg. | |
| Interventions | CTG plus ST analysis of fetal ECG (2519 women) versus CTG alone (2477). The monitoring device was the STAN S21 (Neoventa Medical, Gothenburg), which incorporates an 'expert system' to provide advice to clinical staff. In this, it constitutes a technically more advanced system than used in the Westgate 1993 trial. | |
| Outcomes | Primary: metabolic acidosis at birth (umbilical cord artery pH < 7.05 plus base deficit > 12 mmol/L). Secondary: operative deliveries, Apgar scores at 1 and 5 minutes, admissions to special care unit. | |
| Notes | Incomplete data available for acid‐base results (2159 and 2079). The published report includes a secondary analysis performed after exclusion of babies with malformations and cases associated with trial protocol violations. The results included in this review are exclusively from the primary analysis, based on 'intention‐to‐treat'. An interim analysis was performed after around 1800 recruits; this revealed 'protocol violations' (failure to intervene on the basis of guidance in the research protocol) and the interim results were discussed with the clinical staff at the recruiting centres as part of a process of 're‐training'. The study was co‐funded by the Swedish Government Public Health Service, Neoventa Medical AB (manufacturer of the STAN device) and the Knowledge Foundation, Stockholm. Concerns were raised about the conduct and reporting of this trial, resulting in 3 separate external reviews. The final review (Swedish Research Council 2010) was critical of the role of the originator of the STAN device role as the monitor of trial ‐ because of conflicted interests. The report also required the re‐reporting of cord gas results (these have been corrected in the review and have now been published (Amer‐Wahlin 2011; Marsal 2011) but other reported outcomes were not in dispute. There was no suggestion of deliberate attempts to manipulate the data (University of Lund 2010). | |
| Risk of bias | ||
| Bias | Authors' judgement | Support for judgement |
| Random sequence generation (selection bias) | Low risk | “the first number available from a computer‐generated table of random numbers was used to assign the women [..] according to whether the number was even or odd.” Pg 535 (Participants and methods – Methods). |
| Allocation concealment (selection bias) | Low risk | “Women were randomly assigned fetal monitoring [..] when STAN S21 equipment started up, the first number available from a computer‐generated table of random numbers was used to assign the women [..] according to whether the number was even or odd.” Pg 535 (Participants and methods – Methods). |
| Blinding of participants and personnel (performance bias) | Unclear risk | “Although no electrocardiographic information was available at the time of monitoring in the CTG group, fetal electrocardiogram signals were automatically stored for both groups for future analysis.” Insufficient information. |
| Blinding of outcome assessment (detection bias) | Unclear risk | “A paediatrician, who was unaware of which study group the neonate belonged to, assessed all paediatric files for babies admitted to the neonatal intensive‐care unit, and judged whether there had been any signs of neonatal encephalopathy.” This only applies to 1 of the secondary outcomes ‐ there is insufficient information on the blinding of other outcomes assessed. Pg 536 (Participants and methods – Methods). |
| Incomplete outcome data (attrition bias) | Low risk | Missing data balanced in numbers across groups (283 from CTG group, 291 from CTG + ST group), with similar reasons for missing data across groups “574 cases excluded after the primary analysis..” “because of malformations or inadequate reading.” Pg 536 (Figure 2), Pg 537 (Results). |
| Selective reporting (reporting bias) | Low risk | Study protocol not available but all of the study’s expected (primary and secondary) outcomes that are of interest/pre‐specified in the methods section have been reported in the results/tables, whether significant or not. “The rate of metabolic acidosis at birth was significantly lower in the CTG+ST group than in the CTG group. The number of operative deliveries for fetal distress was also significantly lower in the CTG + ST group. The rates of operative deliveries for other indications (in most cases failure to progress) did not differ significantly. Pg 536 (Results), Pg 537 (Table 3). |
| Other bias | Low risk | Appears to be free of other sources of bias. |
| Methods | Randomised trial. | |
| Participants | 11,108 women with singleton fetuses, > 36 weeks, attempting vaginal delivery, cervical dilatation 2‐7 cms. Recruitment in one of 26 hospitals in network in USA, between November 2010 and March 2014. All hospitals had pilot experience of using ST‐segment analysis equipment in at least 50 labours. | |
| Interventions | The experimental group had results of fetal ECG ST‐segment analysis revealed as adjunct to CTG findings; in the control group, the fetal ECG ST‐segment analysis results were concealed ('masked'). | |
| Outcomes | Primary outcome: composite of intrapartum fetal death, neonatal death, Apgar score > 4 at 5 minutes, neonatal seizure, umbilical artery blood pH of 7.05 or less with base deficit of 12 mmol/L or more, intubation for ventilation at delivery, or neonatal encephalopathy. Maternal secondary outcomes: caesarean birth, assisted vaginal birth, chorioamnionitis, maternal blood transfusion, duration of labour, shoulder dystocia, postpartum endometritis, length of hospital stay. Neonatal secondary outcomes: components of primary outcome ‐ Apgar score at 5 minutes, umbilical artery blood gas results, admission to intermediate care nursery or neonatal intensive care unit. | |
| Notes | Intention to treat analysis. A 'protocol sub‐committee' review of a sub‐set of records in the revealed group found, retrospectively, that in some cases, management protocols were not followed correctly by clinical staff. Thus of 2427 women who were assigned to the open group and who had records assessed,163 (6.7%) did not receive care according to STAN guidelines with 95 (3.9%) not receiving expedited delivery when recommended, and 68 (2.8%) having delivery expedited despite recommendation for continued observation. | |
| Risk of bias | ||
| Bias | Authors' judgement | Support for judgement |
| Random sequence generation (selection bias) | Unclear risk | No explicit information about sequence generation. |
| Allocation concealment (selection bias) | Low risk | 'Once a hospital was approved to participate in the randomized trial, the independent data coordinating center sent a software card containing the encrypted randomization module to the designated local biomedical technician to be installed on the S31 monitors at that hospital'. 'A separate randomization sequence was created for each monitor'. |
| Blinding of participants and personnel (performance bias) | High risk | Blinding not possible. |
| Blinding of outcome assessment (detection bias) | High risk | A protocol sub‐committee that was unaware of study group assignment conducted chart of review of all cases that met criteria for primary outcome. |
| Incomplete outcome data (attrition bias) | Low risk | Full clinical data, and valid umbilical blood gas results obtained from 96.5% of neonates. |
| Selective reporting (reporting bias) | Low risk | No evidence of selective reporting. |
| Other bias | Low risk | The study was supported by a government health research funder (NICHD) and by the manufacturer of the equipment (Neoventa). Neoventa had, it is stated, no role in monitoring the study, data collection and analysis, or manuscript preparation. |
| Methods | Opaque, consecutively numbered, sealed, envelopes containing randomisation code generated by computer programme in blocks of 100. Envelope opened at time of amniotomy. | |
| Participants | 1483 women randomised; 11 exclusions; clinical data available but blood gas data missing for 36. In labour at =/> 36 weeks with singleton fetus, cephalic presentation, decision to perform amniotomy, no contraindication to scalp electrode. Sample size based on 50% reduction of umbilical artery pH < 7.10. | |
| Interventions | CTG plus ECG waveform analysis (STAN) (733 women) versus CTG (739 women). Fetal scalp sampling for pH estimation an option in either group. Recruitment in tertiary referral hospital in Finland 2003‐4. | |
| Outcomes | Neonatal acidaemia, operative delivery, need for fetal scalp sampling for pH estimation. | |
| Notes | In 83 pregnancies, there were technical difficulties in achieving satisfactory monitoring ‐ n = 5 in CTG group; n = 78 in the ECG group. | |
| Risk of bias | ||
| Bias | Authors' judgement | Support for judgement |
| Random sequence generation (selection bias) | Low risk | “Opaque numbered sealed envelopes that contained a randomisation code generated by a computer program in blocks of 100.” Pg 420 (Methods). |
| Allocation concealment (selection bias) | Low risk | “randomly assigned to two groups using opaque numbered sealed envelopes [..] This was arranged by a person independent of the study protocol. At the time of amniotomy, the next consecutively numbered envelope available was opened by a midwife not involved in the study.” Pg 420 (Methods). |
| Blinding of participants and personnel (performance bias) | Unclear risk | “At the time of amniotomy, the next consecutively numbered envelope available was opened by a midwife not involved in the study.” Insufficient information on blinding of participants. |
| Blinding of outcome assessment (detection bias) | Unclear risk | Insufficient information. |
| Incomplete outcome data (attrition bias) | Low risk | “Eleven women were excluded from the outcome analysis [..] Umbilical artery blood gas analysis data were available for 1436” out of 1483 eligible. Missing blood gas analysis data balanced in numbers across groups (19 from STAN group, 17 from CTG group) with the same reasons across groups. Only missing data from 36/1472 participants. Pg 420 (Results), Pg 421 (Figure 1). |
| Selective reporting (reporting bias) | Low risk | Study protocol is not available but all of the study’s expected (primary and secondary) outcomes that are of interest/pre‐specified in the methods section have been reported in the results/tables, whether significant or not. Pg 420 (Results), Pg 422 (Table 2), Pg 422 (Table 3). |
| Other bias | Low risk | The study appears to be free of other sources of bias. |
| Methods | Random allocation through computer‐generated random numbers table, triggered by switching on the software in the fetal monitoring equipment. | |
| Participants | 957 women in labour with perceived need for continuous fetal heart rate monitoring (age > 35, maternal disease, adverse obstetric history, prematurity, suspected fetal growth restriction, antepartum haemorrhage, breech presentation, multiple pregnancy, epidural analgesia, induction or augmentation of labour, abnormal CTG, meconium, previous caesarean section). Results are only available for 957 women (92%) for reasons that are unclear. The trial took place in 5 centres: Nottingham and Dundee (UK), Hong Kong, Amsterdam (The Netherlands) and Singapore. | |
| Interventions | CTG plus fetal ECG (n = 482) versus CTG alone (n = 475). | |
| Outcomes | The trial was powered to detect (alpha 80%, beta 5%) a decrease in 'unsuspected acidaemia' (cord artery pH < 7.15) from 8.5% to 4.5%. | |
| Notes | The data monitoring committee recommended that the trial be stopped before recruitment of the target of 1192 for reasons that are not clear from the report. | |
| Risk of bias | ||
| Bias | Authors' judgement | Support for judgement |
| Random sequence generation (selection bias) | Low risk | “Random number generation, as an integral part of the fetal ECG analyser program, was used to assign women to one of the two groups.” Pg 457 (Methods – Study design). |
| Allocation concealment (selection bias) | Unclear risk | “Random number generation [..] was used to assign women to one of the two groups.” Insufficient information on whether participants and enrolling investigators could foresee assignment. Pg 457 (Methods – Study design). |
| Blinding of participants and personnel (performance bias) | Unclear risk | “In both groups, a conventional cardiotocography was available for interpretation by the labour‐ward staff.” Insufficient information. Pg 457 (Methods – Study design). |
| Blinding of outcome assessment (detection bias) | High risk | “The signal was analysed with the Nottingham fetal ECG analyser; the relevant time‐interval variables were displayed on‐screen if the patient had been assigned to the cardiotocography plus fetal ECG group.” The relevant variables show on‐screen for the intervention group, therefore the outcome assessor would know that if the variables are shown then that participant is in the intervention group. Pg 457 (Methods – Study design). |
| Incomplete outcome data (attrition bias) | Unclear risk | “Delivery details were complete for 957 (92·2%)”. Of all women randomised into the trial “40 had incomplete delivery details” in both groups and 1 dropped out of the intervention group “because she didn't like the equipment in the room.” Missing outcome data balanced in numbers across both groups, but the reasons for missing data are not given, so there is insufficient information to make a judgement. Pg 457 (Flow chart of trial profile), Pg 458 (Results). |
| Selective reporting (reporting bias) | Low risk | Study protocol is not available but all the study’s expected outcomes that are of interest/pre‐specified in the methods section have been reported in the results/tables, whether significant or not. Pg 458 (Results, Table 2, Table 3, Table 4). |
| Other bias | Unclear risk | “Both problems with signal acquisition and failure to act on abnormal readings within the acidaemic group suggest that there may have been protocol violation within the trial group as a whole.” Pg 459 (Discussion). |
| Methods | Sealed, numbered, opaque envelopes were prepared in a Research Unit. Details of randomisation are not described but there was stratification by centre (2). Allocation was by opening the next envelope. | |
| Participants | 799 women in labor at 36 weeks or more, with a single fetus with cephalic presentation, and either abnormal cardiotocographic trace or thick meconium‐stained amniotic fluid. Exclusions included maternal infections that contraindicated scalp electrode attachment (e.g. HIV), cardiac malformation, severely abnormal CTG at the time of recruitment. | |
| Interventions | CTG + fetal ECG (n = 399) versus CTG alone (n = 400). Scalp sampling for pH estimation was an option in both groups. | |
| Outcomes | The trial was powered (alpha 5% beta 80%) to detect a reduction in operative deliveries for 'fetal distress' from 50% to 40%. | |
| Notes | Fetal ECG was assessed by STAN S21 machines. | |
| Risk of bias | ||
| Bias | Authors' judgement | Support for judgement |
| Random sequence generation (selection bias) | Unclear risk | “Envelopes for randomization, stratified by center, were prepared at the Delegation of Research Unit.” Insufficient information on how they achieved randomisation. |
| Allocation concealment (selection bias) | Low risk | “midwife who treated the women during labor opened an opaque numbered sealed envelope at randomization.” “Envelopes for randomization, stratified by center, were prepared at the Delegation of Research Unit.” Pg 299.e2 (Materials and methods). |
| Blinding of participants and personnel (performance bias) | Unclear risk | Insufficient information. |
| Blinding of outcome assessment (detection bias) | Low risk | “A research resident who was not involved in the study verified data during the study.” Whilst unclear whether outcome assessors were blinded, the data were verified by someone independent of the study, therefore the outcome measurement is not likely to be influenced by lack of blinding. Pg 299.e2 (Materials and methods). |
| Incomplete outcome data (attrition bias) | Low risk | No missing outcome data – 799 women randomised after all exclusions (including 87 women who declined to participate) and were all included in the analysis. Pg 299.e3 (Results). |
| Selective reporting (reporting bias) | Low risk | Study protocol is not available but all of the study’s expected (primary and secondary) outcomes that are of interest/pre‐specified in the methods section have been reported in the results/tables, whether significant or not. Pg 299.e3 (Results, Table 2). Pg 299.e5 (Table 3). |
| Other bias | Unclear risk | Insufficient information. |
| Methods | A randomised clinical trial of CTG plus ST‐analysis of the fetal ECG (STAN®) versus CTG alone for intrapartum fetal monitoring. Women randomised through a computer‐generated randomisation sequence. Stratification for centre and parity (no previous vaginal delivery versus 1 or more previous vaginal deliveries). The study was performed in 9 hospitals in The Netherlands. | |
| Participants | 5681 women in labour with a singleton fetus in vertex position, a gestational age 36 weeks or greater and a medical indication for electronic fetal monitoring. A medical indication is defined by either a high‐risk pregnancy, induction or augmentation of labour, epidural anaesthesia, meconium‐stained amniotic fluid or non‐reassuring fetal heart rate. | |
| Interventions | Intervention group: CTG and ST‐analysis. Control group: CTG. | |
| Outcomes | Primary outcome: incidence of serious metabolic acidosis defined as a pH < 7.05 and a BDecf > 12 mmol/L in the umbilical cord artery. Secondary outcomes:
| |
| Notes | ||
| Risk of bias | ||
| Bias | Authors' judgement | Support for judgement |
| Random sequence generation (selection bias) | Low risk | Women “were randomized on a 1:1 basis through a web‐based computer‐generated randomization sequence with variable block size.” Pg 1174 (Materials and methods). |
| Allocation concealment (selection bias) | Low risk | Web‐based allocation. Women “were randomized on a 1:1 basis through a web‐based computer‐generated randomization sequence with variable block size.” Pg 1174 (Materials and methods). |
| Blinding of participants and personnel (performance bias) | Low risk | "As a result of the explicit pragmatic nature of the trial, both patients and care givers were not blinded to the allocated interventions” but the outcome is not likely to be influenced by a lack of blinding. Pg 1174 (Materials and methods). |
| Blinding of outcome assessment (detection bias) | Low risk | “Two neonatologists (F.G. and M.J.B.) who were blinded to randomization allocation independently assessed all neonatal admission letters and charts to evaluate whether signs of moderate or severe neonatal hypoxic–ischemic encephalopathy had developed according to Sarnat and Sarnat.” Adequate blinding for the neonatal admissions. Pg 1175 (Materials and methods). |
| Incomplete outcome data (attrition bias) | Low risk | No missing outcome data – 5667 randomised to the trial (after 14 women excluded as they did not meet the inclusion criteria) and were included in the analysis ‐ intention‐to‐treat analysis. “Various subjects had missing values. Because these are often selectively missing, which was also the case in our study [..] it is well documented that a complete case analysis likely yields biased results. Hence, we multiply imputed missing values (10 times) before doing the analysis, using the AregImpute method in S‐plus.” They have adopted an appropriate method for overcoming any impact, from missing values, on the risk of bias. Pg 1176 (Materials and methods). Pg 1176 (Materials and methods), Pg 1176 (Results, Fig. 1). |
| Selective reporting (reporting bias) | Low risk | Study protocol is not available but all of the study’s expected (primary and secondary) outcomes that are of interest/pre‐specified in the methods section have been reported in the results/tables, whether significant or not. Pg 1176 ‐ 1177 (Results), Pg 1177 (Table 2), Pg 1178 (Table 3). |
| Other bias | Low risk | Appears to be free of other sources of bias. |
| Methods | Randomisation: entry to either group decided by draw of sealed, opaque envelopes once the decision to apply electrode was made. Trial preceded by randomised study to identify the best available scalp electrode for ECG recording ‐ single spiral electrode, used in both groups of the study. On ST + CTG group the lead collection system also required a maternal thigh electrode be applied to standardise the ECG vector. | |
| Participants | 2434 pregnant women, 1215 CTG alone arm, 1219 ST waveform and CTG arm. (More than 34 weeks' gestation with no gross fetal abnormality.) | |
| Interventions | CTG plus ST analysis (n =1219) versus CTG alone (n = 1215). | |
| Outcomes | Obstetric intervention (fetal blood sampling and operative delivery) and fetal outcome. | |
| Notes | Operative delivery rates separated into overall caesarean section rates and operative vaginal delivery rates not recorded in published report ‐ information to be sought from authors. | |
| Risk of bias | ||
| Bias | Authors' judgement | Support for judgement |
| Random sequence generation (selection bias) | Low risk | "Entry to either arm was decided by draw of a sealed opaque envelope.” Pg 1152 (Study entry and randomisation). |
| Allocation concealment (selection bias) | Low risk | “Entry to either arm was decided by draw of a sealed opaque envelope.” Pg 1152 (Study entry and randomisation). |
| Blinding of participants and personnel (performance bias) | Unclear risk | Insufficient information. |
| Blinding of outcome assessment (detection bias) | Low risk | “All traces were reviewed blind to outcome by a single observer [..] in 30‐minute segments without preview.” Although not stated if blinded for other outcomes assessed, they are not likely to be influenced by the lack of blinding. Pg 1153 (Measurement of outcome – paragraph after Neonatal outcome). |
| Incomplete outcome data (attrition bias) | Low risk | “Three cases of noncompliance in the cardiotocogram arm. In two a recording was unobtainable [..] In the third there were no cardiotocogram recorders available.” “There were 31 cases in the ST waveform plus cardiotocogram arm. Ten of these were protocol failure and four were technical failures [..] In 17 cases no satisfactory heart rate or electrocardiographic trace could be obtained..” An imbalance in numbers of missing data across the groups (3 from control, 31 from intervention), but overall only 34/2434 cases and the reasons for missing data are all unrelated to the true outcome. Pg 1154 (Results ‐ Noncompliance with allocated recorder). |
| Selective reporting (reporting bias) | Unclear risk | Insufficient information. |
| Other bias | Low risk | Appears to be free of other sources of bias. |
CTG: cardiotocography
ECG: electrocardiogram
ST + CTG: ST waveform and cardiotocogram
Characteristics of excluded studies [ordered by study ID]
| Study | Reason for exclusion |
| Not randomised. | |
| Did not seem to involve analysis of fetal ECG waveform. | |
| Not randomised. | |
| Review article. | |
| Randomised trial reported as abstract only, with insufficient detail to include data. |
ECG: electrocardiogram
Characteristics of studies awaiting assessment [ordered by study ID]
| Methods | |
| Participants | |
| Interventions | |
| Outcomes | |
| Notes | Awaiting publication of full report. |
Characteristics of ongoing studies [ordered by study ID]
| Trial name or title | Cardiotocography combined with ST‐analysis versus cardiotocography combined with scalp pH. |
| Methods | Randomised controlled trial. |
| Participants | Women > 18 years with fetus with cephalic presentation, > 36 + 0 weeks, in labour, undergoing CTG monitoring. |
| Interventions | CTG combined with ST‐analysis versus cardiotocography combined with scalp pH. |
| Outcomes | Primary: metabolic acidosis at birth (umbilical artery pH < 7.05 base excess < ‐10). |
| Starting date | December 2005. |
| Contact information | Diana BB Bach. |
| Notes | Trial terminated for poor recruitment 2012. Unable to obtain data so far. |
| Trial name or title | A randomised trial of fetal ECG ST segment and T wave analysis as an adjunct to electronic FHR monitoring (STAN). |
| Methods | Open‐randomised trial. |
| Participants | Inclusion criteria:
|
| Interventions | Open group: FHR monitoring with ST analysis available. |
| Outcomes |
|
| Starting date | November 2010. |
| Contact information | Catherine C Spong [email protected] |
| Notes |
CTG: cardiotocograph
ECG: electrocardiogram
FHR: fetal heart rate
Data and analyses
| Outcome or subgroup title | No. of studies | No. of participants | Statistical method | Effect size |
| 1 Caesarean section Show forest plot | 7 | Risk Ratio (M‐H, Fixed, 95% CI) | Subtotals only | |
| Analysis 1.1  Comparison 1 Fetal ECG plus CTG versus CTG alone, Outcome 1 Caesarean section. | ||||
| 1.1 ST analysis | 6 | 26446 | Risk Ratio (M‐H, Fixed, 95% CI) | 1.02 [0.96, 1.08] |
| 1.2 PR analysis | 1 | 957 | Risk Ratio (M‐H, Fixed, 95% CI) | 0.79 [0.61, 1.04] |
| 2 Cord pH < 7.05 + base deficit > 12 mmol/L Show forest plot | 6 | Risk Ratio (M‐H, Random, 95% CI) | Subtotals only | |
| Analysis 1.2 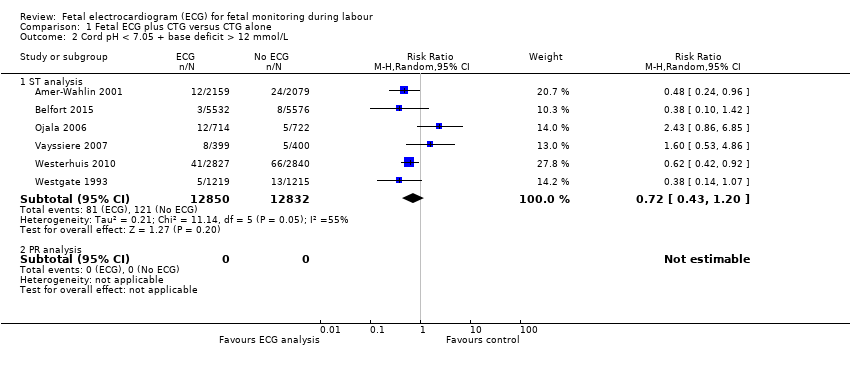 Comparison 1 Fetal ECG plus CTG versus CTG alone, Outcome 2 Cord pH < 7.05 + base deficit > 12 mmol/L. | ||||
| 2.1 ST analysis | 6 | 25682 | Risk Ratio (M‐H, Random, 95% CI) | 0.72 [0.43, 1.20] |
| 2.2 PR analysis | 0 | 0 | Risk Ratio (M‐H, Random, 95% CI) | 0.0 [0.0, 0.0] |
| 3 Neonatal encephalopathy Show forest plot | 6 | Risk Ratio (M‐H, Fixed, 95% CI) | Subtotals only | |
| Analysis 1.3  Comparison 1 Fetal ECG plus CTG versus CTG alone, Outcome 3 Neonatal encephalopathy. | ||||
| 3.1 ST analysis | 6 | 26410 | Risk Ratio (M‐H, Fixed, 95% CI) | 0.61 [0.30, 1.22] |
| 3.2 PR analysis | 0 | 0 | Risk Ratio (M‐H, Fixed, 95% CI) | 0.0 [0.0, 0.0] |
| 4 Fetal blood sampling Show forest plot | 5 | Risk Ratio (M‐H, Random, 95% CI) | Subtotals only | |
| Analysis 1.4  Comparison 1 Fetal ECG plus CTG versus CTG alone, Outcome 4 Fetal blood sampling. | ||||
| 4.1 ST analysis | 4 | 9671 | Risk Ratio (M‐H, Random, 95% CI) | 0.61 [0.41, 0.91] |
| 4.2 PR analysis | 1 | 957 | Risk Ratio (M‐H, Random, 95% CI) | 0.91 [0.69, 1.19] |
| 5 Operative vaginal delivery Show forest plot | 7 | Risk Ratio (M‐H, Fixed, 95% CI) | Subtotals only | |
| Analysis 1.5  Comparison 1 Fetal ECG plus CTG versus CTG alone, Outcome 5 Operative vaginal delivery. | ||||
| 5.1 ST analysis | 6 | 26446 | Risk Ratio (M‐H, Fixed, 95% CI) | 0.92 [0.86, 0.99] |
| 5.2 PR analysis | 1 | 957 | Risk Ratio (M‐H, Fixed, 95% CI) | 0.94 [0.75, 1.17] |
| 6 Apgar score < 7 at 5 minutes Show forest plot | 6 | Risk Ratio (M‐H, Fixed, 95% CI) | Subtotals only | |
| Analysis 1.6 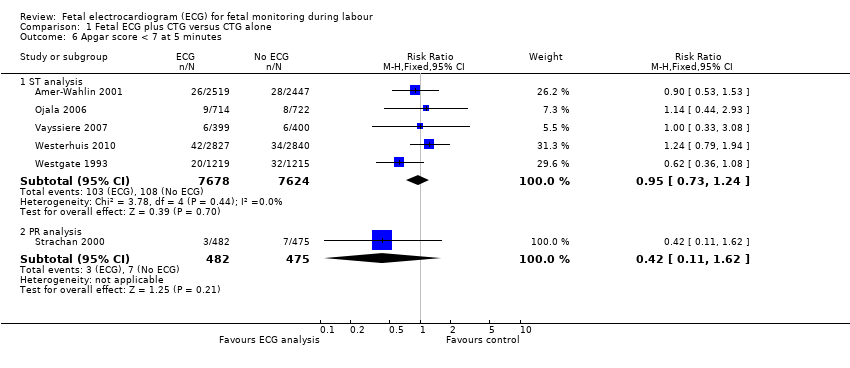 Comparison 1 Fetal ECG plus CTG versus CTG alone, Outcome 6 Apgar score < 7 at 5 minutes. | ||||
| 6.1 ST analysis | 5 | 15302 | Risk Ratio (M‐H, Fixed, 95% CI) | 0.95 [0.73, 1.24] |
| 6.2 PR analysis | 1 | 957 | Risk Ratio (M‐H, Fixed, 95% CI) | 0.42 [0.11, 1.62] |
| 7 Neonatal intubation Show forest plot | 3 | Risk Ratio (M‐H, Fixed, 95% CI) | Subtotals only | |
| Analysis 1.7  Comparison 1 Fetal ECG plus CTG versus CTG alone, Outcome 7 Neonatal intubation. | ||||
| 7.1 ST analysis | 2 | 12544 | Risk Ratio (M‐H, Fixed, 95% CI) | 1.37 [0.89, 2.11] |
| 7.2 PR analysis | 1 | 957 | Risk Ratio (M‐H, Fixed, 95% CI) | 0.74 [0.26, 2.11] |
| 8 Admission neonatal special care unit Show forest plot | 7 | Risk Ratio (M‐H, Fixed, 95% CI) | Subtotals only | |
| Analysis 1.8  Comparison 1 Fetal ECG plus CTG versus CTG alone, Outcome 8 Admission neonatal special care unit. | ||||
| 8.1 ST analysis | 6 | 26410 | Risk Ratio (M‐H, Fixed, 95% CI) | 0.96 [0.89, 1.04] |
| 8.2 PR analysis | 1 | 957 | Risk Ratio (M‐H, Fixed, 95% CI) | 0.77 [0.45, 1.33] |
| 9 Perinatal death Show forest plot | 7 | Risk Ratio (M‐H, Fixed, 95% CI) | Subtotals only | |
| Analysis 1.9  Comparison 1 Fetal ECG plus CTG versus CTG alone, Outcome 9 Perinatal death. | ||||
| 9.1 ST analysis | 6 | 26446 | Risk Ratio (M‐H, Fixed, 95% CI) | 1.71 [0.67, 4.33] |
| 9.2 PR analysis | 1 | 957 | Risk Ratio (M‐H, Fixed, 95% CI) | 2.96 [0.12, 72.39] |

'Risk of bias' graph: review authors' judgements about each risk of bias item presented as percentages across all included studies.

'Risk of bias' summary: review authors' judgements about each risk of bias item for each included study.
Comparison 1 Fetal ECG plus CTG versus CTG alone, Outcome 1 Caesarean section.
Comparison 1 Fetal ECG plus CTG versus CTG alone, Outcome 2 Cord pH < 7.05 + base deficit > 12 mmol/L.
Comparison 1 Fetal ECG plus CTG versus CTG alone, Outcome 3 Neonatal encephalopathy.
Comparison 1 Fetal ECG plus CTG versus CTG alone, Outcome 4 Fetal blood sampling.
Comparison 1 Fetal ECG plus CTG versus CTG alone, Outcome 5 Operative vaginal delivery.
Comparison 1 Fetal ECG plus CTG versus CTG alone, Outcome 6 Apgar score < 7 at 5 minutes.
Comparison 1 Fetal ECG plus CTG versus CTG alone, Outcome 7 Neonatal intubation.
Comparison 1 Fetal ECG plus CTG versus CTG alone, Outcome 8 Admission neonatal special care unit.
Comparison 1 Fetal ECG plus CTG versus CTG alone, Outcome 9 Perinatal death.
| Fetal ECG (ST analysis) plus CTG versus CTG alone for fetal monitoring during labour | ||||||
| Patient or population: Pregnant women (and their fetuses) in labour, with a perceived need for continuous electronic fetal heart rate monitoring | ||||||
| Outcomes | Anticipated absolute effects* (95% CI) | Relative effect | № of participants | Quality of the evidence | Comments | |
| Risk with CTG alone | Risk with Fetal ECG plus CTG | |||||
| Caesarean section ‐ ST analysis | Study population | RR 1.02 | 26,446 | ⊕⊕⊕⊕ | ||
| 135 per 1000 | 137 per 1000 | |||||
| Moderate | ||||||
| 119 per 1000 | 121 per 1000 | |||||
| Cord pH less than 7.05 and base deficit greater than 12 mmol/L ‐ ST analysis | Study population | RR 0.72 | 25,682 | ⊕⊕⊕⊝ | ||
| 9 per 1000 | 7 per 1000 | |||||
| Moderate | ||||||
| 11 per 1000 | 8 per 1000 | |||||
| Neonatal encephalopathy ‐ ST analysis | Study population | RR 0.61 | 26,410 | ⊕⊕⊕⊕ | ||
| 2 per 1000 | 1 per 1000 | |||||
| Moderate | ||||||
| 2 per 1000 | 1 per 1000 | |||||
| Fetal blood sampling ‐ ST analysis | Study population | RR 0.61 | 9671 | ⊕⊕⊕⊕ | ||
| 154 per 1000 | 94 per 1000 | |||||
| Moderate | ||||||
| 131 per 1000 | 80 per 1000 | |||||
| Operative vaginal delivery ‐ ST analysis | Study population | RR 0.92 | 26,446 | ⊕⊕⊕⊕ | ||
| 113 per 1000 | 104 per 1000 | |||||
| Moderate | ||||||
| 133 per 1000 | 122 per 1000 | |||||
| Admission to neonatal special care unit ‐ ST analysis | Study population | RR 0.96 | 26410 | ⊕⊕⊕⊕ | ||
| 88 per 1000 | 84 per 1000 | |||||
| Moderate | ||||||
| 55 per 1000 | 53 per 1000 | |||||
| Perinatal death ‐ ST analysis | Study population | RR 1.71 | 26,446 | ⊕⊕⊕⊕ | ||
| 0 per 1000 | 1 per 1000 | |||||
| Moderate | ||||||
| 0 per 1000 | 1 per 1000 | |||||
| *The risk in the intervention group (and its 95% confidence interval) is based on the assumed risk in the comparison group and the relative effect of the intervention (and its 95% CI). | ||||||
| GRADE Working Group grades of evidence | ||||||
| 1 Some heterogeneity in findings (I2 55%) | ||||||
| Outcome or subgroup title | No. of studies | No. of participants | Statistical method | Effect size |
| 1 Caesarean section Show forest plot | 7 | Risk Ratio (M‐H, Fixed, 95% CI) | Subtotals only | |
| 1.1 ST analysis | 6 | 26446 | Risk Ratio (M‐H, Fixed, 95% CI) | 1.02 [0.96, 1.08] |
| 1.2 PR analysis | 1 | 957 | Risk Ratio (M‐H, Fixed, 95% CI) | 0.79 [0.61, 1.04] |
| 2 Cord pH < 7.05 + base deficit > 12 mmol/L Show forest plot | 6 | Risk Ratio (M‐H, Random, 95% CI) | Subtotals only | |
| 2.1 ST analysis | 6 | 25682 | Risk Ratio (M‐H, Random, 95% CI) | 0.72 [0.43, 1.20] |
| 2.2 PR analysis | 0 | 0 | Risk Ratio (M‐H, Random, 95% CI) | 0.0 [0.0, 0.0] |
| 3 Neonatal encephalopathy Show forest plot | 6 | Risk Ratio (M‐H, Fixed, 95% CI) | Subtotals only | |
| 3.1 ST analysis | 6 | 26410 | Risk Ratio (M‐H, Fixed, 95% CI) | 0.61 [0.30, 1.22] |
| 3.2 PR analysis | 0 | 0 | Risk Ratio (M‐H, Fixed, 95% CI) | 0.0 [0.0, 0.0] |
| 4 Fetal blood sampling Show forest plot | 5 | Risk Ratio (M‐H, Random, 95% CI) | Subtotals only | |
| 4.1 ST analysis | 4 | 9671 | Risk Ratio (M‐H, Random, 95% CI) | 0.61 [0.41, 0.91] |
| 4.2 PR analysis | 1 | 957 | Risk Ratio (M‐H, Random, 95% CI) | 0.91 [0.69, 1.19] |
| 5 Operative vaginal delivery Show forest plot | 7 | Risk Ratio (M‐H, Fixed, 95% CI) | Subtotals only | |
| 5.1 ST analysis | 6 | 26446 | Risk Ratio (M‐H, Fixed, 95% CI) | 0.92 [0.86, 0.99] |
| 5.2 PR analysis | 1 | 957 | Risk Ratio (M‐H, Fixed, 95% CI) | 0.94 [0.75, 1.17] |
| 6 Apgar score < 7 at 5 minutes Show forest plot | 6 | Risk Ratio (M‐H, Fixed, 95% CI) | Subtotals only | |
| 6.1 ST analysis | 5 | 15302 | Risk Ratio (M‐H, Fixed, 95% CI) | 0.95 [0.73, 1.24] |
| 6.2 PR analysis | 1 | 957 | Risk Ratio (M‐H, Fixed, 95% CI) | 0.42 [0.11, 1.62] |
| 7 Neonatal intubation Show forest plot | 3 | Risk Ratio (M‐H, Fixed, 95% CI) | Subtotals only | |
| 7.1 ST analysis | 2 | 12544 | Risk Ratio (M‐H, Fixed, 95% CI) | 1.37 [0.89, 2.11] |
| 7.2 PR analysis | 1 | 957 | Risk Ratio (M‐H, Fixed, 95% CI) | 0.74 [0.26, 2.11] |
| 8 Admission neonatal special care unit Show forest plot | 7 | Risk Ratio (M‐H, Fixed, 95% CI) | Subtotals only | |
| 8.1 ST analysis | 6 | 26410 | Risk Ratio (M‐H, Fixed, 95% CI) | 0.96 [0.89, 1.04] |
| 8.2 PR analysis | 1 | 957 | Risk Ratio (M‐H, Fixed, 95% CI) | 0.77 [0.45, 1.33] |
| 9 Perinatal death Show forest plot | 7 | Risk Ratio (M‐H, Fixed, 95% CI) | Subtotals only | |
| 9.1 ST analysis | 6 | 26446 | Risk Ratio (M‐H, Fixed, 95% CI) | 1.71 [0.67, 4.33] |
| 9.2 PR analysis | 1 | 957 | Risk Ratio (M‐H, Fixed, 95% CI) | 2.96 [0.12, 72.39] |