喉罩通气与袋式面罩通气或气管插管用于新生儿复苏
Information
- DOI:
- https://doi.org/10.1002/14651858.CD003314.pub3Copy DOI

- Database:
-
- Cochrane Database of Systematic Reviews
- Version published:
-
- 15 March 2018see what's new
- Type:
-
- Intervention
- Stage:
-
- Review
- Cochrane Editorial Group:
-
Cochrane Neonatal Group
- Copyright:
-
- Copyright © 2018 The Cochrane Collaboration. Published by John Wiley & Sons, Ltd.
Article metrics
Altmetric:
Cited by:
Authors
Contributions of authors
Both authors (MQ and MK) searched literature, reviewed studies, co‐authored text, entered data and checked data entry for accuracy.
Declarations of interest
None
Acknowledgements
The authors are grateful to Ms Liz Dennett (Librarian, John W Scott Health Sciences Library at the University of Alberta in Edmonton) for providing assistance with the literature search for this review.
We would like to acknowledge the original review authors, Andrew J. Grein, Gary M Weiner (Grein 2001, Grein 2005).
Version history
| Published | Title | Stage | Authors | Version |
| 2018 Mar 15 | Laryngeal mask airway versus bag‐mask ventilation or endotracheal intubation for neonatal resuscitation | Review | Mosarrat J Qureshi, Manoj Kumar | |
| 2005 Apr 20 | Laryngeal mask airway versus bag‐mask ventilation or endotracheal intubation for neonatal resuscitation | Review | Andrew J. Grein, Gary M Weiner | |
| 2001 Jul 23 | Laryngeal mask airway versus bag‐mask ventilation or endotracheal intubation for neonatal resuscitation | Protocol | Andrew J. Grein, Gary M Weiner | |
Differences between protocol and review
We made changes to outcomes presented in the previous version of this review after extensive discussion among review authors with the aim of making the review more meaningful in terms of clinical practice.
Additional searches:
We have added another search engine (EMBASE) to ensure wider coverage of the evidence.
Primary outcomes:
Our search identified studies comparing LMA to BMV, which were not available at the time of the previous version of this review. Also the newly identified studies reported additional outcomes. As such we amended the primary outcomes according to clinical significance. We included:
-
Need for endotracheal intubation (LMA vs. BMV studies only).
-
Failure with primary modality of resuscitation (LMA vs. BMV studies only)
-
Ventilation time (Time from birth, or from the beginning of intervention, until the discontinuation of positive pressure ventilation as part of resuscitation).
-
Time to spontaneous breathing (or described as time to definitive response following the onset of intervention).
-
Admission to NICU
-
Death or hypoxic Ischemic encephalopathy (HIE) in the delivery room.
Secondary outcomes:
After discussion, we amended secondary outcomes in this review to include the following:
-
Time until heart rate greater than 100 beats/minute.
-
Apgar score less than or equal to 7 at 5 minutes
-
Apgar scores at 5 and 10 minutes
-
Frequency of post‐resuscitation oral, airway, or facial trauma, or any other procedural related complication
Keywords
MeSH
Medical Subject Headings (MeSH) Keywords
- *Masks;
- Hypoxia, Brain [etiology];
- Intensive Care Units, Neonatal [statistics & numerical data];
- Intubation, Intratracheal [instrumentation, methods];
- Laryngeal Masks;
- Positive‐Pressure Respiration [instrumentation, *methods];
- Randomized Controlled Trials as Topic;
- Resuscitation [instrumentation, *methods];
Medical Subject Headings Check Words
Humans; Infant, Newborn;
PICOs

Study flow diagram: LMA versus BMV or endotracheal intubation for neonatal resuscitation review update

Risk of bias graph: review authors' judgements about each risk of bias item presented as percentages across all included studies.

Risk of bias summary: review authors' judgements about each risk of bias item for each included study.

Comparison 1 LMA versus BMV, Outcome 1 Failure with primary modality of resuscitation.

Comparison 1 LMA versus BMV, Outcome 2 Need for intubation.

Comparison 1 LMA versus BMV, Outcome 3 Time to spontaneous breathing.
![Comparison 1 LMA versus BMV, Outcome 4 Ventilation time [seconds].](/cdsr/doi/10.1002/14651858.CD003314.pub3/media/CDSR/CD003314/image_n/nCD003314-CMP-001-04.png)
Comparison 1 LMA versus BMV, Outcome 4 Ventilation time [seconds].

Comparison 1 LMA versus BMV, Outcome 5 Apgar score ≤ 7 at 5 min.

Comparison 1 LMA versus BMV, Outcome 6 Admission to NICU.
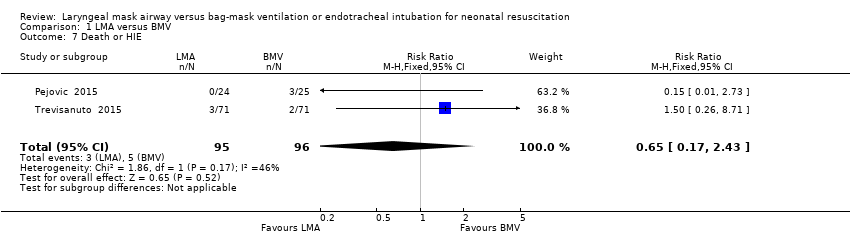
Comparison 1 LMA versus BMV, Outcome 7 Death or HIE.

Comparison 2 LMA versus endotracheal intubation, Outcome 1 Failure to correctly insert the device.

Comparison 2 LMA versus endotracheal intubation, Outcome 2 Successful insertion of device at first attempt.

Comparison 2 LMA versus endotracheal intubation, Outcome 3 Insertion time.
![Comparison 2 LMA versus endotracheal intubation, Outcome 4 Ventilation time [seconds].](/cdsr/doi/10.1002/14651858.CD003314.pub3/media/CDSR/CD003314/image_n/nCD003314-CMP-002-04.png)
Comparison 2 LMA versus endotracheal intubation, Outcome 4 Ventilation time [seconds].

Comparison 2 LMA versus endotracheal intubation, Outcome 5 Apgar score ≤7 at 5 minutes.

Comparison 2 LMA versus endotracheal intubation, Outcome 6 Soft tissue trauma after device inserted.

Comparison 2 LMA versus endotracheal intubation, Outcome 7 Death or HIE.
| LMA compared to BMV for neonatal resuscitation | ||||||
| Patient or population: neonatal resuscitation | ||||||
| Outcomes | Anticipated absolute effects* (95% CI) | Relative effect | № of participants | Certainty of the evidence | Comments | |
| Risk with BMV | Risk with LMA | |||||
| Failure with primary modality of resuscitation | Study population | RR 0.16 | 660 | ⊕⊕⊕⊝ | ||
| 194 per 1000 | 31 per 1000 | |||||
| Need for intubation | Study population | RR 0.24 | 660 | ⊕⊕⊕⊝ | ||
| 158 per 1000 | 38 per 1000 | |||||
| Apgar score ≤ 7 at 5 minutes | Study population | RR 0.34 | 511 | ⊕⊕⊕⊝ | ||
| 94 per 1000 | 32 per 1000 | |||||
| Admission to NICU | Study population | RR 0.6 | 191 | ⊕⊕⊕⊝ | ||
| 438 per 1000 | 263 per 1000 | |||||
| Death or HIE | Study population | RR 0.65 | 191 | ⊕⊕⊝⊝ | ||
| 52 per 1000 | 34 per 1000 | |||||
| *The risk in the intervention group (and its 95% confidence interval) is based on the assumed risk in the comparison group and the relative effect of the intervention (and its 95% CI). | ||||||
| GRADE Working Group grades of evidence | ||||||
| 1Downgraded one level for serious study limitations (The largest of the included studies was a quasi‐randomised trial) 2 Downgraded one level for serious study limitations (One of the 2 studies was a quasi‐randomised trial) 3 Downgraded two levels due to high risk of performance bias and detection bias in both studies 4 Downgraded two levels due to moderate degree of heterogeneity (I2= 46%) | ||||||
| LMA compared to endotracheal intubation for neonatal resuscitation | ||||||
| Patient or population: neonatal resuscitation | ||||||
| Outcomes | Anticipated absolute effects* (95% CI) | Relative effect | № of participants | Certainty of the evidence | Comments | |
| Risk with endotracheal intubation | Risk with LMA | |||||
| Failure to correctly insert the device | Study population | RR 0.95 | 158 | ⊕⊝⊝⊝ | ||
| 26 per 1000 | 25 per 1000 | |||||
| Successful insertion of device at first attempt | Study population | RR 1.01 | 108 | ⊕⊝⊝⊝ | ||
| 904 per 1000 | 913 per 1000 | |||||
| Apgar score ≤ 7 at 5 minutes | Study population | RR 0.70 | 108 | ⊕⊕⊝⊝ | ||
| 250 per 1000 | 175 per 1000 | |||||
| Soft tissue trauma after device inserted | Study population | RR 2.00 | 40 | ⊕⊕⊝⊝ | ||
| 150 per 1000 | 300 per 1000 | |||||
| Death or HIE | Study population | RR 0.59 | 68 | ⊕⊕⊝⊝ | ||
| 94 per 1000 | 55 per 1000 | |||||
| *The risk in the intervention group (and its 95% confidence interval) is based on the assumed risk in the comparison group and the relative effect of the intervention (and its 95% CI). Apgar: A=Activity, P=Pulse, G=Grimace, A=Appearance, R= Respiration; ETT: Endotracheal Tube; LMA: Laryngeal Mask Airway; RCT: Randomised controlled Trial; CI: Confidence interval; RR: Risk ratio; OR: Odds ratio; | ||||||
| GRADE Working Group grades of evidence | ||||||
| 1 Downgraded three levels due to very wide Confidence interval, unclear risk of selection bias and serious study limitations (one of the study was a quasi‐random study) 2 Downgraded three levels due to unclear risk for selection bias and serious study limitations (one of the study was a quasi‐random study) 3Downgraded two levels due to unclear risk for selection bias and serious study limitations (one of the study was a quasi‐random study) 4Downgraded two levels due to very wide Confidence interval and unclear risk of selection bias Downgraded two levels due to very wide Confidence interval and serious study limitations (one of the study was a quasi‐random study) 5Downgraded two levels due to serious study limitations as it was a quasi‐random study with high risk of selection, performance and detection bias | ||||||
| Outcome or subgroup title | No. of studies | No. of participants | Statistical method | Effect size |
| 1 Failure with primary modality of resuscitation Show forest plot | 5 | 660 | Risk Ratio (M‐H, Fixed, 95% CI) | 0.16 [0.09, 0.30] |
| 2 Need for intubation Show forest plot | 5 | 660 | Risk Ratio (IV, Fixed, 95% CI) | 0.24 [0.12, 0.47] |
| 3 Time to spontaneous breathing Show forest plot | 2 | 511 | Mean Difference (IV, Fixed, 95% CI) | ‐1.45 [‐2.98, 0.08] |
| 4 Ventilation time [seconds] Show forest plot | 4 | 610 | Mean Difference (IV, Fixed, 95% CI) | ‐18.90 [‐24.35, ‐13.44] |
| 5 Apgar score ≤ 7 at 5 min Show forest plot | 2 | 511 | Risk Ratio (M‐H, Fixed, 95% CI) | 0.34 [0.16, 0.74] |
| 6 Admission to NICU Show forest plot | 2 | 191 | Risk Ratio (M‐H, Fixed, 95% CI) | 0.6 [0.40, 0.90] |
| 7 Death or HIE Show forest plot | 2 | 191 | Risk Ratio (M‐H, Fixed, 95% CI) | 0.65 [0.17, 2.43] |
| Outcome or subgroup title | No. of studies | No. of participants | Statistical method | Effect size |
| 1 Failure to correctly insert the device Show forest plot | 3 | 158 | Risk Ratio (M‐H, Fixed, 95% CI) | 0.95 [0.17, 5.42] |
| 2 Successful insertion of device at first attempt Show forest plot | 2 | 108 | Risk Ratio (M‐H, Fixed, 95% CI) | 1.01 [0.89, 1.14] |
| 3 Insertion time Show forest plot | 2 | 108 | Mean Difference (IV, Fixed, 95% CI) | 0.31 [‐0.27, 0.88] |
| 4 Ventilation time [seconds] Show forest plot | 1 | 68 | Mean Difference (IV, Fixed, 95% CI) | ‐33.90 [‐73.11, 5.31] |
| 5 Apgar score ≤7 at 5 minutes Show forest plot | 2 | 108 | Risk Ratio (M‐H, Fixed, 95% CI) | 0.70 [0.34, 1.45] |
| 6 Soft tissue trauma after device inserted Show forest plot | 1 | 40 | Risk Ratio (M‐H, Fixed, 95% CI) | 2.0 [0.58, 6.91] |
| 7 Death or HIE Show forest plot | 1 | 68 | Risk Ratio (M‐H, Fixed, 95% CI) | 0.59 [0.11, 3.32] |