Telerrehabilitación para la enfermedad respiratoria crónica
Resumen
Antecedentes
La rehabilitación pulmonar es una intervención comprobada y eficaz para las personas con enfermedades respiratorias crónicas, incluida la enfermedad pulmonar obstructiva crónica (EPOC), la enfermedad pulmonar intersticial (EPI) y las bronquiectasias. Sin embargo, son relativamente pocas las personas que asisten a un programa o lo completan, debido a factores como la falta de programas, los problemas relacionados con los desplazamientos y el transporte, y otros problemas de salud. Tradicionalmente, la rehabilitación pulmonar se realiza de manera presencial y ambulatoria en un hospital u otro centro sanitario (lo que se conoce como rehabilitación pulmonar en un centro). Entre los nuevos modos alternativos de ofrecer rehabilitación pulmonar se encuentran los modelos domiciliarios y el uso de la telesalud.
La telerrehabilitación es la prestación de servicios de rehabilitación a distancia, utilizando las tecnologías de la información y la comunicación. Hasta la fecha, no se ha realizado una evaluación exhaustiva de la eficacia clínica o la seguridad de la telerrehabilitación, ni de su capacidad para mejorar la aceptación y el acceso a los servicios de rehabilitación, para las personas con enfermedades respiratorias crónicas.
Objetivos
Determinar la efectividad y seguridad de la telerrehabilitación para personas con enfermedades respiratorias crónicas.
Métodos de búsqueda
Se realizaron búsquedas hasta el 30 de noviembre de 2020 en el Registro de ensayos del Grupo Cochrane de Vías respiratorias (Cochrane Airways), Registro Cochrane central de ensayos controlados (CENTRAL), seis bases de datos incluidas MEDLINE y Embase y tres registros de ensayos. Se verificaron las listas de referencias de todos los estudios incluidos en busca de referencias adicionales, y se realizaron búsquedas manuales en revistas relevantes de salud respiratoria y en resúmenes de congresos.
Criterios de selección
Se seleccionaron para inclusión todos los ensayos controlados aleatorizados y los ensayos clínicos controlados de telerrehabilitación para la administración de rehabilitación pulmonar. La intervención de telerrehabilitación debía incluir el entrenamiento con ejercicios, y al menos el 50% de la intervención de rehabilitación se debía realizar por telerrehabilitación.
Obtención y análisis de los datos
Se utilizaron los métodos estándar recomendados por Cochrane. Se evaluó el riesgo de sesgo de todos los estudios, y se utilizó la herramienta ROBINS‐I para evaluar el sesgo en los ensayos clínicos controlados no aleatorizados. La certeza de la evidencia se evaluó con el sistema GRADE. Las comparaciones fueron telerrehabilitación comparada con rehabilitación pulmonar presencial tradicional (en un centro) y telerrehabilitación comparada con ninguna rehabilitación. Los estudios de telerrehabilitación para la rehabilitación de mantenimiento se analizaron separados de los ensayos de telerrehabilitación para la rehabilitación pulmonar primaria inicial.
Resultados principales
Se incluyeron 15 estudios (32 informes) con 1904 participantes, que utilizaron cinco modelos de telerrehabilitación distintos. Casi todos los participantes (99%) presentaban enfermedad pulmonar obstructiva crónica (EPOC). Tres estudios eran ensayos clínicos controlados. Para la rehabilitación pulmonar primaria, probablemente hubo poca o ninguna diferencia entre la telerrehabilitación y la rehabilitación pulmonar presencial en la capacidad de ejercicio medida como distancia de caminata de seis minutos (6‐Minute Walking Distance [6MWD]) (diferencia de medias [DM] 0,06 metros [m]; intervalo de confianza [IC] del 95%: ‐10,82 a 10,94 m; 556 participantes; cuatro estudios; evidencia de certeza moderada). También podría haber poca o ninguna diferencia en la calidad de vida medida con la puntuación total del St George's Respiratory Questionnaire (SGRQ) (DM ‐1,26; IC del 95%: ‐3,97 a 1,45; 274 participantes; dos estudios; evidencia de certeza baja), o en la disnea en la puntuación del dominio de disnea del Chronic Respiratory Questionnaire (CRQ) (DM 0,13; IC del 95%: ‐0,13 a 0,40; 426 participantes; tres estudios; evidencia de certeza baja). Los participantes tuvieron más probabilidades de completar un programa de telerrehabilitación con una tasa de finalización del 93% (IC del 95%: 90% a 96%), en comparación con una tasa de finalización del 70% con la rehabilitación presencial. Cuando se compara con un control sin rehabilitación, los ensayos de telerrehabilitación primaria podrían aumentar la capacidad de ejercicio en la 6MWD (DM 22,17 m; IC del 95%: ‐38,89 a 83,23 m; 94 participantes; dos estudios; evidencia de certeza baja) y también podrían aumentar la 6MWD cuando se administra como rehabilitación de mantenimiento (DM 78,1 m; IC del 95%: 49,6 m a 106,6 m; 209 participantes; dos estudios; evidencia de certeza baja). No se identificaron más efectos adversos con la telerrehabilitación que los que se informaron con la rehabilitación presencial o con ninguna rehabilitación.
Conclusiones de los autores
Esta revisión indica que la rehabilitación pulmonar primaria, o la rehabilitación de mantenimiento, realizadas mediante telerrehabilitación en las personas con enfermedades respiratorias crónicas logra resultados similares a los de la rehabilitación pulmonar tradicional en un centro, sin que se identifiquen problemas de seguridad. Sin embargo, la certeza de la evidencia proporcionada por esta revisión está limitada por el escaso número de estudios, de modelos variados de telerrehabilitación, con relativamente pocos participantes. Los futuros estudios de investigación deberían considerar el efecto clínico de la telerrehabilitación en personas con enfermedades respiratorias crónicas distintas de la EPOC, la duración del beneficio de la telerrehabilitación más allá del período de la intervención y su coste económico.
PICO
Resumen en términos sencillos
¿Cómo se compara el uso de la tecnología para la rehabilitación pulmonar (RP) a distancia con la RP en un centro o ninguna RP en personas con enfermedad pulmonar crónica?
Antecedentes
Está demostrado que la rehabilitación pulmonar mejora la función física y el bienestar general de las personas con enfermedades pulmonares crónicas y que reduce los síntomas, especialmente la respiración dificultosa. La rehabilitación pulmonar es un programa de educación y entrenamiento con ejercicios que tradicionalmente se ofrece como un programa presencial en un centro sanitario como un hospital, donde las personas asisten a las citas del programa, pero no son hospitalizadas durante la noche. Para facilitar el acceso de más personas a la rehabilitación pulmonar, se han investigado nuevas formas de impartir los programas a través de la tecnología. La rehabilitación pulmonar realizada a través de la tecnología se conoce como telerrehabilitación. Los modelos de telerrehabilitación pueden incluir, entre otros, hablar con un profesional sanitario o con otros pacientes por teléfono, a través de sitios web o de una aplicación móvil, o por videoconferencia. En algunas circunstancias, realizar la telerrehabilitación puede requerir que los pacientes tengan acceso a su propio dispositivo (p.ej., teléfono, teléfono inteligente, tableta u ordenador) para poder participar.
Características de los estudios
En esta revisión se incluyeron 15 estudios con 1904 personas con enfermedad pulmonar crónica, la mayoría de las cuales (99%) presentaba enfermedad pulmonar obstructiva crónica (EPOC). Los estudios describieron varias formas diferentes de utilizar la tecnología para ofrecer rehabilitación pulmonar, que incluyen por teléfono, el uso de aplicaciones para teléfonos móviles, por videoconferencia en un grupo virtual y a través de sitios web. Los estudios de telerrehabilitación se compararon en conjunto con la RP presencial tradicional o ninguna rehabilitación. La variedad de la tecnología empleada, así como los distintos niveles de apoyo por parte de los profesionales sanitarios de los diferentes estudios, hace que sea difícil establecer si existe un tipo de tecnología, una cantidad de asistencia o un lugar que sean mejores para realizar un programa de telerrehabilitación.
Resultados clave
En los múltiples estudios que utilizan diferentes tipos de tecnología para realizar la rehabilitación pulmonar, la telerrehabilitación probablemente produce resultados similares a los programas presenciales ambulatorios tradicionales de rehabilitación pulmonar. La telerrehabilitación podría ayudar a las personas a caminar más en comparación con ninguna rehabilitación, pero se tiene poca confianza en estos resultados. Las personas tuvieron más probabilidades de terminar un programa completo de telerrehabilitación en comparación con la rehabilitación pulmonar tradicional (93% frente al 70% de finalización). Muy pocos de los estudios hicieron un seguimiento de las personas una vez terminada la intervención, por lo que es difícil determinar cuál es el efecto a largo plazo de la telerrehabilitación.
Certeza de la evidencia
La certeza de la evidencia (la confianza en que las estimaciones estadísticas del efecto son correctas) fue generalmente baja, porque el número de estudios, pacientes y afecciones pulmonares en los que se estudió la telerrehabilitación es pequeño. Esto significa que estos resultados podrían no ser aplicables a todas las personas con enfermedades pulmonares crónicas o a todos los tipos de tecnología empleados para administrar la rehabilitación pulmonar.
Authors' conclusions
Summary of findings
| Telerehabilitation compared to centre‐based (outpatient) pulmonary rehabilitation for chronic respiratory disease | ||||||
| Patient or population: Chronic respiratory disease | ||||||
| Outcomes | Anticipated absolute effects* (95% CI) | Relative effect | № of participants | Certainty of the evidence | Comments | |
|---|---|---|---|---|---|---|
| Risk with centre‐based (outpatient) pulmonary rehabilitation | Risk with telerehabilitation | |||||
| Primary rehabilitation | ||||||
| Exercise capacity ‐ | The change in 6MWD in the control groups ranged from 11 m to 29 m | Mean change in 6MWD was 0.06 mhigher in the telerehabilitation groups | MD 0.06 (‐10.82 to 10.94 | 556 | ⊕⊕⊕⊝ | |
| Breathlessness ‐ CRQ dyspnoea domain | The mean change in CRQ dyspnoea in the control groups was 0.7 points | The mean change in CRQ dyspnoea was 0.13 points higher in the telerehabilitation groups | MD 0.13 | 394 | ⊕⊕⊝⊝ | |
| Quality of life ‐ SGRQ Lower scores indicating better quality of life | The change in SGRQ in the control groups ranged from ‐6.3 to 1.6 points | The mean change in SGRQ score was 1.3 points lower in the telerehabilitation groups | MD ‐1.26 | 274 | ⊕⊕⊝⊝ | The MCID for the SGRQ is 4 points |
| Quality of life ‐ CAT | The change in CAT in the control groups ranged from ‐1.1 to ‐0.3 points | The mean change in CAT score was 1.4 points lower in the telerehabilitation groups | MD 1.37 | 224 | ⊕⊕⊕⊝ | |
| *The risk in the intervention group (and its 95% confidence interval) is based on the assumed risk in the comparison group and the relative effect of the intervention (and its 95% CI). | ||||||
| GRADE Working Group grades of evidence | ||||||
| 1High risk of bias for performance bias 2High risk of bias for performance bias and possibly reporting bias 3Risk of imprecision due to width of confidence intervals 4Risk of inconsistency due to limited overlap of confidence intervals | ||||||
| Telerehabilitation compared to no rehabilitation control for chronic respiratory disease | ||||||
| Patient or population: Chronic respiratory disease | ||||||
| Outcomes | Anticipated absolute effects* (95% CI) | Relative effect | № of participants | Certainty of the evidence | Comments | |
|---|---|---|---|---|---|---|
| Risk with no rehabilitation control | Risk with telerehabilitation | |||||
| Primary rehabilitation | ||||||
| Exercise capacity ‐ 6MWD (m) | The mean change in 6MWD in the control groups was 10 m | The mean change in the telerehabilitation groups was 22 m higher | MD 22.17 | 94 | ⊕⊕⊝⊝ | |
| Breathlessness ‐ CRQ dyspnoea domain | The mean change in CRQ dyspnoea in the control groups was 0.6 points | The mean change in the telerehabilitation groups was 2 points higher | MD 1.97 | 94 | ⊕⊕⊝⊝ | This difference was measured using a maximum score of 35 on the CRQ scale, so would be equivalent to a mean difference of 0.06 units on a 7‐point scale. |
| Quality of life ‐ CRQ total score | The mean change in CRQ total score in the control groups was 3.3 points | The mean change in the telerehabilitation groups was 7 points higher | MD 6.90 | 94 | ⊕⊕⊝⊝ | This difference was measured using a maximum score of 140 on the CRQ scale, so would be equivalent to a mean difference of 0.345 units on a 7‐point scale. |
| Quality of life ‐ CRQ dyspnoea domain | The mean change in CRQ dyspnoea domain in the control groups was 0.6 points | The mean change in the telerehabilitation groups was 2 points higher | MD 1.97 | 94 | ⊕⊕⊝⊝ | |
| Maintenance rehabilitation | ||||||
| Exercise capacity ‐ 6MWD (m) | The change in 6MWD in the control groups ranged from ‐45 to ‐15 m | The mean change in the maintenance telerehabilitation groups was 78 m higher | MD 78.10 | 209 | ⊕⊕⊝⊝ | |
| Dyspnoea ‐ mMRC | The change in mMRC in the control groups ranged from 0.07 to 0.9 points | The mean change in the maintenance telerehabilitation groups was 0.86points lower | MD ‐0.86, 95% CI ‐2.10 to 0.37; participants ) | 189 | ⊕⊝⊝⊝ | I2 = 97% |
| Quality of life ‐ CAT | The change in CAT in the control groups ranged from 1.6 to 5.1 points | The mean change in the maintenance telerehabilitation groups was 7 points lower | MD ‐7.34 | 189 | ⊕⊝⊝⊝ | |
| *The risk in the intervention group (and its 95% confidence interval) is based on the assumed risk in the comparison group and the relative effect of the intervention (and its 95% CI). | ||||||
| GRADE Working Group grades of evidence | ||||||
| 1High risk of bias for performance bias 2Risk of imprecision due to width of confidence intervals 3High risk of bias for performance bias and detection bias 4Risk of inconsistency due to high degree of heterogeneity | ||||||
Background
Description of the condition
Chronic respiratory diseases, including chronic obstructive pulmonary disease (COPD), interstitial lung diseases (ILD), bronchiectasis and chronic asthma, contribute 7% to the global burden of disease (GBD 2020). These conditions cause chronic inflammation and/or infection of the airways and other structures of the lungs (Bousquet 2007). As a group, chronic respiratory diseases are the third leading cause of death worldwide, and account for 10% of all disability adjusted life years (a metric that estimates the amount of active and productive life lost due to a condition) (FIRS 2017). This level of disability is second only to that of cardiovascular disease, including stroke (FIRS 2017). The estimated prevalence of preventable chronic respiratory diseases exceeds 800 million people globally (Bousquet 2007), with four million premature deaths attributed to chronic respiratory disease each year (Ferkol 2014).
Chronic respiratory disease commonly develops as a consequence of repeated exposure to noxious environmental stimuli such as cigarette smoke, air pollution or occupational hazards. Other possible causes for the development of a chronic respiratory disease include immunological disorders, iatrogenic responses, genetic factors, repeated severe respiratory infections during childhood and low socioeconomic status (GOLD 2020). Collectively, people with a chronic respiratory disease experience breathlessness limiting functional capacity, reduced exercise tolerance, impaired health‐related quality of life, repeated need for hospitalisation, and an increased prevalence of anxiety and depression (Celli 2004). The adverse social and economic effects of chronic respiratory disease experienced by individuals, families and societies are large and projected to increase substantially in the future (Bousquet 2007).
Description of the intervention
Pulmonary rehabilitation aims to improve the physiological and psychological condition of individuals with chronic respiratory disease through exercise training accompanied by education and behaviour change (Spruit 2013). Pulmonary rehabilitation is commonly delivered in an outpatient or community setting and comprises two or more sessions per week delivered over a period of at least four weeks (McCarthy 2015). Where healthcare system culture and resources allow, pulmonary rehabilitation may also be delivered in the inpatient setting (McCarthy 2015). The exercise training component of pulmonary rehabilitation includes both aerobic training and strength training. Typically, each session consists of up to 30 minutes of aerobic training (often a combination of walking and cycle training), with exercise prescription individualised on the basis of a pre‐rehabilitation assessment of functional exercise capacity (Spruit 2013). Strength training for the upper and lower limbs is achieved through repetitive lifting of loads equivalent to 60% to 70% of the maximum load able to be moved through the full range of movement once (i.e. one repetition maximum) or that which produces fatigue after eight to 12 repetitions (Chodzko‐Zajko 2009). To improve strength the American College of Sports Medicine recommends adults undertake strengthening exercises on two or three days in the week, comprising one to three sets of eight to 12 repetitions (Chodzko‐Zajko 2009). Progression of training intensity, or overload, over the course of the rehabilitation period is paramount in order to achieve optimal gains in functional exercise tolerance (Spruit 2013). While individually tailored exercise training is the cornerstone of pulmonary rehabilitation, programmes may also include disease‐specific education and self‐management training (Spruit 2013). Self‐management training aims to help people with COPD develop and implement the skills necessary to perform their health management tasks, guide behaviour change and provide support to achieve optimal function and disease control (Zwerink 2014). However, the most effective content for self‐management training remains unclear (Zwerink 2014).
Telehealth interventions are those that provide healthcare at a distance through the use of telecommunications or virtual technology (WHO 2016). Telerehabilitation is a domain of telehealth, distinct from telemonitoring (the monitoring of patients at a distance using information technology), which makes use of information and communication technologies to provide clinical rehabilitation services from a distance (Kairy 2009). Remote communication between the patient and healthcare professional may utilise telephone (including text messaging), internet or videoconferencing technologies (Hwang 2015), in order to enable pulmonary rehabilitation services to be delivered to a satellite healthcare centre or directly to the patient's home (Lee 2015). Telerehabilitation may provide greater healthcare access and service delivery options for individuals who are geographically or socially isolated, for patients in full‐time work or study, or for individuals who find travel difficult due to their disease severity or comorbidities. There is some evidence that a proportion of people with COPD attending pulmonary rehabilitation are interested in utilising telerehabilitation services (Seidman 2017). In addition to exercise training, telerehabilitation models may also include other components of centre‐based pulmonary rehabilitation such as self‐management education and education regarding disease management. Telerehabilitation models for pulmonary rehabilitation have the potential to positively influence uptake and accessibility of pulmonary rehabilitation services for all patients with a chronic respiratory disease.
How the intervention might work
Pulmonary rehabilitation is a proven, effective intervention which enables individuals with a variety of chronic respiratory diseases, including COPD (McCarthy 2015), bronchiectasis (Lee 2017), ILD (Dowman 2014), and asthma (Trevor 2014), to achieve clinically important gains in exercise and functional capacity, as well as improvement of symptoms and health‐related quality of life (Spruit 2013). Participation in pulmonary rehabilitation results in fewer symptoms, reduced hospitalisations due to an acute exacerbation of respiratory disease (Guell 2000), and reduced healthcare utilisation (Puhan 2005). The exercise training component of pulmonary rehabilitation helps to achieve these outcomes through improved capacity and efficiency of skeletal muscle function, which serves to reduce fatigue and perception of dyspnoea, allowing for increased exercise tolerance and physical functioning (Spruit 2013). Pulmonary rehabilitation also helps to improve disease self‐management and control through education and training (McCarthy 2015).
Pulmonary rehabilitation delivered via telerehabilitation may utilise any of a number of technological modalities including, but not limited to, telephone (audio calls or text messaging), the internet (e.g. mobile application or web platform), or videoconferencing to deliver the requisite components of pulmonary rehabilitation to people with chronic respiratory disease. These technological modalities have the capacity to deliver the essential components of pulmonary rehabilitation, including the monitoring of physiological signs and symptoms during exercise remotely in real‐time or in a 'store and forward' capacity. In addition, they can provide supervision and feedback for exercise training, and discussion of self‐management education. Supervision of exercise training during telerehabilitation may involve direct (e.g. auditory or audio‐visual communication in real‐time) or indirect (e.g. via text message) feedback from a clinician. Telerehabilitation models may also offer unsupervised exercise training, whereby standard or automated prompts and feedback are provided via technological modalities to individuals. Telerehabilitation may be delivered directly to a patient's home or to a nearby healthcare facility. It is unclear whether telerehabilitation in general, or a particular mode of telerehabilitation delivery, can achieve improvements in physical function and health‐related quality of life equivalent to those achievable using traditional models of pulmonary rehabilitation delivery. Telerehabilitation has the ability to overcome barriers to pulmonary rehabilitation participation, including issues of patient travel and transport, and staffing and resource limitations (Keating 2011). Telerehabilitation could be a relevant treatment alternative across all chronic respiratory diseases where rehabilitation is a proven therapeutic intervention. However, it is also possible that the lack of in‐person supervision and peer support could adversely affect rehabilitation outcomes.
Why it is important to do this review
Despite the proven benefits of pulmonary rehabilitation for people with chronic respiratory disease, only a very small percentage of people who are eligible to attend pulmonary rehabilitation ever do so (Brooks 2007). Significant patient‐centred barriers to attendance and completion of pulmonary rehabilitation relate to travel and transport to the rehabilitation centre (Keating 2011). In addition, access to pulmonary rehabilitation in non‐metropolitan areas is limited due to lack of services and suitably trained healthcare professionals (Johnston 2012). Improving patient access to pulmonary rehabilitation, through alternative models of service delivery, has the potential to improve health outcomes and reduce total hospitalisations and healthcare utilisation for people with chronic respiratory disease. Economic modelling from Australia suggests that increasing the number of patients who complete pulmonary rehabilitation from 5% to 20% at a single institution might reduce that hospital's admission rates related to COPD by 75% per year, with associated cost savings (NSW ACI 2010).
While people with COPD previously formed the majority of candidates for pulmonary rehabilitation, recent evidence of the efficacy of pulmonary rehabilitation in other lung diseases has broadened the application of this intervention (Spruit 2013), and treatment recommendations in pulmonary rehabilitation guidelines now encompass the spectrum of chronic respiratory disease (e.g. Alison 2017). As such, individuals referred to pulmonary rehabilitation now have a variety of chronic respiratory diseases. These include, but are not limited to COPD, chronic airflow limitation in the absence of smoking history, bronchiectasis, ILD and chronic asthma. Consistent with the changing demographic of pulmonary rehabilitation participants, research studies in pulmonary rehabilitation increasingly include people with a broad cross section of lung disease, to ensure the included study populations are reflective of those individuals who are referred to and attend pulmonary rehabilitation (Greening 2014). Results from such studies may have a greater capacity for translation into clinical practice because they represent the real‐world clinical situation (Grimshaw 2012).
Telerehabilitation has the potential to overcome known barriers to pulmonary rehabilitation participation, and could be a relevant treatment alternative across all chronic respiratory diseases where rehabilitation is an accepted therapeutic intervention. The COVID‐19 pandemic has seen rapid transition of pulmonary rehabilitation programs to a remote‐delivery format, which increases the urgency of understanding the safety and efficacy of such a model. To date, there has not been a comprehensive assessment of the capacity of telerehabilitation to achieve improvements in exercise capacity, breathlessness and health‐related quality of life in people with chronic respiratory disease, or its ability to improve uptake and access to rehabilitation services. This Cochrane Review aims to evaluate the efficacy of telerehabilitation on clinical and patient‐related outcomes in people with chronic respiratory disease, and to highlight directions for future work.
Objectives
-
To determine whether telerehabilitation in people with chronic respiratory disease has beneficial effects on exercise capacity, breathlessness and health‐related quality of life when compared to traditional, centre‐based pulmonary rehabilitation or no rehabilitation control.
-
To assess the safety of telerehabilitation in people with chronic respiratory disease.
Methods
Criteria for considering studies for this review
Types of studies
We included randomised controlled trials (RCTs) and controlled clinical trials (CCTs) of telerehabilitation in people with chronic respiratory disease. We included CCTs in order to encompass studies where randomisation may not have been possible, e.g. where regional cohorts were compared to metropolitan patients. We included studies reported in full text, those published as an abstract only, and unpublished data.
For the purposes of this review, the following definitions applied.
-
Telerehabilitation is the delivery of pulmonary rehabilitation services at a distance, using telecommunications technology as a delivery medium (Lee 2015).
-
Traditional (centre‐based) pulmonary rehabilitation is that which is conducted in an outpatient or inpatient setting, and comprises supervised exercise training (with or without education and psychological support) for at least four weeks (McCarthy 2015).
Types of participants
We included studies of adults (aged 18 and older) with a diagnosis of a chronic respiratory disease (according to relevant established criteria) of any disease severity, in stable state (i.e. not during an inpatient admission for an acute exacerbation). We included studies that incorporated a mix of chronic diseases but only where data relating to review outcomes was able to be obtained separately for participants with chronic respiratory disease.
We excluded studies of participants with the following comorbidities/characteristics:
-
a diagnosis of cystic fibrosis. Standard pulmonary rehabilitation models have not been tested or applied to individuals with cystic fibrosis due to infection control; or
-
a primary diagnosis of a neuromuscular disease.
Types of interventions
We included studies that compared telerehabilitation with traditional pulmonary rehabilitation or a no rehabilitation control; and defined these rehabilitation models collectively as ‘primary pulmonary rehabilitation’. We also included telerehabilitation interventions for the delivery of maintenance rehabilitation following an initial pulmonary rehabilitation period (i.e. interventions designed to maintain health benefits gained from a primary pulmonary rehabilitation programme) (Yorke 2010) and classify these interventions as ‘maintenance rehabilitation’.
To be included in the review, the telerehabilitation intervention needed to include exercise training, with at least 50% of the rehabilitation intervention being delivered by telerehabilitation (Hwang 2015).
Telerehabilitation could be delivered to any of a variety of locations, including directly into the patient's home or to a healthcare centre where patients attended. Telerehabilitation could be performed in a group (physical or virtual) or individually. It could include visual interaction (e.g. videoconferencing) or audible interaction, or both, between patient's and healthcare providers.
Telehealth interventions for the purposes of monitoring symptoms or physiological parameters alone (i.e. telemonitoring), without delivery of pulmonary rehabilitation, were excluded.
Comparisons
-
Telerehabilitation compared to centre‐based (outpatient) pulmonary rehabilitation.
-
Telerehabilitation compared to inpatient pulmonary rehabilitation.
-
Telerehabilitation compared to a no rehabilitation control.
We analysed studies of telerehabilitation for maintenance rehabilitation separately from trials of telerehabilitation for primary pulmonary rehabilitation.
Types of outcome measures
Primary outcomes
-
Exercise capacity, measured by a laboratory test or standardised field test
-
Adverse events (e.g. musculoskeletal injuries, falls, medical emergencies)
-
Dyspnoea (any validated measure, including isotime measures from exercise tests)
-
Quality of life (generic or disease‐specific)
The primary time point for analysis was change from baseline to end of intervention. We have reported any follow‐up measurements after completion of the intervention as medium‐term (up to and including six months after completion of the intervention) or long‐term (longer than six months after completion of the intervention).
Secondary outcomes
-
Adherence to the intervention or completion of pulmonary rehabilitation/telerehabilitation, as defined by specific criteria of individual included studies or more than 70% of prescribed classes (Williams 2014)
-
Anxiety or depression, or both (any validated measure)
-
Physical activity, using any objective measure of physical activity such as pedometer, accelerometer, physical activity monitor providing a measure of step count, activity counts, energy expenditure or physical activity time (different intensities, range of thresholds used)
-
Healthcare utilisation (including hospitalisation)
Where documented, issues of a technological nature and the incidence of such issues (e.g. loss of internet connection, failure of technological devices) are reported narratively.
Reporting one or more of the outcomes listed here in the study was not an inclusion criterion for the review.
Search methods for identification of studies
Electronic searches
We identified studies from searches of the following databases and trials registries:
-
Cochrane Airways Trials Register (Cochrane Airways 2019), via the Cochrane Register of Studies, all years to 30 November 2020;
-
Cochrane Central Register of Controlled Trials (CENTRAL), via the Cochrane Register of Studies, all years to 30 November 2020;
-
MEDLINE Ovid SP 1946 to 30 November 2020;
-
Embase Ovid SP 1974 to 30 November 2020;
-
US National Institutes of Health Ongoing Trials Register ClinicalTrials.gov (www.clinicaltrials.gov) to 30 November 2020;
-
World Health Organization International Clinical Trials Registry Platform (apps.who.int/trialsearch) to 30 November 2020.
The database search strategies are presented in Appendix 1. The search strategies were developed and conducted in collaboration with the Cochrane Airways Information Specialist. The initial search strategy was developed in MEDLINE and adapted for use in the other databases. All databases and trial registries were searched from their inception to 5 June 2018, and updated on 28 January 2020 and 30 November 2020, with no restriction on language or type of publication. Handsearched conference abstracts and grey literature were searched for through the Cochrane Airways Trials Register and the CENTRAL database.
Searching other resources
We reviewed the reference lists of all primary studies for additional references.
We searched for errata or retractions from included studies published in full text on PubMed on 21 September 2020.
Data collection and analysis
Selection of studies
Three review authors (NSC, SDC, HH) screened the titles and abstracts of the search results independently and coded them as 'retrieve' (eligible or potentially eligible/unclear) or 'do not retrieve'. We retrieved the full‐text study reports of all eligible and potentially eligible studies and three review authors (NSC, SDC, HH) independently screened them for inclusion, recording the reasons for exclusion of ineligible studies. We resolved any disagreement through discussion or, if required, through consultation with another review author (AEH). We identified and excluded duplicates and collated multiple reports of the same study so that each study, rather than each report, is the unit of interest in the review. We recorded the selection process in sufficient detail to complete a PRISMA flow diagram and 'Characteristics of excluded studies' table (Moher 2009).
Data extraction and management
We used a data collection form for study characteristics and outcome data. Data and study characteristics from all included studies were extracted independently by two review authors with review and check by a third review author. Study characteristics extracted from included studies encompassed the following.
-
Methods: study design, duration of the intervention, length of any follow‐up period, study location, study setting, withdrawals, date of study
-
Participant characteristics: number, mean age, age range, gender, diagnosis, severity of condition, diagnostic criteria, baseline lung function, smoking history, inclusion criteria, exclusion criteria
-
Interventions: intervention, comparison, concomitant medications
-
Outcomes: primary and secondary outcomes specified and collected (at baseline and at the time of intervention completion) and follow‐up measures at any other time point reported
-
Notes: funding for studies and notable conflicts of interest of trial authors
We documented in the 'Characteristics of included studies' table if outcome data were not reported in a usable way. Any disagreements were resolved by consensus or by involving another review author (AEH or CFM). One review author (NSC) transferred data into the Review Manager 5 file (RevMan 2014). Accuracy of data entered was checked by the Cochrane Airways editorial group (EB) by comparing the data presented in the systematic review with the study reports. Two review authors (SDC and AEH) spot‐checked study characteristics entered into Review Manager 5 for accuracy against the study report.
Assessment of risk of bias in included studies
Two review authors (NSC, SDC) assessed risk of bias independently for each randomised controlled trial included using version one of the risk of bias tool and the criteria outlined in Chapter 8 of the Cochrane Handbook for Systematic Reviews of Interventions (Higgins 2017).
We assessed the risk of bias according to the following domains:
-
random sequence generation;
-
allocation concealment;
-
blinding of participants and personnel;
-
blinding of outcome assessment;
-
incomplete outcome data;
-
selective outcome reporting;
-
other bias.
We judged each potential source of bias as high, low or unclear and provide a quote from the study report, together with a justification for our judgement, in the 'Risk of bias' table. We resolved any discrepancies by discussion or by involving another review author (AEH).
For non‐RCTs, we used the 'Risk Of Bias in Non‐randomised Studies of Interventions' (ROBINS‐I) tool to assess risk of bias. The ROBINS‐I tool assesses risk of bias across seven domains, providing an overall classification of risk of bias which corresponds to the highest level of risk in any one domain (Sterne 2016). This assessment was completed independently by two review authors (NSC, SDC) using the criteria outlined in the detailed guidance for ROBINS‐I (Sterne 2016). ROBINS‐I clarification, guidance and independent review was sought from the Cochrane Airways editorial office and provided by Dr Rebecca Fortescue. For non‐RCTs we assessed the risk of bias according to three domains: pre‐intervention bias (due to confounding or in selection of participants), at‐intervention bias (in classification of the intervention), and post‐intervention bias (due to deviations from intended interventions or missing data; in measurement of outcomes and reported results).
We summarised the 'Risk of bias' judgements across different studies for each of the three domains in a 'Risk of bias' table.
When considering treatment effects, we took into account the risk of bias for the studies that contribute to that outcome.
Assessment of bias in conducting the systematic review
We conducted the review according to the published protocol and provide justification for any deviations from it in the 'Differences between protocol and review' section of this systematic review.
Measures of treatment effect
We analysed data for each outcome, irrespective of reported participant dropout (intention‐to‐treat analysis). We would have analysed dichotomous data as odds ratios (ORs) with 95% confidence intervals (CIs); however, none were reported in the included studies. For continuous data, we calculated the mean difference (MD) (for same scale metric) or standardised mean difference (SMD) (for different scale metrics) with 95% CIs. Skewed data are described narratively using medians and interquartile ranges (IQRs).
We undertook meta‐analyses only where meaningful; that is, if the treatments, participants and the underlying clinical question were similar enough for pooling to make sense.
Where multiple trial arms were reported in a single study, we included only the relevant trial arms. If two comparisons (e.g. intervention A versus placebo and intervention B versus placebo) were combined in the same meta‐analysis, we halved the control group to avoid double‐counting.
Where both change from baseline and endpoint scores were available for continuous data, we used change from baseline unless there was low correlation between measurements in individuals. Where adjusted analyses were available (ANOVA or ANCOVA) we preferentially used these in our meta‐analyses.
Unit of analysis issues
Where studies randomly allocated individual participants to a telerehabilitation intervention or control group, we considered the participant as the unit of analysis. We did not include cross‐over trials in this review due to the potential carryover effects associated with exercise training or behavioural interventions. There were no cluster randomised trials included in this review – if there are in future updates, we will use the generic inverse variance method to combine the results of cluster‐randomised trials with those from parallel group studies, as long as the results have been adjusted (or can be adjusted) to take account of the clusters.
Dealing with missing data
Where there were missing data in included studies, we contacted the investigators in order to verify key study characteristics and obtain missing numerical outcome data where possible (e.g. when a study is reported as an abstract only). Where this was not possible, or data were unable to be provided, and the missing data were thought to introduce serious bias, the impact of including such studies in the overall assessment of results was analysed by performing a sensitivity analysis.
Assessment of heterogeneity
We used the I2 statistic to measure heterogeneity among the studies in each analysis. Where substantial heterogeneity was identified we report this and explore the possible causes by prespecified subgroup analysis.
Assessment of reporting biases
We were not able to pool more than 10 studies. In future updates of this review, if we are able to pool more than 10 studies, we will create and examine a funnel plot to explore possible small study and publication biases.
Data synthesis
For data from RCTs that were statistically and clinically homogenous, we performed a pooled quantitative synthesis. Data were pooled using a random‐effects model to account for between‐study heterogeneity in the meta‐analysis. For trials that were clinically heterogeneous we present a narrative synthesis.
Data from non‐randomised studies (NRS) were synthesised narratively. The results from NRS were not combined with the results of randomised controlled trials.
Trials of telerehabilitation for maintenance rehabilitation were analysed separately from trials of telerehabilitation for primary pulmonary rehabilitation, as it was expected that the nature and magnitude of effect for maintenance programs would differ to that of primary pulmonary rehabilitation.
Subgroup analysis and investigation of heterogeneity
We had planned to carry out the following subgroup analyses if appropriate data had been available.
-
Duration of intervention (at least four weeks but less than eight weeks; at least eight weeks but less than 12 weeks; 12 or more weeks)
-
By diagnosis (chronic obstructive pulmonary disease, interstitial lung diseases, bronchiectasis and chronic asthma)
We planned to use the primary outcomes (exercise capacity, adverse events, dyspnoea and quality of life) for subgroup analyses.
Sensitivity analysis
It was not possible to undertake sensitivity analyses due to the small number of included studies. If in future updates more studies are included, sensitivity analyses will be performed to assess the effects of allocation concealment and intention‐to‐treat analysis on study results.
Summary of findings and assessment of the certainty of the evidence
We created a 'Summary of findings' table using the following outcomes.
-
Exercise capacity
-
Dyspnoea
-
Quality of life
We had intended to include adverse events in the 'Summary of findings' table. However, the manner in which data were presented for this outcome did not allow this.
We used the five GRADE considerations (risk of bias, consistency of effect, imprecision, indirectness and publication bias) to assess the quality of a body of evidence as it relates to the studies that contribute data for the prespecified outcomes. We used the methods and recommendations described in Section 8.5 and Chapter 12 of the Cochrane Handbook for Systematic Reviews of Interventions (Higgins 2017a), using GRADEpro GDT software (GRADEpro GDT). We present footnotes to justify all decisions to downgrade the quality of evidence, and we provide comments to aid the reader's understanding of the review where necessary.
Results
Description of studies
See 'Characteristics of included studies', 'Characteristics of excluded studies' and 'Characteristics of studies awaiting classification' for complete details.
Results of the search
The PRISMA diagram in Figure 1 shows the results of the search. The latest search was conducted on 30 November 2020. A total of 4223 potentially relevant papers were identified. After removing duplicates and screening of title and abstract for irrelevant material, 149 full‐text papers were selected to be further assessed for inclusion. After review by at least two review authors, we excluded 69 studies because they did not meet our inclusion criteria. We identified 14 ongoing studies (18 references), 12 studies (16 references) requiring further assessment, and 13 additional duplicate references. We deemed a total of 15 studies (32 references) to be eligible for inclusion.
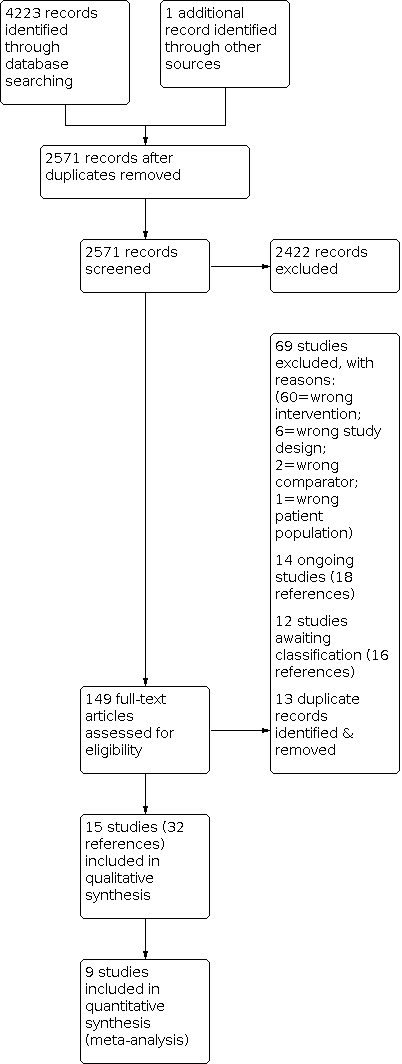
Study flow diagram.
Included studies
Refer to Characteristics of included studies. A total of 15 studies (32 reports) were included in this review. There were two controlled clinical trials (CCTs) (Knox 2019; Stickland 2011). One paper reported results for multiple studies, including one RCT (conducted in Trondheim, Norway) (Barberan‐Garcia 2014 (Trondheim)) and two CCTs (conducted in Barcelona, Spain and Athens, Greece) (Barberan‐Garcia 2014 (Barcelona and Athens)). As such, we treated results reported in this paper as two separate studies. One RCT tested telerehabilitation against two different control conditions (centre‐based rehabilitation and no rehabilitation) (Vasilopoulou 2017), and one RCT tested two different telerehabilitation interventions compared to no rehabilitation control (Kwon 2018). Data from all CCTs are reported narratively. Refer to Characteristics of included studies for relevant funding details for all included studies.
Participants
The total number of participants with chronic respiratory disease from included studies was 1904. Sample sizes ranged from 29 to 409 participants. The majority of studies (n = 12) were of participants with COPD (99% of all participants). In one study of 112 individuals, participants had both COPD and chronic heart failure (Bernocchi 2018). In one study of 45 participants, 35 participants had COPD, three had bronchiectasis, two had pulmonary fibrosis, three had asthma and two had other respiratory related diagnoses (Knox 2019). In another RCT, 26 individuals had COPD, with nine other participants having chronic heart failure and 20 having stroke (Barberan‐Garcia 2014 (Trondheim). However, we could not obtain separate data relating to individuals with COPD from study investigators, so we could not include data from this RCT in our results (Barberan‐Garcia 2014 (Trondheim)) . Overall, the mean age of participants ranged from 62 to 75 years, and the mean percentage of predicted normal for forced expiratory volume in one second (FEV1 %predicted) ranged from 33%predicted to 92%predicted. The proportion of male participants ranged from 35% to 94%.
Interventions and comparisons
Eleven studies described interventions for primary rehabilitation (Bourne 2017; Chaplin 2017; Hansen 2020; Holland 2017; Knox 2019; Kwon 2018; Lahham 2020; Maltais 2008; Stickland 2011; Tabak 2014; Tsai 2017) and three studies reported interventions for maintenance rehabilitation (Barberan‐Garcia 2014 (Barcelona and Athens); Barberan‐Garcia 2014 (Trondheim); Bernocchi 2018; Vasilopoulou 2017). Four studies (Hansen 2020; Knox 2019; Stickland 2011; Tsai 2017) were delivered in a (virtual) group format, the remaining study interventions were delivered to individual participants. Seven studies of primary rehabilitation compared a telerehabilitation intervention to traditional centre‐based pulmonary rehabilitation (Comparison 1) (Bourne 2017; Chaplin 2017; Hansen 2020; Holland 2017; Knox 2019; Maltais 2008; Stickland 2011). One study of maintenance rehabilitation had a traditional centre‐based pulmonary rehabilitation comparison group (Comparison 1) (Vasilopoulou 2017). Four studies of primary pulmonary rehabilitation compared telerehabilitation to a no rehabilitation control group (Comparison 3) (Kwon 2018; Lahham 2020; Tabak 2014; Tsai 2017). Three studies of maintenance rehabilitation compared telerehabilitation to a no rehabilitation control group (Comparison 3) (Barberan‐Garcia 2014 (Barcelona and Athens); Barberan‐Garcia 2014 (Trondheim); Bernocchi 2018; Vasilopoulou 2017). One of these reported both an RCT and two controlled clinical trials (Barbaren‐Garcia 2014), the results from which we have reported narratively.
Telerehabilitation interventions studied used videoconferencing (four studies: Hansen 2020; Knox 2019; Stickland 2011; Tsai 2017); telephone only (four studies: Barberan‐Garcia 2014 (Trondheim); Holland 2017; Lahham 2020; Maltais 2008); website with telephone support (two studies: Bernocchi 2018; Chaplin 2017); website only (two studies: Bourne 2017; Tabak 2014); mobile phone for SMS feedback (one study describing two CCTs: Barberan‐Garcia 2014 (Barcelona and Athens)); and a mobile application (one study: Kwon 2018). One study examined remote monitoring combined with telephone or videoconference support (Vasilopoulou 2017). Interventions that utilised videoconferencing enabled participants to see and talk to health professionals and/or other patients via a video enabled screen (e.g. computer or tablet device). In the two CCTs (Knox 2019; Stickland 2011) that used video conferencing, the intervention was delivered from a pulmonary rehabilitation centre to one or more remote healthcare facilities using a ‘Hub and Spoke’ model. Telerehabilitation interventions delivered by telephone involved participants speaking to a health professional at regular intervals (e.g. weekly), while website based interventions enabled participants to access information independently, at a time of their choosing, from an internet‐enabled device, e.g. a computer. Studies where the intervention included SMS feedback (received three times weekly) or the use of a mobile application required participants to have a smartphone, which in some cases was provided for participants. Participants accessing a mobile application via smartphone were required to utilise additional equipment, including a pulse oximeter, to collect additional physiological outcomes. Outside of the two CCTs employing a 'Hub and Spoke' model of telerehabilitation, in all other studies the intervention was delivered to the patient’s location, which was commonly their home. In four studies (Hansen 2020; Knox 2019; Stickland 2011; Tsai 2017) the intervention was undertaken in a group, whether physical (Knox 2019; Stickland 2011) or virtual (Hansen 2020; Tsai 2017). In all other studies, the intervention was delivered on an individual participant basis.
Three studies (Barberan‐Garcia 2014 (Barcelona and Athens); Barberan‐Garcia 2014 (Trondheim); Bernocchi 2018; Vasilopoulou 2017) were of maintenance rehabilitation; all remaining studies were of primary pulmonary rehabilitation. Telerehabilitation interventions ranged in length from six weeks (Bourne 2017) to nine months (Tabak 2014) for primary rehabilitation; and from four months (Bernocchi 2018) to 22 months (Barberan‐Garcia 2014 (Barcelona and Athens)) for maintenance rehabilitation. In seven studies (Bourne 2017; Chaplin 2017; Hansen 2020; Holland 2017; Maltais 2008; Stickland 2011) telerehabilitation was compared to traditional centre‐based pulmonary rehabilitation (Comparison 1). In six studies (Barberan‐Garcia 2014 (Barcelona and Athens); Barberan‐Garcia 2014 (Trondheim); Bernocchi 2018; Kwon 2018; Lahham 2020; Tabak 2014; Tsai 2017) telerehabilitation was compared to a no rehabilitation control group (Comparison 3). One study of maintenance rehabilitation (Vasilopoulou 2017) compared telerehabilitation to both centre‐based rehabilitation and a no rehabilitation control group.
There were no studies comparing telerehabilitation to in‐patient pulmonary rehabilitation (Comparison 2).
Duration of follow‐up
Five included studies of primary rehabilitation reported medium‐term (up to six months; Hansen 2020; Lahham 2020; Stickland 2011) or longer‐term follow‐up (greater than six months; Holland 2017; Maltais 2008), beyond the end of the intervention period. No studies of telerehabilitation have undertaken follow‐up beyond 12 months. There was no medium‐ or long‐term follow‐up of any trials of maintenance telerehabilitation. There were no studies of telerehabilitation compared to inpatient rehabilitation (Comparison 2). Only three studies reported details relating to technological issues (Hansen 2020; Knox 2019; Tsai 2017) (Table 1).
| Study | Intervention technology | Reported issues |
|---|---|---|
| Hub and spoke telerehabilitation using videoconferencing (Polycom Real Presence Group 500 Video Conferencing System and Samsung DM65E‐BR interactive screens, installed by Comcen). | The videoconferencing connection was lost in two out of 452 sessions, and sites were reconnected by redialing. Some participants had difficulty hearing a presentation in an early session which was resolved by microphone replacement and the closing of curtains to reduce echo. | |
| In home telerehabilitation using video conferencing software installed on a single touch screen. | Major technical issues leading to cancellation and rescheduling of group sessions 2 of 360 group sessions. Minor technical issues (i.e., sound artefacts, screen freezes) not Individual patient cancellation caused | |
| In home telerehabilitation using video conferencing and a tablet computer | Out of a total of 197 exercise training sessions there were 24 technical issues (12%) related to the use of technology (e.g. poor internet connection). |
Excluded studies
Of the 149 full text papers reviewed, we excluded 82 studies. Reasons for exclusion were primarily that studies were the wrong intervention (n = 60). Fourteen studies (18 references) were classified as ongoing (see 'Characteristics of ongoing studies'); 12 studies (16 references) are awaiting classification. Full details of the reasons for exclusion are included in the 'Characteristics of excluded studies' section.
Risk of bias in included studies
Details on our assessment of the potential risk of bias of included studies are summarised in Figure 2 and Figure 3 for RCTs, with full details in the 'Characteristics of included studies' tables. Assessment of the risk of bias for non‐RCTs and full details of the accompanying ROBINS‐I ratings can be found in Table 2.

Risk of bias summary: review authors' judgements about each risk of bias item for each included study.

Risk of bias graph: review authors' judgements about each risk of bias item presented as percentages across all included studies.
| Study: Barbaren‐Garcia 2014 (Barcelona and Athens) | ||
|---|---|---|
| ROBINS‐I domain | Risk of Bias | Description |
| Bias due to confounding | Serious | Confounding associated with country, socioeconomic status and health system inherently unable to be controlled for. Different components to information communication technology (ICT) support in both sub‐studies. |
| Bias in selection of participants | Critical | Patients were allocated to the intervention or control group depending on availability of mobile phones with wireless sensors (Barcelona). Control group assessed first and afterward the intervention group due to delays in deployment of technological platform (Athens) |
| Bias in classification of interventions | Serious | Baseline cardiopulmonary rehabilitation and intervention differed between countries, however comparisons were not made between countries. |
| Bias due to deviations from intended interventions | Serious | Unable to determine if study participants adhered to the intervention; much larger drop out in the control group than intervention group ‐ authors proposed this is due to issues with ICT in 54% of cases and access (travel) in another 25% (with proposed reason for dropout only noted for Barcelona study group) |
| Bias due to missing data | Serious | Large losses to follow up (47% Barcelona, 56% Athens) from the control groups. Reasons for loss to follow up from intervention groups not stated. |
| Bias in measurement of outcomes | Moderate | Standard tests common across groups and study sites, but unclear if outcome assessors blind. Much longer follow up for Barcelona study (mean (SD) 22 (12) months vs 12 months) |
| Bias in selection of the reported result | Moderate | Pre and post data presented for Barcelona group, change data presented for Athens group. SGRQ total and activity domain only presented for Barcelona group, component of SGRQ reported for Athens unclear (change data only). |
| Overall bias | Critical | |
| Study: Knox 2019 | ||
| ROBINS‐I domain | Risk of Bias | Description |
| Bias due to confounding | Serious | Socio‐economic status (regional vs metropolitan) unable to be accounted for. May favour control group. |
| Bias in selection of participants | Serious | Selection into the study was on the basis of the intervention and this was unable to be controlled for in the analysis. |
| Bias in classification of interventions | Low | Intervention groups were clearly defined. |
| Bias due to deviations from intended interventions | Moderate | Co‐interventions balanced across groups (education delivered via videoconference from Hub site in real time). Hub staff were able to travel to Spoke site at their discretion if deemed more support was needed. This protocol deviation only impacted Spoke intervention sites and impact on outcomes is not able to be accounted for. |
| Bias due to missing data | No information | No information or insufficient information is reported about missing data. Reasons for missing data are not described. Numbers of individuals who completed the end intervention assessment are not reported in the paper. Only complete data set outcomes are reported for ISWT ‐ other outcomes unclear (author communication) |
| Bias in measurement of outcomes | Moderate | Standardised assessments used (ISWT, CAT, HADS, MRC), but unclear if assessors were aware of intervention |
| Bias in selection of the reported result | No information | There is too little information to make a judgement |
| Overall bias | Serious | |
| Study: Stickland 2011 | ||
| ROBINS‐I domain | Risk of Bias | Description |
| Bias due to confounding | Serious | Socio‐economic status (regional vs metropolitan) unable to be accounted for. May favour control group. |
| Bias in selection of participants | Low | All enrolled participants had confirmed diagnosis of COPD. Inclusion and exclusion criteria applied equally across both groups. |
| Bias in classification of interventions | Low | Intervention groups were clearly defined and information to define characteristics of groups presented at the start of the intervention (baseline characteristics). Classification of intervention based on geography |
| Bias due to deviations from intended interventions | Low | Co‐interventions balanced across group. Average number of sessions attended similar in both intervention (telehealth average 12.6 sessions) and control (standard pulmonary rehabilitation average 13.2 sessions) |
| Bias due to missing data | Moderate | High follow up and imputation analysis at end intervention; but significant loss to follow up data at 6‐months and unable to perform imputation analysis |
| Bias in measurement of outcomes | Moderate | Standardised assessments used (12min walk test and SGRQ), but unclear if assessors were aware of intervention |
| Bias in selection of the reported result | Low | All outcome measures reported appropriately including total score and all domain scores of the SGRQ |
| Overall bias | Moderate | |
CAT: COPD assessment test; COPD: chronic obstructive pulmonary disease; HADS: Hospital Anxiety and Depression Scale;ISWT: incremental shuttle walk test; MRC: medical research council dyspnoea scale; SD: standard deviation; SGRQ: St George's Respiratory Questionnaire.
Allocation
Overall, the risk of bias relating to random sequence generation and allocation concealment was low. Two studies were rated to be at unclear risk of bias for random sequence generation (Barberan‐Garcia 2014 (Trondheim); Kwon 2018), and three for allocation concealment (Barberan‐Garcia 2014 (Trondheim); Kwon 2018; Vasilopoulou 2017), due to insufficient information.
Blinding
Due to the nature of the interventions it was not possible to blind participants, or personnel delivering the intervention, so by default all RCTs were classified as being at high risk for performance bias. Only half (n = 6) of the RCTs reported blinding of outcomes assessors (Bernocchi 2018; Bourne 2017; Hansen 2020; Holland 2017; Lahham 2020; Tsai 2017) and were classified as being at low risk of detection bias.
Incomplete outcome data
We rated six of the included RCTs as being at low risk for attrition bias (Bourne 2017; Holland 2017; Lahham 2020; Maltais 2008; Tsai 2017; Vasilopoulou 2017) due to only small numbers of reported dropouts. Three RCTs (Chaplin 2017; Kwon 2018; Tabak 2014) were rated to be at high risk of bias for attrition bias due to discrepancy in drop‐outs reported between the intervention and control groups.
Selective reporting
Only two studies of RCTs were found to have low risk of reporting bias (Holland 2017; Tsai 2017). The majority of included RCTs were rated as having unclear risk of reporting bias due to discrepancies between reported data and that indicated in trial registries or published protocols. One study only presented data for clinical outcomes assessed during the intervention period, but not at the completion of the intervention (Tabak 2014).
Other potential sources of bias
We assessed two RCTs to be of low risk with respect to other sources of bias (Holland 2017; Lahham 2020). The remaining studies were determined to have an unclear risk of other sources of bias associated with timing of trial registration, variations in components of the intervention or control conditions between study sites, exclusion of participants without access to relevant smart‐devices, and for one study competing interests noted for the authors.
Risk of bias for non‐RCTs
Three studies, one of which reported two CCTs (Barberan‐Garcia 2014 (Barcelona and Athens); Knox 2019; Stickland 2011), were assessed for bias using the ROBINS‐I tool. Studies were classified with an overall risk of bias of critical (one study, two reports: Barberan‐Garcia 2014 (Barcelona and Athens), serious (one study: Knox 2019) and moderate (one study: Stickland 2011).
All three non‐RCTs were rated as serious for pre‐intervention bias due to confounding. Patient‐related factors including socio‐economic status, geography (country, regional area or metropolitan area) were inherently unable to be controlled for and may have favoured one group over the other. One study (two CCTs) was classified as critical for risk of bias for selection of participants (Barberan‐Garcia 2014 (Barcelona and Athens)) as participants were allocated to intervention or control groups based on access to and availability of technology. All studies were rated as moderate risk of bias in measurement of outcomes due to the use of standardised assessments, but it was unclear if assessors were blind to group allocation.
Effects of interventions
See: Summary of findings 1 Telerehabilitation compared to centre‐based (outpatient) pulmonary rehabilitation for chronic respiratory disease; Summary of findings 2 Telerehabilitation compared to no rehabilitation control for chronic respiratory disease
See 'Summary of findings' tables for primary outcomes (exercise capacity, dyspnoea and quality of life) for the main comparisons: telerehabilitation compared to outpatient centre‐based rehabilitation (Comparison 1, summary of findings Table 1); and telerehabilitation compared to a no rehabilitation control (Comparison 3, summary of findings Table 2). No studies compared telerehabilitation to in‐patient pulmonary rehabilitation (Comparison 2).
Primary outcomes
Comparison 1: Telerehabilitation compared to outpatient, centre‐based (in‐person) pulmonary rehabilitation
Exercise capacity
Primary rehabilitation
All included studies assessed at least one measure of exercise capacity. The most frequently reported measurement of exercise capacity was the six‐minute walk distance (6MWD) (Bourne 2017; Hansen 2020; Holland 2017; Maltais 2008). Assessment of exercise capacity in studies of primary rehabilitation was also reported using the Incremental Shuttle Walk Test (ISWT) and Endurance Shuttle Walk Test (ESWT) (Chaplin 2017), endurance cycle time (ECT) (Maltais 2008) and 30 second sit‐to‐stand (STS) (Hansen 2020).
We were able to combine four RCTs of telerehabilitation for primary rehabilitation compared to outpatient, centre‐based pulmonary rehabilitation in a meta‐analysis. The mean difference in 6MWD between interventions was 0.06 metres (m) (95% CI ‐10.82 m to 10.94 m; 556 participants; four studies; I2 = 22%, moderate‐certainty evidence. Analysis 1.1; Figure 4) (Bourne 2017; Hansen 2020; Holland 2017; Maltais 2008).

Forest plot of comparison: 1 Telerehabilitation vs Centre‐based (outpatient) pulmonary rehabilitation, outcome: 1.1 Outcome 1 Exercise capacity ‐ 6minute walk test distance at end intervention.
In RCTs, there were wide confidence intervals when comparing telerehabilitation and centre‐based pulmonary rehabilitation for 30 second STS (MD ‐0.04 repetitions, 95% CI ‐1.58 to 0.78; one study; 134 participants; Analysis 1.5 (Hansen 2020); endurance cycle test time (MD 9 seconds, 95% CI ‐92.19 to 110.19; 184 participants; one study; Analysis 1.3) (Maltais 2008); or ESWT (MD 4.50 seconds, 95% CI ‐112.37 to 121.37; 62 participants; one study; Analysis 1.2) (Chaplin 2017).
In one CCT, exercise capacity outcomes were reported to favour telerehabilitation compared to centre‐based pulmonary rehabilitation for ISWT distance (change in ISWT distance 137 m versus 66 m, 95% CI of difference 9.31 m to 133 m; 45 participants; one study) (Knox 2019), whereas a second CCT did not demonstrate a difference in exercise capacity when telerehabilitation was compared to centre‐based rehabilitation (change in twelve‐minute walk distance (12MWD) at end intervention MD ‐20.2 m (95% CI ‐75.18 m to 34.78 m); 409 participants; one study) (Stickland 2011).
For primary rehabilitation, there were no reported differences between telerehabilitation and centre‐based pulmonary rehabilitation for exercise capacity with medium‐term follow‐up (Hansen 2020, 6MWD at 10 to 12 weeks follow‐up; Stickland 2011, twelve‐minute walk test (12MWT) at six months follow‐up). We combined in meta‐analysis two RCTs of telerehabilitation compared to centre‐based pulmonary rehabilitation with long‐term follow‐up at or around 12 months post‐intervention. There may be little or no difference between interventions for exercise capacity (6MWD: MD 1.40 m, 95% CI ‐12.62 to 15.43, 308 participants; two studies; Analysis 1.6 (Holland 2017; Maltais 2008).
Maintenance rehabilitation
One RCT of maintenance telerehabilitation compared to centre‐based maintenance rehabilitation (Vasilopoulou 2017) reported uncertain difference for 6MWD (MD ‐7.30 m, 95% CI ‐34.93 m to 20.33 m; 97 participants; Analysis 1.1) and for peak watts on cardiopulmonary exercise test (MD 9 watts, 95% CI ‐92.19 to 110.19; 97 participants; Analysis 1.4) at the end of the 12 month intervention.
Dyspnoea
Primary rehabilitation
Symptoms of breathlessness were assessed using the Medical Research Council (MRC) dyspnoea scale (studies = 1, Knox 2019), the modified MRC (mMRC) dyspnoea scale (studies = 2, Bourne 2017; Holland 2017) and the dyspnoea domain of the chronic respiratory disease questionnaire (CRQ‐D) (studies = 3, Chaplin 2017; Holland 2017; Maltais 2008). None of the included studies reported finding a difference between interventions for symptoms of breathlessness, on any measure.
We combined three RCTs of telerehabilitation for primary rehabilitation compared to outpatient, centre‐based pulmonary rehabilitation in a meta‐analysis. The mean difference in CRQ‐D between interventions was 0.13 points (95% CI ‐0.13 to 0.40; 426 participants; two studies; I2 = 31%, low‐certainty evidence; Analysis 1.8; Figure 5) (Chaplin 2017; Holland 2017; Maltais 2008).

Forest plot of comparison: 1 Telerehabilitation vs Centre‐based (outpatient) pulmonary rehabilitation, outcome: 1.8 Outcome 3 Dyspnoea ‐ Change in CRQ Dyspnoea domain at end intervention.
Two RCTs of telerehabilitation compared to centre‐based pulmonary rehabilitation with long‐term follow‐up at or around 12 months post intervention were combined in a meta‐analysis. There was uncertain difference between interventions for breathlessness (mMRC MD 0.14 units, 95% CI ‐0.08 to 0.36; 364 participants; two studies; Analysis 1.9) (Holland 2017; Maltais 2008).
Maintenance rehabilitation
One RCT of maintenance telerehabilitation compared to centre‐based maintenance rehabilitation did not find a difference between groups for mMRC dyspnoea score at the end of the 12‐month intervention (MD 0.3, 95%CI ‐0.08 to 0.68; 97 participants; one study; Analysis 1.7) (Vasilopoulou 2017).
Quality of life
Primary rehabilitation
All included studies of telerehabilitation compared to centre‐based pulmonary rehabilitation assessed at least one measure of quality of life. Tools used to assess quality of life were St George's Respiratory Questionnaire (SGRQ) (studies = 4, Bourne 2017; Maltais 2008; Stickland 2011; Vasilopoulou 2017), the chronic respiratory disease questionnaire (CRQ) (studies = 3, Chaplin 2017; Holland 2017; Maltais 2008), the EQ‐5D‐5L (studies = 2, Chaplin 2017; Hansen 2020), and the COPD Assessment Test (CAT) (studies = 4, Bourne 2017; Chaplin 2017; Hansen 2020; Knox 2019). One study assessed quality of life with the clinical COPD questionnaire (CCQ) (Hansen 2020).
For Comparison 1, telerehabilitation compared to centre‐based pulmonary rehabilitation, we were able to conduct six meta‐analyses of RCTs (Analysis 1.10; Analysis 1.14; Analysis 1.15; Analysis 1.16; Analysis 1.17; Analysis 1.18). There may be little or no differences between groups for any measure of quality of life.
In two non‐RCTs of primary rehabilitation compared to centre‐based pulmonary rehabilitation, one study reported not finding a difference between groups for improvement in CAT (MD not reported, 95% CI ‐3.35 to 1.70; 45 participants; one study) (Knox 2019), while one study reported a difference in SGRQ total score at the end of the intervention, favouring the centre‐based rehabilitation group (MD 6.3, 95% CI 2.72 to 9.88; 409 participants; one study) (Stickland 2011).
Two studies reported no differences between telerehabilitation and centre‐based pulmonary rehabilitation for quality of life with medium‐term follow‐up (assessed with CCQ and CAT at 10 to 12 weeks follow‐up; 134 participants (Hansen 2020); assessed with SGRQ at six month follow‐up; 409 participants (Stickland 2011)). We combined in a meta‐analysis two RCTs of telerehabilitation compared to centre‐based pulmonary rehabilitation with long‐term follow‐up, at or around 12 months post intervention (364 participants; Analysis 1.24; Analysis 1.25; Analysis 1.26; Analysis 1.27) (Holland 2017; Maltais 2008). There may be little or no difference between interventions for any CRQ domain score in the meta‐analyses.
Maintenance rehabilitation
One study of maintenance telerehabilitation compared to centre‐based maintenance rehabilitation assessed quality of life with the St George's Respiratory Questionnaire (SGRQ) and the COPD Assessment Test (CAT) (Vasilopoulou 2017). The study did not find a difference between maintenance telerehabilitation and centre‐based rehabilitation for either CAT (MD 1.2 points, 95% CI ‐1.40 to 3.80; participants = 97; studies = 1, Analysis 1.14, Vasilopoulou 2017) or SGRQ total score (MD 4.80 points, 95% CI ‐2.63 to 12.23; participants = 97; studies = 1, Analysis 1.10, Vasilopoulou 2017).
Adverse events
Adverse events were inconsistently defined, with variable reporting. Reported information relating to adverse events is detailed in Table 3. Six studies of telerehabilitation compared to centre‐based pulmonary rehabilitation provided information regarding adverse events (Bourne 2017; Hansen 2020; Holland 2017; Knox 2019; Maltais 2008; Stickland 2011). Of these, no adverse events were noted in two studies (Holland 2017; Vasilopoulou 2017). One further study described monitoring for adverse events, but did not present any data (Chaplin 2017). The numbers of reported adverse events were similar between telerehabilitation and centre‐based rehabilitation, where reported. As the results could not be combined we remain uncertain about possible differences in adverse events.
| Study | Adverse events details |
|---|---|
| Not recorded as an outcome or reported. | |
| Not recorded as an outcome or reported. | |
| PROTOCOL:
PAPER:
| |
|
| |
| PROTOCOL:
PAPER:
| |
|
| |
|
| |
|
| |
| Not recorded as an outcome or reported. | |
| Not recorded as an outcome or reported. | |
|
| |
| Definition of adverse event not specified. Reasons for patient dropout that could be considered adverse event detailed in Table 4 (PAPER).
| |
| Not recorded as an outcome or reported. | |
|
| |
|
|
Abbreviations: AE, adverse event; COPD, chronic obstructive pulmonary disease; HBP, home‐based program; PR, pulmonary rehabilitation; PTR, pulmonary tele‐rehabilitation.
Secondary outcomes
Adherence/completion
Primary rehabilitation
Four RCTs of primary telerehabilitation compared to centre‐based pulmonary rehabilitation reported a pre‐determined definition for adherence to or completion of the intervention (Table 4). Adherence/completion was defined based on achieving a minimum percentage of prescribed exercise training sessions, either 60% (Maltais 2008) or 70% (Hansen 2020Holland 2017); or minimum stage of the program (Chaplin 2017). The three RCTs that defined adherence by a minimum percentage of training sessions completed could be combined in a meta‐analysis (419 participants, Analysis 1.28). Individuals undertaking telerehabilitation were more likely to complete the minimum percentage of prescribed training sessions when compared to centre‐based pulmonary rehabilitation (OR 5.36, 95% CI 3.12 to 9.21; 516 participants; three studies; I2 = 56%) (Hansen 2020, Holland 2017, Maltais 2008). In the control group, 70 people out of 100 were considered pulmonary rehabilitation completers over six to 12 weeks, compared to 93 (95% CI 80 to 96) out of of 100 people in the active treatment group. Please see the Cates plot in Figure 6.
| Study | Comparison | Definition for Adherence/Completion | Result |
|---|---|---|---|
| 3 (maintenance) | Not defined | Not reported | |
| 3 (maintenance) | Not defined |
| |
| 3 (maintenance) | Not defined |
| |
| 1 | Not defined |
| |
| 1 | Reached stage 3 or above of the web program, achieving 75% of the program |
| |
| 1 | Undertaking a minimum of 70% of the planned pulmonary rehabilitation sessions |
| |
| 1 | Undertaking a minimum of 70% of the planned pulmonary rehabilitation sessions |
| |
| 1 | Not defined |
| |
| 3 | Not defined | Not reported | |
| 3 | Not defined |
| |
| 1 | Completion of at least 60% (n = 15) of the exercise training sessions |
| |
| 1 | To attend a minimum of nine of the 16 sessions |
| |
| 3 | Not defined |
| |
| 3 | Compliance with telerehabilitation sessions was recorded by the number of completed exercise training sessions as prescribed out of a possible 24 sessions. |
| |
| 1, 3 (maintenance) | Adherence to home‐based maintenance tele‐rehabilitation and hospital‐based maintenance programs was assessed by the adherence rate (actual number of sessions/total expected number of sessions*100). |
|
Abbreviations: COPD, chronic obstructive pulmonary disease; n, number; SD, standard deviation.
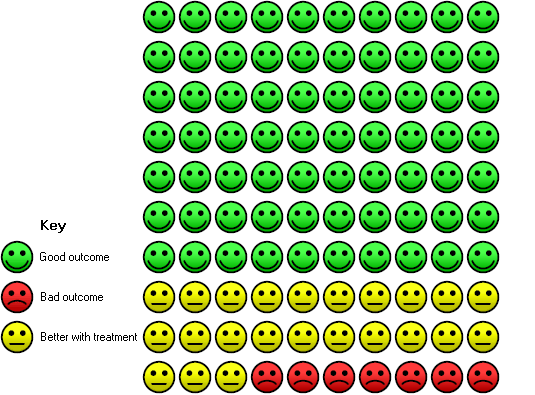
In the control group 70 people out of 100 completed treatment over 6 to 12 weeks, compared to 93 (95% CI 80 to 96) out of 100 for the active treatment group.
In one study of a web‐based telerehabilitation program, 53% of participants failed to progress past week 3 of the web‐based program (Chaplin 2017). However, the proportion of dropouts from centre‐based rehabilitation was not reported.
Maintenance rehabilitation
One RCT of maintenance telerehabilitation reported a similar proportion of completed sessions to centre‐based maintenance rehabilitation (93.5% and 91% respectively; 97 participants) (Vasilopoulou 2017).
Anxiety/depression
Primary rehabilitation
Symptoms of anxiety and depression were assessed using the Hospital Anxiety and Depression Scale (HADS). Two RCTs of telerehabilitation compared to centre‐based pulmonary rehabilitation were able to be combined in a meta‐analysis. The mean difference between interventions in HADS Anxiety scores favoured telerehabilitation (MD ‐1.05 points (95% CI ‐1.76 to ‐0.35; 282 participants; two studies; I2 = 0%; Analysis 1.29Analysis 1.30) (Hansen 2020; Holland 2017). The difference between interventions in HADS Depression scores was probably smaller at the end of the intervention (MD ‐0.36 points, 95% CI ‐1.05 to 0.34; 282 participants; two studies; Analysis 1.30) (Hansen 2020, Holland 2017). Two other RCTs (Bourne 2017; Chaplin 2017) and one CCT (Knox 2019) reported finding no differences between interventions for anxiety or depression, using the HADS at the end of intervention.
One study of long‐term follow‐up did not find a difference between interventions for anxiety or depression, using the HADS from baseline to 12 month follow‐up (anxiety MD ‐1.00 points, 95% CI ‐2.27 to 0.27; and depression MD ‐1.00 points, 95% CI ‐2.15 to 0.15; 148 participants; Analysis 1.31 and Analysis 1.32) (Holland 2017).
Maintenance rehabilitation
No studies of maintenance rehabilitation assessed anxiety or depression.
Physical activity
Primary rehabilitation
Three RCTs of telerehabilitation compared to centre‐based pulmonary rehabilitation assessed physical activity by accelerometry (Hansen 2020; Holland 2017; Vasilopoulou 2017). Two RCTs of telerehabilitation compared to centre‐based pulmonary rehabilitation that assessed physical activity via accelerometry could be combined in a meta‐analysis (Hansen 2020; Holland 2017). At end rehabilitation there was uncertain difference between groups in time spent in sedentary behaviours (MD ‐8.57 minutes, 95% CI ‐66.69 to 49.54; 192 participants; two studies; Analysis 1.34) (Hansen 2020; Holland 2017); or change in steps per day (MD 387.09 steps, 95% CI ‐84.64 to 858.81; 192 participants; two studies; Analysis 1.35) (Hansen 2020; Holland 2017). For all other physical activity outcomes, there was uncertainty in the difference between telerehabilitation and centre‐based pulmonary rehabilitation at end intervention, medium‐ and long‐term follow‐up.
Maintenance rehabilitation
One RCT of maintenance telerehabilitation compared to centre‐based maintenance rehabilitation also assessed physical activity by accelerometry (Vasilopoulou 2017). An increase in time per day spent in moderate intensity activity favoured the centre‐based rehabilitation control group (MD ‐4.3 minutes, 95% CI ‐6.9 to ‐1.7; 97 participants; Analysis 1.39).
Healthcare utilisation
COPD exacerbations, hospitalisations and emergency department presentations were reported in five studies of telerehabilitation compared to centre‐based pulmonary rehabilitation (Table 5).
| Study | Comparison | Outcome | Timepoint | Telerehabilitation | Control |
|---|---|---|---|---|---|
| 3 | Use of healthcare resources. | During follow up intervention period | Barcelona (CCT): no difference between groups Athens (CCT): no data reported | ||
| 3 | No data reported | ||||
| 3 | Median time to event hospitalisation (any cause) or death | During the 4 month study period | 113.4 days | 104.7 days* | |
| Number of hospitalisations | During the 4 month study period | 21 (11 for cardiovascular diseases, 6 for respiratory diseases, 5 for other causes) | 37 (25 for cardiovascular diseases, 11 for respiratory diseases, 1 for other causes) | ||
| 1 | No data reported | ||||
| 1 | No data reported | ||||
| 1 | Number hospitalisations related to COPD | During intervention | 21 | 20 | |
| At 22 weeks follow‐up from baseline | 38 | 36 | |||
| Hospital days relating to all admissions, per admission/patient (median [IQR]) | At 22 weeks follow‐up from baseline | 2.3 [1.3 to 3.4] | 2.2 [1.1 to 4.7] | ||
| Hospital days relating to all admissions, total admissions/patient (median [IQR]) | At 22 weeks follow‐up from baseline | 11.8 [3.4 to 27.8] | 5.2 [3.2 to 13.8] | ||
| Hospital days for respiratory admissions, per admission/patient (median [IQR]) | At 22 weeks follow‐up from baseline | 2.4 [1.6 to 3.7] | 2.5 [1.2 to 5.2] | ||
| Hospital days for respiratory admissions, total admissions/patient (median [IQR]) | At 22 weeks follow‐up from baseline | 7.5 [3.1 to 14.4] | 5.2 [2.6 to 10.0] | ||
| Number of outpatient visits | At 10 weeks follow‐up from baseline | 113 | 744 | ||
| At 22 weeks follow‐up from baseline | 270 | 899 | |||
| 1 | Proportion with a hospital admission | During 12 months follow up after completion of intervention | n = 28 (35%) | n = 37 (43%) | |
| Proportion with a respiratory admission | During 12 months follow up after completion of intervention | n = 17 (21%) | n = 29 (34%)* | ||
| Number all cause hospital admissions per participant (median [IQR]) | During 12 months follow up after completion of intervention | 0 [0‐2] | 0 [0‐1.25] | ||
| Number all cause hospital days (median [IQR]) | During 12 months follow up after completion of intervention | 0 [0‐3.75] | 0 [0‐6.25] | ||
| Number of respiratory admissions (median [IQR]) | During 12 months follow up after completion of intervention | 0 [0‐0] | 0 [0‐1] | ||
| Number hospital days for respiratory cause (median [IQR]) | During 12 months follow up after completion of intervention | 0 [0‐0] | 0 [0‐5] | ||
| 3 | No data reported | ||||
| 3 | No data reported | ||||
| 3 | No data reported | ||||
| 1 | Number of COPD exacerbations | During intervention period | 9 | 14 | |
| During maintenance phase | 43 | 37 | |||
| Number of hospitalisations | During entire study period | 50 (not COPD related n = 31) | 51 (not COPD related n = 21) | ||
| 1 | Number of hospitalisations | During rehabilitation period | 3 | 3 | |
| Number of respiratory exacerbations | During rehabilitation period | 6 | 7 | ||
| 3 | Number of COPD exacerbations | During study intervention period | 33 | not applicable | |
| Number of hospitalisations, COPD | 4 | 5 | |||
| Number of hospitalisations, other | 4 | 2 | |||
| Emergency department visits for COPD | 5 | 5 | |||
| Length of stay, hospitalisation for COPD | 22 days | 36 days | |||
| Length of hospital stay for COPD, days (median [IQR]) | 5.5 [4.8‐6.3] | 7.0 [6.0‐7.0] | |||
| 3 | No data reported | ||||
| 1 (maintenance) | Acute exacerbation of COPD (mean±SD): | During 12 month maintenance intervention | 1.7±1.7 | 1.8 ± 1.4* | |
| 3 (maintenance) | 3.5 ± 1.8* | ||||
| 1 (maintenance) | Hospitalisation for acute exacerbation COPD (mean±SD): | 0.3±0.7 | 0.3 ± 0.6* | ||
| 3(maintenance) | 1.2 ± 1.7* | ||||
| 1 (maintenance) | Emergency department visits (mean±SD): | 0.5±0.9 | 1.8 ± 1.5* | ||
| 3 (maintenance) | 3.8 ± 1.5* | ||||
Abbreviations: CCT, controlled clinical trial; COPD, chronic obstructive pulmonary disease; ED, emergency department; IQR, interquartile range; n, number; PR, pulmonary rehabilitation; SD, standard deviation.
*between group difference P < 0.05
Primary rehabilitation
Three RCTs of primary telerehabilitation compared to centre‐based pulmonary rehabilitation could be combined in a meta‐analysis (Analysis 1.41). The likelihood of being admitted to hospital during the study period (from enrolment to completion of follow‐up) was lower for telerehabilitation compared to centre‐based pulmonary rehabilitation (OR 0.65, 95% CI 0.43 to 0.99; 516 participants; three studies; I2 = 37%, evidence not graded) (Hansen 2020; Holland 2017; Maltais 2008).
In one CCT of primary rehabilitation there were the same number of hospitalisations reported for both interventions (telerehabilitation: n = 3; centre‐based rehabilitation: n = 3) (Stickland 2011).
Maintenance rehabilitation
One study of 12 months of maintenance telerehabilitation compared to centre‐based maintenance rehabilitation reported a similar mean number of acute exacerbations between groups: 1.7 (SD 1.7) and 1.8 (SD 1.4), respectively (Vasilopoulou 2017).
Comparison 2: Telerehabilitation compared to inpatient rehabilitation
No studies assessed this comparison.
Comparison 3: Telerehabilitation compared to no rehabilitation control
Primary outcomes
Exercise capacity
Primary rehabilitation
Three RCTs of telerehabilitation compared to no rehabilitation control for primary rehabilitation reported exercise capacity outcomes using 6MWD (Kwon 2018; Lahham 2020; Tsai 2017) and ISWT and ESWT (Tsai 2017).
Two RCTs combined in a meta‐analysis showed that telerehabilitation may increase 6MWD (MD 22.17 m; 95% CI ‐38.89 to 83.23; 94 participants; two studies; I2 = 35%; low‐certainty evidence; Analysis 3.1; Figure 7 (Lahham 2020; Tsai 2017). There was no significant heterogeneity across studies.

Forest plot of comparison: 3 Telerehabilitation vs no rehabilitation control, outcome: 3.1 Outcome 1 Exercise capacity ‐ 6minute walk distance at end intervention.
In one RCT, when compared to no rehabilitation control, no difference in ISWT distance was reported at the end of the intervention (MD 4 m, 95% CI ‐23 m to 31 m; 36 participants; one study; Analysis 3.3) (Tsai 2017). However, a clear improvement in endurance cycle time was seen with telerehabilitation (MD 314 seconds, 95% CI 144 to 484; 36 participants; one study; Analysis 3.4) (Tsai 2017).
In one RCT, at month three of a nine‐month intervention, outcomes for 6MWD favoured telerehabilitation compared to no rehabilitation control (MD 99.6 m, 95% CI 62.87 m to 136.33 m; 20 participants; one study) (Tabak 2014 ); however, no end intervention data were reported. One RCT that tested two different telerehabilitation interventions compared to a no rehabilitation control reported that there was no difference between groups for 6MWD, but data were not reported (Knox 2019; Kwon 2018).
One study of primary telerehabilitation compared to no rehabilitation control reported medium‐term follow‐up data. At six months, following the end of the intervention, no differences were reported between telerehabilitation and no rehabilitation control for 6MWD (MD 7 m, 95% CI ‐59 m to 72 m; 58 participants; one study) (Lahham 2020).
Maintenance rehabilitation
Two RCTs of maintenance telerehabilitation compared to no rehabilitation control reported exercise capacity outcomes using 6MWD (Bernocchi 2018; Vasilopoulou 2017), with one RCT also reporting peak watts on cardiopulmonary exercise test (Vasilopoulou 2017). One study reporting two non‐randomised controlled trials measured exercise capacity via 6MWD (Barberan‐Garcia 2014 (Barcelona and Athens)).
Two RCTs of maintenance rehabilitation could be meta‐analysed. The analysis showed that there may be a benefit of telerehabilitation over no rehabilitation control, with a mean difference in 6MWD of 78.10 m (95% CI 49.60 to 106.60; 209 participants; two studies; I2 = 40%; low‐certainty evidence, Analysis 3.1, Figure 7) (Bernocchi 2018; Vasilopoulou 2017). The difference in 6MWD between telerehabilitation and no rehabilitation control for maintenance rehabilitation exceeded the minimal important difference for the 6MWD (Holland 2014b). There was no significant heterogeneity across studies.
One RCT of maintenance rehabilitation reported an improvement in peak watts on CPET at the end of the telerehabilitation intervention (MD 18 watts, 95% CI 6 to 30; 97 participants; one study; Analysis 3.2) (Vasilopoulou 2017).
In two non‐RCTs, the exercise capacity outcomes differed (Barberan‐Garcia 2014 (Barcelona and Athens)), favouring telerehabilitation compared to a no‐rehabilitation control in one study (Barcelona: 6MWD at end intervention; MD 92 m, 95% CI 49.15 to 134.85; 77 participants), and reporting no difference in exercise capacity between groups in the other (Athens: change in 6MWD at end intervention; MD ‐5 m, 95% CI ‐20.58 to 10.58; 40 participants).
Dyspnoea
Primary rehabilitation
Breathlessness was assessed using the modified MRC dyspnoea scale (studies = 2, Kwon 2018; Lahham 2020) and the dyspnoea domain of the chronic respiratory disease questionnaire (CRQ‐D) (studies = 2, Lahham 2020; Tsai 2017). None of the included studies reported a difference between groups for symptoms of breathlessness, on any measure.
When compared to a no‐rehabilitation control, there may be a benefit of telerehabilitation for CRQ‐D (MD 1.97 points, 95% CI ‐1.07 to 5.02; 94 participants; two studies; low‐certainty evidence, Analysis 3.5) (Lahham 2020; Tsai 2017).
One RCT of telerehabilitation compared to no‐rehabilitation control reported Borg dyspnoea at exercise (ESWT) isotime, but did not find a difference between groups (MD 1, 95% CI ‐0.31 to 2.31; 36 participants; one study; Analysis 3.6) (Tsai 2017).
One study of primary telerehabilitation compared to no rehabilitation control reported medium‐term follow‐up. At six months following the end of the intervention, no differences were reported between telerehabilitation and no rehabilitation control for mMRC (MD ‐0.0, 95% CI ‐0.5 to 0.5; 58 participants; one study) (Lahham 2020).
Maintenance rehabilitation
Symptoms of breathlessness were assessed using the MRC dyspnoea scale (Bernocchi 2018), and the mMRC dyspnoea scale (Barberan‐Garcia 2014 (Barcelona and Athens); Vasilopoulou 2017). None of the included studies reported a difference between groups for symptoms of breathlessness, on any measure.
Two RCTs of maintenance telerehabilitation compared to no rehabilitation control were combined in a meta‐analysis and demonstrated a very uncertain improvement in change score for MRC/mMRC, favouring telerehabilitation (MD ‐0.86 points, 95% CI ‐2.10 to 0.37; 209 participants; two studies; very low‐certainty evidence, Analysis 3.7) (Bernocchi 2018; Vasilopoulou 2017).
One non‐RCT of maintenance telerehabilitation compared to no‐rehabilitation control reported a reduction from 35% to 27% in the percentage of participants categorised as mMRC 3‐4 in the intervention group, with no change in the control group (77 participants) (Barberan‐Garcia 2014 (Barcelona and Athens)).
Quality of life
Primary rehabilitation
RCTs of primary telerehabilitation compared to no rehabilitation control assessed quality of life using the CRQ (studies = 2, Lahham 2020; Tsai 2017; Analysis 3.10; Analysis 3.11; Analysis 3.12; Analysis 3.13; Analysis 3.14), and the CAT (studies = 2, Kwon 2018; Tsai 2017). One study assessed quality of life with the clinical COPD questionnaire (CCQ) and the EQ‐5D‐5L (Tabak 2014).
When compared to a no rehabilitation control, there may be a higher CRQ total score on telerehabilitation (MD 6.90 points, 95% CI ‐0.57 to 14.36; 94 participants; two studies; low‐certainty evidence; Analysis 3.10) (Lahham 2020; Tsai 2017). This difference was measured using a maximum score of 140 on the CRQ scale, so would be equivalent to a mean difference of 0.345 units on a 7‐point scale.
At month 3 of a nine‐month intervention in one RCT (n = 20) of primary telerehabilitation compared to no rehabilitation control, the authors reported better scores for CCQ (mean 1.8 (SD 0.24) versus mean 2.3 (SD 0.26)) and EQ‐5D visual analogue scale (mean 72.3 (SD 3.1) versus mean 62.4 (SD 3.5)), respectively, for the telerehabilitation group compared to the no rehabilitation control (Tabak 2014). No data from end intervention were presented.
One study of primary telerehabilitation compared to no rehabilitation control reported medium‐term follow‐up (58 participants) (Lahham 2020). At six months, following the end of the intervention, no differences were reported between telerehabilitation and no rehabilitation control for any CRQ domain.
Maintenance rehabilitation
Studies of maintenance telerehabilitation compared to no rehabilitation control assessed quality of life using SGRQ (Barberan‐Garcia 2014 (Barcelona and Athens); Vasilopoulou 2017), the CAT (Bernocchi 2018; Vasilopoulou 2017), and the Minnesota Lung Heart Failure Questionnaire (MLHFQ) (Bernocchi 2018).
When maintenance telerehabilitation was compared to no rehabilitation control there may or may not be a difference in CAT score favouring the telerehabilitation group (MD ‐7.34, 95% CI ‐9.20 to ‐5.48; 209 participants; two studies; very low‐certainty evidence; Analysis 3.9) (Bernocchi 2018; Vasilopoulou 2017).
In one RCT of maintenance telerehabilitation compared to no rehabilitation control, in participants with a combined diagnosis of COPD and heart failure, there was an improvement in MLHFQ score favouring telerehabilitation at the end of the four month intervention (MD ‐10.06, 95% CI ‐15.68 to ‐4.44; 112 participants; one study; evidence not graded; Analysis 3.15 (Bernocchi 2018). In one RCT of maintenance telerehabilitation compared to no rehabilitation control, at the end of the 12 month intervention, improvement in total SGRQ score favoured telerehabilitation (MD ‐11.80, 95% CI ‐19.44 to ‐4.16; 97 participants; one study; evidence not graded; Analysis 3.8 (Vasilopoulou 2017).
In one study of two non‐randomised controlled trials of maintenance rehabilitation compared to no rehabilitation control (Barberan‐Garcia 2014 (Barcelona and Athens)) a significant effect for SGRQ total score favouring the telerehabilitation group was seen in one trial (Barcelona, MD ‐10, 95% CI ‐17.89 to ‐2.1) with no effect in the other trial (Athens, no data reported).
Adverse events
As noted in Comparison 1, adverse events were inconsistently defined, with variable reporting. Reported information relating to adverse events is detailed in Table 3. One RCT of primary telerehabilitation compared to no rehabilitation control (Tsai 2017) and two RCTs of maintenance telerehabilitation compared to no rehabilitation control (Bernocchi 2018; Vasilopoulou 2017) reported no study related adverse events. We are therefore uncertain about adverse events.
Secondary outcomes
Adherence/completion
Two studies of telerehabilitation compared to no rehabilitation control reported intervention adherence (primary telerehabilitation: Tsai 2017; maintenance rehabilitation: Vasilopoulou 2017). In primary telerehabilitation, the mean number of sessions attended was 22 (SD 5) out of a maximum total 24 sessions (36 participants; one study; Tsai 2017); while for maintenance telerehabilitation the percentage of sessions undertaken relative to the total available was 93.5% (97 participants; one study; Table 4) (Vasilopoulou 2017).
Anxiety/depression
Primary rehabilitation
One RCT of telerehabilitation compared to no rehabilitation control assessed anxiety and depression with the HADS (Analysis 3.16 and Analysis 3.17) and reported an improvement in HADS depression score at end intervention favouring the telerehabilitation group (MD ‐2.40, 95% CI ‐3.48 to ‐1.32; 36 participants; one study; evidence not graded) (Tsai 2017).
Maintenance rehabilitation
No studies of maintenance telerehabilitation compared to no rehabilitation control assessed anxiety or depression.
Physical activity
Primary rehabilitation
Physical activity participation was assessed by accelerometry in three studies (Lahham 2020; Tabak 2014; Tsai 2017) of telerehabilitation compared to no rehabilitation. The effect of telerehabilitation on physical activity outcomes was inconsistent.
Two RCTs of telerehabilitation compared to no rehabilitation control measuring physical activity by accelerometry were combined in a meta‐analysis. There was no clear improvement in steps per day (MD 489 steps, 95% CI ‐143 to 1120; 94 participants; two studies; evidence not graded, Analysis 3.19) (Lahham 2020; Tsai 2017) or time spent in sedentary behaviour (MD 42 minutes, 95% CI ‐26 to 111; 94 participants; two studies; evidence not graded; Analysis 3.20) ( Lahham 2020; Tsai 2017) following telerehabilitation, compared to no rehabilitation control. In Tsai 2017, time spent in light intensity physical activity favoured the control group at end intervention (MD ‐44 minutes, 95% CI ‐87.4 to ‐0.59; 36 participants; one study; evidence not graded; Analysis 3.21).
One study of primary telerehabilitation compared to no rehabilitation control reported medium‐term follow‐up (58 participants) (Lahham 2020). At six months following the end of the intervention, no differences were reported between telerehabilitation and no rehabilitation control for any measure of physical activity.
Maintenance rehabilitation
One RCT of maintenance telerehabilitation compared to no rehabilitation control assessed physical activity by accelerometry. There was a small difference in time spent in moderate intensity physical activity, favouring the intervention group at end rehabilitation (MD 3.2 minutes, 95% CI 0.65 to 5.75; 97 participants; one study; evidence not graded; Analysis 3.23) (Vasilopoulou 2017).
Healthcare utilisation
COPD exacerbations, hospitalisations and emergency department presentations were reported in three studies of telerehabilitation compared to no rehabilitation (Table 5). The three studies reported healthcare utilisation only during the intervention period (primary rehabilitation: Tabak 2014; maintenance rehabilitation: Bernocchi 2018; Vasilopoulou 2017). Due to variable reporting of healthcare utilisation and time points, data could not be combined in a meta‐analysis. Similar numbers of COPD related hospitalisations were reported for the telerehabilitation group and no rehabilitation group for primary rehabilitation, with four and five admissions respectively over the nine‐month intervention period (Tabak 2014).
In one RCT of maintenance telerehabilitation compared to no rehabilitation, the likelihood of hospitalisation was lower for telerehabilitation (OR 0.31, 95% CI 0.14 to 0.67; 112 participants; one study; evidence not graded, Analysis 3.32) (Bernocchi 2018).In one RCT, the mean acute exacerbations of COPD were lower in the maintenance telerehabilitation group than in the no‐rehabilitation control (mean 1.7 (SD 1.7) versus mean 3.5 (SD 1.8); P < 0.001; 97 participants; one study; evidence not graded) (Vasilopoulou 2017).
Discussion
Summary of main results
The aim of this review was to assess the safety and potential beneficial effects of telerehabilitation on exercise capacity, breathlessness and health‐related quality of life in people with chronic respiratory disease when compared to centre‐based (in‐person) pulmonary rehabilitation or no rehabilitation control. We included a total of 15 studies (32 reports) with 1904 participants, using five different models of telerehabilitation. Almost all (99%) included participants had COPD. Three studies were CCTs.
For primary pulmonary rehabilitation, there was probably little or no difference between telerehabilitation and in‐person pulmonary rehabilitation for exercise capacity measured as 6MWD (MD 0.06 m, 95% CI ‐10.82 m to 10.94 m; 556 participants; four studies; moderate‐certainty evidence). There may also be little or no difference for quality of life measured on SGRQ total score (MD ‐1.26, 95% CI ‐3.97 to 1.45; 274 participants; two studies; low‐certainty evidence) or breathlessness on the CRQ dyspnoea domain score (MD 0.13, 95% CI ‐0.13 to 0.40; 426 participants; three studies, low‐certainty evidence). Participants were more likely to complete a program of telerehabilitation with 93% (95% CI: 90 to 96%) completion rate, when compared to face‐to‐face rehabilitation (70% completion). When compared to no rehabilitation control, trials of primary telerehabilitation may increase exercise capacity in 6MWD (MD 22.17 m, 95% CI ‐38.89 m to 83.23 m; 94 participants; two studies; low‐certainty evidence) and may also increase 6MWD when delivered as maintenance rehabilitation (MD 78.1 m, 95% CI 49.6 m to 106.6 m; 209 participants; two studies; low‐certainty evidence). No adverse effects of telerehabilitation were noted over and above any reported for in‐person rehabilitation or no rehabilitation.
Across multiple trials and models of telerehabilitation delivery, the results of this review have shown that telerehabilitation and in‐person pulmonary rehabilitation have similar effects across a range of outcomes. Secondary outcomes showed that there may be a reduction in anxiety and 35% lower odds of hospital admission for those undertaking telerehabilitation, compared to in‐person rehabilitation. However, these results should be interpreted with caution due to the limited number of studies, and the relatively small number of participants. Nonetheless, these benefits in terms of reduced hospitalisations and psychological well‐being might suggest that supported rehabilitation interventions, delivered into the home, may help to alleviate stressors associated with access and participation in centre‐based, in‐person programs (Cox 2017), and may provide confidence in being able to exercise independently (Hoaas 2016).
These findings suggest that primary pulmonary rehabilitation programs delivered by telerehabilitation can provide a clinically effective alternative to centre‐based rehabilitation models. The number of centre‐based pulmonary rehabilitation programs available on a global scale is estimated to be able to service fewer than 2% of all people with COPD (Desveaux 2015). Being able to increase the number of individuals who can access and receive benefit from pulmonary rehabilitation is a key clinical and research priority (Rochester 2015). In addition, the 2020 global pandemic associated with coronavirus has had a profound impact on the ability to provide traditional, face‐to‐face, centre‐based pulmonary rehabilitation services (Houchen‐Wolloff 2020), with the effect potentially ongoing.
Given that the physical benefits achieved in traditional centre‐based pulmonary rehabilitation are mostly not maintained at one year after rehabilitation completion (Spencer 2019), the question of whether telerehabilitation can serve as a useful, long‐term strategy to support maintenance of pulmonary rehabilitation gains requires further investigation. That both of the two included studies of maintenance telerehabilitation, which assessed outcomes at the end of the respective intervention periods, may have achieved clinically meaningful gains for exercise capacity, despite using vastly different delivery models (144 sessions over 12 months with physiological monitoring and weekly consultation with a health professional in Vasilopoulou 2017 or twice‐weekly telephone contact with health professionals for four months with physiological monitoring and provision of exercise equipment in Bernocchi 2018) requires further exploration. In addition, these maintenance models are resource‐intensive, so understanding the cost‐effectiveness of any medium‐ to longer‐term maintenance intervention will be necessary to justify the resources involved.
Overall completeness and applicability of evidence
Almost all participants in the included studies were individuals with COPD, which may have implications for the applicability of the findings to other groups with chronic respiratory disease. One RCT of maintenance telerehabilitation compared to no rehabilitation comprised participants with multiple diagnoses, one of which was COPD (Barberan‐Garcia 2014 (Trondheim)). However, it was not possible to obtain data relating only to the COPD participants in this study. Whether individuals with ILD, bronchiectasis or asthma would respond differently to a rehabilitation intervention using telerehabilitation remains to be determined.
Although the interventions in this review met the definition of telerehabilitation, being rehabilitation delivered at a distance using information communication technology, they were heterogeneous in their components. The technology modalities employed differed widely between studies and encompassed telephone calls, bespoke websites or mobile applications, the use of videoconferencing and text messaging support. The degree of supervision of exercise training (in‐person, real‐time, or minimal) also varied, as did the location to which telerehabilitation was delivered (patient’s home versus healthcare facility). Four studies in this review (Hansen 2020; Knox 2019; Stickland 2011; Tsai 2017) delivered telerehabilitation in a group setting, either at a healthcare facility or in a virtual group from the patient’s home. Due to the limited number of studies, it was not possible to determine the effect of one model of delivery or location of telerehabilitation over another. Although we were unable to examine the relative efficacy of different models of telerehabilitation in the current review, this might be informative in future updates, if additional studies are available. That telerehabilitation can be delivered in a group environment, akin to traditional centre‐based programs, creates the opportunity for participants to receive social support and modelling from their peers, a recognised important component of pulmonary rehabilitation (Hill 2013). That there was no difference between centre‐based pulmonary rehabilitation and telerehabilitation in key outcomes including exercise capacity, quality of life and breathlessness, regardless of format, indicates the potential for the use of a wide range of telerehabilitation models as alternatives to centre‐based delivery. The global COVID‐19 pandemic has caused a dramatic and immediate change to the way pulmonary rehabilitation is delivered, largely precluding centre‐based delivery of pulmonary rehabilitation and fast‐tracking the need for remote program delivery. However, this has highlighted that for telerehabilitation to provide an entirely home‐based or remote rehabilitation experience, options for remote physical assessment need to be explored (Holland 2020). None of the included studies reported undertaking remote or in‐home physical assessment, and presently there are no tests of exercise capacity for people with respiratory disease that can identify desaturation and enable prescription of adequate training intensity that can be performed remotely (Holland 2020).
The duration of intervention in the included studies varied widely. Studies of primary rehabilitation ranged from six weeks (Bourne 2017) to nine months (Tabak 2014). Studies of maintenance rehabilitation ranged from four months (Bernocchi 2018) to 12 months or more (Barberan‐Garcia 2014 (Barcelona and Athens); Barberan‐Garcia 2014 (Trondheim); Vasilopoulou 2017). Five studies of primary rehabilitation reported follow‐up beyond the end of the intervention, which ranged from 10 to 12 weeks (Hansen 2020) to around 12 months (Holland 2017; Maltais 2008). No follow‐up data beyond the end of the intervention were reported for studies of maintenance rehabilitation. The lack of consistency in intervention duration makes it difficult to establish if there is a single best, or ideal duration of, telerehabilitation intervention. Likewise, the limited studies that provide follow‐up data beyond the end of the intervention period make it difficult to draw conclusions about the long‐term effectiveness of telerehabilitation. Despite that, the studies included in this review of primary pulmonary rehabilitation with follow‐up beyond the end of the intervention did not demonstrate any difference between telerehabilitation and centre‐based pulmonary rehabilitation (Hansen 2020; Holland 2017; Maltais 2008; Stickland 2011) or with no rehabilitation control (Lahham 2020) in the medium‐term (up to six months post‐intervention) or longer‐term (more than six months after completion of the intervention).
No included studies in this review assessed the effect of telerehabilitation compared to inpatient rehabilitation. Furthermore, this review did not include studies of individuals during or immediately after experiencing an exacerbation of their respiratory disease. The timing and nature of pulmonary rehabilitation delivered during and immediately following a respiratory exacerbation in COPD is controversial (Holland 2014), and compounded by extremely low uptake rate of outpatient pulmonary rehabilitation services post discharge (Spitzer 2019); despite evidence that pulmonary rehabilitation commenced within two weeks of hospital discharge can reduce the likelihood of readmission (Puhan 2016). Randomised controlled trials examining if telerehabilitation is safe and effective if used to deliver pulmonary rehabilitation services in the period early post respiratory exacerbation are required.
Quality of the evidence
A number of potential sources of bias were identified in this review. Three included studies were of CCTs. The overall risk of bias for these CCTs ranged from moderate to critical, with data from these studies not contributing to meta‐analyses and forest plots, but rather included as a narrative synthesis. Due to the nature of the intervention, and an inability to blind participants or personnel delivering the intervention, all included RCTs were judged to be at high risk of bias for performance bias. Blinding of outcome assessors may help to overcome this issue, but this was only reported in six of the RCTs (Bernocchi 2018; Bourne 2017; Hansen 2020; Holland 2017; Lahham 2020; Tsai 2017). Data that could be pooled for meta‐analysis were usually limited to those of two studies, and four studies at most. Studies of telerehabilitation which only include participants who have access to or are familiar with the relevant technology may also pose a risk of bias for the reported outcomes.
Using GRADE, we judged review outcomes to provide moderate‐certainty evidence (6MWD; CAT) or low‐certainty evidence (all other graded outcomes). Performance bias and selective reporting in included studies contributed to downgrading for risk of bias. We also downgraded for imprecision because of the small numbers of included studies and participants, and for inconsistency due to heterogeneity in telerehabilitation models.
Potential biases in the review process
All data were extracted independently by two review authors, and discrepancies were resolved through discussion. 'Risk of bias' ratings were also completed independently by two review authors. Studies that were published only in abstract form were eligible for inclusion, as a means to ensure that we captured all available trials. However, despite attempts to contact the authors of potentially eligible abstracts, additional data were often not available. In addition, we had variable success in obtaining additional details from authors of full‐text papers, where clarification of details was required. Of note, three studies included in this review were conducted by authors of this review. Where review authors were also included study authors, independent review authors undertook data extraction and assessment of risk of bias.
Agreements and disagreements with other studies or reviews
Our review extends results of a previous systematic review of telerehabilitation for patients with cardiopulmonary disease, which assessed home‐based exercise training delivered using telerehabilitation, and reported no difference between telerehabilitation and other exercise rehabilitation models in terms of exercise capacity and quality of life (Hwang 2015). In the review by Hwang and colleagues, only two included studies were of individuals with pulmonary disease alone, and a meta‐analysis was not able to be performed. Similar to our findings, there was the potential for higher adherence rates with telerehabilitation, but this was variable. Likewise, a systematic review of cardiac and pulmonary rehabilitation delivered via telerehabilitation, compared to usual centre‐based rehabilitation, reported similar improvements between groups in the one included study of pulmonary rehabilitation (Chan 2016). A common feature of these previous reviews and the current review of telerehabilitation in chronic respiratory disease is the limited number of included studies, and relatively small sample sizes, indicating the ongoing need for investigation and evidence of effect in this rapidly expanding field of healthcare.

Study flow diagram.

Risk of bias summary: review authors' judgements about each risk of bias item for each included study.

Risk of bias graph: review authors' judgements about each risk of bias item presented as percentages across all included studies.

Forest plot of comparison: 1 Telerehabilitation vs Centre‐based (outpatient) pulmonary rehabilitation, outcome: 1.1 Outcome 1 Exercise capacity ‐ 6minute walk test distance at end intervention.

Forest plot of comparison: 1 Telerehabilitation vs Centre‐based (outpatient) pulmonary rehabilitation, outcome: 1.8 Outcome 3 Dyspnoea ‐ Change in CRQ Dyspnoea domain at end intervention.

In the control group 70 people out of 100 completed treatment over 6 to 12 weeks, compared to 93 (95% CI 80 to 96) out of 100 for the active treatment group.

Forest plot of comparison: 3 Telerehabilitation vs no rehabilitation control, outcome: 3.1 Outcome 1 Exercise capacity ‐ 6minute walk distance at end intervention.

Comparison 1: Telerehabilitation vs Centre‐based (outpatient) pulmonary rehabilitation, Outcome 1: Outcome 1 Exercise capacity ‐ 6minute walk test distance at end intervention

Comparison 1: Telerehabilitation vs Centre‐based (outpatient) pulmonary rehabilitation, Outcome 2: Outcome 1 Exercise capacity ‐ Change in endurance shuttle walk test time (seconds) at end intervention

Comparison 1: Telerehabilitation vs Centre‐based (outpatient) pulmonary rehabilitation, Outcome 3: Outcome 1 Exercise capacity ‐ change in endurance cycle time at end intervention

Comparison 1: Telerehabilitation vs Centre‐based (outpatient) pulmonary rehabilitation, Outcome 4: Outcome 1 Exercise capacity ‐ Peak watts on CPET at end intervention

Comparison 1: Telerehabilitation vs Centre‐based (outpatient) pulmonary rehabilitation, Outcome 5: Outcome 1 Exercise capacity ‐ Change in 30 sec STS repetitions at end intervention

Comparison 1: Telerehabilitation vs Centre‐based (outpatient) pulmonary rehabilitation, Outcome 6: Outcome 1 Exercise Capacity ‐ Long term (>6months) change in 6MWD from baseline to end followup

Comparison 1: Telerehabilitation vs Centre‐based (outpatient) pulmonary rehabilitation, Outcome 7: Outcome 3 Dyspnoea ‐ MMRC at end intervention

Comparison 1: Telerehabilitation vs Centre‐based (outpatient) pulmonary rehabilitation, Outcome 8: Outcome 3 Dyspnoea ‐ Change in CRQ Dyspnoea domain at end intervention

Comparison 1: Telerehabilitation vs Centre‐based (outpatient) pulmonary rehabilitation, Outcome 9: Outcome 3 Dyspnoea ‐ Long term (>6 months) change in CRQ Dyspnoea score from baseline to end followup

Comparison 1: Telerehabilitation vs Centre‐based (outpatient) pulmonary rehabilitation, Outcome 10: Outcome 4 Quality of life ‐ SGRQ total score at end intervention

Comparison 1: Telerehabilitation vs Centre‐based (outpatient) pulmonary rehabilitation, Outcome 11: Outcome 4 Quality of life ‐ Change in SGRQ symptom score at end intervention

Comparison 1: Telerehabilitation vs Centre‐based (outpatient) pulmonary rehabilitation, Outcome 12: Outcome 4 Quality of life ‐ Change in SGRQ activity score at end intervention

Comparison 1: Telerehabilitation vs Centre‐based (outpatient) pulmonary rehabilitation, Outcome 13: Outcome 4 Quality of life ‐ Change in SGRQ impact score at end intervention

Comparison 1: Telerehabilitation vs Centre‐based (outpatient) pulmonary rehabilitation, Outcome 14: Outcome 4 Quality of life ‐ CAT score at end intervention

Comparison 1: Telerehabilitation vs Centre‐based (outpatient) pulmonary rehabilitation, Outcome 15: Outcome 4 Quality of life ‐ Change in CRQ Dyspnoea domain at end intervention

Comparison 1: Telerehabilitation vs Centre‐based (outpatient) pulmonary rehabilitation, Outcome 16: Outcome 4 Quality of life ‐ Change in CRQ Fatigue domain at end intervention

Comparison 1: Telerehabilitation vs Centre‐based (outpatient) pulmonary rehabilitation, Outcome 17: Outcome 4 Quality of life ‐ Change in CRQ Emotion domain at end intervention

Comparison 1: Telerehabilitation vs Centre‐based (outpatient) pulmonary rehabilitation, Outcome 18: Outcome 4 Quality of life ‐ Change in CRQ Mastery domain at end intervention

Comparison 1: Telerehabilitation vs Centre‐based (outpatient) pulmonary rehabilitation, Outcome 19: Outcome 4 Quality of life ‐ Change in CCQ Function domain at end intervention

Comparison 1: Telerehabilitation vs Centre‐based (outpatient) pulmonary rehabilitation, Outcome 20: Outcome 4 Quality of life ‐ Change in CCQ Mental domain at end intervention

Comparison 1: Telerehabilitation vs Centre‐based (outpatient) pulmonary rehabilitation, Outcome 21: Outcome 4 Quality of life ‐ Change in CCQ Symptom domain at end intervention

Comparison 1: Telerehabilitation vs Centre‐based (outpatient) pulmonary rehabilitation, Outcome 22: Outcome 4 Quality of life ‐ Change in CCQ total score at end intervention

Comparison 1: Telerehabilitation vs Centre‐based (outpatient) pulmonary rehabilitation, Outcome 23: Outcome 4 Quality of life ‐ Change in EQ‐5D‐VAS score at end intervention

Comparison 1: Telerehabilitation vs Centre‐based (outpatient) pulmonary rehabilitation, Outcome 24: Outcome 4 Quality of Life ‐ Long term (>6 months) change in CRQ Dyspnoea score from baseline to end followup

Comparison 1: Telerehabilitation vs Centre‐based (outpatient) pulmonary rehabilitation, Outcome 25: Outcome 4 Quality of Life ‐ Long term (>6 months) change in CRQ Fatigue score from baseline to end followup

Comparison 1: Telerehabilitation vs Centre‐based (outpatient) pulmonary rehabilitation, Outcome 26: Outcome 4 Quality of Life ‐ Long term (>6 months) change in CRQ Emotion score from baseline to end followup

Comparison 1: Telerehabilitation vs Centre‐based (outpatient) pulmonary rehabilitation, Outcome 27: Outcome 4 Quality of Life ‐ Long term (>6 months) change in CRQ Mastery score from baseline to end followup

Comparison 1: Telerehabilitation vs Centre‐based (outpatient) pulmonary rehabilitation, Outcome 28: Outcome 5 Completion of the intervention

Comparison 1: Telerehabilitation vs Centre‐based (outpatient) pulmonary rehabilitation, Outcome 29: Outcome 6 Anxiety/Depression ‐ Change in HADS Anxiety score at end intervention

Comparison 1: Telerehabilitation vs Centre‐based (outpatient) pulmonary rehabilitation, Outcome 30: Outcome 6 Anxiety/Depression ‐ Change in HADS Depression score at end intervention

Comparison 1: Telerehabilitation vs Centre‐based (outpatient) pulmonary rehabilitation, Outcome 31: Outcome 6 Anxiety/Depression ‐ Long term (>6 months) change in HADS Anxiety score from baseline to end followup

Comparison 1: Telerehabilitation vs Centre‐based (outpatient) pulmonary rehabilitation, Outcome 32: Outcome 6 Anxiety/Depression ‐ Long term (>6 months) change in HADS Depression score from baseline to end followup

Comparison 1: Telerehabilitation vs Centre‐based (outpatient) pulmonary rehabilitation, Outcome 33: Outcome 7 Physical activity ‐ Change in MVPA time (minutes/day) at end intervention

Comparison 1: Telerehabilitation vs Centre‐based (outpatient) pulmonary rehabilitation, Outcome 34: Outcome 7 Physical activity ‐ Sedentary time (minutes/day) at end intervention

Comparison 1: Telerehabilitation vs Centre‐based (outpatient) pulmonary rehabilitation, Outcome 35: Outcome 7 Physical activity ‐ Change in steps/day at end intervention

Comparison 1: Telerehabilitation vs Centre‐based (outpatient) pulmonary rehabilitation, Outcome 36: Outcome 7 Physical Activity ‐ Change in total daily Energy Expenditure (k/cal) at end intervention

Comparison 1: Telerehabilitation vs Centre‐based (outpatient) pulmonary rehabilitation, Outcome 37: Outcome 7 Physical activity ‐ Light physical activity time (minutes)/day at end intervention

Comparison 1: Telerehabilitation vs Centre‐based (outpatient) pulmonary rehabilitation, Outcome 38: Outcome 7 Physical Activity ‐ Lifestyle physical activity time (minutes)/day at end intervention

Comparison 1: Telerehabilitation vs Centre‐based (outpatient) pulmonary rehabilitation, Outcome 39: Outcome 7 Physical Activity ‐ Moderate physical activity time (minutes)/day at end intervention

Comparison 1: Telerehabilitation vs Centre‐based (outpatient) pulmonary rehabilitation, Outcome 40: Outcome 7 Physical activity ‐ Change in time active (minutes) at end intervention

Comparison 1: Telerehabilitation vs Centre‐based (outpatient) pulmonary rehabilitation, Outcome 41: Outcome 8 Health care utilisation ‐ Respiratory related hospitalisation

Comparison 3: Telerehabilitation vs no rehabilitation control, Outcome 1: Outcome 1 Exercise capacity ‐ 6minute walk distance at end intervention

Comparison 3: Telerehabilitation vs no rehabilitation control, Outcome 2: Outcome 1 Exercise capacity ‐ Peak watts on CPET at end intervention

Comparison 3: Telerehabilitation vs no rehabilitation control, Outcome 3: Outcome 1 Exercise capacity ‐ Change in ISWT distance at end intervention

Comparison 3: Telerehabilitation vs no rehabilitation control, Outcome 4: Outcome 1 Exercise capacity ‐ Change in ESWT time at end of intervention

Comparison 3: Telerehabilitation vs no rehabilitation control, Outcome 5: Outcome 3 Dyspnoea ‐ Change in CRQ Dyspnoea domain at end intervention

Comparison 3: Telerehabilitation vs no rehabilitation control, Outcome 6: Outcome 3 Dyspnoea ‐ Change in exercise isotime breathlessness score at end intervention

Comparison 3: Telerehabilitation vs no rehabilitation control, Outcome 7: Outcome 3 Dyspnoea ‐ MMRC at end intervention

Comparison 3: Telerehabilitation vs no rehabilitation control, Outcome 8: Outcome 4 Quality of life ‐ SGRQ total score at end intervention

Comparison 3: Telerehabilitation vs no rehabilitation control, Outcome 9: Outcome 4 Quality of life ‐ CAT score at end intervention

Comparison 3: Telerehabilitation vs no rehabilitation control, Outcome 10: Outcome 4 Quality of life ‐ Change in CRQ total score at end intervention

Comparison 3: Telerehabilitation vs no rehabilitation control, Outcome 11: Outcome 4 Quality of life ‐ Change in CRQ Dyspnoea domain at end intervention

Comparison 3: Telerehabilitation vs no rehabilitation control, Outcome 12: Outcome 4 Quality of life ‐ Change in CRQ Fatigue domain at end intervention

Comparison 3: Telerehabilitation vs no rehabilitation control, Outcome 13: Outcome 4 Quality of life ‐ Change in CRQ Emotion domain at end intervention

Comparison 3: Telerehabilitation vs no rehabilitation control, Outcome 14: Outcome 4 Quality of life ‐ Change in CRQ Mastery domain at end intervention

Comparison 3: Telerehabilitation vs no rehabilitation control, Outcome 15: Outcome 4 Quality of life ‐ Change in MLHFQ at end intervention

Comparison 3: Telerehabilitation vs no rehabilitation control, Outcome 16: Outcome 5 Anxiety/Depression ‐ Change in HADS Anxiety score at end intervention

Comparison 3: Telerehabilitation vs no rehabilitation control, Outcome 17: Outcome 5 Anxiety/Depression ‐ Change in HADS Depression score at end interveniton

Comparison 3: Telerehabilitation vs no rehabilitation control, Outcome 18: Outcome 6 Physical activity ‐ Change in total Energy Expenditure (kcal)/day at end intervention

Comparison 3: Telerehabilitation vs no rehabilitation control, Outcome 19: Outcome 6 Physical activity ‐ Change in steps/day at end intervention

Comparison 3: Telerehabilitation vs no rehabilitation control, Outcome 20: Outcome 6 Physical activity ‐ Sedentary time (minutes)/day at end intervention

Comparison 3: Telerehabilitation vs no rehabilitation control, Outcome 21: Outcome 6 Physical activity ‐ Light physical activity time (minutes)/day at end intervention

Comparison 3: Telerehabilitation vs no rehabilitation control, Outcome 22: Outcome 6 Physical activity ‐ Lifestyle physical activity time (minutes)/day at end intervention

Comparison 3: Telerehabilitation vs no rehabilitation control, Outcome 23: Outcome 6 Physical activity ‐ Moderate intensity physical activity time (minutes)/day at end intervention

Comparison 3: Telerehabilitation vs no rehabilitation control, Outcome 24: Outcome 6 Physical activity ‐ Change in Vigorous physical activity time (minutes)/day at end intervention

Comparison 3: Telerehabilitation vs no rehabilitation control, Outcome 25: Outcome 6 Physical activity ‐ Change in Very Vigorous physical activity time (minutes)/day at end intervention

Comparison 3: Telerehabilitation vs no rehabilitation control, Outcome 26: Outcome 6 Physical activity ‐ Change in number sedentary bouts/day at end rehabilitation

Comparison 3: Telerehabilitation vs no rehabilitation control, Outcome 27: Outcome 6 Physical activity ‐ Change in time spent in sedentary bouts minutes/day at end rehabilitation

Comparison 3: Telerehabilitation vs no rehabilitation control, Outcome 28: Outcome 6 Physical activity ‐ Change in moderate‐vigorous physical activity time minutes/day at end rehabilitation

Comparison 3: Telerehabilitation vs no rehabilitation control, Outcome 29: Outcome 6 Physical activity ‐ Change in number of bouts moderate‐vigorous physical activity/day at end rehabilitation

Comparison 3: Telerehabilitation vs no rehabilitation control, Outcome 30: Outcome 6 Physical activity ‐ Change in time spent in moderate‐vigorous bouts, minutes/day at end rehabilitation

Comparison 3: Telerehabilitation vs no rehabilitation control, Outcome 31: Outcome 6 Physical activity ‐ Change in metabolic equivalents (METs)/day at end rehabilitation

Comparison 3: Telerehabilitation vs no rehabilitation control, Outcome 32: Outcome 7 ‐ Health care utilisation
| Telerehabilitation compared to centre‐based (outpatient) pulmonary rehabilitation for chronic respiratory disease | ||||||
| Patient or population: Chronic respiratory disease | ||||||
| Outcomes | Anticipated absolute effects* (95% CI) | Relative effect | № of participants | Certainty of the evidence | Comments | |
|---|---|---|---|---|---|---|
| Risk with centre‐based (outpatient) pulmonary rehabilitation | Risk with telerehabilitation | |||||
| Primary rehabilitation | ||||||
| Exercise capacity ‐ | The change in 6MWD in the control groups ranged from 11 m to 29 m | Mean change in 6MWD was 0.06 mhigher in the telerehabilitation groups | MD 0.06 (‐10.82 to 10.94 | 556 | ⊕⊕⊕⊝ | |
| Breathlessness ‐ CRQ dyspnoea domain | The mean change in CRQ dyspnoea in the control groups was 0.7 points | The mean change in CRQ dyspnoea was 0.13 points higher in the telerehabilitation groups | MD 0.13 | 394 | ⊕⊕⊝⊝ | |
| Quality of life ‐ SGRQ Lower scores indicating better quality of life | The change in SGRQ in the control groups ranged from ‐6.3 to 1.6 points | The mean change in SGRQ score was 1.3 points lower in the telerehabilitation groups | MD ‐1.26 | 274 | ⊕⊕⊝⊝ | The MCID for the SGRQ is 4 points |
| Quality of life ‐ CAT | The change in CAT in the control groups ranged from ‐1.1 to ‐0.3 points | The mean change in CAT score was 1.4 points lower in the telerehabilitation groups | MD 1.37 | 224 | ⊕⊕⊕⊝ | |
| *The risk in the intervention group (and its 95% confidence interval) is based on the assumed risk in the comparison group and the relative effect of the intervention (and its 95% CI). | ||||||
| GRADE Working Group grades of evidence | ||||||
| 1High risk of bias for performance bias 2High risk of bias for performance bias and possibly reporting bias 3Risk of imprecision due to width of confidence intervals 4Risk of inconsistency due to limited overlap of confidence intervals | ||||||
| Telerehabilitation compared to no rehabilitation control for chronic respiratory disease | ||||||
| Patient or population: Chronic respiratory disease | ||||||
| Outcomes | Anticipated absolute effects* (95% CI) | Relative effect | № of participants | Certainty of the evidence | Comments | |
|---|---|---|---|---|---|---|
| Risk with no rehabilitation control | Risk with telerehabilitation | |||||
| Primary rehabilitation | ||||||
| Exercise capacity ‐ 6MWD (m) | The mean change in 6MWD in the control groups was 10 m | The mean change in the telerehabilitation groups was 22 m higher | MD 22.17 | 94 | ⊕⊕⊝⊝ | |
| Breathlessness ‐ CRQ dyspnoea domain | The mean change in CRQ dyspnoea in the control groups was 0.6 points | The mean change in the telerehabilitation groups was 2 points higher | MD 1.97 | 94 | ⊕⊕⊝⊝ | This difference was measured using a maximum score of 35 on the CRQ scale, so would be equivalent to a mean difference of 0.06 units on a 7‐point scale. |
| Quality of life ‐ CRQ total score | The mean change in CRQ total score in the control groups was 3.3 points | The mean change in the telerehabilitation groups was 7 points higher | MD 6.90 | 94 | ⊕⊕⊝⊝ | This difference was measured using a maximum score of 140 on the CRQ scale, so would be equivalent to a mean difference of 0.345 units on a 7‐point scale. |
| Quality of life ‐ CRQ dyspnoea domain | The mean change in CRQ dyspnoea domain in the control groups was 0.6 points | The mean change in the telerehabilitation groups was 2 points higher | MD 1.97 | 94 | ⊕⊕⊝⊝ | |
| Maintenance rehabilitation | ||||||
| Exercise capacity ‐ 6MWD (m) | The change in 6MWD in the control groups ranged from ‐45 to ‐15 m | The mean change in the maintenance telerehabilitation groups was 78 m higher | MD 78.10 | 209 | ⊕⊕⊝⊝ | |
| Dyspnoea ‐ mMRC | The change in mMRC in the control groups ranged from 0.07 to 0.9 points | The mean change in the maintenance telerehabilitation groups was 0.86points lower | MD ‐0.86, 95% CI ‐2.10 to 0.37; participants ) | 189 | ⊕⊝⊝⊝ | I2 = 97% |
| Quality of life ‐ CAT | The change in CAT in the control groups ranged from 1.6 to 5.1 points | The mean change in the maintenance telerehabilitation groups was 7 points lower | MD ‐7.34 | 189 | ⊕⊝⊝⊝ | |
| *The risk in the intervention group (and its 95% confidence interval) is based on the assumed risk in the comparison group and the relative effect of the intervention (and its 95% CI). | ||||||
| GRADE Working Group grades of evidence | ||||||
| 1High risk of bias for performance bias 2Risk of imprecision due to width of confidence intervals 3High risk of bias for performance bias and detection bias 4Risk of inconsistency due to high degree of heterogeneity | ||||||
| Study | Intervention technology | Reported issues |
|---|---|---|
| Hub and spoke telerehabilitation using videoconferencing (Polycom Real Presence Group 500 Video Conferencing System and Samsung DM65E‐BR interactive screens, installed by Comcen). | The videoconferencing connection was lost in two out of 452 sessions, and sites were reconnected by redialing. Some participants had difficulty hearing a presentation in an early session which was resolved by microphone replacement and the closing of curtains to reduce echo. | |
| In home telerehabilitation using video conferencing software installed on a single touch screen. | Major technical issues leading to cancellation and rescheduling of group sessions 2 of 360 group sessions. Minor technical issues (i.e., sound artefacts, screen freezes) not Individual patient cancellation caused | |
| In home telerehabilitation using video conferencing and a tablet computer | Out of a total of 197 exercise training sessions there were 24 technical issues (12%) related to the use of technology (e.g. poor internet connection). |
| Study: Barbaren‐Garcia 2014 (Barcelona and Athens) | ||
|---|---|---|
| ROBINS‐I domain | Risk of Bias | Description |
| Bias due to confounding | Serious | Confounding associated with country, socioeconomic status and health system inherently unable to be controlled for. Different components to information communication technology (ICT) support in both sub‐studies. |
| Bias in selection of participants | Critical | Patients were allocated to the intervention or control group depending on availability of mobile phones with wireless sensors (Barcelona). Control group assessed first and afterward the intervention group due to delays in deployment of technological platform (Athens) |
| Bias in classification of interventions | Serious | Baseline cardiopulmonary rehabilitation and intervention differed between countries, however comparisons were not made between countries. |
| Bias due to deviations from intended interventions | Serious | Unable to determine if study participants adhered to the intervention; much larger drop out in the control group than intervention group ‐ authors proposed this is due to issues with ICT in 54% of cases and access (travel) in another 25% (with proposed reason for dropout only noted for Barcelona study group) |
| Bias due to missing data | Serious | Large losses to follow up (47% Barcelona, 56% Athens) from the control groups. Reasons for loss to follow up from intervention groups not stated. |
| Bias in measurement of outcomes | Moderate | Standard tests common across groups and study sites, but unclear if outcome assessors blind. Much longer follow up for Barcelona study (mean (SD) 22 (12) months vs 12 months) |
| Bias in selection of the reported result | Moderate | Pre and post data presented for Barcelona group, change data presented for Athens group. SGRQ total and activity domain only presented for Barcelona group, component of SGRQ reported for Athens unclear (change data only). |
| Overall bias | Critical | |
| Study: Knox 2019 | ||
| ROBINS‐I domain | Risk of Bias | Description |
| Bias due to confounding | Serious | Socio‐economic status (regional vs metropolitan) unable to be accounted for. May favour control group. |
| Bias in selection of participants | Serious | Selection into the study was on the basis of the intervention and this was unable to be controlled for in the analysis. |
| Bias in classification of interventions | Low | Intervention groups were clearly defined. |
| Bias due to deviations from intended interventions | Moderate | Co‐interventions balanced across groups (education delivered via videoconference from Hub site in real time). Hub staff were able to travel to Spoke site at their discretion if deemed more support was needed. This protocol deviation only impacted Spoke intervention sites and impact on outcomes is not able to be accounted for. |
| Bias due to missing data | No information | No information or insufficient information is reported about missing data. Reasons for missing data are not described. Numbers of individuals who completed the end intervention assessment are not reported in the paper. Only complete data set outcomes are reported for ISWT ‐ other outcomes unclear (author communication) |
| Bias in measurement of outcomes | Moderate | Standardised assessments used (ISWT, CAT, HADS, MRC), but unclear if assessors were aware of intervention |
| Bias in selection of the reported result | No information | There is too little information to make a judgement |
| Overall bias | Serious | |
| Study: Stickland 2011 | ||
| ROBINS‐I domain | Risk of Bias | Description |
| Bias due to confounding | Serious | Socio‐economic status (regional vs metropolitan) unable to be accounted for. May favour control group. |
| Bias in selection of participants | Low | All enrolled participants had confirmed diagnosis of COPD. Inclusion and exclusion criteria applied equally across both groups. |
| Bias in classification of interventions | Low | Intervention groups were clearly defined and information to define characteristics of groups presented at the start of the intervention (baseline characteristics). Classification of intervention based on geography |
| Bias due to deviations from intended interventions | Low | Co‐interventions balanced across group. Average number of sessions attended similar in both intervention (telehealth average 12.6 sessions) and control (standard pulmonary rehabilitation average 13.2 sessions) |
| Bias due to missing data | Moderate | High follow up and imputation analysis at end intervention; but significant loss to follow up data at 6‐months and unable to perform imputation analysis |
| Bias in measurement of outcomes | Moderate | Standardised assessments used (12min walk test and SGRQ), but unclear if assessors were aware of intervention |
| Bias in selection of the reported result | Low | All outcome measures reported appropriately including total score and all domain scores of the SGRQ |
| Overall bias | Moderate | |
| CAT: COPD assessment test; COPD: chronic obstructive pulmonary disease; HADS: Hospital Anxiety and Depression Scale;ISWT: incremental shuttle walk test; MRC: medical research council dyspnoea scale; SD: standard deviation; SGRQ: St George's Respiratory Questionnaire. | ||
| Study | Adverse events details |
|---|---|
| Not recorded as an outcome or reported. | |
| Not recorded as an outcome or reported. | |
| PROTOCOL:
PAPER:
| |
|
| |
| PROTOCOL:
PAPER:
| |
|
| |
|
| |
|
| |
| Not recorded as an outcome or reported. | |
| Not recorded as an outcome or reported. | |
|
| |
| Definition of adverse event not specified. Reasons for patient dropout that could be considered adverse event detailed in Table 4 (PAPER).
| |
| Not recorded as an outcome or reported. | |
|
| |
|
| |
| Abbreviations: AE, adverse event; COPD, chronic obstructive pulmonary disease; HBP, home‐based program; PR, pulmonary rehabilitation; PTR, pulmonary tele‐rehabilitation. | |
| Study | Comparison | Definition for Adherence/Completion | Result |
|---|---|---|---|
| 3 (maintenance) | Not defined | Not reported | |
| 3 (maintenance) | Not defined |
| |
| 3 (maintenance) | Not defined |
| |
| 1 | Not defined |
| |
| 1 | Reached stage 3 or above of the web program, achieving 75% of the program |
| |
| 1 | Undertaking a minimum of 70% of the planned pulmonary rehabilitation sessions |
| |
| 1 | Undertaking a minimum of 70% of the planned pulmonary rehabilitation sessions |
| |
| 1 | Not defined |
| |
| 3 | Not defined | Not reported | |
| 3 | Not defined |
| |
| 1 | Completion of at least 60% (n = 15) of the exercise training sessions |
| |
| 1 | To attend a minimum of nine of the 16 sessions |
| |
| 3 | Not defined |
| |
| 3 | Compliance with telerehabilitation sessions was recorded by the number of completed exercise training sessions as prescribed out of a possible 24 sessions. |
| |
| 1, 3 (maintenance) | Adherence to home‐based maintenance tele‐rehabilitation and hospital‐based maintenance programs was assessed by the adherence rate (actual number of sessions/total expected number of sessions*100). |
| |
| Abbreviations: COPD, chronic obstructive pulmonary disease; n, number; SD, standard deviation. | |||
| Study | Comparison | Outcome | Timepoint | Telerehabilitation | Control |
|---|---|---|---|---|---|
| 3 | Use of healthcare resources. | During follow up intervention period | Barcelona (CCT): no difference between groups Athens (CCT): no data reported | ||
| 3 | No data reported | ||||
| 3 | Median time to event hospitalisation (any cause) or death | During the 4 month study period | 113.4 days | 104.7 days* | |
| Number of hospitalisations | During the 4 month study period | 21 (11 for cardiovascular diseases, 6 for respiratory diseases, 5 for other causes) | 37 (25 for cardiovascular diseases, 11 for respiratory diseases, 1 for other causes) | ||
| 1 | No data reported | ||||
| 1 | No data reported | ||||
| 1 | Number hospitalisations related to COPD | During intervention | 21 | 20 | |
| At 22 weeks follow‐up from baseline | 38 | 36 | |||
| Hospital days relating to all admissions, per admission/patient (median [IQR]) | At 22 weeks follow‐up from baseline | 2.3 [1.3 to 3.4] | 2.2 [1.1 to 4.7] | ||
| Hospital days relating to all admissions, total admissions/patient (median [IQR]) | At 22 weeks follow‐up from baseline | 11.8 [3.4 to 27.8] | 5.2 [3.2 to 13.8] | ||
| Hospital days for respiratory admissions, per admission/patient (median [IQR]) | At 22 weeks follow‐up from baseline | 2.4 [1.6 to 3.7] | 2.5 [1.2 to 5.2] | ||
| Hospital days for respiratory admissions, total admissions/patient (median [IQR]) | At 22 weeks follow‐up from baseline | 7.5 [3.1 to 14.4] | 5.2 [2.6 to 10.0] | ||
| Number of outpatient visits | At 10 weeks follow‐up from baseline | 113 | 744 | ||
| At 22 weeks follow‐up from baseline | 270 | 899 | |||
| 1 | Proportion with a hospital admission | During 12 months follow up after completion of intervention | n = 28 (35%) | n = 37 (43%) | |
| Proportion with a respiratory admission | During 12 months follow up after completion of intervention | n = 17 (21%) | n = 29 (34%)* | ||
| Number all cause hospital admissions per participant (median [IQR]) | During 12 months follow up after completion of intervention | 0 [0‐2] | 0 [0‐1.25] | ||
| Number all cause hospital days (median [IQR]) | During 12 months follow up after completion of intervention | 0 [0‐3.75] | 0 [0‐6.25] | ||
| Number of respiratory admissions (median [IQR]) | During 12 months follow up after completion of intervention | 0 [0‐0] | 0 [0‐1] | ||
| Number hospital days for respiratory cause (median [IQR]) | During 12 months follow up after completion of intervention | 0 [0‐0] | 0 [0‐5] | ||
| 3 | No data reported | ||||
| 3 | No data reported | ||||
| 3 | No data reported | ||||
| 1 | Number of COPD exacerbations | During intervention period | 9 | 14 | |
| During maintenance phase | 43 | 37 | |||
| Number of hospitalisations | During entire study period | 50 (not COPD related n = 31) | 51 (not COPD related n = 21) | ||
| 1 | Number of hospitalisations | During rehabilitation period | 3 | 3 | |
| Number of respiratory exacerbations | During rehabilitation period | 6 | 7 | ||
| 3 | Number of COPD exacerbations | During study intervention period | 33 | not applicable | |
| Number of hospitalisations, COPD | 4 | 5 | |||
| Number of hospitalisations, other | 4 | 2 | |||
| Emergency department visits for COPD | 5 | 5 | |||
| Length of stay, hospitalisation for COPD | 22 days | 36 days | |||
| Length of hospital stay for COPD, days (median [IQR]) | 5.5 [4.8‐6.3] | 7.0 [6.0‐7.0] | |||
| 3 | No data reported | ||||
| 1 (maintenance) | Acute exacerbation of COPD (mean±SD): | During 12 month maintenance intervention | 1.7±1.7 | 1.8 ± 1.4* | |
| 3 (maintenance) | 3.5 ± 1.8* | ||||
| 1 (maintenance) | Hospitalisation for acute exacerbation COPD (mean±SD): | 0.3±0.7 | 0.3 ± 0.6* | ||
| 3(maintenance) | 1.2 ± 1.7* | ||||
| 1 (maintenance) | Emergency department visits (mean±SD): | 0.5±0.9 | 1.8 ± 1.5* | ||
| 3 (maintenance) | 3.8 ± 1.5* | ||||
| Abbreviations: CCT, controlled clinical trial; COPD, chronic obstructive pulmonary disease; ED, emergency department; IQR, interquartile range; n, number; PR, pulmonary rehabilitation; SD, standard deviation. *between group difference P < 0.05 | |||||
| Outcome or subgroup title | No. of studies | No. of participants | Statistical method | Effect size |
| 1.1 Outcome 1 Exercise capacity ‐ 6minute walk test distance at end intervention Show forest plot | 5 | Mean Difference (IV, Random, 95% CI) | Subtotals only | |
| 1.1.1 Randomised controlled trials ‐ Primary rehabilitation | 4 | 556 | Mean Difference (IV, Random, 95% CI) | 0.06 [‐10.82, 10.94] |
| 1.1.2 Randomised controlled trials ‐ Maintenance rehabilitation | 1 | 97 | Mean Difference (IV, Random, 95% CI) | ‐7.30 [‐34.93, 20.33] |
| 1.2 Outcome 1 Exercise capacity ‐ Change in endurance shuttle walk test time (seconds) at end intervention Show forest plot | 1 | Mean Difference (IV, Fixed, 95% CI) | Totals not selected | |
| 1.2.1 Randomised controlled trials ‐ Primary rehabilitation | 1 | Mean Difference (IV, Fixed, 95% CI) | Totals not selected | |
| 1.3 Outcome 1 Exercise capacity ‐ change in endurance cycle time at end intervention Show forest plot | 1 | Mean Difference (IV, Fixed, 95% CI) | Totals not selected | |
| 1.3.1 Randomised controlled trials ‐ Primary rehabilitation | 1 | Mean Difference (IV, Fixed, 95% CI) | Totals not selected | |
| 1.4 Outcome 1 Exercise capacity ‐ Peak watts on CPET at end intervention Show forest plot | 1 | Mean Difference (IV, Fixed, 95% CI) | Totals not selected | |
| 1.4.1 Maintenance rehabilitation | 1 | Mean Difference (IV, Fixed, 95% CI) | Totals not selected | |
| 1.5 Outcome 1 Exercise capacity ‐ Change in 30 sec STS repetitions at end intervention Show forest plot | 1 | Mean Difference (IV, Fixed, 95% CI) | Totals not selected | |
| 1.5.1 Randomised controlled trials ‐ Primary rehabilitation | 1 | Mean Difference (IV, Fixed, 95% CI) | Totals not selected | |
| 1.6 Outcome 1 Exercise Capacity ‐ Long term (>6months) change in 6MWD from baseline to end followup Show forest plot | 2 | 308 | Mean Difference (IV, Random, 95% CI) | 1.40 [‐12.62, 15.43] |
| 1.7 Outcome 3 Dyspnoea ‐ MMRC at end intervention Show forest plot | 2 | Mean Difference (IV, Fixed, 95% CI) | Totals not selected | |
| 1.7.1 Randomised controlled trial ‐ Primary rehabilitation | 1 | Mean Difference (IV, Fixed, 95% CI) | Totals not selected | |
| 1.7.2 Randomised controlled trial ‐ Maintenance rehabilitation | 1 | Mean Difference (IV, Fixed, 95% CI) | Totals not selected | |
| 1.8 Outcome 3 Dyspnoea ‐ Change in CRQ Dyspnoea domain at end intervention Show forest plot | 3 | Mean Difference (IV, Random, 95% CI) | Subtotals only | |
| 1.8.1 Randomised controlled trials ‐ Primary rehabilitation | 3 | 426 | Mean Difference (IV, Random, 95% CI) | 0.13 [‐0.13, 0.40] |
| 1.9 Outcome 3 Dyspnoea ‐ Long term (>6 months) change in CRQ Dyspnoea score from baseline to end followup Show forest plot | 2 | 364 | Mean Difference (IV, Random, 95% CI) | 0.14 [‐0.08, 0.36] |
| 1.10 Outcome 4 Quality of life ‐ SGRQ total score at end intervention Show forest plot | 3 | Mean Difference (IV, Random, 95% CI) | Subtotals only | |
| 1.10.1 Randomised controlled trial ‐ Primary rehabilitation | 2 | 274 | Mean Difference (IV, Random, 95% CI) | ‐1.26 [‐3.97, 1.45] |
| 1.10.2 Randomised controlled trials ‐ Maintenance rehabilitation | 1 | 97 | Mean Difference (IV, Random, 95% CI) | 4.80 [‐2.63, 12.23] |
| 1.11 Outcome 4 Quality of life ‐ Change in SGRQ symptom score at end intervention Show forest plot | 1 | Std. Mean Difference (IV, Fixed, 95% CI) | Totals not selected | |
| 1.11.1 Randomised controlled trial ‐ Primary rehabilitation | 1 | Std. Mean Difference (IV, Fixed, 95% CI) | Totals not selected | |
| 1.12 Outcome 4 Quality of life ‐ Change in SGRQ activity score at end intervention Show forest plot | 1 | Std. Mean Difference (IV, Fixed, 95% CI) | Totals not selected | |
| 1.12.1 Randomised controlled trial ‐ Primary rehabilitation | 1 | Std. Mean Difference (IV, Fixed, 95% CI) | Totals not selected | |
| 1.13 Outcome 4 Quality of life ‐ Change in SGRQ impact score at end intervention Show forest plot | 1 | Mean Difference (IV, Fixed, 95% CI) | Totals not selected | |
| 1.13.1 Randomised controlled trial ‐ Primary rehabilitation | 1 | Mean Difference (IV, Fixed, 95% CI) | Totals not selected | |
| 1.14 Outcome 4 Quality of life ‐ CAT score at end intervention Show forest plot | 3 | Mean Difference (IV, Random, 95% CI) | Subtotals only | |
| 1.14.1 Randomised controlled trial ‐ Primary rehabilitation | 2 | 224 | Mean Difference (IV, Random, 95% CI) | ‐1.37 [‐3.10, 0.36] |
| 1.14.2 Maintenance rehabilitation | 1 | 97 | Mean Difference (IV, Random, 95% CI) | 1.20 [‐1.40, 3.80] |
| 1.15 Outcome 4 Quality of life ‐ Change in CRQ Dyspnoea domain at end intervention Show forest plot | 3 | Mean Difference (IV, Random, 95% CI) | Subtotals only | |
| 1.15.1 Randomised controlled trials ‐ Primary rehabilitation | 3 | 426 | Mean Difference (IV, Random, 95% CI) | 0.13 [‐0.13, 0.39] |
| 1.16 Outcome 4 Quality of life ‐ Change in CRQ Fatigue domain at end intervention Show forest plot | 2 | Mean Difference (IV, Random, 95% CI) | Subtotals only | |
| 1.16.1 Randomised controlled trials ‐ Primary rehabilitation | 2 | 364 | Mean Difference (IV, Random, 95% CI) | ‐0.03 [‐0.24, 0.18] |
| 1.17 Outcome 4 Quality of life ‐ Change in CRQ Emotion domain at end intervention Show forest plot | 2 | Mean Difference (IV, Random, 95% CI) | Subtotals only | |
| 1.17.1 Randomised controlled trials ‐ Primary rehabilitation | 2 | 364 | Mean Difference (IV, Random, 95% CI) | ‐0.02 [‐0.20, 0.16] |
| 1.18 Outcome 4 Quality of life ‐ Change in CRQ Mastery domain at end intervention Show forest plot | 2 | Mean Difference (IV, Random, 95% CI) | Subtotals only | |
| 1.18.1 Randomised controlled trials ‐ Primary rehabilitation | 2 | 364 | Mean Difference (IV, Random, 95% CI) | 0.03 [‐0.17, 0.23] |
| 1.19 Outcome 4 Quality of life ‐ Change in CCQ Function domain at end intervention Show forest plot | 1 | Mean Difference (IV, Fixed, 95% CI) | Totals not selected | |
| 1.19.1 Randomised controlled trials ‐ Primary rehabilitation | 1 | Mean Difference (IV, Fixed, 95% CI) | Totals not selected | |
| 1.20 Outcome 4 Quality of life ‐ Change in CCQ Mental domain at end intervention Show forest plot | 1 | Mean Difference (IV, Fixed, 95% CI) | Totals not selected | |
| 1.20.1 Randomised controlled trial ‐ Primary rehabilitation | 1 | Mean Difference (IV, Fixed, 95% CI) | Totals not selected | |
| 1.21 Outcome 4 Quality of life ‐ Change in CCQ Symptom domain at end intervention Show forest plot | 1 | Mean Difference (IV, Fixed, 95% CI) | Totals not selected | |
| 1.21.1 Randomised controlled trials ‐ Primary rehabilitation | 1 | Mean Difference (IV, Fixed, 95% CI) | Totals not selected | |
| 1.22 Outcome 4 Quality of life ‐ Change in CCQ total score at end intervention Show forest plot | 1 | Mean Difference (IV, Fixed, 95% CI) | Totals not selected | |
| 1.22.1 Randomised controlled trial ‐ Primary rehabilitation | 1 | Mean Difference (IV, Fixed, 95% CI) | Totals not selected | |
| 1.23 Outcome 4 Quality of life ‐ Change in EQ‐5D‐VAS score at end intervention Show forest plot | 1 | Mean Difference (IV, Fixed, 95% CI) | Totals not selected | |
| 1.23.1 Randomised controlled trials ‐ Primary rehabiliation | 1 | Mean Difference (IV, Fixed, 95% CI) | Totals not selected | |
| 1.24 Outcome 4 Quality of Life ‐ Long term (>6 months) change in CRQ Dyspnoea score from baseline to end followup Show forest plot | 2 | 364 | Mean Difference (IV, Random, 95% CI) | 0.14 [‐0.08, 0.36] |
| 1.25 Outcome 4 Quality of Life ‐ Long term (>6 months) change in CRQ Fatigue score from baseline to end followup Show forest plot | 2 | 364 | Mean Difference (IV, Random, 95% CI) | 0.02 [‐0.31, 0.35] |
| 1.26 Outcome 4 Quality of Life ‐ Long term (>6 months) change in CRQ Emotion score from baseline to end followup Show forest plot | 2 | 364 | Mean Difference (IV, Random, 95% CI) | 0.04 [‐0.13, 0.21] |
| 1.27 Outcome 4 Quality of Life ‐ Long term (>6 months) change in CRQ Mastery score from baseline to end followup Show forest plot | 2 | 364 | Mean Difference (IV, Random, 95% CI) | 0.09 [‐0.11, 0.30] |
| 1.28 Outcome 5 Completion of the intervention Show forest plot | 3 | Odds Ratio (M‐H, Fixed, 95% CI) | Subtotals only | |
| 1.28.1 Randomised controlled trials ‐ primary rehabilitation | 3 | 516 | Odds Ratio (M‐H, Fixed, 95% CI) | 5.36 [3.12, 9.21] |
| 1.29 Outcome 6 Anxiety/Depression ‐ Change in HADS Anxiety score at end intervention Show forest plot | 2 | Mean Difference (IV, Random, 95% CI) | Subtotals only | |
| 1.29.1 Randomised controlled trials ‐ Primary rehabilitation | 2 | 282 | Mean Difference (IV, Random, 95% CI) | ‐1.05 [‐1.76, ‐0.35] |
| 1.30 Outcome 6 Anxiety/Depression ‐ Change in HADS Depression score at end intervention Show forest plot | 2 | Mean Difference (IV, Random, 95% CI) | Subtotals only | |
| 1.30.1 Randomised controlled trial ‐ Primary rehabilitation | 2 | 282 | Mean Difference (IV, Random, 95% CI) | ‐0.36 [‐1.05, 0.34] |
| 1.31 Outcome 6 Anxiety/Depression ‐ Long term (>6 months) change in HADS Anxiety score from baseline to end followup Show forest plot | 1 | Mean Difference (IV, Random, 95% CI) | Totals not selected | |
| 1.32 Outcome 6 Anxiety/Depression ‐ Long term (>6 months) change in HADS Depression score from baseline to end followup Show forest plot | 1 | Mean Difference (IV, Random, 95% CI) | Totals not selected | |
| 1.33 Outcome 7 Physical activity ‐ Change in MVPA time (minutes/day) at end intervention Show forest plot | 1 | Mean Difference (IV, Fixed, 95% CI) | Totals not selected | |
| 1.33.1 Randomised controlled trial ‐ Primary rehabiliation | 1 | Mean Difference (IV, Fixed, 95% CI) | Totals not selected | |
| 1.34 Outcome 7 Physical activity ‐ Sedentary time (minutes/day) at end intervention Show forest plot | 3 | Mean Difference (IV, Random, 95% CI) | Subtotals only | |
| 1.34.1 Randomised controlled trial ‐ Primary rehabiliation | 2 | 192 | Mean Difference (IV, Random, 95% CI) | ‐8.57 [‐66.69, 49.54] |
| 1.34.2 Randomised controlled trials ‐ Maintenance rehabilitation | 1 | 97 | Mean Difference (IV, Random, 95% CI) | 34.00 [‐225.49, 293.49] |
| 1.35 Outcome 7 Physical activity ‐ Change in steps/day at end intervention Show forest plot | 2 | Mean Difference (IV, Random, 95% CI) | Subtotals only | |
| 1.35.1 Randomised controlled trial ‐ Primary rehabilitation | 2 | 192 | Mean Difference (IV, Random, 95% CI) | 387.09 [‐84.64, 858.81] |
| 1.36 Outcome 7 Physical Activity ‐ Change in total daily Energy Expenditure (k/cal) at end intervention Show forest plot | 1 | Mean Difference (IV, Fixed, 95% CI) | Totals not selected | |
| 1.36.1 Randomised controlled trial ‐ Primary rehabilitation | 1 | Mean Difference (IV, Fixed, 95% CI) | Totals not selected | |
| 1.37 Outcome 7 Physical activity ‐ Light physical activity time (minutes)/day at end intervention Show forest plot | 1 | Mean Difference (IV, Random, 95% CI) | Totals not selected | |
| 1.37.1 Randomised controlled trial ‐ Maintenance rehabiliation | 1 | Mean Difference (IV, Random, 95% CI) | Totals not selected | |
| 1.38 Outcome 7 Physical Activity ‐ Lifestyle physical activity time (minutes)/day at end intervention Show forest plot | 1 | Mean Difference (IV, Random, 95% CI) | Totals not selected | |
| 1.38.1 Randomised controlled trial ‐ Maintenance rehabiliation | 1 | Mean Difference (IV, Random, 95% CI) | Totals not selected | |
| 1.39 Outcome 7 Physical Activity ‐ Moderate physical activity time (minutes)/day at end intervention Show forest plot | 1 | Mean Difference (IV, Random, 95% CI) | Totals not selected | |
| 1.39.1 Randomised controlled trial ‐ Maintenance rehabiliation | 1 | Mean Difference (IV, Random, 95% CI) | Totals not selected | |
| 1.40 Outcome 7 Physical activity ‐ Change in time active (minutes) at end intervention Show forest plot | 1 | Mean Difference (IV, Random, 95% CI) | Totals not selected | |
| 1.40.1 Randomised controlled trial ‐ Primary rehabilitation | 1 | Mean Difference (IV, Random, 95% CI) | Totals not selected | |
| 1.41 Outcome 8 Health care utilisation ‐ Respiratory related hospitalisation Show forest plot | 3 | Odds Ratio (M‐H, Fixed, 95% CI) | Subtotals only | |
| 1.41.1 Randomised controlled trials ‐ Primary rehabilitation | 3 | 516 | Odds Ratio (M‐H, Fixed, 95% CI) | 0.65 [0.43, 0.99] |
| Outcome or subgroup title | No. of studies | No. of participants | Statistical method | Effect size |
| 3.1 Outcome 1 Exercise capacity ‐ 6minute walk distance at end intervention Show forest plot | 4 | Mean Difference (IV, Random, 95% CI) | Subtotals only | |
| 3.1.1 Randomised controlled trials ‐ Primary rehabilitation | 2 | 94 | Mean Difference (IV, Random, 95% CI) | 22.17 [‐38.89, 83.23] |
| 3.1.2 Maintenance rehabilitation | 2 | 209 | Mean Difference (IV, Random, 95% CI) | 78.10 [49.60, 106.60] |
| 3.2 Outcome 1 Exercise capacity ‐ Peak watts on CPET at end intervention Show forest plot | 1 | Mean Difference (IV, Fixed, 95% CI) | Totals not selected | |
| 3.2.1 Randomise controlled trial ‐ Maintenance rehabilitation | 1 | Mean Difference (IV, Fixed, 95% CI) | Totals not selected | |
| 3.3 Outcome 1 Exercise capacity ‐ Change in ISWT distance at end intervention Show forest plot | 1 | Mean Difference (IV, Fixed, 95% CI) | Totals not selected | |
| 3.3.1 Randomised controlled trial ‐ Primary rehabilitation | 1 | Mean Difference (IV, Fixed, 95% CI) | Totals not selected | |
| 3.4 Outcome 1 Exercise capacity ‐ Change in ESWT time at end of intervention Show forest plot | 1 | Mean Difference (IV, Fixed, 95% CI) | Totals not selected | |
| 3.4.1 Randomised controlled trial ‐ Primary rehabilitation | 1 | Mean Difference (IV, Fixed, 95% CI) | Totals not selected | |
| 3.5 Outcome 3 Dyspnoea ‐ Change in CRQ Dyspnoea domain at end intervention Show forest plot | 2 | Mean Difference (IV, Random, 95% CI) | Subtotals only | |
| 3.5.1 Randomised controlled trial ‐ Primary rehabilitation | 2 | 94 | Mean Difference (IV, Random, 95% CI) | 1.97 [‐1.07, 5.02] |
| 3.6 Outcome 3 Dyspnoea ‐ Change in exercise isotime breathlessness score at end intervention Show forest plot | 1 | Mean Difference (IV, Fixed, 95% CI) | Totals not selected | |
| 3.6.1 Randomised controlled trial ‐ Primary rehabilitation | 1 | Mean Difference (IV, Fixed, 95% CI) | Totals not selected | |
| 3.7 Outcome 3 Dyspnoea ‐ MMRC at end intervention Show forest plot | 3 | Mean Difference (IV, Random, 95% CI) | Subtotals only | |
| 3.7.1 Randomised controlled trial ‐ Primary rehabilitation | 1 | 58 | Mean Difference (IV, Random, 95% CI) | 0.00 [‐0.61, 0.61] |
| 3.7.2 Randomised controlled trial ‐ Maintenance rehabilitation | 2 | 189 | Mean Difference (IV, Random, 95% CI) | ‐0.86 [‐2.10, 0.37] |
| 3.8 Outcome 4 Quality of life ‐ SGRQ total score at end intervention Show forest plot | 1 | Mean Difference (IV, Fixed, 95% CI) | Totals not selected | |
| 3.8.1 Randomised controlled trial ‐Maintenance rehabilitation | 1 | Mean Difference (IV, Fixed, 95% CI) | Totals not selected | |
| 3.9 Outcome 4 Quality of life ‐ CAT score at end intervention Show forest plot | 3 | Mean Difference (IV, Random, 95% CI) | Subtotals only | |
| 3.9.1 Randomised controlled trial ‐ Primary rehabiliation | 1 | 36 | Mean Difference (IV, Random, 95% CI) | ‐4.00 [‐7.35, ‐0.65] |
| 3.9.2 Randomised controlled trial ‐ Maintenance rehabilitation | 2 | 189 | Mean Difference (IV, Random, 95% CI) | ‐7.34 [‐9.20, ‐5.48] |
| 3.10 Outcome 4 Quality of life ‐ Change in CRQ total score at end intervention Show forest plot | 2 | Mean Difference (IV, Random, 95% CI) | Subtotals only | |
| 3.10.1 Randomised controlled trial ‐ Primary rehabilitation | 2 | 94 | Mean Difference (IV, Random, 95% CI) | 6.90 [‐0.57, 14.36] |
| 3.11 Outcome 4 Quality of life ‐ Change in CRQ Dyspnoea domain at end intervention Show forest plot | 2 | Mean Difference (IV, Random, 95% CI) | Subtotals only | |
| 3.11.1 Randomised controlled trial ‐ Primary rehabilitation | 2 | 94 | Mean Difference (IV, Random, 95% CI) | 1.97 [‐1.07, 5.02] |
| 3.12 Outcome 4 Quality of life ‐ Change in CRQ Fatigue domain at end intervention Show forest plot | 2 | Mean Difference (IV, Random, 95% CI) | Subtotals only | |
| 3.12.1 Randomised controlled trial ‐ Primary rehabilitation | 2 | 94 | Mean Difference (IV, Random, 95% CI) | 2.30 [0.31, 4.30] |
| 3.13 Outcome 4 Quality of life ‐ Change in CRQ Emotion domain at end intervention Show forest plot | 2 | Mean Difference (IV, Random, 95% CI) | Subtotals only | |
| 3.13.1 Randomised controlled trial ‐ Primary rehabilitation | 2 | 94 | Mean Difference (IV, Random, 95% CI) | 2.43 [‐0.98, 5.85] |
| 3.14 Outcome 4 Quality of life ‐ Change in CRQ Mastery domain at end intervention Show forest plot | 2 | Mean Difference (IV, Random, 95% CI) | Subtotals only | |
| 3.14.1 Randomised controlled trial ‐ Primary rehabilitation | 2 | 94 | Mean Difference (IV, Random, 95% CI) | 0.30 [‐1.54, 2.14] |
| 3.15 Outcome 4 Quality of life ‐ Change in MLHFQ at end intervention Show forest plot | 1 | Mean Difference (IV, Fixed, 95% CI) | Totals not selected | |
| 3.15.1 Randomised controlled trial ‐ Maintenance rehabilitation | 1 | Mean Difference (IV, Fixed, 95% CI) | Totals not selected | |
| 3.16 Outcome 5 Anxiety/Depression ‐ Change in HADS Anxiety score at end intervention Show forest plot | 1 | Mean Difference (IV, Random, 95% CI) | Totals not selected | |
| 3.16.1 Randomised controlled trial ‐ Primary rehabilitation | 1 | Mean Difference (IV, Random, 95% CI) | Totals not selected | |
| 3.17 Outcome 5 Anxiety/Depression ‐ Change in HADS Depression score at end interveniton Show forest plot | 1 | Mean Difference (IV, Random, 95% CI) | Totals not selected | |
| 3.17.1 Randomised controlled trial ‐ Primary rehabilitation | 1 | Mean Difference (IV, Random, 95% CI) | Totals not selected | |
| 3.18 Outcome 6 Physical activity ‐ Change in total Energy Expenditure (kcal)/day at end intervention Show forest plot | 1 | Mean Difference (IV, Random, 95% CI) | Totals not selected | |
| 3.18.1 Randomised controlled trials ‐ Primary rehabilitation | 1 | Mean Difference (IV, Random, 95% CI) | Totals not selected | |
| 3.19 Outcome 6 Physical activity ‐ Change in steps/day at end intervention Show forest plot | 2 | Mean Difference (IV, Random, 95% CI) | Subtotals only | |
| 3.19.1 Randomised controlled trial ‐ Primary rehabilitation | 2 | 94 | Mean Difference (IV, Random, 95% CI) | 488.78 [‐142.84, 1120.40] |
| 3.20 Outcome 6 Physical activity ‐ Sedentary time (minutes)/day at end intervention Show forest plot | 3 | Mean Difference (IV, Random, 95% CI) | Subtotals only | |
| 3.20.1 Randomised controlled trial ‐ Primary rehabilitation | 2 | 94 | Mean Difference (IV, Random, 95% CI) | 42.44 [‐25.77, 110.66] |
| 3.20.2 Randomised controlled trial ‐ Maintenance rehabilitation | 1 | 97 | Mean Difference (IV, Random, 95% CI) | ‐29.00 [‐299.13, 241.13] |
| 3.21 Outcome 6 Physical activity ‐ Light physical activity time (minutes)/day at end intervention Show forest plot | 2 | Mean Difference (IV, Random, 95% CI) | Totals not selected | |
| 3.21.1 Randomised controlled trial ‐ Primary rehabilitation | 1 | Mean Difference (IV, Random, 95% CI) | Totals not selected | |
| 3.21.2 Randomised controlled trial ‐ Maintenance rehabilitation | 1 | Mean Difference (IV, Random, 95% CI) | Totals not selected | |
| 3.22 Outcome 6 Physical activity ‐ Lifestyle physical activity time (minutes)/day at end intervention Show forest plot | 1 | Mean Difference (IV, Random, 95% CI) | Totals not selected | |
| 3.22.1 Randomised controlled trial ‐ Maintenance rehabilitation | 1 | Mean Difference (IV, Random, 95% CI) | Totals not selected | |
| 3.23 Outcome 6 Physical activity ‐ Moderate intensity physical activity time (minutes)/day at end intervention Show forest plot | 2 | Mean Difference (IV, Random, 95% CI) | Totals not selected | |
| 3.23.1 Randomised controlled trial ‐ Primary rehabilitation | 1 | Mean Difference (IV, Random, 95% CI) | Totals not selected | |
| 3.23.2 Randomised controlled trial ‐ Maintenance rehabilitation | 1 | Mean Difference (IV, Random, 95% CI) | Totals not selected | |
| 3.24 Outcome 6 Physical activity ‐ Change in Vigorous physical activity time (minutes)/day at end intervention Show forest plot | 1 | Mean Difference (IV, Random, 95% CI) | Totals not selected | |
| 3.24.1 Randomised controlled trial ‐ Primary rehabilitation | 1 | Mean Difference (IV, Random, 95% CI) | Totals not selected | |
| 3.25 Outcome 6 Physical activity ‐ Change in Very Vigorous physical activity time (minutes)/day at end intervention Show forest plot | 1 | Mean Difference (IV, Random, 95% CI) | Totals not selected | |
| 3.25.1 Randomised controlled trial ‐ Primary rehabilitation | 1 | Mean Difference (IV, Random, 95% CI) | Totals not selected | |
| 3.26 Outcome 6 Physical activity ‐ Change in number sedentary bouts/day at end rehabilitation Show forest plot | 1 | Mean Difference (IV, Random, 95% CI) | Subtotals only | |
| 3.27 Outcome 6 Physical activity ‐ Change in time spent in sedentary bouts minutes/day at end rehabilitation Show forest plot | 1 | Mean Difference (IV, Random, 95% CI) | Subtotals only | |
| 3.28 Outcome 6 Physical activity ‐ Change in moderate‐vigorous physical activity time minutes/day at end rehabilitation Show forest plot | 1 | Mean Difference (IV, Random, 95% CI) | Subtotals only | |
| 3.29 Outcome 6 Physical activity ‐ Change in number of bouts moderate‐vigorous physical activity/day at end rehabilitation Show forest plot | 1 | Mean Difference (IV, Random, 95% CI) | Subtotals only | |
| 3.30 Outcome 6 Physical activity ‐ Change in time spent in moderate‐vigorous bouts, minutes/day at end rehabilitation Show forest plot | 1 | Mean Difference (IV, Random, 95% CI) | Subtotals only | |
| 3.31 Outcome 6 Physical activity ‐ Change in metabolic equivalents (METs)/day at end rehabilitation Show forest plot | 1 | Mean Difference (IV, Random, 95% CI) | Subtotals only | |
| 3.32 Outcome 7 ‐ Health care utilisation Show forest plot | 1 | Odds Ratio (M‐H, Fixed, 95% CI) | Totals not selected | |
| 3.32.1 Randomised controlled trials ‐ maintenance rehabilitation | 1 | Odds Ratio (M‐H, Fixed, 95% CI) | Totals not selected | |