Comparación directa de antibióticos profilácticos orales para la enfermedad pulmonar obstructiva crónica
Resumen
Antecedentes
La enfermedad pulmonar obstructiva crónica (EPOC; que incluye la bronquitis crónica y el enfisema) es una enfermedad respiratoria crónica que se caracteriza por la dificultad para respirar, la tos y las exacerbaciones recurrentes. La administración de antibióticos a largo plazo puede reducir la carga bacteriana y la inflamación en las vías respiratorias. Los estudios mostraron una reducción de las exacerbaciones con la administración de antibióticos en comparación con placebo en los pacientes con EPOC, aunque hay inquietudes en cuanto a la resistencia a los antibióticos y la seguridad.
Objetivos
Comparar la seguridad y la eficacia de diferentes clases de antibióticos (continuos, intermitentes o pulsátiles) para la profilaxis de las exacerbaciones en pacientes con EPOC.
Métodos de búsqueda
Se hicieron búsquedas en el registro de ensayos del Grupo Cochrane de Vías Respiratorias (Cochrane Airways Group) y en bibliografías de estudios relevantes. La última búsqueda bibliográfica se realizó el 6 de febrero de 2019.
Criterios de selección
Se seleccionaron los ensayos controlados aleatorizados (ECA) que compararon un antibiótico profiláctico con otro en pacientes con EPOC.
Obtención y análisis de los datos
Se utilizaron los métodos estándar Cochrane. Dos autores de la revisión independientes seleccionaron los estudios para inclusión, extrajeron los datos y evaluaron el riesgo de sesgo. Las discrepancias se resolvieron con la participación del tercer autor de la revisión.
Resultados principales
Se incluyeron dos ECA publicados en 2015 que incluían a un total de 391 participantes con una duración del tratamiento de 12 a 13 semanas. Un ECA comparó una quinolona (moxifloxacina pulsátil, durante cinco días cada cuatro semanas), con una tetraciclina (doxiciclina continua) o un macrólido (azitromicina intermitente).
El segundo ECA comparó una tetraciclina (doxiciclina continua) más un macrólido (roxitromicina continua), con roxitromicina (continua) sola.
Los ensayos reclutaron a participantes con una media de edad de 68 años y EPOC de gravedad moderada. Ambos ensayos incluyeron a participantes que habían presentado entre dos y cinco exacerbaciones uno o dos años antes. En un ensayo, el 17% de los pacientes habían utilizado corticosteroides inhalados de forma previa. En el otro estudio, todos los pacientes fueron positivos para Chlamydophilapneumoniae (C pneumoniae).
En general, la evidencia presentada se consideró de certeza muy baja, principalmente debido a la imprecisión, aunque también hubo inquietudes en cuanto a la falta de direccionalidad y la calidad metodológica de los estudios incluidos. Las medidas de resultado primarias para esta revisión incluyeron las exacerbaciones, la calidad de vida, la farmacorresistencia y los eventos adversos graves.
Macrólido + tetraciclina versus macrólido
No hubo diferencias claras entre los tratamientos en la mejoría en la calidad de vida según la evaluación del Chronic Respiratory Questionnaire (CRQ). La escala del CRQ varía de 0 a 10 y las puntuaciones mayores en la escala indican una mejor calidad de vida. Las subescalas del CRQ para la disnea (diferencia de medias [DM] 0,58; intervalo de confianza [IC] del 95%: ‐0,84 a 2,00; 187 participantes; evidencia de certeza muy baja), la fatiga (DM 0,02; IC del 95%: ‐1,08 a 1,12; 187 participantes; evidencia de certeza muy baja), la función emocional (DM ‐0,37; IC del 95%: ‐1,74 a 1,00; 187 participantes; evidencia de certeza muy baja), o el dominio (DM ‐0,79; IC del 95%: ‐1,86 a 0,28; 187 participantes; evidencia de certeza muy baja) a las 12 semanas. Para los eventos adversos graves, no se sabe si hubo una diferencia entre la roxitromicina y la doxiciclina combinadas versus la roxitromicina sola a las 48 semanas de seguimiento después del tratamiento activo de 12 semanas (odds ratio [OR] 1,00; IC del 95%: 0,52 a 1,93; 198 participantes; evidencia de certeza muy baja). Se informaron cinco muertes en el brazo de tratamiento combinado versus tres en el brazo de tratamiento único a las 48 semanas de seguimiento después del tratamiento activo de 12 semanas (OR 1,63; IC del 95%: 0,38 a 7,02; 198 participantes; evidencia de certeza muy baja).
Quinolona versus tetraciclina
No hubo diferencias claras entre la moxifloxacina y la doxiciclina en el número de participantes que presentaron una o más exacerbaciones (OR 0,44; IC del 95%: 0,14 a 1,38; 50 participantes, evidencia de certeza muy baja) a las 13 semanas. No se registraron efectos adversos graves ni muertes en los grupos de tratamiento. No se identificó evidencia para los otros resultados primarios.
Quinolona versus macrólido
No hubo diferencias claras entre la moxifloxacina y la azitromicina en el número de participantes que presentaron una o más exacerbaciones (OR 1,00; IC del 95%: 0,32 a 3,10; 50 participantes; evidencia de certeza muy baja) a las 13 semanas. No se registraron efectos adversos graves ni muertes en los grupos de tratamiento. No se identificó evidencia para los otros resultados primarios.
Macrólido versus tetraciclina
No hubo diferencias claras entre la azitromicina y la doxiciclina en el número de participantes que presentaron una o más exacerbaciones (OR 0,44; IC del 95%: 0,14 a 1,38; 50 participantes, evidencia de certeza muy baja) a las 13 semanas. No se registraron efectos adversos graves ni muertes en los grupos de tratamiento. No se identificó evidencia para los otros resultados primarios.
No se encontró evidencia de comparaciones directas para la repercusión de los antibióticos en la farmacorresistencia.
Conclusiones de los autores
No está claro a partir de la evidencia incluida en esta revisión si hay una diferencia en la eficacia o la seguridad entre las diferentes clases o regímenes con antibióticos profilácticos, administrados durante 12 a 13 semanas a los pacientes con EPOC. Aunque no se identificaron comparaciones directas de la resistencia a los antibióticos, aún existen inquietudes en cuanto a este tema. El tamaño de la muestra en esta revisión es pequeño y ambos estudios incluidos son de poca duración. Por lo tanto, hay una falta de certeza considerable en cuanto a los efectos observados y los efectos de diferentes antibióticos profilácticos requieren estudios de investigación adicionales.
PICO
Resumen en términos sencillos
Antibioticoterapia profiláctica en pacientes con enfermedad pulmonar obstructiva crónica (EPOC)
¿Qué es la EPOC?
La EPOC es una enfermedad común causada principalmente por el hábito de fumar que puede dar lugar a problemas respiratorios a largo plazo. Los síntomas incluyen disnea y tos con producción de esputo debido al daño en las vías respiratorias y los pulmones. La infección puede desencadenar síntomas graves y puede empeorar la respiración y aumentar la tos y el esputo. Lo anterior se conoce más comúnmente como exacerbación, lo cual puede causar daño adicional a la función pulmonar. Las exacerbaciones frecuentes pueden dar lugar a ingresos al hospital, reducción en la calidad de vida y aumento del riesgo de muerte.
¿Por qué se hace esta revisión?
Se deseaba conocer si un antibiótico preventivo era mejor que otro antibiótico preventivo para reducir las exacerbaciones y mejorar la calidad de vida en pacientes con EPOC.
¿Qué evidencia se encontró?
Se encontraron dos ensayos aleatorizados que incluyeron a 391 pacientes con EPOC. La edad promedio de los participantes era de 68 años. El primer estudio incluyó a tres grupos de pacientes con EPOC que recibían moxifloxacina (una vez al día durante cinco días cada cuatro semanas), doxiciclina (una vez al día durante 13 semanas) o azitromicina (tres veces por semana durante 13 semanas). El segundo estudio investigó la administración de doxiciclina (una vez al día) además de roxitromicina (una vez al día) durante 12 semanas en pacientes con EPOC. Los resultados principales fueron el número de exacerbaciones, la calidad de vida, los efectos secundarios graves (conocidos como “eventos adversos”) y la resistencia a los antibióticos.
Resultados y conclusiones
En general, no fue posible determinar diferencias entre los antibióticos comparados entre sí para mejorar los resultados principales medidos.
No se sabe si un antibiótico fue mejor o peor que otro en cuanto a la reducción de las exacerbaciones o la mejoría en la calidad de vida. Ninguno de los estudios informó una comparación entre los antibióticos para la farmacorresistencia.
En un estudio que se prolongó durante 13 semanas no se encontraron efectos secundarios graves debido a la administración de moxifloxacina, azitromicina o doxiciclina, y no se informaron muertes. En el otro estudio, un número muy similar de pacientes presentó efectos secundarios graves en el grupo de tratamiento de antibióticos combinados y en el de antibiótico único después de 12 semanas de tratamiento y 48 semanas de seguimiento. Sin embargo, los números fueron pequeños por lo cual no existe seguridad sobre si una opción de tratamiento puede causar más efectos secundarios que la otra. En el mismo estudio, murieron cinco pacientes del grupo de tratamiento combinado, en comparación con tres pacientes del grupo de tratamiento único. Nuevamente, estos números son demasiado pequeños para establecer cualquier conclusión.
Certeza de la evidencia
No se sabe mucho acerca de los resultados debido a que se encontraron sólo dos estudios pequeños que administraron antibióticos a los pacientes con EPOC durante sólo 12 o 13 semanas. Los estudios sólo consideraron cuatro antibióticos diferentes y no midieron todos los resultados en los que había interés.
Authors' conclusions
Summary of findings
| Macrolide+tetracycline compared to macrolide for chronic obstructive pulmonary disease | ||||||
| Patient or population: chronic obstructive pulmonary disease | ||||||
| Outcomes | Anticipated absolute effects* (95% CI) | Relative effect | № of participants | Certainty of the evidence | Comments | |
| Risk with macrolide | Risk with Macrolide+tetracycline | |||||
| Quality of life, measured by CRQ (dyspnoea, fatigue, emotional function, and mastery subscales) Follow‐up 12 weeks (end of treatment) Scale from 0 to 10. Higher scores on the scale indicates better quality of life | The mean change in CRQ HRQoL (dyspnoea) was 2.21 | MD 0.58 higher | ‐ | 187 | ⊕⊝⊝⊝ | An increase of three points in this domain refers to a clinically significant reduction in dyspnoea (Jaeschke 1989; Jones 2002) |
| The mean change in CRQ HRQoL (fatigue) was 0.68 | MD 0.02 higher | ‐ | 187 | ⊕⊝⊝⊝ | An increase of four points in this domain refers to a clinically significant reduction in fatigue (Jaeschke 1989; Jones 2002) | |
| The mean change in CRQ HRQoL (emotional function) was 0.45 | MD 0.37 lower | ‐ | 187 | ⊕⊝⊝⊝ | An increase of two points in this domain refers to a clinically significant improvement in emotional function (Jaeschke 1989; Jones 2002) | |
| The mean change in CRQ HRQoL (mastery) was 0.53 | MD 0.79 lower | ‐ | 187 | ⊕⊝⊝⊝ | No reported minimally important difference (MID) | |
| All‐cause serious adverse events 60 weeks (end of study) | 237 per 1000 | 237 per 1000 | OR 1.00 | 198 | ⊕⊝⊝⊝ | |
| Lung function (trough FEV1) Change from baseline to 12 weeks (end of active treatment) | The mean change in trough FEV1 was 0.047 L | MD 0.01 L lower | 182 | ⊕⊝⊝⊝ | An improvement of 100 mL (0.1 L) for FEV1 trough is considered clinically significant (Donohue 2005) | |
| All‐cause mortality 60 weeks (end of study) | 31 per 1000 | 49 per 1000 (12 to 183) | OR 1.63 | 198 | ⊕⊝⊝⊝ | |
| Number of people experiencing one or more exacerbations, Drug resistance/microbial sensitivity (as reported by trialists), including emergence of atypical bacteria, Number of participants colonised with Pseudomonas aeruginosa | Information for these outcomes was not presented as data for head‐to‐head comparisons were not available | |||||
| *The risk in the intervention group (and its 95% confidence interval) is based on the assumed risk in the comparison group and the relative effect of the intervention (and its 95% CI). | ||||||
| GRADE Working Group grades of evidence | ||||||
| aThe evidence was downgraded by 1 due to attrition bias in the combined treatment arm. | ||||||
| Quinolone compared with tetracycline for chronic obstructive pulmonary disease | ||||||
| Patient or population: chronic obstructive pulmonary disease | ||||||
| Outcomes | Illustrative comparative risks* (95% CI) | Relative effect | № of Participants | Certainty of the evidence | Comments | |
| Assumed risk | Corresponding risk | |||||
| Quinlone | Tetracycline | |||||
| Number of participants experiencing one or more exacerbations Quinolone versus tetracycline | 600 per 1000 | 398 per 1000 | OR 0.44 | 50 | ⊕⊝⊝⊝ | |
| All‐cause mortality Follow‐up 13 weeks (end of treatment) | ‐ | ‐ | ‐ | 50 (1 RCT) | ‐ | No deaths reported in either treatment arm |
| Quality of life Drug resistance/microbial sensitivity Serious adverse events Lung function Hospitalisations Adverse events/side effects Number of participants colonised with P aeruginosa | Information for these outcomes was not presented as data for head‐to‐head comparisons were not available | |||||
| *The risk in the intervention group (and its 95% confidence interval) is based on the assumed risk in the comparison group and the relative effect of the intervention (and its 95% CI). | ||||||
| GRADE Working Group grades of evidence | ||||||
| aThe evidence was downgraded by 2 due to imprecision. The sample size was small, and the confidence interval crossed the line of no effect, and failed to exclude important harm. | ||||||
| Quinlone compared with macrolide for chronic obstructive pulmonary disease | ||||||
| Patient or population: chronic obstructive pulmonary disease | ||||||
| Outcomes | Illustrative comparative risks* (95% CI) | Relative effect | № of Participants | Certainty of the evidence | Comments | |
| Assumed risk | Corresponding risk | |||||
| Quinlone | Macrolide | |||||
| Number of participants experiencing one or more exacerbations Quinolone versus macrolide | 400 per 1000 | 400 per 1000 | OR 1.00 | 50 | ⊕⊝⊝⊝ | |
| All‐cause mortality Follow‐up 13 weeks (end of treatment) | ‐ | ‐ | ‐ | 50 (1 RCT) | ‐ | No deaths reported in either treatment arm |
| Quality of life Drug resistance/microbial sensitivity Serious adverse events Lung function Hospitalisations Adverse events/side effects Number of participants colonised with P aeruginosa | Information for these outcomes was not presented as data for head‐to‐head comparisons were not available | |||||
| *The risk in the intervention group (and its 95% confidence interval) is based on the assumed risk in the comparison group and the relative effect of the intervention (and its 95% CI). | ||||||
| GRADE Working Group grades of evidence | ||||||
| aThe evidence was downgraded by 2 due to imprecision. The sample size was small, and the confidence interval failed to exclude an important benefit or harm. | ||||||
| Macrolide compared with tetracycline for chronic obstructive pulmonary disease | ||||||
| Patient or population: chronic obstructive pulmonary disease | ||||||
| Outcomes | Illustrative comparative risks* (95% CI) | Relative effect | № of Participants | Certainty of the evidence | Comments | |
| Assumed risk | Corresponding risk | |||||
| Quinlone | Macrolide | |||||
| Number of participants experiencing one or more exacerbations Macrolide versus tetracycline Follow‐up 13 weeks (end of treatment) | 600 per 1000 | 398 per 1000 | OR 0.44 | 50 | ⊕⊝⊝⊝ | |
| All‐cause mortality Follow‐up 13 weeks (end of treatment) | ‐ | ‐ | ‐ | 50 (1 RCT) | ‐ | No deaths reported in either treatment arm |
| Quality of life Drug resistance/microbial sensitivity Serious adverse events Lung function Hospitalisations Adverse events/side effects Number of participants colonised with P aeruginosa | Information for these outcomes was not presented as data for head‐to‐head comparisons were not available | |||||
| *The risk in the intervention group (and its 95% confidence interval) is based on the assumed risk in the comparison group and the relative effect of the intervention (and its 95% CI). | ||||||
| GRADE Working Group grades of evidence | ||||||
| aThe evidence was downgraded by 2 due to imprecision. The sample size was small, and the confidence interval crossed the line of no effect, and failed to exclude important harm. | ||||||
Background
Description of the condition
The Global Initiative for Chronic Obstructive Lung Disease (GOLD) defines chronic obstructive pulmonary disease (COPD) as "a common, preventable and treatable disease that is characterized by persistent respiratory symptoms and airflow limitation that is due to airway and/or alveolar abnormalities usually caused by significant exposure to noxious particles or gases" (GOLD 2019). Diagnosis is established by typical symptoms, risk factors and spirometry. Typical symptoms consist of dyspnoea, cough with sputum production and recurrent lower respiratory tract infections. The most prevalent risk factor is tobacco smoke; other environmental risk factors include smoke from home cooking and heating fuels, and occupational dust; host factors include genetic conditions such as alpha₁ antitrypsin deficiency. The spirometric criterion for COPD is a post‐bronchodilator fixed ratio of forced expiratory volume in one second/forced vital capacity (FEV1/FVC) < 0.70 (GOLD 2019).
The impact of COPD on world health is substantial. The number of cases of COPD worldwide has increased from approximately 227.3 million in 1990 to 384 million in 2010, with a global prevalence rising from 10.7% to 11.7% (Adeloye 2015). It is the fourth leading cause of death and is predicted to rise to third place by 2020 (GOLD 2019), or 2030 (WHO 2018). COPD is characterised by frequent exacerbations and lower respiratory tract infections, which further increase the risk of mortality (Schmidt 2014; Threapleton 2018). Exacerbations also impact on exercise tolerance, quality of life and muscle strength; and are associated with a faster decline in lung function (Cote 2007; Donaldson 2008; Kessler 2006; Miravitlles 2004; Niewoehner 2006; Seemungal 1998; Wüst 2007). Exacerbations are associated with systemic, upper and lower airway inflammation (Hurst 2006). It is likely that the aetiology of exacerbations is multifactorial, with inflammation caused by bacteria, viruses and environmental pollutants (Beasley 2012). The aetiology of a particular exacerbation is not always clear. Whilst antibiotics are frequently used to treat COPD exacerbations, and bacterial pathogens are isolated from approximately half of patients with an exacerbation (Kuwal 2018; Llor 2006; Sethi 2004), they are also commonly isolated in patients with stable COPD (Sethi 2008). A network analysis of the lung microbiome of COPD patients demonstrated that a reduction in microbial diversity and the proliferation of a single organism were associated with exacerbation events (Wang 2016). It has been hypothesised that lungs of people with COPD are more susceptible to bacteria, which are not normally present in healthy lungs (Rosell 2005). This chronic bacterial presence contributes to a vicious cycle of inflammation, enhances mucus secretion and worsens ciliary activity, leading to further epithelial damage (Matkovic 2013; Sethi 2008).
Description of the intervention
There are a number of strategies available that are effective at reducing COPD exacerbations, including patient self‐management training (Zwerink 2014); pulmonary rehabilitation (McCarthy 2015; Puhan 2016); influenza vaccination (Kopsaftis 2018); inhaled long‐acting bronchodilators and corticosteroids (Chong 2012; Oba 2018; Yang 2012); and roflumilast, a phosphodiesterase 4 inhibitor (Chong 2013). An additional treatment consideration in an attempt to reduce the frequency of exacerbations of COPD, and reverse this potential 'vicious cycle' of inflammation is the use of long‐term antibiotics as prophylaxis (i.e. for prevention of recurring symptoms (Herath 2018). Prophylatic antibiotics are usually given by mouth, but may also be delivered via other routes, including inhalation. This review will examine the use of head‐to‐head oral antibiotics only. Depending on the type of antibiotic, regimens include continuous (daily), intermittent (i.e. 3 times a week) or pulsed (e.g. 5 days of antibiotics every 8 weeks) administration (BNF).
A Cochrane Review analysed 3170 patients across seven RCTs published between 2001 and 2018 (Herath 2018). The authors investigated the effects of macrolides (azithromycin, erythromycin, clarithromycin) and moxifloxacin (a fourth‐generation synthetic fluoroquinolone) compared with placebo. The use of long‐term prophylactic antibiotics was associated with significantly fewer patients who experienced an exacerbation of COPD (odds ratio (OR) 0.57, 95% confidence interval (CI) 0.42 to 0.78; moderate‐certainty evidence) compared with those receiving placebo. However, patients on prophylactic antibiotics were more likely to experience adverse effects, such as hearing loss with azithromycin and gastrointestinal symptoms with moxifloxacin.
How the intervention might work
The effect of prophylactic antibiotics is not completely understood. Antibiotics may offer both antibacterial and anti‐inflammatory effects (Martinez 2008), and therefore may reduce both bacterial load and inflammation in the airways. Choice of prophylactic antibiotic may be guided by factors including clinician and patient preference and prior experience, previously isolated bacteria and side effect profile. Organisms isolated from exacerbating patients include Haemophilus influenzae (H influenzae) (11% of all patients), Streptococcus pneumoniae (S pneumoniae) (10%), Moraxella catarrhalis (M catarrhalis) (10%), Haemophilus parainfluenzae (H parainfluenzae) (10%), and Pseudonomas aeruginosa (P aeruginosa) (4%) (Sapey 2006).
Prophylactic antibiotics may be of greatest benefit in a subset of patients (Miravittles 2015). A 2011 study by Albert and colleagues suggests that compared to placebo, azithromycin (a macrolide antibiotic) reduces exacerbations most markedly in older patients, non‐smokers and those not using oral or inhaled steroids at baseline, which may reflect sub‐optimal treatment (Albert 2011). We prespecified several subgroup analyses which we conducted to explore this in the context of head‐to‐head antibiotics, if sufficient evidence was available.
Why it is important to do this review
COPD represents a huge burden, to both the patient (Cote 2007; Kessler 2006), and healthcare services (López‐Campos 2016; Mannino 2015; Punekar 2014). Therefore it was important to assess treatments that may reduce the risk of exacerbations and improve quality and longevity of life of patients with COPD.
This review builds upon a recently published Cochrane Review comparing prophylactic antibiotics with placebo (Herath 2018). Results of the published review showed that continuous (daily) and intermittent (at least 3 times a week) may be more effective in reducing exacerbations and improving patient‐reported quality of life (Herath 2018). A network meta‐analysis is under development that will complement the already published review comparing antibiotics with placebo (Herath 2018), and this review (head‐to‐head prophylactic antibiotic comparisons). Whilst there is evidence that antibiotic prophylaxis is efficacious in people with COPD, there remains a large concern over the risk of antibiotic resistance (Miravittles 2017; Thurston 2013). It was therefore imperative to identify which antibiotic provided the best prophylaxis against exacerbations of COPD and least evidence of antibiotic resistance and adverse effects.
Objectives
To compare the safety and efficacy of different classes of antibiotics (continuous, intermittent or pulsed) for prophylaxis of exacerbations in patients with COPD.
Methods
Criteria for considering studies for this review
Types of studies
We included randomised controlled trials (RCTs). We planned to include cross‐over trials providing there was an adequate wash out period (at least three months) and cluster‐randomised trials. We included studies reported in full‐text, those published as abstracts only and unpublished data.
Types of participants
We included adults (older than 18 years of age) with a diagnosis of COPD according to established criteria (e.g. European Respiratory Society (ERS), American Thoracic Society (ATS) or Global Initiative for Chronic Obstructive Lung Disease (GOLD) criteria). We excluded participants with the following co‐morbidities/characteristics: bronchiectasis; asthma; or genetic diseases, such as cystic fibrosis or primary ciliary dyskinesia. However, we recognised that disease definitions may change over time and if older studies were identified we would consider the directness of the evidence when applying GRADE. As we did not identify trials in which only a subset of the participants had COPD, we did not include any disaggregated data. We included participants irrespective of vaccination status (e.g. pneumococcal vaccination), providing vaccination was not part of the randomised treatment.
Types of interventions
We included studies comparing one prophylactic oral antibiotic with another. We excluded studies where the comparison group received a placebo or usual care not involving a prophylactic antibiotic.
To be eligible, studies must randomise participants to receive the antibiotic for at least 12 weeks, either continuously, intermittently or pulsed*. Intermittent antibiotics must be given at least three times per week, and pulsed antibiotics must be given for a minimum of five consecutive days every eight weeks. We excluded studies which delivered antibiotics via a nebuliser, inhaler, intravenously or intramuscularly.
We included the following co‐interventions provided they were not part of the randomised treatment: short‐ and long‐acting bronchodilators, inhaled corticosteroids, oral corticosteroids, oxygen, pulmonary rehabilitation, smoking cessation interventions or any other standard treatment for COPD.
*We categorised the intervention regimen into continuous, intermittent or pulsed as reported in Herath 2018.
We considered the following comparisons.
-
Macrolides (e.g. azithromycin) versus other antibiotic classes
-
Quinolones (e.g. moxifloxacin) versus other antibiotics classes
-
Quinolones versus macrolides
-
Macrolides versus penicillins (e.g. amoxicillin)
-
Macrolides versus tetracyclines (e.g. doxycycline
Types of outcome measures
Primary outcomes
-
Exacerbations (as defined by trialists and grouped by exacerbation severity where possible, e.g. those requiring hospitalisation versus those requiring ambulatory management only). Depending on the available data, we planned to extract either the number of participants experiencing one or more exacerbations, or the exacerbation rate, or both.
-
Quality of life (validated scales such as the St George's Respiratory Questionnaire preferred)
-
Drug resistance/microbial sensitivity (as reported by trialists), including emergence of atypical bacteria
-
Serious adverse events
Primary outcomes were considered to be the most important to patients, healthcare providers and policy‐makers. Specific adverse events reported by trialists (e.g. episodes of Clostridium difficile (C difficile), tendon rupture, hearing difficulties) were extracted and summarised narratively.
Secondary outcomes
-
Lung function (FEV1 and FVC)
-
Mortality (we planned to analyse respiratory and all‐cause mortality separately, where possible)
-
Hospitalisations
-
Adverse events/side effects
-
Number of participants colonised with P aeruginosa
Reporting one or more of the outcomes listed here in the study was not an inclusion criterion for the review.
If outcomes were reported at multiple time points, the latest reported time point/end of treatment data was extracted. We planned to group outcomes reported at three months or more to less than six months; six months to less than 12 months; and 12 months or more. If post‐treatment follow‐up was reported, this was extracted and analysed separately.
Search methods for identification of studies
Electronic searches
We identified studies from the Cochrane Airways Trials Register, which is maintained by the Information Specialist for the Group. The Cochrane Airways Trials Register contained studies identified from several sources, as follows.
-
Monthly searches of the Cochrane Central Register of Controlled Trials (CENTRAL), through the Cochrane Register of Studies Online (crso.cochrane.org)
-
Weekly searches of MEDLINE Ovid
-
Weekly searches of Embase Ovid SP
-
Monthly searches of PsycINFO Ovid SP
-
Monthly searches of CINAHL EBSCO (Cumulative Index to Nursing and Allied Health Literature)
-
Monthly searches of AMED EBSCO (Allied and Complementary Medicine)
-
Handsearches of the proceedings of major respiratory conferences
Studies contained in the Trials Register were identified through search strategies based on the scope of Cochrane Airways. Details of these strategies, as well as a list of handsearched conference proceedings, are in Appendix 1. See Appendix 2 for search terms used to identify studies for this review.
We searched the following trials registries.
-
US National Institutes of Health Ongoing Trials Register ClinicalTrials.gov (www.ClinicalTrials.gov)
-
World Health Organization International Clinical Trials Registry Platform (apps.who.int/trialsearch)
We searched the Cochrane Airways Trials Register and additional sources from inception to 6 February 2019, with no restriction on language of publication.
Searching other resources
We checked the reference lists of all primary studies and review articles for additional references. We searched relevant manufacturers' web sites for study information.
We searched for errata or retractions related to the included studies on PubMed on 21 January 2019.
Data collection and analysis
Selection of studies
Two review authors (CT and RN) screened the titles and abstracts of the search results independently and coded them as 'retrieve' (eligible or potentially eligible/unclear) or 'do not retrieve'. We retrieved the full‐text study reports of all potentially eligible studies and two review authors (CT and RN) independently screened them for inclusion, recording the reasons for exclusion of ineligible studies. We resolved any disagreement through discussion or, if required, we consulted a third review author (EB). We identified and excluded duplicates, and collated multiple reports of the same study so that each study, rather than each report, was the unit of interest in the review. We recorded the selection process in sufficient detail to complete a PRISMA flow diagram and 'Characteristics of excluded studies' table (Moher 2009).
Data extraction and management
We used a data collection form for study characteristics and outcome data, which had been piloted on at least one study in the review. One review author (CT) extracted the following study characteristics from included studies.
-
Methods: study design, total duration of study, details of any 'run‐in' period, number of study centres and location, study setting, withdrawals and date of study
-
Participants: N, mean age, age range, gender, severity of condition, diagnostic criteria, baseline lung function, smoking history, inclusion criteria and exclusion criteria
-
Interventions: intervention, comparison, concomitant medications and excluded medications
-
Outcomes: primary and secondary outcomes specified and collected, and time points reported. We sought and recorded definitions used to diagnose an exacerbation.
-
Notes: funding for studies and notable conflicts of interest of trial authors
Two review authors (RN and SJ) independently extracted outcome data from included studies. We noted in the 'Characteristics of included studies' table if outcome data were not reported in a usable way. We resolved disagreements by consensus. One review author (SJ) transferred data into the Review Manager file (Review Manager 2014). We double‐checked that data were entered correctly by comparing the data presented in the systematic review with the study reports. A second review author (RN) spot‐checked study characteristics for accuracy against the study report.
We produced a table summarising the key characteristics of each study, including region, baseline characteristics of participants, size of study, antibiotic regimens investigated and the reported effect, thus facilitating comparison across studies.
Assessment of risk of bias in included studies
Two review authors (CT and RN) assessed risk of bias independently for each study using the criteria outlined in the Cochrane Handbook for Systematic Reviews of Interventions (Higgins 2011). We resolved any disagreements by discussion. We assessed the risk of bias according to the following domains.
-
Random sequence generation
-
Allocation concealment
-
Blinding of participants and personnel
-
Blinding of outcome assessment
-
Incomplete outcome data
-
Selective outcome reporting
-
Other bias
We judged each potential source of bias as high, low or unclear and provided a quote from the study report together with a justification for our judgement in the 'Characteristics of included studies tables. We summarised the 'Risk of bias' judgements across different studies for each of the domains listed. We considered blinding separately for different key outcomes where necessary (e.g. for unblinded outcome assessment, risk of bias for all‐cause mortality could be very different than for a patient‐reported quality of life scale). Where information on risk of bias related to unpublished data or correspondence with a trialist, we noted this in the 'Risk of bias' table.
When considering treatment effects, we took into account the risk of bias for the studies that contributed to that outcome.
Assessment of bias in conducting the systematic review
We conducted this review according to the published protocol and justified any deviations from it in the Differences between protocol and review section.
Measures of treatment effect
We analysed dichotomous data as odds ratios (ORs) and continuous data as the mean difference (MD) or standardised mean difference (SMD), had we found data on different scales. If we had combined data from rating scales in a meta‐analysis, we planned to ensure they were entered with a consistent direction of effect (e.g. lower scores always indicating improvement).
We planned to undertake meta‐analyses, however, there were insufficient studies from which to pool data.
We described skewed data narratively where possible (for example, as medians and interquartile ranges for each group).
Where multiple trial arms were reported in a single study, we included only the relevant arms. If we had combined two comparisons (e.g. drug A versus drug B and drug C versus drug B) in the same meta‐analysis, we planned to either combine the 'active' arms or halve the 'control' group to avoid double‐counting.
We planned to identify adjusted analyses (ANOVA or ANCOVA), however, we did not find such analyses in the included studies. If a study reported outcomes at multiple time points, we extracted the latest reported time point.
We used intention‐to‐treat (ITT) or 'full analysis set' analyses where they were reported (i.e. those where data had been imputed for participants who were randomly assigned but did not complete the study) instead of completer or per protocol analyses.
Unit of analysis issues
For dichotomous outcomes, we used participants, rather than events, as the unit of analysis (i.e. number of people admitted to hospital, rather than number of admissions per person). However, if rate ratios were reported in a study (e.g. for exacerbations), we planned to analyse them on this basis. We planned to only meta‐analyse data from cluster‐RCTs if the available data had been adjusted (or could be adjusted), to account for the clustering. We planned to enter data from cross‐over trials using generic inverse variance and with the help of a statistician.
Dealing with missing data
We attempted to contact investigators or study sponsors in order to verify key study characteristics and obtain missing numerical outcome data where possible (e.g. when a study was identified as an abstract only). Where this was not possible, and the missing data were thought to introduce serious bias, we took this into consideration in the GRADE rating for affected outcomes.
Assessment of heterogeneity
We were unable to use the I2 statistic to measure heterogeneity and perform prespecified subgroup analyses as there were insufficient studies to meta‐analyse data. Had we been able to perform meta‐analysis, we would have considered the following I2 ranges to assess heterogeneity (Higgins 2011).
-
0% to 40%: might not be important
-
30% to 60%: may represent moderate heterogeneity
-
50% to 90%: may represent substantial heterogeneity
-
75% to 100%: considerable heterogeneity
Assessment of reporting biases
If we were able to pool more than 10 studies, we planned to create and examine a funnel plot to explore possible small‐study and publication biases. However, there were insufficient studies to pool data and we were unable to explore these reporting biases using a funnel plot.
Data synthesis
We planned to use a fixed‐effect model and perform a sensitivity analysis with a random‐effects model.
'Summary of findings' tables
We created four 'Summary of findings' tables using the following outcomes: exacerbations of COPD, quality of life, serious adverse events, mortality, lung function (FEV1), hospitalisations and antibiotic resistance. We used the five GRADE considerations (risk of bias; consistency of effect; imprecision; indirectness; and publication bias) to assess the certainty of a body of evidence as it related to the studies that contributed data for the prespecified outcomes. We used the methods and recommendations described in Section 8.5 and Chapter 12 of the Cochrane Handbook for Systematic Reviews of Interventions (Higgins 2011), using GRADEpro software (GRADEpro GDT). We justified all decisions to downgrade the certainty of studies using footnotes and we made comments to aid the reader's understanding of the review where necessary.
Subgroup analysis and investigation of heterogeneity
We planned to carry out the following subgroup analyses.
-
Exacerbation history: trials recruiting participants with a group mean of less than one versus one to two versus more than two exacerbations in the preceding year
-
COPD severity: participants classed as predominantly GOLD group 1 or 2 versus those predominantly GOLD group 3 or 4
-
Studies with more than 70% on long‐acting beta‐adrenoceptor agonist/long‐acting muscarinic antagonist/inhaled corticosteroid (LABA/LAMA/ICS) at baseline versus those with less than 70% on LABA/LAMA/ICS at baseline
We used the following outcomes in subgroup analyses.
-
Participants having one or more exacerbations
-
Quality of life
-
Serious adverse events
We used the formal test for subgroup interactions in Review Manager 5 (Review Manager 2014).
Sensitivity analysis
We planned to carry out the following sensitivity analyses, removing the following from the primary outcome analyses.
-
Studies judged to be at high risk of bias in one or more domains
-
Cross‐over trials
We planned to compare the results from a fixed‐effect model with the random‐effects model.
Results
Description of studies
Results of the search
The database search identified 1416 records. We screened 1415 records after removing duplicates. We excluded 1367 records on the basis of the titles and abstracts, resulting in 48 full‐text articles to be assessed for eligibility. From the full‐text assessment, we identified two studies that were eligible for inclusion in this systematic review (Figure 1).
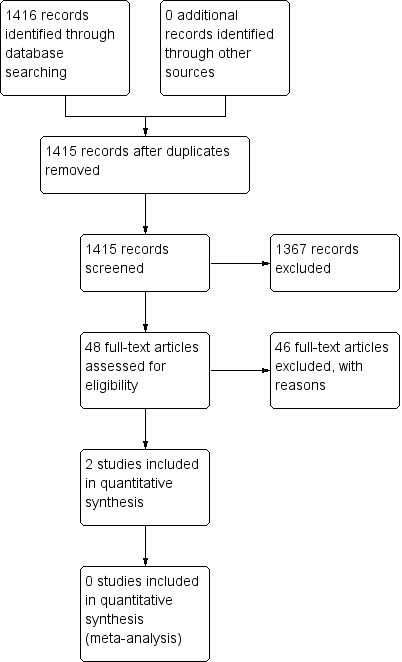
Study flow diagram.
Included studies
We identified two studies that were eligible to include in this systematic review (Brill 2015; Shafuddin 2015).
The first study specifically compared the effect of different antibiotic classes with a placebo group on airway bacteria in people with stable chronic obstructive pulmonary disease (COPD) for 13 weeks (Brill 2015). The second study compared the effect of two antibiotics combined with a single antibiotic treatment and placebo treatment group, which was not a comparison that was originally part of our inclusion criteria. We included the study because regardless of the comparison, the antibiotics included in the study were part of the inclusion criteria for this review. The duration of treatment in the study was 12 weeks in people with moderate to severe COPD (Shafuddin 2015).
One single‐centre, single‐blind, placebo‐controlled study included 99 participants with a mean number of exacerbations per person in the previous year of 2.2 and a mean FEV1% predicted of 50.5% (see Characteristics of included studies for further details). The trial investigated three antibiotics, each from a different antibiotic class. The treatment arms included moxifloxacin, a quinolone (pulsed, 400 mg administered for 5 days every 4 weeks), azithromycin, a macrolide (intermittent, 250 mg administered 3 times per week), and doxycycline, a tetracycline (continuous, 100 mg administered daily) (Brill 2015). For the purpose of this systematic review, we extracted the data for each antibiotic only and not the data for the placebo treatment arm.
One double‐blind, placebo‐controlled study included 292 participants with a mean number of exacerbations per person within two years of 5.11 and a mean FEV1% predicted of 34% (see Characteristics of included studies for further details). The trial investigated roxithromycin, a macrolide (continuous, 300 mg per day), and doxycycline, a tetracycline (100 mg per day), administered together and compared with roxithromycin alone as well as a placebo treatment arm. Originally, the study was designed to investigate the hypothesis that "C pneumoniae was a pathogenic factor in the aetiology of COPD and that eradication of C pneumoniae infection could reduce exacerbation rates". As the participants included in the study were already tested positive for C pneumoniae the aim was to test whether the antibiotic regimens could specifically eradicate C pneumoniae infection. However, the study authors explained in the text of the publication that this hypothesis was "considered unsubstantiated and no longer considered clinically relevant". Instead, they presented the data to investigate the role of prophylactic antibiotics in the reduction of COPD exacerbations (Shafuddin 2015).
Study funding
Brill 2015 was supported by Programme Grants for Applied Research programme and the NIHR Royal Brompton Respiratory Biomedical Research Unit.
Shafuddin 2015 was funded by Sanofi‐Aventis Australia Pty Ltd.
Excluded studies
Excluded studies are listed in the Characteristics of excluded studies table with reasons for exclusions.
Risk of bias in included studies
Judgements for risk of bias and reasons can be found in the Characteristics of included studies table and an overview of judgements for risk of bias can be found in Figure 2.
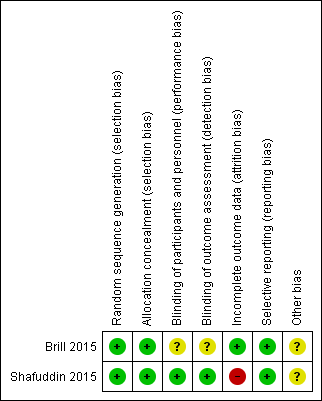
Risk of bias summary: review authors' judgements about each risk of bias item for each included study.
Allocation
Random sequence generation and allocation concealment were described in detail by both studies and we judged them to be at low risk of bias in these domains (Brill 2015; Shafuddin 2015).
Blinding
Blinding of participants and personnel was described in detail in Shafuddin 2015 and we judged this domain as low risk of bias. However, Brill 2015 was described as a single‐blind study as participants were blinded but it was unclear if personnel were blinded to treatment allocation. As blinding of outcome assessment (detection bias) was confirmed in detail as a result of contacting corresponding authors for Shafuddin 2015, we judged this domain as low risk of bias. However, there was no description of outcome assessor blinding in the Brill 2015, which resulted in an unclear of bias judgement for this domain.
Incomplete outcome data
Flow of participants throughout both studies were described in detail as they both used a CONSORT diagram to explain attrition (Brill 2015; Shafuddin 2015). Rates of withdrawal in Brill 2015 were low and balanced between groups and were accounted for in the flow diagram. However in Shafuddin 2015, more patients withdrew from the combined antibiotics treatment arm, although trialists reported that this was not related to medication. We judged Brill 2015 to be at low risk and Shafuddin 2015 to be at high risk in this domain.
Selective reporting
Both studies reported all prespecified planned primary and secondary outcomes according to the trial registration (Brill 2015; Shafuddin 2015). It should be noted that some outcomes of both studies were not reported in the format for this systematic review, and after contact with corresponding authors for both trials, we were not able to obtain the data required. To view risk of bias tables see the Characteristics of included studies.
Other potential sources of bias
Although both studies described adequate methods of random sequence generation and allocation concealment, we identified imbalances in baseline characteristics in both studies. Therefore we rated both to be at unclear risk of other bias.
Effects of interventions
See: Summary of findings for the main comparison Macrolide+tetracycline versus macrolide; Summary of findings 2 Quinolone versus tetracycline; Summary of findings 3 Quinolone versus macrolide; Summary of findings 4 Macrolide versus tetracycline
An overview of the results together with a summary of our certainty of the evidence per head‐to‐head comparison is presented in summary of findings Table for the main comparison, summary of findings Table 2, summary of findings Table 3 and summary of findings Table 4. Additional information about both trials are presented in Table 1, Table 2, Table 3, Table 4, Table 5 and Table 6.
| Study ID | Antibiotic class | Antibiotic | Antibiotic frequency and amount | Number of participants experiencing exacerbations (N) | Total number of participants (N) | Duration of treatment |
| Quinolone | Moxifloxacin | Pulsed (400 mg daily for 5 days every 4 weeks) | 10 | 25 | 13 weeks | |
| Tetracycline | Doxycycline | Continuous (100 mg daily) | 15 | 25 | 13 weeks | |
| Macrolide | Azithromycin | Intermittent (250 mg 3 times per week) | 10 | 25 | 13 weeks |
| Study ID | Antibiotic class | Antibiotic | Antibiotic frequency and amount | Quality of life scale | Mean CRQ (SD) | Total number of participants (N) | Duration of treatment |
| Macrolide+ tetracycline | Roxithromycin + doxycycline | Continuous (300 mg daily + 100 mg daily) | CRQ (dyspnoea) | 2.21 (5.35) | 93 | 12 weeks | |
| Macrolide | Roxithromycin | Continuous (300 mg daily) | CRQ (dyspnoea) | 1.63 (4.53) | 94 | 12 weeks | |
| Macrolide+ tetracycline | Roxithromycin + doxycycline | Continuous (300 mg daily + 100 mg daily) | CRQ (fatigue) | 0.68 (3.79) | 93 | 12 weeks | |
| Macrolide | Roxithromycin | Continuous (300 mg daily) | CRQ (fatigue) | 0.66 (3.87) | 94 | 12 weeks | |
| Macrolide+ tetracycline | Roxithromycin + doxycycline | Continuous (300 mg daily + 100 mg daily) | CRQ (emotional function) | 0.45 (5.04) | 93 | 12 weeks | |
| Macrolide | Roxithromycin | Continuous (300 mg daily) | CRQ (emotional function) | 0.82 (4.48) | 94 | 12 weeks | |
| Macrolide+ tetracycline | Roxithromycin + doxycycline | Continuous (300 mg daily + 100 mg daily) | CRQ (mastery) | 0.53 (3.42) | 93 | 12 weeks | |
| Macrolide | Roxithromycin | Continuous (300 mg daily) | CRQ (mastery) | 1.32 (4) | 94 | 12 weeks |
CRQ: Chronic Respiratory Questionnaire
SD: standard deviation
| Study ID | Antibiotic class | Antibiotic | Antibiotic frequency and amount | Number of participants experiencing SAEs (n) | Total number of participants (N) | Duration of treatment |
| Quinolone | Moxifloxacin | Pulsed (400 mg daily for 5 days every 4 weeks) | 0 | 25 | 13 weeks | |
| Tetracycline | Doxycycline | Continuous (100 mg daily) | 0 | 25 | 13 weeks | |
| Macrolide | Azithromycin | Intermittent (250 mg 3 times per week) | 0 | 25 | 13 weeks | |
| Macrolide+ tetracycline | Roxithromycin+ doxycycline | Continuous (300 mg + 100 mg daily) | 24 | 101 | 48 weeks follow‐up after 12 weeks active treatment (60 weeks) | |
| Macrolide | Roxithromycin | Continuous (300 mg daily) | 23 | 97 | 48 weeks follow‐up after 12 weeks active treatment (60 weeks) |
SAE: serious adverse event
| Study ID | Antibiotic class | Antibiotic | Antibiotic frequency and amount | Mean FEV1 (SD) (trough) | Mean FEV1 % predicted (SD) (trough) | Mean FVC (SD) | Total number of participants (N) | Duration of treatment |
| Macrolide + tetracycline | Roxithromycin + doxycycline | Continuous (300 mg + 100 mg daily) | 0.047 (026) | 1.7 (9) | 0.06 (0.46) | 88 | 12 weeks | |
| Macrolide | Roxithromycin | Continuous (300 mg daily) | 0.057 (0.31) | 1.87 (11) | 0.09 (0.55) | 94 | 12 weeks |
FEV1: forced expiratory volume in 1 second
FVC: forced vital capacity
SD: standard deviation
| Study ID | Antibiotic class | Antibiotic | Antibotic frequency and amount | All‐cause mortality (n) | Total number of participants (N) | Duration of treatment |
| Macrolide + tetracycline | Roxithromycin + doxycycline | Continuous (300 mg + 100 mg daily) | 5 | 101 | 48 weeks follow‐up after 12 weeks active treatment (60 weeks) | |
| Macrolide | Roxithromycin | Continuous (100 mg daily) | 3 | 97 | 48 weeks follow‐up after 12 weeks active treatment (60 weeks) |
| Study ID | Antibiotic class | Antibiotic | Antibiotic frequency and amount | Adverse event type | Number of participants with adverse events/side effects (n) | Total number of participants (N) | Duration of treatment |
| Macrolide + tetracycline | Roxithromycin + doxycycline | Continuous (300 mg + 100 mg daily) | All‐cause | 73 | 101 | 48 weeks follow‐up after 12 weeks active treatment (60 weeks) | |
| Macrolide | Roxithromycin | Continuous (100 mg daily) | All‐cause | 74 | 97 | 48 weeks follow‐up after 12 weeks active treatment (60 weeks) | |
| Macrolide + tetracycline | Roxithromycin + doxycycline | Continuous (300 mg + 100 mg daily) | Treatment‐ related | 31 | 101 | 48 weeks follow‐up after 12 weeks active treatment (60 weeks) | |
| Macrolide | Roxithromycin | Continuous (100 mg daily) | Treatment‐ related | 33 | 97 | 48 weeks follow‐up after 12 weeks active treatment (60 weeks) |
We did not identify trials comparing different regimens of the same prophylactic antibiotic (e.g. azithromycin 250 mg daily versus azithromycin 500 mg three times/week). Similarly, we did not identify trials comparing two antibiotics within the same class (e.g. moxifloxacin versus ciprofloxacin, both quinolones).
We identified the following comparisons and outcomes from two studies.
Macrolide plus tetracycline versus macrolide
Primary outcome: number of COPD patients with exacerbations
We did not identify evidence for this outcome.
Primary outcome: time to first moderate or severe exacerbation
Shafuddin 2015 reported the mean time to first moderate or severe exacerbation (days). There was no significant difference between both treatment arms after the active treatment period (mean difference (MD) ‐19.00, 95% confidence interval (CI) ‐52.70 to 14.70; 179 participants; Analysis 1.1).
Primary outcome: quality of life
We analysed data from Shafuddin 2015 as this trial reported each treatment arm separately, which allowed us to compare combined antibiotic treatment (roxithromycin and doxycycline) to single antibiotic treatment (roxithromycin only) (summary of findings Table for the main comparison). The authors did not report a total score for the Chronic Respiratory Questionnaire (CRQ) scale, but reported the mean difference and standard deviations for change in dyspnoea, fatigue, emotional function and mastery sub‐scales from baseline to end of treatment (12 weeks) (Analysis 1.2) or 60 weeks (Analysis 1.3).
At the end of the active treatment at 12 weeks, there was no clinical or statistically significant difference in effect between continuous combined treatment compared to continuous single antibiotic treatment on the CRQ sub‐scales for dyspnoea (MD 0.58, 95% CI ‐0.84 to 2.00; 187 participants; very low‐certainty evidence), fatigue (MD 0.02, 95% CI ‐1.08 to 1.12; 187 participants; very low‐certainty evidence), emotional function (MD ‐0.37, 95% CI ‐1.74 to 1.00; 187 participants; very low‐certainty evidence) or mastery (MD ‐0.79, 95% CI ‐1.86 to 0.28; 187 participants; very low‐certainty evidence). These results did not reach published minimally important differences (MID) for the CRQ sub‐scales for dyspnoea (MID = 3 point increase), fatigue (MID = 4 point increase), or emotional function (MID = 2 point increase) (Jaeschke 1989; Jones 2002) (see summary of findings Table for the main comparison).
Primary outcome: drug resistance
We did not identify evidence for this outcome.
Primary outcome: serious adverse events (all‐cause)
Shafuddin 2015 did not report serious adverse events at 12 weeks (end of treatment), but did measure the outcome at the end of the study at 60 weeks. There was no clear difference in serious adverse events between combined continuous or single continuous antibiotic treatment and the confidence intervals around the effect estimate are wide (odds ratio (OR) 1.00, 95% CI 0.52 to 1.93; 198 participants; very low‐certainty evidence; Analysis 1.4; summary of findings Table for the main comparison). Furthermore, there was no clear difference in treatment‐related serious adverse events with combined continuous antibiotics or single continuous antibiotics, and the effect is also very uncertain (OR 0.37, 95% CI 0.07 to 1.96; 198 participants; Analysis 1.5)
Secondary outcomes: lung function (FEV1 and FVC), mortality (all‐cause), hospitalisations, and adverse events/side effects
Shafuddin 2015 reported data on change in FEV1 (Analysis 1.6) and FVC (Analysis 1.7) at 12 weeks (end of treatment), and mortality (Analysis 1.8); and all‐cause and treatment‐related adverse events at 60 weeks (Analysis 1.9). There were no clinically significant changes in lung function at 12 weeks (very low‐certainty evidence). At 60 weeks, authors found no clear difference in mortality, but the effect estimate is very uncertain (OR 1.63, 95% CI 0.38 to 7.02; 182 participants; very low‐certainty evidence). There was no statistically significant difference in adverse events between combined antibiotic compared with single antibiotics (very low‐certainty evidence). There was one case of an abnormal electrocardiogram (ECG), considered to be related to combined antibiotic treatment (summary of findings Table for the main comparison).
We did not identify any evidence for hospitalisations or number of participants colonised with P aeruginosa.
Quinolone versus tetracycline
Although the aim of the study was to compare prophylactic antibiotics with placebo, the data were presented separately per treatment arm, which allowed the analysis between moxifloxacin and doxycycline (Brill 2015). This comparison included 50 participants, 25 in each of the treatment arms of interest.
Primary outcome: number of COPD patients with exacerbations
Brill 2015 reported the number of people with COPD experiencing one or more exacerbations. At 13 weeks of treatment, fewer people with COPD experienced one or more exacerbations with moxifloxacin (pulsed; 400 mg for 5 days every 4 weeks) in comparison to doxycycline (continuous; 100 mg daily). However, this effect was uncertain as the upper confidence interval crossed the line of no effect and failed to exclude important harm (OR 0.44, 95% CI 0.14 to 1.38; 50 participants; low‐certainty evidence; Analysis 2.1; summary of findings Table 2).
Primary outcome: quality of life
We did not identify evidence for this outcome.
Primary outcome: drug resistance
We did not identify head‐to‐head evidence for this outcome.
Primary outcome: serious adverse events
Brill 2015 measured the number of people with COPD experiencing serious adverse events. At 13 weeks (end of treatment), there were no reported serious adverse events in either the moxifloxacin (pulsed; 400 mg for 5 days every 4 weeks) or doxycycline (continuous; 100 mg daily) arms.
Secondary outcomes: lung function (FEV1 and FVC), mortality (all‐cause), hospitalisations, adverse events/side effects, and number of participants colonised withP aeruginosa
Brill 2015 did not report any deaths during 13 weeks of treatment, and no participants experienced adverse events when treated with moxifloxacin (pulsed; 400 mg for 5 days every 4 weeks) or doxycycline (100 mg daily) after 13 weeks of treatment.
We did not identify evidence for the following outcomes: lung function, hospitalisations, or number of participants colonised withP aeruginosa.
Quinolone versus macrolide
Although the aim of the study was to compare prophylactic antibiotic with placebo, the data were presented separately per treatment arm, which allowed the analysis between moxifloxacin and azithromycin (Brill 2015). This comparison included 50 participants, 25 in each of the treatment arms of interest.
Primary outcome: number of COPD patients with exacerbations
Brill 2015 reported the number of people with COPD experiencing one or more exacerbations. At 13 weeks of treatment, there was no difference in the number of people with COPD experiencing one or more exacerbations with moxifloxacin (pulsed; 400 mg for 5 days every 4 weeks) or azithromycin (intermittent; 250 mg 3 times per week), but the confidence intervals were wide (OR 1.00, 95% CI 0.32 to 3.10; 50 participants; low‐certainty evidence; Analysis 3.1; summary of findings Table 3).
Primary outcome: quality of life
We did not identify evidence for this outcome.
Primary outcome: drug resistance
We did not identify any head‐to‐head evidence for this outcome.
Primary outcome: serious adverse events
Brill 2015 measured the number of people with COPD experiencing serious adverse events. At 13 weeks (end of treatment), there were no reported serious adverse events in either the moxifloxacin (pulsed; 400 mg for 5 days every 4 weeks) or azithromycin (intermittent; 250 mg three times per week) arms.
Secondary outcomes: lung function (FEV1 and FVC), mortality (all‐cause), hospitalisations, adverse events/side effects, and number of participants colonised with P aeruginosa
Brill 2015 reported no deaths during the 13‐week treatment period.
We did not identify any evidence for the following outcomes: lung function, hospitalisations, adverse events/side effects, or number of participants colonised with P aeruginosa.
Macrolide versus penicillin
We did not identify evidence for this comparison.
Macrolide versus tetracycline
Although the aim of the study was to compare prophylactic antibiotic with placebo, the data was presented separately per treatment arm, which allowed the analysis between azithromycin and doxycyline (Brill 2015). This comparison included 50 participants, 25 in each of the treatment arms of interest.
Primary outcome: number of COPD patients with exacerbations
Brill 2015 reported the number of people with COPD experiencing one or more exacerbations. At 13 weeks of treatment, fewer people with COPD experienced one or more exacerbations with azithromycin (intermittent; 250 mg three times per week) in comparison to doxycycline (continuous; 100 mg daily). However, this effect was uncertain as the upper confidence interval crossed the line of no effect and failed to exclude important harm (OR 0.44, 95% CI 0.14 to 1.38; 50 participants; low‐certainty evidence; Analysis 4.1; summary of findings Table 4).
Primary outcome: quality of life
We did not identify evidence for this outcome.
Primary outcome: drug resistance
We did not identify evidence for this outcome.
Primary outcome: serious adverse events
Brill 2015 measured the number of people with COPD experiencing serious adverse events. At 13 weeks (end of treatment), there were no reported serious adverse events in either the azithromycin (intermittent; 250 mg three times per week) or doxycycline (continuous; 100 mg daily) arms.
Secondary outcomes: lung function (FEV1 and FVC), mortality (all‐cause), hospitalisations, adverse events/side effects, and number of participants colonised with P aeruginosa
Brill 2015 reported no deaths during the 13‐week treatment period.
We did not identify evidence for the following outcomes: lung function, hospitalisations, adverse events/side effects or number of participants colonised with P aeruginosa.
Discussion
Summary of main results
Macrolide plus tetracycline versus macrolide
There was no clear benefit or harm of combined continuous roxithromycin plus doxycycline (300 mg plus 100 mg daily) compared to single continuous roxithromycin (300 mg daily) on quality of life as observed on the sub‐scales of the Chronic Respiratory Questionnaire (CRQ) for dyspnoea, fatigue, emotional function, or mastery. Similarly, there was no evidence of benefit or harm on lung function (FEV1 or FVC). No serious adverse events were reported in either treatment group and the effect on mortality was very uncertain (Shafuddin 2015). We were unable to include any evidence on number of people experiencing one or more exacerbations, drug resistance/microbial sensitivity or number of participants colonised with Pseudomonas aeruginosa (P aeruginosa).
Quinolone versus tetracycline
We are uncertain whether moxifloxacin compared to doxycycline has an impact on the number of people experiencing one or more exacerbations at 12 weeks. No serious adverse events or deaths were reported in either treatment group (Brill 2015). We were unable to include any evidence on our other prespecified outcomes.
Quinolone versus macrolide
We are uncertain whether moxifloxacin compared to azithromycin has an impact on the number of people experiencing one or more exacerbations at 12 weeks. No serious adverse events or deaths were reported in either treatment group (Brill 2015). We were unable to include any evidence on our other prespecified outcomes.
Macrolide versus tetracycline
We are uncertain whether azithromycin compared to doxycycline has an impact on the number of people experiencing one or more exacerbations at 12 weeks. No serious adverse events or deaths were reported in either treatment group (Brill 2015). We were unable to include any evidence on our other prespecified outcomes.
Overall completeness and applicability of evidence
We identified two studies, each recruiting a small group of participants. The studies could not be combined due to differences in their aims, the antibiotics investigated and outcomes reported. Therefore, we lack evidence to assess whether one prophylactic antibiotic or regimen is more effective for people with chronic obstructive pulmonary disease (COPD) in terms of exacerbations or quality of life. Importantly, we also lack evidence to comment on which regimens are safer, and whether different regimens are associated with more or less drug resistance. Although one study did report drug resistance to three different antibiotics each compared to placebo, this evidence did not fit the criteria of this review and has been reported in another Cochrane Review (Herath 2018). We do acknowledge, however, that longer and larger studies are needed to determine effects of long‐term antibiotic use. The applicability of the results from these two studies to the general COPD population is uncertain, as the participants either had positive Chlamydophila pneumoniae (C pneumoniae) serology in one study (Shafuddin 2015), or a chronic bronchitis phenotype in the other study (Brill 2015).
It is anticipated that a linked network meta‐analysis (Janjua 2018), will allow comparisons of different prophylactic antibiotics through direct and indirect comparisons and may provide a ranking of prophylactic antibiotics for important outcomes including exacerbations, quality of life and serious adverse events.
Certainty of the evidence
Using the GRADE approach, we assessed the evidence presented in this review as very low‐certainty. Reasons for downgrading included imprecision, indirectness and methodological quality of the included studies.
Brill 2015 was a single‐centre and single‐blinded study as it was not reported that the personnel were blinded to the treatment allocation (Brill 2015). There was also no description of outcome assessor blinding, although blinded participants assessed outcomes such as quality of life. The trial reported outcomes according to their protocol. The aim of the trial was to compare three different prophylactic antibiotics to placebo. This was not a true head‐to‐head study of antibiotics, but we used the data in the trial to compare the three different antibiotics to each other. We were only able to report results for the number of people experiencing one or more exacerbations as the data did not allow us to analyse any other outcomes of interest for this systematic review.
The second study was multi‐centred and double‐blinded. More participants dropped out of the combined antibiotics treatment arm, although the trialists report that reasons were not related to study medication (Shafuddin 2015). The trialists reported all outcomes according to their protocol.
The small sample size of both studies resulted in considerable uncertainty around the true effect and led to downgrading of the all the evidence for imprecision. We also downgraded serious adverse events and mortality by one point for indirectness of the population and intervention. The aim of one of the studies was to assess the eradication of C pneumoniae and not antibiotic prophylaxis. The comparison of interventions was not an inclusion criterion of this systematic review, and both outcomes were measured 48 weeks after the treatment period of 12 weeks. As these were not inclusion criteria prespecified for this systematic review, we downgraded the outcomes further.
Potential biases in the review process
Cochrane methods were adhered to in order to conduct this systematic review and we did not expect there to be any bias in the reviewing process. During the selection of studies, we encountered a study with an unanticipated comparison of interventions. We included this study in this systematic review as it otherwise met our prespecified inclusion criteria. Furthermore, while one of our stated objectives was to assess the comparative safety of prophylactic antibiotic regimens, the limited number of studies meeting our inclusion criteria means that we are unable to comment on this important outcome. We did not search for clinical trial reports or observational data, which may have helped address this objective.
Agreements and disagreements with other studies or reviews
Several systematic reviews have investigated the use of prophylactic antibiotics in COPD compared to placebo or usual care (Donath 2013; Herath 2018; Lee 2013; Ni 2015; Yao 2013). However, we are not aware of any reviews to date that have focused on head‐to‐head comparisons. The majority of evidence for the benefit of antibiotics versus placebo comes from studies of macrolide antibiotics (Herath 2018). This is reflected in current guidelines, which cautiously recommend the use of macrolide antibiotics in selected patients to reduce exacerbations, while acknowledging the lack of evidence for other classes of antibiotic, including quinolones (GOLD 2019; Wedzicha 2017). The planned network meta‐analysis of Janjua 2018 may help resolve the question about the most appropriate choice of antibiotic.

Study flow diagram.

Risk of bias summary: review authors' judgements about each risk of bias item for each included study.

Comparison 1 Macrolide+tetracycline versus macrolide, Outcome 1 Mean time to first exacerbation (days).

Comparison 1 Macrolide+tetracycline versus macrolide, Outcome 2 CRQ quality of life; change; endpoint 12 weeks.

Comparison 1 Macrolide+tetracycline versus macrolide, Outcome 3 CRQ quality of life; change; endpoint 60 weeks.

Comparison 1 Macrolide+tetracycline versus macrolide, Outcome 4 All‐cause serious adverse events; endpoint 60 weeks.

Comparison 1 Macrolide+tetracycline versus macrolide, Outcome 5 Treatment‐related serious adverse events; endpoint 60 weeks.

Comparison 1 Macrolide+tetracycline versus macrolide, Outcome 6 Lung function (FEV1 trough); change; endpoint 12 weeks.

Comparison 1 Macrolide+tetracycline versus macrolide, Outcome 7 Lung function (FVC); change; endpoint 12 weeks.

Comparison 1 Macrolide+tetracycline versus macrolide, Outcome 8 All‐cause mortality; endpoint 60 weeks.

Comparison 1 Macrolide+tetracycline versus macrolide, Outcome 9 All‐cause adverse events; endpoint 60 weeks.

Comparison 1 Macrolide+tetracycline versus macrolide, Outcome 10 Treatment‐related adverse events; endpoint 60 weeks.

Comparison 1 Macrolide+tetracycline versus macrolide, Outcome 11 Lung function (FEV1 % predicted); change; endpoint 60 weeks.

Comparison 1 Macrolide+tetracycline versus macrolide, Outcome 12 Lung function (FEV1 trough); change; endpoint 60 weeks.

Comparison 1 Macrolide+tetracycline versus macrolide, Outcome 13 Lung function (FEV1 % predicted); change; endpoint 12 weeks.

Comparison 1 Macrolide+tetracycline versus macrolide, Outcome 14 Lung function (FVC); change; endpoint 60 weeks.

Comparison 2 Quinolone versus tetracycline, Outcome 1 Number of people with one or more exacerbations.

Comparison 3 Quinolone versus macrolide, Outcome 1 Number of people with one or more exacerbations.

Comparison 4 Macrolide versus tetracycline, Outcome 1 Number of people with one or more exacerbations.
| Macrolide+tetracycline compared to macrolide for chronic obstructive pulmonary disease | ||||||
| Patient or population: chronic obstructive pulmonary disease | ||||||
| Outcomes | Anticipated absolute effects* (95% CI) | Relative effect | № of participants | Certainty of the evidence | Comments | |
| Risk with macrolide | Risk with Macrolide+tetracycline | |||||
| Quality of life, measured by CRQ (dyspnoea, fatigue, emotional function, and mastery subscales) Follow‐up 12 weeks (end of treatment) Scale from 0 to 10. Higher scores on the scale indicates better quality of life | The mean change in CRQ HRQoL (dyspnoea) was 2.21 | MD 0.58 higher | ‐ | 187 | ⊕⊝⊝⊝ | An increase of three points in this domain refers to a clinically significant reduction in dyspnoea (Jaeschke 1989; Jones 2002) |
| The mean change in CRQ HRQoL (fatigue) was 0.68 | MD 0.02 higher | ‐ | 187 | ⊕⊝⊝⊝ | An increase of four points in this domain refers to a clinically significant reduction in fatigue (Jaeschke 1989; Jones 2002) | |
| The mean change in CRQ HRQoL (emotional function) was 0.45 | MD 0.37 lower | ‐ | 187 | ⊕⊝⊝⊝ | An increase of two points in this domain refers to a clinically significant improvement in emotional function (Jaeschke 1989; Jones 2002) | |
| The mean change in CRQ HRQoL (mastery) was 0.53 | MD 0.79 lower | ‐ | 187 | ⊕⊝⊝⊝ | No reported minimally important difference (MID) | |
| All‐cause serious adverse events 60 weeks (end of study) | 237 per 1000 | 237 per 1000 | OR 1.00 | 198 | ⊕⊝⊝⊝ | |
| Lung function (trough FEV1) Change from baseline to 12 weeks (end of active treatment) | The mean change in trough FEV1 was 0.047 L | MD 0.01 L lower | 182 | ⊕⊝⊝⊝ | An improvement of 100 mL (0.1 L) for FEV1 trough is considered clinically significant (Donohue 2005) | |
| All‐cause mortality 60 weeks (end of study) | 31 per 1000 | 49 per 1000 (12 to 183) | OR 1.63 | 198 | ⊕⊝⊝⊝ | |
| Number of people experiencing one or more exacerbations, Drug resistance/microbial sensitivity (as reported by trialists), including emergence of atypical bacteria, Number of participants colonised with Pseudomonas aeruginosa | Information for these outcomes was not presented as data for head‐to‐head comparisons were not available | |||||
| *The risk in the intervention group (and its 95% confidence interval) is based on the assumed risk in the comparison group and the relative effect of the intervention (and its 95% CI). | ||||||
| GRADE Working Group grades of evidence | ||||||
| aThe evidence was downgraded by 1 due to attrition bias in the combined treatment arm. | ||||||
| Quinolone compared with tetracycline for chronic obstructive pulmonary disease | ||||||
| Patient or population: chronic obstructive pulmonary disease | ||||||
| Outcomes | Illustrative comparative risks* (95% CI) | Relative effect | № of Participants | Certainty of the evidence | Comments | |
| Assumed risk | Corresponding risk | |||||
| Quinlone | Tetracycline | |||||
| Number of participants experiencing one or more exacerbations Quinolone versus tetracycline | 600 per 1000 | 398 per 1000 | OR 0.44 | 50 | ⊕⊝⊝⊝ | |
| All‐cause mortality Follow‐up 13 weeks (end of treatment) | ‐ | ‐ | ‐ | 50 (1 RCT) | ‐ | No deaths reported in either treatment arm |
| Quality of life Drug resistance/microbial sensitivity Serious adverse events Lung function Hospitalisations Adverse events/side effects Number of participants colonised with P aeruginosa | Information for these outcomes was not presented as data for head‐to‐head comparisons were not available | |||||
| *The risk in the intervention group (and its 95% confidence interval) is based on the assumed risk in the comparison group and the relative effect of the intervention (and its 95% CI). | ||||||
| GRADE Working Group grades of evidence | ||||||
| aThe evidence was downgraded by 2 due to imprecision. The sample size was small, and the confidence interval crossed the line of no effect, and failed to exclude important harm. | ||||||
| Quinlone compared with macrolide for chronic obstructive pulmonary disease | ||||||
| Patient or population: chronic obstructive pulmonary disease | ||||||
| Outcomes | Illustrative comparative risks* (95% CI) | Relative effect | № of Participants | Certainty of the evidence | Comments | |
| Assumed risk | Corresponding risk | |||||
| Quinlone | Macrolide | |||||
| Number of participants experiencing one or more exacerbations Quinolone versus macrolide | 400 per 1000 | 400 per 1000 | OR 1.00 | 50 | ⊕⊝⊝⊝ | |
| All‐cause mortality Follow‐up 13 weeks (end of treatment) | ‐ | ‐ | ‐ | 50 (1 RCT) | ‐ | No deaths reported in either treatment arm |
| Quality of life Drug resistance/microbial sensitivity Serious adverse events Lung function Hospitalisations Adverse events/side effects Number of participants colonised with P aeruginosa | Information for these outcomes was not presented as data for head‐to‐head comparisons were not available | |||||
| *The risk in the intervention group (and its 95% confidence interval) is based on the assumed risk in the comparison group and the relative effect of the intervention (and its 95% CI). | ||||||
| GRADE Working Group grades of evidence | ||||||
| aThe evidence was downgraded by 2 due to imprecision. The sample size was small, and the confidence interval failed to exclude an important benefit or harm. | ||||||
| Macrolide compared with tetracycline for chronic obstructive pulmonary disease | ||||||
| Patient or population: chronic obstructive pulmonary disease | ||||||
| Outcomes | Illustrative comparative risks* (95% CI) | Relative effect | № of Participants | Certainty of the evidence | Comments | |
| Assumed risk | Corresponding risk | |||||
| Quinlone | Macrolide | |||||
| Number of participants experiencing one or more exacerbations Macrolide versus tetracycline Follow‐up 13 weeks (end of treatment) | 600 per 1000 | 398 per 1000 | OR 0.44 | 50 | ⊕⊝⊝⊝ | |
| All‐cause mortality Follow‐up 13 weeks (end of treatment) | ‐ | ‐ | ‐ | 50 (1 RCT) | ‐ | No deaths reported in either treatment arm |
| Quality of life Drug resistance/microbial sensitivity Serious adverse events Lung function Hospitalisations Adverse events/side effects Number of participants colonised with P aeruginosa | Information for these outcomes was not presented as data for head‐to‐head comparisons were not available | |||||
| *The risk in the intervention group (and its 95% confidence interval) is based on the assumed risk in the comparison group and the relative effect of the intervention (and its 95% CI). | ||||||
| GRADE Working Group grades of evidence | ||||||
| aThe evidence was downgraded by 2 due to imprecision. The sample size was small, and the confidence interval crossed the line of no effect, and failed to exclude important harm. | ||||||
| Study ID | Antibiotic class | Antibiotic | Antibiotic frequency and amount | Number of participants experiencing exacerbations (N) | Total number of participants (N) | Duration of treatment |
| Quinolone | Moxifloxacin | Pulsed (400 mg daily for 5 days every 4 weeks) | 10 | 25 | 13 weeks | |
| Tetracycline | Doxycycline | Continuous (100 mg daily) | 15 | 25 | 13 weeks | |
| Macrolide | Azithromycin | Intermittent (250 mg 3 times per week) | 10 | 25 | 13 weeks |
| Study ID | Antibiotic class | Antibiotic | Antibiotic frequency and amount | Quality of life scale | Mean CRQ (SD) | Total number of participants (N) | Duration of treatment |
| Macrolide+ tetracycline | Roxithromycin + doxycycline | Continuous (300 mg daily + 100 mg daily) | CRQ (dyspnoea) | 2.21 (5.35) | 93 | 12 weeks | |
| Macrolide | Roxithromycin | Continuous (300 mg daily) | CRQ (dyspnoea) | 1.63 (4.53) | 94 | 12 weeks | |
| Macrolide+ tetracycline | Roxithromycin + doxycycline | Continuous (300 mg daily + 100 mg daily) | CRQ (fatigue) | 0.68 (3.79) | 93 | 12 weeks | |
| Macrolide | Roxithromycin | Continuous (300 mg daily) | CRQ (fatigue) | 0.66 (3.87) | 94 | 12 weeks | |
| Macrolide+ tetracycline | Roxithromycin + doxycycline | Continuous (300 mg daily + 100 mg daily) | CRQ (emotional function) | 0.45 (5.04) | 93 | 12 weeks | |
| Macrolide | Roxithromycin | Continuous (300 mg daily) | CRQ (emotional function) | 0.82 (4.48) | 94 | 12 weeks | |
| Macrolide+ tetracycline | Roxithromycin + doxycycline | Continuous (300 mg daily + 100 mg daily) | CRQ (mastery) | 0.53 (3.42) | 93 | 12 weeks | |
| Macrolide | Roxithromycin | Continuous (300 mg daily) | CRQ (mastery) | 1.32 (4) | 94 | 12 weeks | |
| CRQ: Chronic Respiratory Questionnaire | |||||||
| Study ID | Antibiotic class | Antibiotic | Antibiotic frequency and amount | Number of participants experiencing SAEs (n) | Total number of participants (N) | Duration of treatment |
| Quinolone | Moxifloxacin | Pulsed (400 mg daily for 5 days every 4 weeks) | 0 | 25 | 13 weeks | |
| Tetracycline | Doxycycline | Continuous (100 mg daily) | 0 | 25 | 13 weeks | |
| Macrolide | Azithromycin | Intermittent (250 mg 3 times per week) | 0 | 25 | 13 weeks | |
| Macrolide+ tetracycline | Roxithromycin+ doxycycline | Continuous (300 mg + 100 mg daily) | 24 | 101 | 48 weeks follow‐up after 12 weeks active treatment (60 weeks) | |
| Macrolide | Roxithromycin | Continuous (300 mg daily) | 23 | 97 | 48 weeks follow‐up after 12 weeks active treatment (60 weeks) | |
| SAE: serious adverse event | ||||||
| Study ID | Antibiotic class | Antibiotic | Antibiotic frequency and amount | Mean FEV1 (SD) (trough) | Mean FEV1 % predicted (SD) (trough) | Mean FVC (SD) | Total number of participants (N) | Duration of treatment |
| Macrolide + tetracycline | Roxithromycin + doxycycline | Continuous (300 mg + 100 mg daily) | 0.047 (026) | 1.7 (9) | 0.06 (0.46) | 88 | 12 weeks | |
| Macrolide | Roxithromycin | Continuous (300 mg daily) | 0.057 (0.31) | 1.87 (11) | 0.09 (0.55) | 94 | 12 weeks | |
| FEV1: forced expiratory volume in 1 second | ||||||||
| Study ID | Antibiotic class | Antibiotic | Antibotic frequency and amount | All‐cause mortality (n) | Total number of participants (N) | Duration of treatment |
| Macrolide + tetracycline | Roxithromycin + doxycycline | Continuous (300 mg + 100 mg daily) | 5 | 101 | 48 weeks follow‐up after 12 weeks active treatment (60 weeks) | |
| Macrolide | Roxithromycin | Continuous (100 mg daily) | 3 | 97 | 48 weeks follow‐up after 12 weeks active treatment (60 weeks) |
| Study ID | Antibiotic class | Antibiotic | Antibiotic frequency and amount | Adverse event type | Number of participants with adverse events/side effects (n) | Total number of participants (N) | Duration of treatment |
| Macrolide + tetracycline | Roxithromycin + doxycycline | Continuous (300 mg + 100 mg daily) | All‐cause | 73 | 101 | 48 weeks follow‐up after 12 weeks active treatment (60 weeks) | |
| Macrolide | Roxithromycin | Continuous (100 mg daily) | All‐cause | 74 | 97 | 48 weeks follow‐up after 12 weeks active treatment (60 weeks) | |
| Macrolide + tetracycline | Roxithromycin + doxycycline | Continuous (300 mg + 100 mg daily) | Treatment‐ related | 31 | 101 | 48 weeks follow‐up after 12 weeks active treatment (60 weeks) | |
| Macrolide | Roxithromycin | Continuous (100 mg daily) | Treatment‐ related | 33 | 97 | 48 weeks follow‐up after 12 weeks active treatment (60 weeks) |
| Outcome or subgroup title | No. of studies | No. of participants | Statistical method | Effect size |
| 1 Mean time to first exacerbation (days) Show forest plot | 1 | 179 | Mean Difference (IV, Fixed, 95% CI) | ‐19.0 [‐52.70, 14.70] |
| 2 CRQ quality of life; change; endpoint 12 weeks Show forest plot | 1 | Mean Difference (IV, Fixed, 95% CI) | Totals not selected | |
| 2.1 Dyspnoea | 1 | Mean Difference (IV, Fixed, 95% CI) | 0.0 [0.0, 0.0] | |
| 2.2 Fatigue | 1 | Mean Difference (IV, Fixed, 95% CI) | 0.0 [0.0, 0.0] | |
| 2.3 Emotional function | 1 | Mean Difference (IV, Fixed, 95% CI) | 0.0 [0.0, 0.0] | |
| 2.4 Mastery | 1 | Mean Difference (IV, Fixed, 95% CI) | 0.0 [0.0, 0.0] | |
| 3 CRQ quality of life; change; endpoint 60 weeks Show forest plot | 1 | Mean Difference (IV, Fixed, 95% CI) | Totals not selected | |
| 3.1 Dyspnoea | 1 | Mean Difference (IV, Fixed, 95% CI) | 0.0 [0.0, 0.0] | |
| 3.2 Fatigue | 1 | Mean Difference (IV, Fixed, 95% CI) | 0.0 [0.0, 0.0] | |
| 3.3 Emotional function | 1 | Mean Difference (IV, Fixed, 95% CI) | 0.0 [0.0, 0.0] | |
| 3.4 Mastery | 1 | Mean Difference (IV, Fixed, 95% CI) | 0.0 [0.0, 0.0] | |
| 4 All‐cause serious adverse events; endpoint 60 weeks Show forest plot | 1 | Odds Ratio (M‐H, Fixed, 95% CI) | Subtotals only | |
| 5 Treatment‐related serious adverse events; endpoint 60 weeks Show forest plot | 1 | Odds Ratio (M‐H, Fixed, 95% CI) | Subtotals only | |
| 6 Lung function (FEV1 trough); change; endpoint 12 weeks Show forest plot | 1 | Mean Difference (IV, Fixed, 95% CI) | Subtotals only | |
| 7 Lung function (FVC); change; endpoint 12 weeks Show forest plot | 1 | Mean Difference (IV, Fixed, 95% CI) | Subtotals only | |
| 8 All‐cause mortality; endpoint 60 weeks Show forest plot | 1 | Odds Ratio (M‐H, Fixed, 95% CI) | Subtotals only | |
| 9 All‐cause adverse events; endpoint 60 weeks Show forest plot | 1 | Odds Ratio (M‐H, Fixed, 95% CI) | Subtotals only | |
| 10 Treatment‐related adverse events; endpoint 60 weeks Show forest plot | 1 | Odds Ratio (M‐H, Fixed, 95% CI) | Subtotals only | |
| 11 Lung function (FEV1 % predicted); change; endpoint 60 weeks Show forest plot | 1 | Mean Difference (IV, Fixed, 95% CI) | Subtotals only | |
| 12 Lung function (FEV1 trough); change; endpoint 60 weeks Show forest plot | 1 | Mean Difference (IV, Fixed, 95% CI) | Subtotals only | |
| 13 Lung function (FEV1 % predicted); change; endpoint 12 weeks Show forest plot | 1 | Mean Difference (IV, Fixed, 95% CI) | Subtotals only | |
| 14 Lung function (FVC); change; endpoint 60 weeks Show forest plot | 1 | Mean Difference (IV, Fixed, 95% CI) | Subtotals only | |
| Outcome or subgroup title | No. of studies | No. of participants | Statistical method | Effect size |
| 1 Number of people with one or more exacerbations Show forest plot | 1 | Odds Ratio (M‐H, Fixed, 95% CI) | Subtotals only | |
| Outcome or subgroup title | No. of studies | No. of participants | Statistical method | Effect size |
| 1 Number of people with one or more exacerbations Show forest plot | 1 | Odds Ratio (M‐H, Fixed, 95% CI) | Subtotals only | |
| Outcome or subgroup title | No. of studies | No. of participants | Statistical method | Effect size |
| 1 Number of people with one or more exacerbations Show forest plot | 1 | Odds Ratio (M‐H, Fixed, 95% CI) | Subtotals only | |