Imaginería motora para la rehabilitación de la marcha después de sufrir un ictus
Resumen
Antecedentes
La imaginería motora (IM) se define como un ejercicio practicado mentalmente en el que se imagina el movimiento pero no se realiza. La técnica incluye movimientos corporales imaginarios repetitivos o la práctica de actos imaginarios para mejorar el rendimiento motor.
Objetivos
Evaluar los efectos del tratamiento de la IM para mejorar la capacidad de caminar de las personas después de sufrir un accidente cerebrovascular.
Métodos de búsqueda
Se hicieron búsquedas en el registro del Grupo Cochrane de Accidentes cerebrovasculares, CENTRAL, MEDLINE, Embase y en otras siete bases de datos. También se buscó en registros de ensayos y listas de referencias. Las últimas búsquedas se realizaron el 24 de febrero de 2020.
Criterios de selección
Ensayos controlados aleatorizados (ECA) que utilizan la IM sola o asociada con la observación de la acción o la práctica física para mejorar la marcha de las personas después de sufrir un accidente cerebrovascular. El desenlace crítico fue la capacidad de caminar, evaluada mediante una variable continua (velocidad de marcha) o una variable dicotómica (dependencia de la asistencia personal). Los desenlaces importantes incluyeron la resistencia al caminar, la función motora, la movilidad funcional y los episodios adversos.
Obtención y análisis de los datos
Dos autores de la revisión seleccionaron de forma independiente los ensayos según los criterios de inclusión predefinidos, extrajeron los datos, evaluaron el riesgo de sesgo y aplicaron el método GRADE para evaluar la certeza de la evidencia. Los autores de la revisión contactaron con los autores de los estudios para obtener aclaraciones y por los datos faltantes.
Resultados principales
Se incluyeron 21 estudios con un total de 762 participantes. Los participantes se encontraban en las etapas aguda, subaguda o crónica del accidente cerebrovascular y tenían una edad media de entre 50 y 78 años. Todos los participantes presentaron al menos algún déficit en la marcha. Todos los estudios compararon la IM con otras terapias. La mayoría de los estudios incluidos usaron la MI asociada con la práctica física en los grupos experimentales. El tiempo de tratamiento de los grupos experimentales osciló entre dos y ocho semanas. Hubo un riesgo alto de sesgo para al menos un dominio evaluado en 20 de los 21 estudios incluidos.
Con respecto al desenlace crítico, hubo evidencia de certeza muy baja de que la IM tuvo efectos más beneficiosos para mejorar la marcha (velocidad al caminar) en comparación con otras terapias al final del tratamiento (diferencia de medias estandarizada (DME) combinada 0,44; intervalo de confianza (IC) del 95%: 0,06 a 0,81; p = 0,02; seis estudios; 191 participantes; I² = 38%). No se incluyó el desenlace de la dependencia de la asistencia personal en el metanálisis, porque sólo un estudio proporcionó información sobre el número de participantes que se volvieron dependientes o autónomos después de las intervenciones.
Para los desenlaces importantes, hubo evidencia de certeza muy baja de que la IM no tuvo efectos más beneficiosos que otras intervenciones para mejorar la función motora (diferencia de medias combinada (DM) 2,24; IC del 95%: ‐1,20 a 5,69; p = 0,20; tres estudios; 130 participantes; I² = 87%) y la movilidad funcional al final del tratamiento (DME combinada 0,55; IC del 95%: ‐0,45 a 1,56; p = 0,09; cuatro estudios; 116 participantes; I² = 64,2%). No se observaron episodios adversos en los estudios que informaron de este desenlace (siete estudios). No se pudieron reunir datos sobre la resistencia al caminar y todos los demás desenlaces en el seguimiento.
Conclusiones de los autores
Se encontró evidencia de certeza muy baja de los efectos beneficiosos a corto plazo de la IM sobre la velocidad de marcha en las personas que han sufrido un accidente cerebrovascular, en comparación con otras terapias. La evidencia era insuficiente para estimar el efecto de la IM en la dependencia de la asistencia personal y la resistencia al caminar. En comparación con otras terapias, la evidencia indica que la IM no mejora la función motora y la movilidad funcional después de sufrir un accidente cerebrovascular (evidencia de certeza muy baja). La evidencia tampoco fue suficiente para estimar el efecto de la IM sobre la marcha, la función motora y la movilidad funcional después de un accidente cerebrovascular en comparación con el placebo o la no intervención. La imaginería motora y otras terapias utilizadas para la rehabilitación de la marcha después de un accidente cerebrovascular no parecen causar episodios adversos significativos.
PICO
Resumen en términos sencillos
Imaginería motora para la rehabilitación de la marcha
Pregunta de la revisión
¿Es la imaginería motora (IM) una técnica efectiva para mejorar la marcha (capacidad de andar) tras sufrir un ictus?
Antecedentes
La incapacidad para andar tras sufrir un ictus afecta a la independencia, movilidad, las actividades cotidianas y la participación en actividades de la comunidad. La IM es un tipo de terapia que utiliza la imaginación del movimiento (sin moverse realmente). Se ha recomendado en la rehabilitación de personas que han sufrido un ictus para fomentar el reaprendizaje del movimiento.
Características de los estudios
La fecha de la búsqueda más reciente fue el 24 de febrero de 2020. Se incluyeron 21 estudios, con 762 participantes (60% hombres y 40% mujeres), y una edad media que oscilaba entre los 50 y los 78 años. Los participantes incluidos en los estudios se encontraban en diferentes puntos temporales después del ictus, y la etiología (causas del ictus) también fue diversa. Todos los participantes podían caminar con alguna dificultad. Todos los estudios incluidos compararon la IM con otra intervención, y la práctica física fue la terapia más aplicada en los grupos de comparación (control). En los grupos experimentales, la mayoría de los estudios incluidos utilizaron la IM combinada con la práctica física, y utilizaron la IM cinestésica (cuando alguien se imagina a sí mismo) o visual (cuando el individuo observa a otra persona). El tiempo de tratamiento de los grupos experimentales osciló entre dos y ocho semanas. En general, sólo tres de los estudios incluidos realizaron una evaluación de seguimiento después de las intervenciones.
Resultados clave
Se encontró evidencia de certeza muy baja de que la IM sola o combinada con la observación de la acción (un tipo de imaginería en la que los pacientes observan el movimiento) o la práctica física era superior a otras terapias para mejorar la velocidad al caminar en un período corto. Sin embargo, hay evidencia de certeza muy baja de que la IM no tuvo efectos más beneficiosos que otras terapias para mejorar la función motora y la movilidad funcional al final del tratamiento. No hubo evidencia suficiente para evaluar el efecto de la IM en la autonomía para realizar actividades cotidianas y la resistencia al caminar después de sufrir un ictus, ni para evaluar los efectos a mediano o largo plazo de la IM en todos los desenlaces evaluados. Aunque se notificaron de manera deficiente, no se observaron episodios adversos relacionados con la IM y otras terapias. Se desconoce si la marcha de las personas que han sufrido un ictus podría beneficiarse de la IM en comparación con el placebo o la no intervención.
Certeza de la evidencia
Se clasificó la certeza de la evidencia como muy baja porque muchos estudios presentaban cuestiones metodológicas preocupantes y un número pequeño de participantes, y no se siguieron las directrices sobre la forma en que debían comunicarse los estudios.
Authors' conclusions
Summary of findings
| Motor imagery compared to other therapies (control) for gait rehabilitation after stroke (only outcomes immediately after intervention) | ||||||
| Patient or population: People performing gait rehabilitation after stroke | ||||||
| Outcomes | Anticipated absolute effects* (95% CI) | Relative effect | No of participants | Certainty of the evidence | Comments | |
|---|---|---|---|---|---|---|
| Risk with control | Risk with MI | |||||
| Walking speed | ‐ | The mean walking speed in the intervention groups was0.44 standard mean difference higher (0.06 to 0.81 higher) | ‐ | 191 | ⊕⊝⊝⊝ | Evidence suggests that MI may increase walking speed |
| Motor function | ‐ | The mean motor function in the intervention groups was 2.24mean difference higher | ‐ | 130 | ⊕⊝⊝⊝ | MI results show little or no difference in motor function |
| Functional mobility | ‐ | The mean functional mobility in the intervention groups was 0.55 standard mean difference higher | ‐ | 116 | ⊕⊝⊝⊝ | MI results show in little or no difference in functional mobility |
| Dependence on personal assistance | See comment | Not estimable | 385 | ‐ | Due to the lack of data in the studies regarding this outcome it was not possible to perform the meta‐analysis | |
| Walking endurance | See comment | ‐ | 30 | ‐ | Due to not reaching the minimum number of studies (2), it was not possible to perform the meta‐analysis | |
| Adverse events (including pain, falls and all‐cause deaths) | See comment | Not estimable | 252 | ‐ | No adverse events were related to the interventions | |
| *The risk in the intervention group (and its 95% confidence interval) is based on the assumed risk in the comparison group and the relative effect of the intervention (and its 95% CI). | ||||||
| GRADE Working Group grades of evidence | ||||||
| aDowngraded due to several ratings with 'high' or 'unclear' risk of bias for random sequence generation, allocation concealment or blinding of outcome assessment. bSmall sample size (< 400). cWide confidence interval. dModerate or substantial heterogeneity (> 50%). | ||||||
Background
Description of the condition
According to the World Health Organization (WHO), cardiovascular diseases are the leading cause of death worldwide, accounting for 17.7 million deaths in 2015. Of these, 6.7 million were directly attributed to stroke, making it one of the main non‐communicable causes of death. Stroke can be defined as an acute event caused by a blockage or bleeding that prevents blood from flowing to the brain, often resulting in motor symptoms such as muscle weakness. Stroke represents one of the leading healthcare expenditures and is the second highest cause of disability (WHO 2017). Around 15% to 30% of people with stroke exhibit persistent functional disability, and only 13% of stroke survivors return to work (Chumney 2010; Rayegani 2016).
It is estimated that three months after stroke, 70% of stroke survivors walk at a reduced speed, and 20% remain wheelchair‐bound (Dujovic 2017; Sakuma 2014). The literature reports a direct relationship between motor deficit and function (Jørgensen 1995; Langhorne 2009). Post‐stroke gait disability diminishes independence, mobility, activities of daily living, and participation in community activities (Mikołajewska 2017). Thus, one of the most important goals of post‐stroke rehabilitation is to restore gait pattern and achieve fast walking so that people who have had a stroke can perform their activities of daily living without complications (Chiu 2000; Ji 2015; Whitall 2004). In this respect, evidence indicates that specific high‐intensity repetitive task training improves the process of gait rehabilitation (French 2016; Langhorne 2009; Mehrholz 2017).
Description of the intervention
Exercises involving direct walking practice have been used to improve gait, such as treadmill training (Mehrholz 2017), and overground physical therapy gait training (States 2009), but activities that mimic walking, including imagery/mental practice, have also been used (Barclay 2015). Movement representation techniques, also referred to as mental practice, can be defined as any type of therapy that uses the representation of movement, specifically observation or imagination, or both. These interventions are mirror therapy, action observation, and motor imagery (MI) (Thieme 2016). Mirror therapy is defined as an intervention that uses a mirror to create a reflection of the non‐affected upper or lower limb, and thus provides the individual with normal visual feedback of movement (Ramachandran 1994; Thieme 2016). Action observation refers to the visual perception of a given action performed by others. In the observation, actual performance by another person, or as video or virtual setups, can be used (Thieme 2016). In this review, we will explore the effect of MI.
MI is defined as a mentally rehearsed task in which movement is imagined but is not executed (Kim 2018; Mulder 2007). Because MI is independent of residual motor function, it may provide a substitute for executed movement as a means to activate the motor network (Sharma 2006). This way, the approach includes repetitive imagined body movements or rehearsing imagined acts with the aim to improve motor performance (Carrasco 2016; Li 2017). Motor imagery was initially used to improve athletic performance (Driediger 2006), and has subsequently been suggested for the rehabilitation of people with stroke to promote motor relearning (Driediger 2006; Liu 2004; Moura 2012).
MI for rehabilitation can be conducted in two forms: external or visual, in which people imagine from the standpoint of an external observer (third‐person imagination); and internal or kinesthetic, where people imagine the sensation of their body moving (first‐person imagination) (Carrasco 2016). While the ability to internally represent and to produce actions have common aspects, studies have indicated a dissociation of these processes, which can help to explain why individuals with stroke may be able to generate internal action representations even though they do not have the ability to perform a movement (Johnson 2000; Johnson 2002a). In fact, it is still unclear how well people with stroke are able to perform MI, but it appears that most of these individuals retain their ability for MI (Braun 2017; Johnson 2000; Johnson 2002a). Over the past two decades, whether separately or combined with physical practice (where the movement is executed), MI has demonstrated promising results for rehabilitating gait after stroke (Dickstein 2004; Hwang 2010; Lamontagne 2004). For example, results are promising for increased gait speed (Beyaert 2015; Dickstein 2004).
How the intervention might work
In 1996, Decety suggested that imagining movement activates the same brain areas that are activated when the movements are actually executed. These findings reinforce the idea that if mental stimulation of the action triggers neural activation of relevant motor areas, we can therefore 'exercise' the brain in the absence of a physical movement (Decety 1996).
The neurophysiological basis underlying MI consists of the mirror neuron system, located in the rostral portion of the inferior parietal lobule, pars opercularis of the inferior frontal gyrus and the ventral portion of the premotor cortex. The units that make up this system (mirror neurons) are a class of visuomotor neurons that are activated during execution or observation of movements aimed at an objective (Garrison 2010). During MI, the motor areas involved in the process are the primary motor cortex and several pre‐motor areas, including the supplementary motor area, pre‐supplementary motor area, and ventral and dorsal parts of the premotor cortex (Jeannerod 1995; Kim 2018). These areas are activated during both motor execution and motor imagery tasks; indeed, functional imaging studies have observed activation of brain regions upon motor execution and motor imagery (Johnson 2002b; Lotze 1999; Wang 2016).
A number of hypotheses have been proposed to elucidate the MI functioning mechanism. The first is the mental simulation theory (Munzert 2009), which states that a neural motor network is activated by imagining motor actions (Jeannerod 2001). This activation includes pre‐motor and motor areas and subcortical areas of the brain (Lotze 1999), and basal ganglia (Bonda 1995). In this respect, these subliminal activations improve an individual's learning (Barclay‐Goddard 2011). A second hypothesis proposes that individuals involved in MI rehearse elements of the task, giving them the opportunity to foresee the outcomes of their actions based on previous experience. Therapy participants anticipate possible action trajectories, which they are more likely to use to perform when executing a real movement. As such, individuals develop more efficient ways to approach outcomes (Barclay‐Goddard 2011). Although the exact MI functioning mechanism has not fully been clarified, recent evidence indicates cortical reorganization in people with stroke after treatment with MI, which could result in better gait recovery in this population (Guerra 2017). It is believed that cortical reorganization occurs due to increased primary motor activity, which in turn raises sensorimotor cortex recruitment, resulting in functional improvements (Sun 2013).
Why it is important to do this review
Stroke is considered to be a serious public health issue worldwide, leading to an increasing number of survivors with disabilities (Chumney 2010; Rayegani 2016). Gait recovery is a key aim of post‐stroke rehabilitation, given that it enables survivors to resume most daily activities, reducing the incidence of falls, and other factors that pose a risk to this population. However, stroke survivors may undergo lengthy and challenging treatments, resulting in adoption of passive attitudes to rehabilitation. Motor imagery is an easy, safe, and less tiring technique that increases survivor participation and motivation. Furthermore, MI does not require specific equipment, and is considered to be a low‐cost procedure (Decety 1993; Dickstein 2004; Hosseini 2012). Nevertheless, there is currently insufficient evidence to indicate the best treatment to improve walking after stroke (Barclay 2015).
Recent studies show positive gait rehabilitation results from MI, such as increased lower limb muscle strength and better walking performance in people following stroke (Kumar 2016; Oostra 2015). However, confirming the efficacy of MI in post‐stroke gait requires a thorough investigation of experimental studies on the issue, given that results do not appear to be consistent. Both therapy results and methodological quality of studies need to be assessed, given that treatment protocols vary considerably.
There is a wide variety of intervention protocols that differ in aspects such as frequency of exposure to MI, movements and tasks performed, and duration of therapy (Carrasco 2016). Furthermore, few clinical trials on MI present high methodological quality (Guerra 2017; Winstein 2016). To date, there has been no Cochrane Review exploring the effects of MI on gait among stroke survivors. By conducting a systematic review and meta‐analysis, and assessing the methodological quality of the studies, this review should provide support for evidence‐based clinical decisions. In addition, it will also highlight where further research is needed.
Objectives
To assess the treatment effects of MI for enhancing ability to walk among people following stroke.
Methods
Criteria for considering studies for this review
Types of studies
We included published and unpublished randomized controlled trials (RCTs), including those available only in summary form. We also included cross‐over trials (using data only from the first phase), provided that allocation of interventions was random. We excluded quasi‐experimental or non‐randomized studies. We included studies regardless of publication date or language.
Types of participants
We included studies in which participants presented with a clinical diagnosis of stroke of any type (including subarachnoid hemorrhage). Eligible participants were at least 18 years of age, of any sex, with any degree of severity of the disease, and at any stage after stroke. We excluded studies in which participants had a mixed etiology of the disease (e.g. acquired brain injury), unless data were available for individuals who only had a stroke.
Types of interventions
We included studies that used MI for gait improvement in people with stroke. We considered the concept of MI as an approach in which the individual imagines the movement, or part of it,without its actual execution. Thus, we selected studies comparing:
-
MI alone or associated with action observation, physical activity, or functional gait training versus other therapies (including conventional physical therapy);
-
MI alone or associated with action observation, physical activity or functional gait training versus placebo; and
-
MI alone or associated with action observation, physical activity or functional gait training versus no therapy.
Types of outcome measures
We extracted the outcomes of interest from the baseline and the evaluation at the end of the intervention period (immediate effects) and follow‐up (medium‐ or long‐term effects). Measures of medium‐term effects were considered as those collected between two weeks to six months after treatment had ended, and measures of long‐term effects if collected more than six months after treatment had ended.
Primary outcomes
The critical outcome was ability to walk, verified using the following continuous and dichotomous variables.
-
Continuous variable: walking speed, measured by biomechanical analysis or walking tests, or both, considering both preferable/comfortable walking speed and fastest walking speed.
-
Dichotomous variable: dependence on personal assistance. According to Mehrholz and colleagues, dependence was defined "as the inability to walk indoors (with or without a gait aid) without personal assistance or supervision" (Mehrholz 2017). If reported, we used data from functional scales related to walking to define the level of dependence. We considered the following scales and scores (Mehrholz 2017):
-
Motor Assessment Scale (MAS) (Carr 1985), score of 2 or less for the walking item;
-
Functional Independence Measure (Hamilton 1994), score of 5 or less for the walking item;
-
Barthel Index (Collin 1988), score of 3 (independent, but may use any aid) or less for the ambulation item;
-
Rivermead Mobility Index (Collen 1991), an answer of 'no' to the 'walking inside with an aid if necessary' item; and
-
Functional Ambulation Category (FAC) (Holden 1984), score of 2 or less.
-
Secondary outcomes
-
Walking endurance (distance covered, in meters), measured by Six‐Minute Walk Test or Two‐Minute Walk Test.
-
Motor function, measured by the Fugl‐Meyer Assessment Scale (Fugl‐Meyer 1975), or Motor Assessment Scale.
-
Functional mobility (including gait), measured by Rivermead Mobility Index or Timed Up and Go Test (Podsiadlo 1991).
-
Adverse events (including pain, falls, and all‐cause deaths).
When included studies cited more than one measure for each outcome, we considered the Six‐Minute Walk Test for walking endurance, the Fugl‐Meyer Assessment Scale for motor function, and the Rivermead Mobility Index for functional mobility.
Search methods for identification of studies
See the 'Specialized register' information at the Cochrane Stroke Group's website. We searched for trials in all languages and arranged for translation of relevant articles where necessary.
Electronic searches
We searched the Cochrane Stroke Group trials register (last searched on 3 February 2020) and the following electronic databases.
-
Cochrane Central Register of Controlled Trials (CENTRAL) (Cochrane Library; Issue 2 of 12, February 2020; last searched 3 February 2020) (Appendix 1);
-
MEDLINE Ovid (from 1946 to January 31, 2020; last searched 3 February 2020) (Appendix 2);
-
Embase Ovid (1980 to 2020 Week 05; last searched 3 February 2020) (Appendix 3);
-
CINAHL EBSCO (Cumulative Index to Nursing and Allied Health Literature; from 1982 to present; last searched 3 February 2020) (Appendix 4);
-
PsycINFO Ovid (from 1806 to January 2020 Week 4; last searched 3 February 2020) (Appendix 5);
-
AMED Ovid (Allied and Complementary Medicine; from 1985 to January 2020; last searched 3 February 2020) (Appendix 6);
-
LILACS Bireme (Latin American and Caribbean Health Science Information database; from 1982 to present; last searched 24 February 2020) (Appendix 7);
-
SPORTDiscus EBSCO (from 1949 to present; last searched 3 February 2020) (Appendix 8);
-
PEDro (Physiotherapy Evidence Database; www.pedro.org.au/) (24 February 2018) (Appendix 9);
-
REHABDATA National Rehabilitation Information Center (www.naric.com/?q=en/REHABDATA) (24 February 2018) (Appendix 10).
We developed the MEDLINE search strategy with the help of the Cochrane Stroke Group Information Specialist and we adapted it for the other databases where appropriate. All search strategies deployed were combined with subject strategy adaptations of the highly sensitive search strategy designed by Cochrane for identifying RCTs and controlled clinical trials (as described in the Cochrane Handbook for Systematic Reviews of Interventions Chapter 6, Lefebvre 2011).
We also searched the following trials registries.
-
US National Institutes of Health Ongoing Trials Register ClinicalTrials.gov (www.clinicaltrials.gov/) (last searched 3 February 2020) (Appendix 11).
-
World Health Organization (WHO) International Clinical Trials Registry Platform (who.int/ictrp/en/) (last searched 3 February 2020) (Appendix 12).
-
Stroke Trials Registry (www.strokecenter.org/trials/) (October 15, 2018) (Appendix 13).
Searching other resources
In an effort to identify further published, unpublished and ongoing trials, we did the following:
-
screened the reference lists of relevant studies to identify further studies for potential inclusion in the review;
-
used Science Citation Index Cited Reference search for forward tracking of relevant articles;
-
contacted study authors, researchers and experts in the field to obtain additional information on relevant trials; and
-
searched for PhD and MSc theses (using ProQuest Thesis database and British Library Ethos database).
Data collection and analysis
Selection of studies
Two review authors (LS and LL) independently screened titles and abstracts of the references obtained from our searching activities and excluded obviously irrelevant reports. We retrieved the full‐text articles for the remaining references. The same two review authors independently screened the full‐text articles to identify studies for inclusion, and identified and recorded reasons for exclusion of the ineligible studies. We resolved any disagreements through discussion, or we consulted a third review author (TR) when required. We gathered multiple reports of the same study so that each study, and not each reference, is the unit of interest in the review. We recorded the selection process and completed a PRISMA flow diagram.
Data extraction and management
Two review authors (LS and LL) independently extracted data from the included studies. When data were lacking or details were unclear, we contacted the study authors for clarification. When there was disagreement regarding data collection, a third review author checked the data (TR). The data collected were:
-
method used: objectives, study design, instruments used, total duration of the study, form of randomisation, secrecy of the allocation, blindness of the evaluators, institutions or study centers involved, study site, withdrawal and withdrawal of the participants and year of study;
-
participants: sample size, age, sex, diagnostic criteria, inclusion and exclusion criteria, severity of stroke and stage (acute/subacute and chronic);
-
intervention: we used the 'Template for intervention description and replication' (TIDieR) checklist and guide to extract data about interventions (Hoffmann 2014); we considered all the 12 points on the TIDierR checklist;
-
results: critical and important outcomes for each assessment and reassessment; and
-
notes: funding for experimentation and notable conflicts of interest of the study authors.
Assessment of risk of bias in included studies
Two review authors (LS and LL) independently assessed risk of bias for each study using Cochrane's 'Risk of bias' tool (Higgins 2011). We resolved any disagreements by discussion or by involving another review author (TR). We assessed the risk of bias according to the following domains.
-
Random sequence generation
-
Allocation concealment
-
Blinding of participants and personnel
-
Blinding of outcome assessment
-
Incomplete outcome data
-
Selective outcome reporting
-
Any other bias.
We graded any identified biases using table 8.5.a of the Cochrane Handbook for Systematic Reviews of interventions (Higgins 2011). This table provides criteria for analysis and judgement of risk of bias in each of the seven domains. We classified risk of bias in each domain as high, low, or unclear, and we justified each decision and recorded this information in the 'Risk of bias' tables.
The assessment of risk of bias for blinding of participants and personnel depended on the influence that lack of blinding would have. If the participants and personnel were not blinded, and after judging that the outcome measure could be influenced by the knowledge of participants and personnel about which intervention was provided, we assigned a high risk of bias. If we judged that the outcome measure would not be influenced by the knowledge of participants and personnel about the intervention, we assigned a low risk of bias, whether or not the blinding of participants and personnel had happened.
Measures of treatment effect
We measured treatment effects for continuous outcomes using the mean difference (MD) (if at least two studies reported the same outcome measures) or the standardized mean difference (SMD) (when different outcome measures were used). For dichotomous outcomes, we used the risk ratio (RR). We presented the results for each outcome with 95% confidence intervals (CI).
Unit of analysis issues
When we identified cluster‐randomized studies or any non‐parallel designs, we considered their inclusion, following guidance in Chapter 16 of the Cochrane Handbook for Systematic Reviews of Interventions (Higgins 2011).
Dealing with missing data
We contacted authors of respective studies to request missing information. When we were unable obtained the missing data from study authors and we considered that the missing data might introduce serious bias, we conducted a sensitivity analysis to explore the impact of including such studies in the overall assessment of results. We performed an available case analysis, i.e. we included data for only those participants whose results are known, without assumptions for imputing data. We considered the amount of missing data when determining the risk of bias of each included study.
Assessment of heterogeneity
We visually assessed forest plots, verifying overlap in the confidence intervals of studies (poor overlap may indicate statistical heterogeneity) (Deeks 2011). In addition, we used the I² statistic to measure heterogeneity among trials in each analysis. Values of I² greater than 50% may represent substantial heterogeneity (Deeks 2011).
We explored the reasons for heterogeneity (e.g. setting, participants, interventions, design, and risk of bias). When we found that heterogeneity was caused by one or two studies with peripheral results conflicting with the rest of the studies, we carried out analyses with and without these studies as part of the sensitivity analysis.
Assessment of reporting biases
We planned to examine the presence of publication bias by visual inspection of funnel plot if 10 or more trials were included (Higgins 2011). We attempted to avoid language bias by including trials irrespective of language of publication, and we also provided translation to English when needed. In cases of possible multiple publications from the same trial, we contacted study authors to check whether these publications were duplicates. When we were unable to obtain the necessary information from study authors, we made a judgement based on consideration of criteria such as the recruitment site, trial dates, registry numbers, and whether there were similar or identical patient characteristics in each study. For assessment of selective reporting, when the study protocol or trial registry was available, outcomes in the protocol or trial registry and in the published study were compared. If not, we examined if the outcomes listed in the methods section of a study were reported in the results.
Data synthesis
We analyzed data using Review Manager 5 software (Review Manager 2014), and pooled data for meta‐analysis when we considered studies to be sufficiently similar in terms of participants, interventions, comparisons, and outcomes. We used the random‐effects model for meta‐analysis.
GRADE and 'Summary of findings' table
We created a 'Summary of findings' table using the following outcomes: walking speed, dependence on personal assistance, walking endurance, motor function, functional mobility, and adverse events.
The following comparison is reported in the 'Summary of findings' tables:
-
Motor imagery (alone or associated with action observation or physical practice) versus other therapies (outcomes immediately after intervention).
We planned to prepare another 'Summary of findings' table for medium‐ and long‐term effects. However, it was not possible due to the lack of follow‐up data.
We reported the number of studies and participants, the relative effect, direction of effect, and the certainty of the evidence (GRADE) for each outcome.
We used the five GRADE considerations (study limitations, consistency of effect, imprecision, indirectness and publication bias) to assess the certainty of a body of evidence as it relates to the studies that contribute data to the meta‐analyses for the pre‐specified outcomes (Atkins 2004). We used methods and recommendations described in Section 8.5 and Chapter 12 of the Cochrane Handbook for Systematic Reviews of Interventions (Higgins 2011) using GRADEpro GDT software (GRADEpro GDT 2015). We justified all decisions to downgrade the quality of studies using footnotes, and made comments to aid the reader's understanding of the review where necessary.
Subgroup analysis and investigation of heterogeneity
We planned to undertake subgroup analyses for all outcomes when feasible to explore the influence of the following:
-
type of stroke: ischemic or hemorrhagic;
-
post‐stroke time: acute (less than one month post‐stroke), subacute (between one and six months post‐stroke) and chronic (more than six months after stroke);
-
length of treatment period or treatment dose;
-
type of treatment: MI alone or MI associated with action observation or physical practice (physical activity or functional gait training);
-
walking dependence: independent or dependent of personal assistance (human support or supervision) at the beginning of the study.
Sensitivity analysis
We planned to perform sensitivity analyses for all outcomes when we suspected that missing data introduced important bias, and to assess heterogeneity caused by studies with peripheral results. Furthermore, we carried out the sensitivity analyses by excluding studies from the analysis that were at high risk of bias in one or more of these three domains:
-
allocation concealment;
-
blinding of outcome assessment;
-
random sequence generation.
Results
Description of studies
See Characteristics of included studies; Characteristics of excluded studies; Characteristics of ongoing studies
Results of the search
Our searches identified 4769 references. After removal of duplicates, we screened titles and abstracts, and identified 61 potentially eligible references. After reading the full texts of these references, we selected 21 studies for inclusion in the review. The results of the search are summarized in the PRISMA study flow diagram (Figure 1).
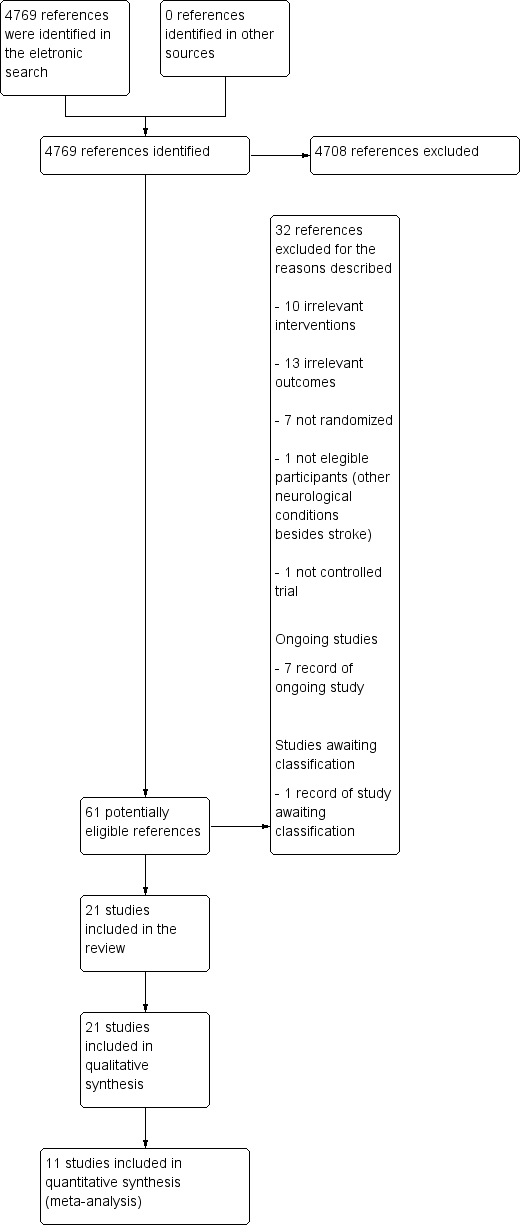
4747Study flow diagram.
Included studies
We included 21 studies in this review (Braun 2012; Cho 2012; Dickstein 2013; Dickstein 2014; Gupta 2017; Kim 2013a; Kumar 2013a; Kumar 2016; Lee 2010; Lee 2011; Lee 2015; Liu 2004; Liu 2009; Oostra 2015; Park 2019; Schuster 2012; Suvadeep 2017; Verma 2011; Yan 2013; Zhang 2013; Zhu 2017). We found one study (an abstract) that referred to the same authors and contained the same data in terms of sample size, interventions, number of participants in each group, outcomes, and results. To avoid duplication, we chose to use the most recent study (Oostra 2015) because data were already fully analyzed, thus providing the most comprehensive results.
Design
We identified 21 RCTs, including one multicenter trial (Braun 2012), two pilot studies (Kumar 2013a; Schuster 2012), and three crossover trials (Dickstein 2013; Dickstein 2014; Zhang 2013).
Sample characteristics
The 21 studies involved a total of 762 participants. The mean age of the participants ranged from 50 years (Oostra 2015), to 78 years (Braun 2012). The sample consisted of 60% men and 40% women. Four studies included participants in the subacute stroke stage (one to six months after stroke) (Gupta 2017; Oostra 2015; Suvadeep 2017; Verma 2011), six in the chronic stroke stage (more than six months after stroke) (Cho 2012; Dickstein 2013; Dickstein 2014; Kim 2013a; Lee 2015; Park 2019), and 11 studies did not report or did not make clear the stroke stage. Fourteen studies specified stroke etiology. Two recruited only participants with ischemic stroke (Liu 2004; Liu 2009) and 12 recruited participants with either ischemic or hemorrhagic stroke (Cho 2012; Dickstein 2013; Dickstein 2014; Kim 2013a; Kumar 2016; Lee 2010; Lee 2015; Oostra 2015; Park 2019; Schuster 2012; Verma 2011; Zhang 2013). Five studies reported the dependence of the participants on personal assistance to walk at study baseline. Three studies reported that participants were either dependent or independent at the beginning of the study (Dickstein 2013; Kumar 2016; Oostra 2015), and three studies reported that participants were considered independent at study entry (Lee 2011; Lee 2015; Verma 2011).
For inclusion and exclusion criteria, see Characteristics of included studies.
Settings
Six studies were carried out in rehabilitation centers (Cho 2012; Kumar 2016; Lee 2011; Oostra 2015; Park 2019; Schuster 2012) and eight studies were conducted in a hospital setting (Dickstein 2013; Lee 2015; Liu 2004; Liu 2009; Verma 2011; Yan 2013; Zhang 2013; Zhu 2017). One study was conducted in a nursing home (Braun 2012), and one was carried out in a community center (Dickstein 2014). In the five other studies, the setting was unclear or not reported.
Interventions
All included studies used MI alone or associated with action observation, physical activity, or functional gait training in the experimental groups. The following interventions and comparisons were used for the trials (see Table 1: General characteristics of included studies).
| Included Studies | Experimental Group | Control Group | Frequency and duration | Motor Imagery Protocols |
|---|---|---|---|---|
| During therapy, imagery attempts and overt movements are combined: movements are performed to generate sensory information, which are then embedded in the imagery attempts to make them as vivid as possible. The proportions of actual movements and imagery attempts are based on individual preferences. | To compensate for the unguided imagery training, patients in the control group were also encouraged to do 'homework', primarily practicing tasks that they had difficulty with. They were asked to report unguided therapy in logs | The duration of therapy was up to 30 minutes for 6 weeks | Four steps are distinguished: 1) explaining the concept; 2) developing imagery techniques; 3) applying mental practice; and 4) consolidating. The protocol had a conditional and an optional part. To be included in the per protocol analysis (only participants who have received the assigned intervention are taken into account), patients from the experimental branch should have received the conditional parts of the framework: at least 10 sessions of mental practice (step 2) and have practiced outside of supervised therapy time | |
| MI training was conducted using visual and kinematic imagery separately. In visual imagery, participants imagine normal movement on their non‐paretic side and that their paralytic side moves like their non‐paretic side. Meanwhile, in kinematic imagery, participants imagine sensory information that they can get from their non‐paretic side when they move normally and then imagine that their paralytic side senses the same sensory information and moves like their non‐paretic side | The control group performed only gait training on the treadmill for 30 minutes | 45 minutes for experimental group and 30 minutes for control group, 3 times a week for 6 weeks | Imagery training was applied for 15 minutes, following gait training using a treadmill for 30 minutes. After conducting imagery training, the participants were allowed to relax for 5 minutes. To perform MI training, videos of normal gait movement were shown. During an explanation of normal gait movement by an experienced researcher, participants imagined normal gait movement based on visual materials. Then the researcher asked the participants to explain the movement they were imagining | |
| Participants’ goals were used to select imagined walking tasks for the imagery practice. The imagery scripts were identical for the 3 weekly sessions and changed at the beginning of each week. Both kinesthetic and visual imagery of the walking activities were used during practice | Control treatment consisted of physical therapy for the affected upper extremity. It included 3 types of exercises, each conducted for 3 minutes: 1) a transport‐reach exercise (e.g. spoon to mouth); 2) a bimanual exercise (e.g. folding clothes); and 3) a unimanual manipulation with the involved upper extremity (e.g. placing items in a jar). The functional tasks, chosen according to the participant’s needs, did not involve ambulation | They consisted of 15‐minute sessions conducted 3 times a week for 4 weeks | All sessions were performed while participants sat on a couch with eyes closed. Each session started and ended with 3 minutes of relaxation exercises. Three minutes of imagery practice were conducted for each of 3 imagery environments: the participant’s home, a 'community interior' (public indoor, such as a mall), and a 'community exterior' (public outdoors, such as a street) environment (for a total of 9 minutes) | |
| Both visual and kinesthetic imagery practice of the same motor tasks was applied to both treatments. The tasks were changed once a week. Instructions provided for each session uniformly presented. During visual imagery practice, the participants were encouraged to 'see' themselves performing the requested tasks. Imagery of zooming through a camera was frequently described to assist them in focusing on movement of the target body parts. During the kinesthetic imagery practice, the participants were asked to feel their body parts, focusing on movement of the joint(s) of the affected extremity during the practiced task. Repetitions were introduced, along with reinforcement for the sensations that were associated with the imagery performance | Imagery practice of movements of the affected upper extremity in different home environmental situations | The protocol was applied twice a week for 5 weeks in each community center during the morning hours | 1) Short conversation between the participants and the instructor, with the instructor providing feedback for the participants’ comments on home exercises and feelings 2) Explanation and demonstration of the assignment for the week 3) Relaxation phase (2 to 3 minutes) 4) MI practice (10 minutes) 5) Refocusing on the environment (2 minutes) | |
| Participants were asked to close their eyes and imagine they were performing the physically practiced task, similar to one shown in the video; participants were urged to imagine themselves from a first‐person perspective, to feel their trunk, legs, hands and feet to concentrate on their movements. Sequence of the task was verbally explained to the patient for better recalling of sensations in muscles during the movements | Patients in the control group physically performed each of the 5 tasks in a week, 10 times and followed the same routine for | Total duration: 3 weeks 4 days per week | Each patient in the experimental group was shown a video comprising of normal movements of the 5 tasks selected for the week, wherein each task was repeated 3 times. After seeing the video, patients performed each activity physically for 10 repetitions. During the entire exercise schedule, the participant's attention was focused on the position, and movement of their body, on proprioceptive inputs coming from the leg muscles (quadriceps and adductors) and on the tactile sensations of foot contact. Thereafter the patient was asked to narrate the sequence of tasks, rehearsed mentally, by the patient. The same steps were followed for the remaining four tasks. At the end participants were asked to relax | |
| Consisted of viewing a task video for 20 minutes through a 32‐inch TV installed approximately 2 meters away while sitting in a comfortable armchair, followed by physical training with a therapist for 10 minutes, based on the video. While participants watched the video, they were instructed not to follow the motions of the video or move. Models of videos were normal adult men and women in their 50s, which is similar to the mean age of patients, so as to raise their concentration on understanding the motions | The exercise program included training of the trunk for learning supine to rolling movements, sit to stand, and normal gait pattern, as well as training of the lower extremity, weight shifting, and gait level surface and gait stairs | 30‐minute training session 5 times per week for a period of 4 weeks | The training program consisted of four stages, according to the content and level of difficulty. Participants watched a video of each stage for a period of one week. Stage 1 was composed of pelvic tilting, trunk flexion and extension, and trunk rotation in the sitting position for enhancement of trunk stability and mobility. Stage 2 was composed of sit‐to‐stand and stand‐to‐sit. Stage 3 was composed of a weight shift to the front and back, left and right, and weight shift involved lifting a foot on the block while standing for balance training in the standing position. Stage 4 was composed of a gait level surface and step over obstacle for improvement of gait ability | |
| Audio‐based lower extremity tasks for imagery practice. | Patients task‐oriented training for lower extremity. | Experimental group: total intervention time per session was about 60 minutes (45 minutes for physical practice and 15 minutes for mental practice). 5 days a week, for 3 weeks Control group: total intervention time per session was about 45 minutes. 5 days a week, for 3 weeks | Author did not give details about the MI protocol | |
| Mental practice program started with a familiarization period and was followed by training of lower extremity tasks | Task‐specific training program focused on improving the performance and endurance of functional tasks involving the lower | 45 to 60 minutes per session, conducted 4 times a week for 3 weeks | In the familiarization phase the participants were explained about the basic action thoughts or motor representations of complex movements (e.g. drinking a cup of tea using Structural Dimension Analysis of Motor Memory). To enhance the imagery ability, verbal instructions and explanation of the lower extremity task components which were practiced in physical practice, by means of pre‐recorded audio tape with total duration 15 minutes delivered in participant's own language, before and during the physical practice training. The taped intervention consists of 2 minutes relaxation followed by 12 minutes of cognitive visual images related to the lower extremity task characteristics (e.g. imagine yourself in a warm, relaxing place and you are bending your knee and feel the tightness in your muscles). Participants were then taught to visualize themselves performing the required task and also experience kinesthetic sensations related to the task. This was followed by refocusing of attention to the immediate surroundings and genuine body position | |
| The visual offerings consisted of 4 courses. Each motion was produced as a moving picture | Functional exercise was applied | (6 weeks, 3 times a week). 30 minutes for imagination training, 1 hour for functional training | Participants were asked to imagine and focus on movements. Participants were then asked to describe the imagined movements | |
| The provision of visual and auditory information was composed of: watching a video clip of normal gait movement being performed by normal people, and listening to a researcher’s explanation of normal gait movement. MI training was divided between visual imagery and kinematic imagery. In the visual imagery of this study, participants imagined affected leg movement as if it were the unaffected leg after imagining the normal movement of the unaffected side from an external point of view. In the kinematic imagery of this study, participants imagined body moving on the affected side as if it were the unaffected side after imagining the sensory information felt during the movement of the unaffected side | Participants in the control group underwent 30 minutes of treadmill gait training, 3 times a week for 6 weeks | Experimental group: total intervention time per session was about 30 minutes for treadmill gait training and 30 minutes for MI, 3 times a week for 6 weeks Control group: total intervention time per session was about 30 minutes | Participants in the experimental underwent 30 minutes of treadmill gait training. After that, MI training was composed of imagination of normal gait movement. It was carried out for 15 minutes after provision of visual and auditory information for 15 minutes. The provision of visual and auditory information was composed of: watching a video clip of normal gait movement being performed by normal people, and listening to a researcher’s explanation of normal gait movement | |
| MI training was performed in the cognitive rehabilitation room at a proper temperature, with no noise, in order to enhance concentration on the MI training. To lower the stress and anxiety of the participants, and relax the body and mind, armchairs with a backrest were used so that participants could comfortably lean on them and close their eyes | The proprioception training program was conducted in 2 phases (phase I and II) Phase I (5 sets for 30 minutes each for 4 weeks): balance pad Phase II (5 sets for 30 minutes each for 4 weeks): balance board | Total duration: 8 weeks; total time: 30 minutes; 5 days per week Experimental group: Time of MI training applied was 5 minutes and proprioception training program was 25 minutes Control group: the time of proprioception training program applied was 30 minutes | MI training was divided into mobility imagery and visual imagery. The objective of mobility imagery is to imagine the inner sensory information during actual movements of body from the first‐person view, and the purpose of visual imagery is to imagine one’s own movements of the body from a third‐person view. The mobility imagery training was conducted to encourage the participants to feel the position senses of the ankle, knee, and hip joints, the peripheral muscles, and sole. Participants actively participated in the proprioception training program. In the MI training, therapists asked participants to imagine the contents of the proprioception program for 5 minutes, by directly reading aloud to them while reading. Participants were asked some questions in order to ensure they were adequately performing the imagery training. Proprioception program consisted of 4 sets performed in 25 minutes before the MI training | |
| In the mental imagery program, participants were trained in the technique of mental imagery to practice specific tasks. Different but related mental imagery skills and the actual performance of tasks were practiced each week to help patients develop competence in using imagery as a learning tool | In the functional retraining program, the demonstration and then practice method was adopted. Participants were required to practice the same tasks following a sequence and training schedule similar to that of the mental imagery program | In both groups, participants received training for a total of 3 weeks with 5 x 1‐hour sessions each week | In the first week, the focus was on analyzing task sequences to facilitate the motor planning and problem identification process using computer‐generated pictures and movies. In the second week, participants identified their own problems for rectification through the use of mental imagery. Picture cards depicting the task sequences were used if participants needed help recalling the steps. In the third week, the focus was on practicing the rectified task performance using mental imagery and actual practice. To further standardize the protocol, a computer program was developed to guide participants to relearn the steps involved in performing each of the 15 tasks. Each step was presented as a picture, with verbal explanations of physical and mental demands of that particular step (to enhance task analysis). Visual aids were also used to help participants' reflection on problems that they encountered when they actually performed the tasks. They watched the video playback to confirm the problems that they identified (to enhance problem identification). Participants were guided to develop strategies to overcome problems | |
| Participants in the MI group received 1 hour of MI per treatment and those in the functional rehabilitation (FR) group were given conventional occupational therapy | In the FR group, participants were given conventional occupational therapy using demonstration‐and‐practice methods to train them to perform the same 15 daily tasks.= | All treatment protocols were administered 5 times a week for 3 weeks (a total of 15 treatments). Participants in both groups received similar levels of therapist attention during their programs. All participants had 1 hour of physical therapy daily that involved mobilization, strengthening, and walking exercises | 5 tasks with a similar difficulty level were covered each week, progressing from the easiest to the most difficult. The MI intervention involved the participants’ self‐reflection on their abilities and deficits: mentally imagining, then actually performing, the task | |
| Participants received a standard rehabilitation program. It consisted of 2 hours physical therapy and 1 hour occupational therapy daily. In addition to standard training, the MI training group received 30‐minute daily mental practice treatment sessions. Each session was individually delivered in a quiet room in the hospital by 2 experienced therapists who were not involved in any other part of the study | The group received the same amount of muscle relaxation therapy over and above the standard rehabilitation training. Muscle relaxation was used to control for therapeutic attention and consisted of relaxation therapy of daily 30‐minute one‐to‐one sessions.The basic principle of this technique is to begin by instructing participants to physically tense particular muscle groups in a given order and then to relax and let go of the muscle contraction. During the same session the participants were asked to concentrate on using diaphragmatic breathing to aid relaxation | All participants received a standard rehabilitation program, consisting of 2 hours physical therapy and 1 hour occupational therapy daily, 5 days per week. In addition to standard training, the experimental group received 30‐minute daily mental practice treatment sessions | Every session started with 2 minutes of relaxation | |
| The participants in MIT EMG NMES group were asked to comfortably sit on the chair, place their upper limb on the desk, and flex and rotate their elbow about 90. MIT EMG‐NMES consists of 3 phases: relaxation phase, mental imagery phase, and stimulation phase. Each phase proceeded according to the menu presented on the MIT EMG NMES monitor. First, the relaxation phase maintains mental relaxation for 12 seconds. Second, in the mental imagery phase, participants were asked to imagine rigorous sports movements such as tennis stroke, throwing a baseball ball, or spiking a volley ball using their affected upper limb. Finally, in the stimulation phase, once the electric potential generated through mental imagery reaches the set EMG threshold, electrical stimulation is applied to the affected upper limb for 6 seconds, which causes substantial muscle contraction. However, if the electric potential generated by mental imagery did not reach the set threshold, it returned to the relaxation phase without electrical stimulation. The instructions are as follows: “when the relaxation phase lights up on the screen of the device, keep relaxed without imagining the movements. After that, when mental imagery phase lights up on the screen of the device, imagine the intensive movement of the affected upper limb.” | The participants in the EMG NMES group were attached to extensor pollicis brevis and longus using 3 surface electrodes in the same way as the participants in MIT EMG NMES. First, the voluntary wrist extension of the participant was induced, and the threshold was set based on the level of electrical potential according to muscle contraction and the threshold was reset every session. When the electric potential reaches the threshold and electrical stimulation is induced, biphasic pulses with a frequency of 35 Hz and a pulse width of 200 microseconds were applied to the affected upper limb for 6 seconds. Then intensity of stimulation was set to be between 15 and 30mA just as in the MIT EMG‐NMES. If the electrical potential generated by muscle contraction did not reach the threshold, electrical stimulation was automatically applied to the affected upper limb after 20 seconds. | Both groups performed intervention for 30 minutes a day, 5 days a week, for 6 weeks | Consisted of 3 phases: | |
| In total, treatment time was about 45 to 50 minutes. Training consisted of the following aspects: | Besides receiving physiotherapy during a 30‐minute session, participants in the control group listened to a 17‐minute tape (average). The tape started with a short relaxation period (about 3.5 minutes). Afterwards, participants listened to information about stroke: causes, consequences for different body functions and recovery phase, therapy options, prevention of potential complications, self‐help groups and their offers | Total duration per session was about 45 to 50 minutes. A total of 6 therapy sessions during 2 weeks | Complete motor task was divided into its 13 stages. Each stage was imagined 5 times before it was physically practiced once. At the end of each physiotherapy session, participants imagined the complete task 4 times while lying supine on the treatment bench and 4 times while standing against a wall. To control for every imagination trial each of the 8 MI trials were timed with a stopwatch by the participant and by the therapist | |
| Received 30 minutes of mental imagery, in addition to 30 minutes of conventional therapy which included neurodevelopmental facilitation technique, stretching, and gait training | Received 30 minutes of mirror therapy, in addition to 30 minutes of conventional therapy which included neurodevelopmental facilitation technique, stretching and gait training | Total of 1 hour per day for 5 days per week for 4 weeks | Study author did not give details about the MI protocol | |
| MI comprised imagining walking abilities and tasks related to a real‐life situation. Participants were familiarized with MI during a pre‐intervention session and educated about the basic imagery principles | Participants in the control group participated in the conventional poststroke lower extremity rehabilitation program based on the Bobath’s neurodevelopmental technique. The control group program was matched for duration, number, and frequency of the sessions with the experimental group program | Experimental group received 15 minutes of MI followed by 25 minutes of TOCCT for a total of 40 minutes, 7 days per week for 2 weeks (14 sessions). Control group program was matched for duration, number, and frequency of the sessions with the experimental group program | The MI program of 15 to 25 minutes was given on an individual basis. Participants were also asked to keep a diary of their MI practice to measure the rehearsal frequency after each treatment session | |
| Before training, the therapist explained the purpose, method and precautions of the training to the participant, and guided the participant to do the dorsiflexion of the contralateral limbs first, so that they can master the joint activities of the affected side | Conventional rehabilitation therapy + tactiles foot dorsiflexion training, continuous for 6 weeks | Once a day, approximately 20 to 30 minutes, rest on Sunday, for 6 consecutive weeks | Training method: the participant was placed in a quiet room and closed his eyes on the bed, relaxed for 2 to 3 minutes before exercise imaging training, imagined the content as the details of the action of passive foot dorsiflexion in rehabilitation training, and repeatedly felt the amount of ankle joint training. The key action of dorsiflexion of the toes was to relax after approximately 5 to 7 minutes. Rested for 1 to 2 minutes, and then 5 to 7 minutes to imagine exercise. Finally, used 2 minutes to guide the participant back to the treatment room from the imaginary situation, and focused on the body and the surrounding environment to make them feel the body. Changed, listened to the sound of the surrounding environment (such as people's voice, footsteps or noise inside and outside the room), and finally the trainer counted down for 10 seconds, when the time was finished, let the participant open his eyes, rest for a while and then the therapist performed the dorsiflexion training | |
| Experimental group received routine training combined with motor imaging therapy in the first stage, and only routine training in the third stage | Control group only conducted routine training in the first stage | The total trial duration was 8 weeks, divided into 3 phases, which were 3 weeks, 2 weeks, and 3 weeks | The therapist does a demonstration, explaining the movements that need to be imagined, explaining the parts of the limbs that need to be moved, and explaining the feeling of movement; participant imagines the movements alone; participant performs the imagination exercises according to the instructions recorded | |
| The experimental group was supplemented with electroacupuncture and motor imaging treatment | Routine care, drug treatment, routine rehabilitation treatment and electroacupuncture treatment | Treatment was given once a day, 5 treatments per week. In total, 4 weeks of treatment was performed | MI treatment involves: (1) pre‐training preparation: before the training is performed the participant's level of motor functions is assessed. Cognitive ability and exercise of imagining the action is also evaluated (3) start of training action: according to the video, the participant follows the orientation to relax the whole body (2 minutes) → visualizes the actual action of the scene of a video of 5 to 10 seconds → then with eyes closed, according to the orientation, it is enough to imagine the action (the therapist remains on the hemiplegic side of the participant and performs tactile and proprioceptive stimulation for 5 to 10 seconds → the participant relaxes for 10 seconds → each operation was repeated 5 times → 20 minutes of the imagination of the movement |
MI: motor imagery; MIT‐EMG NMES: motor imagery training and electromyogram‐triggered neuromuscular electrical stimulation; TOCCT: task‐oriented circuit class training
When applying MI, some studies used videos that imitated the execution of specific normal movements and then asked the participants to imagine performing the movement (Cho 2012; Dickstein 2014; Gupta 2017; Kim 2013a; Lee 2011; Liu 2004; Zhu 2017). Nine studies applied MI from previous protocols, and instructions on how the participants should imagine the movements were given at the moment of the intervention (Braun 2012; Dickstein 2013; Lee 2015; Liu 2009; Oostra 2015; Park 2019; Verma 2011; Yan 2013; Zhang 2013). Kumar 2016 used a voice recording to guide participants in imagining the movements.
For MI practice, most of the studies asked the participants to imagine isolated movements related to gait. Cho 2012, Dickstein 2013, Lee 2011, and Oostra 2015 used the full gait for MI practice. Park 2019 asked the participants to imagine rigorous sports movements. Braun 2012, Liu 2009, Zhang 2013, and Zhu 2017 did not specify what kind of imagination was suggested. Most of the studies used both kinesthetic and visual motor imagery. Kim 2013a and Oostra 2015 used only visual imagery, while Liu 2009, Park 2019, Verma 2011, Yan 2013, and Zhang 2013 used only kinesthetic imagery. Kumar 2013a and Suvadeep 2017 did not specify which kind of imagery (if kinesthetic or visual) was used.
Most of the included studies used MI and physical practice in the experimental groups. As established in our review protocol, we understood physical practice as physical activity, functional gait training, or other active physical therapies (including conventional physical therapy). Most of the studies that used physical practice and MI in the experimental groups performed physical practice first, followed by MI; while only Verma 2011 used MI followed by physical practice. Gupta 2017, Kim 2013a, Kumar 2013a, Lee 2011, Liu 2009, and Suvadeep 2017 did not make clear whether MI was applied before or after physical practice. Three studies used only MI in the experimental groups (Dickstein 2013; Dickstein 2014; Liu 2004).
Most of the investigations initiated MI practice by giving instructions. The practice was performed in a calm environment in some of the included studies to reduce the participants' stress. Some studies performed a few minutes of relaxation before starting MI (Cho 2012; Dickstein 2013; Dickstein 2014; Kumar 2016; Oostra 2015; Park 2019; Yan 2013; Zhu 2017). Overall, the studies used protocols and instruments to evaluate the ability to generate motor images, such as the Movement Imagery Questionnaire. No study monitored vital signs or other signals that sought to identify whether the movement was being imagined during MI execution.
Eight studies cited that MI was applied by therapists (in general) (Braun 2012; Kim 2013a; Lee 2015; Liu 2009; Oostra 2015; Verma 2011; Yan 2013; Zhang 2013). Five studies reported that physical therapists applied MI (Dickstein 2013; Dickstein 2014; Gupta 2017; Kumar 2016; Schuster 2012), and Liu 2004 and Park 2019 cited that occupational therapists applied MI. Three studies mentioned that MI was applied by researchers, without further specifications (Cho 2012; Lee 2010; Lee 2011). In all studies, MI was applied personally. No study monitored the participants' adherence to MI treatment.
The time of MI application, in each session, ranged from 30 to 60 minutes. The total treatment dose in the experimental groups ranged from 100 to 1200 minutes over the course of two to eight weeks of therapy. Lee 2011, Lee 2015, Oostra 2015, and Yan 2013 reported a total of more than 1000 minutes of therapy in the experimental groups, while Cho 2012, Dickstein 2013, Dickstein 2014, Kim 2013a, Kumar 2016, Park 2019, Verma 2011, and Zhang 2013 reported less than 1000 minutes of total therapy; the other studies did not define the therapy time per session in the respective experimental groups. In all studies, the treatment frequency ranged from two to six times per week, and only one session per day was performed using MI.
No studies used placebo or no therapy in the control group; all included studies used other therapies to compare the effects of MI. Physical practice was the most often applied therapy in the comparison groups (controls). Only Dickstein 2014 used MI in the comparison group, but for the upper limbs. Suvadeep 2017 used mirror therapy, Oostra 2015 used muscle relaxation, Park 2019 used neuromuscular electrical stimulation, and Zhang 2013 used drug treatment in addition to physical practice in the comparison group. Most studies were composed of two groups, but Kim 2013a, Schuster 2012, and Zhu 2017 had three treatment groups. In the study conducted by Kim 2013a, the control group performed physical practice alone, and two experimental groups performed physical practice associated with action observation or with MI. Schuster 2012 had two experimental groups that performed either MI embedded into physical practice or MI added to physical practice, while the control group performed only physical practice. Zhu 2017 had two experimental groups that received electroacupuncture (either alone or associated with MI) in addition to physical practice, and another group that received only physical practice (control group).
The total treatment dose for the control groups ranged from 12 to 240 minutes, and the therapy lasted two to eight weeks. In all studies, the treatment frequency ranged from two to seven times per week, and only one session per day was performed in the control groups.
Outcomes
As outcomes, fifteen studies measured walking speed, eleven studies assessed dependence on personal assistance, one study measured walking endurance, six studies assessed motor function, and seven studies assessed functional mobility. Most of the studies did not report adverse events.
Our critical outcomes were the ability to walk, measured using the participants' walking speed, and the dependence on personal assistance. For walking speed, the 10‐meter Walk Test (Braun 2012; Cho 2012; Dickstein 2013; Dickstein 2014; Gupta 2017; Kumar 2016; Oostra 2015; Suvadeep 2017), and custom systems (Dickstein 2014; Kim 2013a; Kumar 2013a; Lee 2010; Lee 2011; Lee 2015; Schuster 2012; Verma 2011), were used. The following measures were used to evaluate the dependence on personal assistance: Barthel Index (Braun 2012; Liu 2009; Park 2019; Schuster 2012; Verma 2011; Yan 2013; Zhu 2017); MAS (Suvadeep 2017); and FAC (Kim 2013a; Verma 2011; Zhang 2013).
For our important outcomes, the only measure used to assess walking endurance was the Six‐minute Walk Test (Verma 2011). The Fugl‐Meyer Assessment Scale (items related to lower limbs) was used to evaluate motor function (Cho 2012; Liu 2004; Liu 2009; Oostra 2015; Suvadeep 2017; Yan 2013). For functional mobility, the following measures were used: Timed Up and Go test (Cho 2012; Kim 2013a; Kumar 2013a; Lee 2010; Lee 2015), and the Rivermead Mobility Index (Braun 2012; Verma 2011). Although different outcome measures were used in the included studies, the outcome data were pooled in the meta‐analysis when necessary.
Only Braun 2012, Dickstein 2013, Liu 2004, Liu 2009, Oostra 2015, Schuster 2012, and Verma 2011 reported adverse events, by reporting this directly in the published text or after we requested the information from the study authors. In all of these studies, the study authors reported no adverse events related to the interventions (both control and experimental groups). Three studies assessed falls as an outcome using either the Falls‐Efficacy Scale ‐ Swedish version (Dickstein 2013), or the Activities‐specific Balance Confidence scale (Dickstein 2014; Schuster 2012); however, none of these studies reported whether falls occurred during the trial period. We contacted all the study authors but they were unable to provide this information.
All included studies assessed outcomes immediately at the end of the study, and only three conducted follow‐up. Braun 2012, Dickstein 2014, and Verma 2011 evaluated the medium‐term effects after a follow‐up period of two, four, and 18 weeks post‐treatment, respectively.
As planned before, we intended to conduct separate data analyses for data related to the period immediately after the intervention and follow‐up. For the outcomes reported in advance in our protocol, we could not perform the follow‐up analyses as there were not enough studies to group the data in the meta‐analysis.
Excluded studies
We excluded 32 studies for various reasons (see Characteristics of excluded studies). In addition, one study is awaiting classification (see Characteristics of studies awaiting classification), and seven are ongoing (see Characteristics of ongoing studies).
Risk of bias in included studies
Two review authors independently assessed the methodological quality of the included trials using the ’Risk of bias’ tool. Figure 2 and Figure 3 show the risk of bias summary and the risk of bias graph of the included studies, respectively, showing the review authors' judgments about each risk of bias item.

Figure 2: Risk of bias summary: review authors' judgements about each risk of bias item for each included study.

Risk of bias graph: review authors' judgements about each risk of bias item presented as percentages across all included studies.
Allocation
Of the 21 included studies, nine performed adequate randomization and respected allocation concealment, so we deemed these to be at low risk of bias (Braun 2012; Cho 2012; Gupta 2017; Kim 2013a; Kumar 2016; Oostra 2015; Park 2019; Schuster 2012; Verma 2011). In the studies conducted by Braun 2012, Park 2019, and Schuster 2012, an independent researcher that was not involved in the study was responsible for the allocation of the participants and generated the randomization list from a personalized computer system. Conversely, in the studies of Cho 2012, Gupta 2017, Kim 2013a, Kumar 2016, Oostra 2015, and Verma 2011, randomization was generated from permuted blocks, and the randomization sequence was placed in opaque and sealed envelopes. Zhang 2013 performed randomization according to the hospital admission number, while the other studies did not report how randomization was performed; we classified these as being at high risk or uncertain risk of bias.
Blinding
Blinding refers to the sample participants and the outcome examiners. In our review, due to the nature of the interventions, it was impossible to blind the therapists. Only Cho 2012 reported that both the participants and examiners were blinded, so we categorized this as low risk of bias. Gupta 2017, Kim 2013a, Kumar 2013a, Lee 2010, Lee 2011, Lee 2015, Suvadeep 2017, Yan 2013, Zhang 2013, and Zhu 2017 did not blind the participants and examiners, and we judged them to be at high risk of bias. Braun 2012, Dickstein 2013, Dickstein 2014, Kumar 2016, Liu 2004, Liu 2009, Oostra 2015, Park 2019, Schuster 2012, and Verma 2011 blinded only the participants or the evaluators, or did not clearly explain whether the two domains were blinded; we considered these trials to be at unclear risk of bias.
Incomplete outcome data
We classified Gupta 2017, Kumar 2013a, Lee 2010, Lee 2015, Suvadeep 2017, and Yan 2013 as unclear risk of bias because they did not clearly explain or did not provide information regarding study losses. We considered Cho 2012, Dickstein 2013, Dickstein 2014, Kim 2013a, Kumar 2016, Lee 2011, Liu 2004, Liu 2009, Oostra 2015, Park 2019, Schuster 2012, Verma 2011, Zhang 2013, and Zhu 2017 to be at low risk of bias because there were no sample losses after interventions, or sample losses were adequately justified and balanced between groups.
Selective reporting
We categorized one study as being at high risk of bias because a previous protocol was not presented, and the outcomes were not reported as listed in the study methods (Kumar 2013a). Seventeen studies presented the study registry and/or reported the outcomes, as stated in the methodology (Braun 2012; Cho 2012; Dickstein 2013; Dickstein 2014; Gupta 2017; Kim 2013a; Kumar 2016; Lee 2010; Lee 2011; Lee 2015; Liu 2004; Liu 2009; Oostra 2015; Park 2019; Schuster 2012; Verma 2011; Zhang 2013). Therefore, we considered them to be at low risk of bias.
Other potential sources of bias
We identified no information associated with other potential sources of bias.
Effects of interventions
See: summary of findings Table 1.
We were able to use data from 11 studies in meta‐analysis (Braun 2012; Cho 2012; Dickstein 2013; Gupta 2017; Kim 2013a; Kumar 2016; Lee 2011; Lee 2015; Oostra 2015; Verma 2011; Yan 2013). The other studies could not be pooled because some data were not presented. We contacted the study authors but did not obtain these data. At least two studies evaluated our pre‐planned critical outcome (ability to walk) and some of the important outcomes (motor function, functional mobility, and adverse events); walking endurance was evaluated by only one study.
Although we planned to compare the effects of MI (alone or associated with either action observation or physical practice) versus other therapies (including conventional physical therapy), placebo, and no therapies, we found no studies that performed comparisons with placebo or no therapies. Therefore, we performed all analyses comparing MI therapy versus other therapies (as control conditions).
MI therapy versus other therapies (control): effect on ability to walk
1.1 Ability to walk: walking speed
Six studies (191 participants) measured walking speed at the end of the intervention using different measures. The first meta‐analysis included all studies that presented data concerning walking speed, regardless of which unit measure was used. We found very low‐certainty evidence that MI had a greater effect than other therapies on walking speed at the end of the intervention (pooled SMD = 0.44; 95% CI 0.06 to 0.81; P = 0.02; I² = 38%; Analysis 1.1).
Subgroup analysis: type of stroke
We planned to do a subgroup analysis to assess the influence of the type of stroke on walking speed at the end of the intervention. Two studies did not report the type of participant stroke (Gupta 2017; Lee 2011), while four studies reported participants with either ischemic or hemorrhagic stroke (Dickstein 2013; Kumar 2016; Oostra 2015; Verma 2011). However, it was impossible to perform the meta‐analysis for this outcome since these studies did not report disaggregated ischemic and hemorrhagic stroke data.
1.2 Subgroup analysis: post‐stroke time
We analyzed subgroups considering the post‐stroke time (six studies, 191 participants) and pooled the studies in which participants were in the 1) subacute stroke stage, 2) chronic stroke stage, and 3) subacute and chronic stroke stages. We considered the assessment of walking speed performed at the end of the intervention. No significant intergroup difference was found (P = 0.59; I² = 0%; Analysis 1.2).
1.3 Subgroup analysis: treatment dose
We assessed the influence of the treatment dose on walking speed at the end of the intervention (five studies; 161 participants). We analyzed subgroups according to the therapy dose since both control and experimental groups had different therapy times. We compared studies that provided more and less than 1000 minutes of therapy in the experimental groups, and observed no significant intergroup differences (P = 0.31; I² = 1.5%; Analysis 1.3).
1.4 Subgroup analysis: type of treatment
In the subgroup analysis considering the types of treatment (6 studies, 191 participants), the studies in which MI was used alone were compared with those in which MI was associated with action observation or physical practice. The walking speed at the end of the intervention was considered, and the intergroup analysis revealed no significant difference (P = 0.54; I² = 0%; Analysis 1.4).
1.5 Subgroup analysis: walking dependence
We analyzed subgroups according to walking dependence to assess the influence on walking speed at the end of the intervention (four studies, 117 participants). We compared studies in which participants were considered 1) dependent and independent on personal assistance, and 2) independent on personal assistance at the beginning of the study. We found no significant intergroup difference (P = 0.44; I² = 0%; Analysis 1.5).
1.6 Subgroup analysis: forms of application of MI
We analyzed subgroups to assess the influence of the form of application of MI on walking speed at the end of the intervention (six studies; 191 participants). We formed three subgroups: 1) studies that used only visual imagery, 2) studies that used only kinesthetic imagery, and 3) studies that used both visual and kinesthetic imagery. There was no significant intergroup difference (P = 0.23; I² = 31.2% Analysis 1.6).
Ability to walk: walking speed: sensitivity analysis: studies without high risk of bias
We planned to do a sensitivity analysis for the studies that exhibited a high risk of bias in at least one of the following domains: allocation concealment, blinding of outcome assessment, and random sequence generation. We could not perform the analysis because only one study was classified as being at low risk of bias (Kumar 2016).
Ability to walk: walking speed: follow‐up
We planned to do an analysis to verify the follow‐up data concerning walking speed, but it was impossible to do this because only one study performed follow‐up assessment (Verma 2011).
1.7 Ability to walk: dependence on personal assistance
Seven studies used the Barthel Index; three studies used FAC; one study used MAS. Despite the number of studies, we did not do the meta‐analysis because only one study specified the dependence or independence of the participants on personal assistance after the interventions (Verma 2011). Our team contacted the study authors by email to request missing data. However, none of the study authors replied. Verma 2011 indicated that seven participants (46.6%) from the experimental (MI) group and two (13.3%) from the control group exceeded the FAC score (> 2 points); they were thus categorized as independent at the end of the intervention. In Verma 2011, when compared to the control group, statistically significant differences were observed favoring the MI group in both the post‐intervention (P = 0.001) and follow‐up (P = 0.001) assessments.
Motor imagery therapy versus other therapies (control): effect on walking endurance
Only one study measured walking endurance (Verma 2011), and it was thus impossible to conduct a meta‐analysis. This study aimed to investigate the effects of task‐oriented circuit class training with MI on gait abilities of patients with subacute stroke. According to the results, the comparison between the control and experimental groups at the post‐intervention moment was statistically significant (P = 0.005) in favor of the experimental group.
Motor imagery therapy versus other therapies (control): effect on motor function
2.1 Motor function
Six studies compared the immediate effects of MI on motor function at the end of the intervention. All of these studies evaluated motor function using the lower extremity item of the Fugl‐Meyer Scale. However, even after requesting information from the authors, data were not available in three studies. Therefore, for this outcome, only three studies were pooled into meta‐analysis (130 participants). We found very low‐certainty evidence that MI had no greater effect than other therapies on motor function at the end of intervention (pooled MD = 2.24; 95% CI ‐1.20 to 5.69; P = 0.20; I² = 87%; Analysis 2.1).
Subgroup analysis: type of stroke
We planned to do a subgroup analysis to verify the influence of the type of stroke on motor function at the end of the intervention. Only two studies reported the type of stroke of the participants: either ischemic or hemorrhagic stroke (Cho 2012; Oostra 2015). However, it was not possible for us to perform the meta‐analysis because the studies did not report disaggregated ischemic and hemorrhagic stroke data.
2.2 Subgroup analysis: post‐stroke time
Regarding motor function, we analyzed subgroups considering the post‐stroke time (two studies, 70 participants) by pooling studies in which participants were in the subacute or chronic stage of stroke. In the subgroup composed of individuals in the chronic stage, statistical significance was observed for the experimental (MI) group (subgroup 2: MD = 5.50; 95% CI 3.79 to 7.21; P < 0.00001; I² = not applicable; Analysis 2.2). A significant intergroup difference was also found (P = 0.0009; I² = 90.9%; Analysis 2.2).
2.3 Subgroup analysis: treatment dose
We analyzed subgroups to assess the influence of the treatment dose on motor function (three studies, 130 participants). Participants were divided into two subgroups, according to the total therapy time in the experimental groups: one combining studies with more than 1000 minutes, and another with less than 1000 minutes. In the subgroup with less than 1000 minutes of total therapy, statistical significance favoring the experimental (MI) group was observed (subgroup 2: MD = 5.50; 95% CI 3.79 to 7.21; P < 0.00001; I² = not applicable; Analysis 2.3). Intergroup differences were also statistically significant (P = 0.01; I² = 84%; Analysis 2.3).
Subgroup analyses: type of treatment and walking dependence
We planned the other two subgroup analyses, considering the type of treatment (MI alone or associated with action observation or physical practice) and walking dependence (dependent or independent to walk at the beginning of the study), for the motor function outcome. However, we could not perform these analyses because there were not enough studies to do so. We contacted the study authors to request unreported data about these outcomes, but none of them replied to our request.
2.4 Subgroup analysis: forms of application of MI
In the subgroup analysis considering the influence of the forms of application of MI on motor function (three studies; 130 participants), we formed three subgroups: one combining studies that used only visual imagery, another combining studies that used only kinesthetic imagery, and the third combining studies that used both visual and kinesthetic imagery. In the subgroup that used only kinesthetic imagery as well as in the subgroup that used both forms of MI, statistical significance favoring the experimental (MI) group was found (subgroup 2: MD = 1.90; 95% CI 0.37 to 3.43; P= 0.01; I² = not applicable; Analysis 2.4); (subgroup 3: MD = 5.50; 95% CI 3.79 to 7.21; P < 0.00001; I² = not applicable; Analysis 2.4). Intergroup differences were also statistically significant (P = 0.0004; I² = 87.4% Analysis 2.4).
Motor function: sensitivity analysis: studies without high risk of bias
We planned to do a sensitivity analysis for the motor function outcome considering only studies with a low risk of bias in the following domains: allocation concealment, blinding of outcome assessment, and random sequence generation. However, only one study was considered to be at low risk in the above mentioned domains (Cho 2012). We were thus unable to perform the sensitivity analysis.
Motor imagery therapy versus other therapies (control): effect on functional mobility
3.1 Functional mobility
Four studies (116 participants) measured functional mobility at the end of the intervention and used two different measures (Rivermead Mobility Index and Timed Up and Go test). In the studies that used the Timed Up and Go test, values were obtained in 'seconds,' indicating better functional mobility with fewer elapsed seconds.This explains the negative values in the analyses. We found very low‐certainty evidence that MI had no greater effect than other therapies on functional mobility (pooled SMD = 0.55; 95% CI ‐0.45 to 1.56; P = 0.09; I² = 64.2%; Analysis 3.1).
In the study that evaluated functional mobility using the Rivermead Mobility Index (34 participants), we also found very low‐certainty evidence that the use of MI did not improve functional mobility compared to other therapies at the end of the intervention (pooled SMD = ‐0.34; 95% CI ‐1.02 to 0.34; P = 0.32; I² = not applicable; Analysis 3.1).
In three studies that evaluated this outcome using the Timed Up and Go test (82 participants), we also found very low‐certainty evidence that the use of MI did not improve functional mobility compared to other therapies at the end of the intervention (pooled SMD = 0.88; 95% CI ‐0.38 to 2.14; P = 0.17; I² = 85%; Analysis 3.1).
Subgroup analysis: type of stroke
We planned to do a subgroup analysis considering the influence of the type of stroke on functional mobility at the end of the intervention; however, not enough information was presented in the included studies. We contacted the study authors by email, but received no response.
Subgroup analysis: post‐stroke time
We planned to do a subgroup analysis to assess the influence of the post‐stroke time on functional mobility at the end of the intervention, but only data from the chronic stage of stroke was present in the included studies.
3.2 Subgroup analysis: treatment dose
We assessed the influence of the treatment dose on functional mobility at the end of the intervention (2 studies; 64 participants). Two subgroups were formed according to the total therapy time in the experimental groups: one group receiving more than 1000 minutes of total therapy and another group receiving less than 1000 minutes of total therapy. Statistical significance was observed favoring the experimental (MI) group in the subgroup with less than 1000 minutes of total therapy (subgroup 2: SMD = 2.30; 95% CI 1.31 to 3.28; P < 0.00001; I² = not applicable). Intergroup differences were also statistically significant (P = 0.0005; I² = 91.8%; Analysis 3.2).
Subgroup analyses: type of treatment and walking dependence
The other two subgroup analyses were proposed for functional mobility considering 1) the type of treatment (MI alone or associated with action observation or physical practice), and 2) walking dependence (dependent or independent for walking at the beginning of the study). However, not enough information was reported to conduct the meta‐analysis. We contacted the study authors, but received no reply.
3.3 Functional mobility: sensitivity analysis: studies without high risk of bias
We conducted a sensitivity analysis excluding the studies that presented a high risk of bias in at least one of the following domains: allocation concealment, blinding of outcome assessment, and random sequence generation (two studies; 62 participants). The effect of therapy remained non‐significant (pooled SMD = 0.95; 95% CI ‐1.63 to 3.54; P = 0.47; I² = 95%; Analysis 3.3).
Functional mobility: follow‐up
We planned to do an analysis to assess the follow‐up data. It was not possible because only one study performed follow‐up assessment regarding functional mobility (Braun 2012).
3.4 Functional mobility: sensitivity analysis: without peripheral studies
We conducted a sensitivity analysis (three studies; 88 participants) excluding one study that had a sample composed of outpatients. The effect of therapy remained non‐significant (SMD ‐0.00; 95% CI ‐0.42 to 0.42; P = 1.00; I² = 0%; Analysis 3.4).
3.5 Subgroup analysis: forms of application of MI
In the analysis considering the influence of the form of application of MI on functional mobility (three studies; 82 participants), we divided the studies into two subgroups: one group receiving only visual imagery, and the second group receiving both the visual and kinesthetic imageries. No significant intergroup difference was found (P = 0.41; I² = 0%; Analysis 3.5).
MI therapy versus other therapies (control): effect on adverse events (pain, fall and all cause deaths)
4.1 Adverse events
Only two studies reported no adverse events (Dickstein 2014; Verma 2011). We contacted the study authors of the other studies by email. Five of the authors replied, informing us that there were no adverse events. Therefore, it was impossible to conduct a meta‐analysis for this outcome.
Discussion
Summary of main results
This review aimed to assess the effects of the treatment with MI on the gait of individuals with stroke. The total number of included studies was 21 and involved 762 participants. The studies compared MI with other therapies, and physical practice was the most applied therapy in the control group. No studies compared MI with placebo or no treatment. Overall, the certainty of the evidence for the outcomes was very low. The main results are presented in the summary of findings Table 1.
We found very low‐certainty evidence that the use of MI was superior to other therapeutic interventions for improving gait (walking speed) at the end of the treatment. Treatment with MI also improved walking speed regardless of the stage of stroke (subacute or chronic), the type of treatment (either MI alone or combined with action observation or physical practice), and the dependence on personal assistance (dependent or independent at the beginning of the study). However, we observed no difference in the effect of MI on walking speed concerning the treatment dose (less than or more than 1000 minutes of therapy, including MI) and the forms of application of MI (visual imagery, kinesthetic imagery, or both visual and kinesthetic imagery). We have very little confidence in our estimate regarding the effect of MI alone. The only study investigating the effect of MI alone presented a high risk of bias in several domains, concerning the blinding of both the participants and personnel, random sequence generation, and allocation concealment. Therefore, the exact effect of the use of MI alone may be different from our estimate. We could not properly assess the evidence of the effects of MI on dependence for walking because only one study specified whether participants were dependent or independent after the interventions. In this trial, statistically significant differences were observed favoring the MI group at the end of the intervention as well as follow‐up assessments (P = 0.001). We could not assess the effects of MI on walking speed at follow‐up because this outcome was assessed in only one study.
We could not properly assess the effects of MI on walking endurance since only one study reported this outcome. In this trial, a significant difference was observed when comparing the control and experimental groups at the end of the intervention (P = 0.05). We found very low‐certainty evidence that MI was no more beneficial than other therapies on motor function, when assessed using the Fugl‐Meyer Assessment at the end of treatment. We also observed no difference concerning its effects on motor function regardless of the stage of stroke or treatment dose. However, with regard to the forms of MI application, we found a significant difference. We observed high methodological heterogeneity among the studies that reported this outcome, which also presented wide confidence intervals. We could not assess the effects of MI on motor function at follow‐up assessment because the studies only reported data from the post‐intervention assessment.
We found very low‐certainty evidence that there is no beneficial effect of MI, compared to other therapies, on functional mobility, measured using the Timed Up and Go Test or the Rivermead Mobility Index. We also observed no difference concerning its effects on functional mobility at the end of the treatment regardless of the treatment dose and forms of application. We also observed high methodological heterogeneity among the studies that reported this outcome. Despite this, when we removed the studies with peripheral results, the effect remained absent; i.e. both MI and the other therapies proved to have similar effects on functional mobility at the end of the treatment. We could not assess the effects of MI on functional mobility at follow‐up because this assessment was conducted in only one study.
Regarding adverse events, we considered any undesirable episode reported in the studies, including pain, falls, and all‐cause deaths. Most studies did not report whether there were any adverse events, while those that did reported no adverse events related to the interventions. Therefore, it was impossible to group data in the meta‐analysis and assess the certainty of the evidence.
Overall completeness and applicability of evidence
The outcomes analyzed in a systematic review need to be relevant to patients, health professionals, and the general population. Based on this justification, we chose to investigate gait (i.e. ability to walk) and the following important outcomes: motor function, functional mobility, walking endurance, and adverse events from a perspective that encompassed all aspects related to rehabilitation of post‐stroke individuals. Our search identified a significant number of studies that applied MI to improve gait and other functional outcomes related to walking. However, we found relatively few studies that observed the effectiveness of MI using a randomised and controlled design (21 studies); furthermore, the studies presented a small sample size.
Considering that we only included studies comparing MI to other therapies, our results cannot be generalized to include the effects of either placebo or no therapy. Even considering the comparison between MI and other therapies, there are factors producing uncertainty for generalizations. In addition, our results were only related to the short‐term effects.
-
The population of the included studies was quite heterogeneous (e.g. age, type of stroke, post‐stroke time, and deficit at the beginning of the study).
-
The majority of the experimental interventions included MI combined with other therapy.
-
The experimental and control conditions were heterogeneous (e.g. type of training, and especially treatment dose).
Although the application of MI is considered easy and no expensive equipment is required, its application costs were not quantified by the researchers. The results of this review appear to be quite generalizable for inpatient and outpatient settings of high‐income countries.
Quality of the evidence
According to the GRADE criteria, we classified the certainty of the evidence as very low due to the small number of studies included in the review, the wide confidence intervals, the moderate or substantial heterogeneity among studies, and because many studies presented methodological concerns. There was a high risk of bias for at least one assessed domain in 20 of the 21 included studies. Fifteen of the 21 included studies had a high risk of bias for allocation concealment. Nineteen of the 21 included studies had a high risk of bias for blinding participants or personnel. However, a good number of the studies adopted some precautions that may have minimized the presence of other biases, such as sufficient methodological details reported in previously published protocols and presenting results as stated in the methodology. The results of the main meta‐analyses showed a moderate to high inconsistency (moderate, substantial, and considerable heterogeneity).
Potential biases in the review process
The selection process of the studies has been judicious and followed the methodological rigor of Cochrane Reviews. We are confident that our comprehensive search strategy and detailed handsearching have identified all relevant studies. However, it is possible that we did not identify some studies published in the grey literature as well as additional (published or unpublished) trials.
As a potential selection bias, we could not identify the effects of MI on the outcome 'dependence on personal assistance' since the study authors could not provide the required data. For the same reason, some studies were not included in the meta‐analyses (Dickstein 2014; Kumar 2013a; Lee 2010; Liu 2004; Liu 2009; Park 2019; Schuster 2012; Suvadeep 2017; Zhang 2013; Zhu 2017). Another limitation of this review is that most of the studies had methodological shortcomings, such as blinding of outcome assessment, random sequence generation, allocation concealment, incomplete outcome data, and selective reporting. These biases can lead to underestimation or overestimation of the true intervention effect (Higgins 2011).
Agreements and disagreements with other studies or reviews
We found only one systematic review with meta‐analysis of RCTs of MI for improving balance, activities of daily living, and upper and lower limb function (Guerra 2017). This review differed from ours by including outcomes not related to gait. Twelve studies investigated motor performance of the lower limb and/or gait in an overall sample of 343 individuals. Our review appears to have carried out a more recent, broad, and comprehensive search compared to Guerra 2017, and thus we identified a greater number of studies in which MI was used to improve gait after stroke. Guerra 2017 found a significant difference for the outcomes related to gait in favor of MI, specifically related to walking speed (MD = 0.49, 95% CI, 0.09 to 0.89, P = 0.02, I² = 0%), thus corroborating our findings. However, when they conducted a sensitivity analysis by excluding low‐quality studies, no significant differences were found. In line with our conclusions, the review performed by Guerra 2017 suggested that further high‐quality studies, as well as greater standardization of MI interventions, are needed.

4747Study flow diagram.

Figure 2: Risk of bias summary: review authors' judgements about each risk of bias item for each included study.

Risk of bias graph: review authors' judgements about each risk of bias item presented as percentages across all included studies.

Comparison 1: Motor Imagery therapy versus other therapies (control): effect on ability to walk, Outcome 1: Walking speed

Comparison 1: Motor Imagery therapy versus other therapies (control): effect on ability to walk, Outcome 2: Subgroup analysis: post‐stroke time

Comparison 1: Motor Imagery therapy versus other therapies (control): effect on ability to walk, Outcome 3: Subgroup analysis: treatment dose

Comparison 1: Motor Imagery therapy versus other therapies (control): effect on ability to walk, Outcome 4: Subgroup analysis: type of treatment

Comparison 1: Motor Imagery therapy versus other therapies (control): effect on ability to walk, Outcome 5: Subgroup analysis: walking dependence

Comparison 1: Motor Imagery therapy versus other therapies (control): effect on ability to walk, Outcome 6: Subgroup analysis: forms of application of MI

Comparison 2: Motor imagery versus other therapies (control): effect on motor function, Outcome 1: Motor function

Comparison 2: Motor imagery versus other therapies (control): effect on motor function, Outcome 2: Subgroup analysis: post‐stroke time

Comparison 2: Motor imagery versus other therapies (control): effect on motor function, Outcome 3: Subgroup analysis ‐ treatment dose

Comparison 2: Motor imagery versus other therapies (control): effect on motor function, Outcome 4: Subgroup analysis: forms of application of MI

Comparison 3: Motor imagery versus other therapies (control): effect on functional mobility, Outcome 1: Functional mobility

Comparison 3: Motor imagery versus other therapies (control): effect on functional mobility, Outcome 2: Subgroup analysis: treatment dose

Comparison 3: Motor imagery versus other therapies (control): effect on functional mobility, Outcome 3: Functional mobility ‐ sensitivity analysis: studies without high risk of bias

Comparison 3: Motor imagery versus other therapies (control): effect on functional mobility, Outcome 4: Functional mobility ‐ sensitivity analysis: without peripheral studies

Comparison 3: Motor imagery versus other therapies (control): effect on functional mobility, Outcome 5: Subgroup analysis: forms of application of MI
| Motor imagery compared to other therapies (control) for gait rehabilitation after stroke (only outcomes immediately after intervention) | ||||||
| Patient or population: People performing gait rehabilitation after stroke | ||||||
| Outcomes | Anticipated absolute effects* (95% CI) | Relative effect | No of participants | Certainty of the evidence | Comments | |
|---|---|---|---|---|---|---|
| Risk with control | Risk with MI | |||||
| Walking speed | ‐ | The mean walking speed in the intervention groups was0.44 standard mean difference higher (0.06 to 0.81 higher) | ‐ | 191 | ⊕⊝⊝⊝ | Evidence suggests that MI may increase walking speed |
| Motor function | ‐ | The mean motor function in the intervention groups was 2.24mean difference higher | ‐ | 130 | ⊕⊝⊝⊝ | MI results show little or no difference in motor function |
| Functional mobility | ‐ | The mean functional mobility in the intervention groups was 0.55 standard mean difference higher | ‐ | 116 | ⊕⊝⊝⊝ | MI results show in little or no difference in functional mobility |
| Dependence on personal assistance | See comment | Not estimable | 385 | ‐ | Due to the lack of data in the studies regarding this outcome it was not possible to perform the meta‐analysis | |
| Walking endurance | See comment | ‐ | 30 | ‐ | Due to not reaching the minimum number of studies (2), it was not possible to perform the meta‐analysis | |
| Adverse events (including pain, falls and all‐cause deaths) | See comment | Not estimable | 252 | ‐ | No adverse events were related to the interventions | |
| *The risk in the intervention group (and its 95% confidence interval) is based on the assumed risk in the comparison group and the relative effect of the intervention (and its 95% CI). | ||||||
| GRADE Working Group grades of evidence | ||||||
| aDowngraded due to several ratings with 'high' or 'unclear' risk of bias for random sequence generation, allocation concealment or blinding of outcome assessment. bSmall sample size (< 400). cWide confidence interval. dModerate or substantial heterogeneity (> 50%). | ||||||
| Included Studies | Experimental Group | Control Group | Frequency and duration | Motor Imagery Protocols |
|---|---|---|---|---|
| During therapy, imagery attempts and overt movements are combined: movements are performed to generate sensory information, which are then embedded in the imagery attempts to make them as vivid as possible. The proportions of actual movements and imagery attempts are based on individual preferences. | To compensate for the unguided imagery training, patients in the control group were also encouraged to do 'homework', primarily practicing tasks that they had difficulty with. They were asked to report unguided therapy in logs | The duration of therapy was up to 30 minutes for 6 weeks | Four steps are distinguished: 1) explaining the concept; 2) developing imagery techniques; 3) applying mental practice; and 4) consolidating. The protocol had a conditional and an optional part. To be included in the per protocol analysis (only participants who have received the assigned intervention are taken into account), patients from the experimental branch should have received the conditional parts of the framework: at least 10 sessions of mental practice (step 2) and have practiced outside of supervised therapy time | |
| MI training was conducted using visual and kinematic imagery separately. In visual imagery, participants imagine normal movement on their non‐paretic side and that their paralytic side moves like their non‐paretic side. Meanwhile, in kinematic imagery, participants imagine sensory information that they can get from their non‐paretic side when they move normally and then imagine that their paralytic side senses the same sensory information and moves like their non‐paretic side | The control group performed only gait training on the treadmill for 30 minutes | 45 minutes for experimental group and 30 minutes for control group, 3 times a week for 6 weeks | Imagery training was applied for 15 minutes, following gait training using a treadmill for 30 minutes. After conducting imagery training, the participants were allowed to relax for 5 minutes. To perform MI training, videos of normal gait movement were shown. During an explanation of normal gait movement by an experienced researcher, participants imagined normal gait movement based on visual materials. Then the researcher asked the participants to explain the movement they were imagining | |
| Participants’ goals were used to select imagined walking tasks for the imagery practice. The imagery scripts were identical for the 3 weekly sessions and changed at the beginning of each week. Both kinesthetic and visual imagery of the walking activities were used during practice | Control treatment consisted of physical therapy for the affected upper extremity. It included 3 types of exercises, each conducted for 3 minutes: 1) a transport‐reach exercise (e.g. spoon to mouth); 2) a bimanual exercise (e.g. folding clothes); and 3) a unimanual manipulation with the involved upper extremity (e.g. placing items in a jar). The functional tasks, chosen according to the participant’s needs, did not involve ambulation | They consisted of 15‐minute sessions conducted 3 times a week for 4 weeks | All sessions were performed while participants sat on a couch with eyes closed. Each session started and ended with 3 minutes of relaxation exercises. Three minutes of imagery practice were conducted for each of 3 imagery environments: the participant’s home, a 'community interior' (public indoor, such as a mall), and a 'community exterior' (public outdoors, such as a street) environment (for a total of 9 minutes) | |
| Both visual and kinesthetic imagery practice of the same motor tasks was applied to both treatments. The tasks were changed once a week. Instructions provided for each session uniformly presented. During visual imagery practice, the participants were encouraged to 'see' themselves performing the requested tasks. Imagery of zooming through a camera was frequently described to assist them in focusing on movement of the target body parts. During the kinesthetic imagery practice, the participants were asked to feel their body parts, focusing on movement of the joint(s) of the affected extremity during the practiced task. Repetitions were introduced, along with reinforcement for the sensations that were associated with the imagery performance | Imagery practice of movements of the affected upper extremity in different home environmental situations | The protocol was applied twice a week for 5 weeks in each community center during the morning hours | 1) Short conversation between the participants and the instructor, with the instructor providing feedback for the participants’ comments on home exercises and feelings 2) Explanation and demonstration of the assignment for the week 3) Relaxation phase (2 to 3 minutes) 4) MI practice (10 minutes) 5) Refocusing on the environment (2 minutes) | |
| Participants were asked to close their eyes and imagine they were performing the physically practiced task, similar to one shown in the video; participants were urged to imagine themselves from a first‐person perspective, to feel their trunk, legs, hands and feet to concentrate on their movements. Sequence of the task was verbally explained to the patient for better recalling of sensations in muscles during the movements | Patients in the control group physically performed each of the 5 tasks in a week, 10 times and followed the same routine for | Total duration: 3 weeks 4 days per week | Each patient in the experimental group was shown a video comprising of normal movements of the 5 tasks selected for the week, wherein each task was repeated 3 times. After seeing the video, patients performed each activity physically for 10 repetitions. During the entire exercise schedule, the participant's attention was focused on the position, and movement of their body, on proprioceptive inputs coming from the leg muscles (quadriceps and adductors) and on the tactile sensations of foot contact. Thereafter the patient was asked to narrate the sequence of tasks, rehearsed mentally, by the patient. The same steps were followed for the remaining four tasks. At the end participants were asked to relax | |
| Consisted of viewing a task video for 20 minutes through a 32‐inch TV installed approximately 2 meters away while sitting in a comfortable armchair, followed by physical training with a therapist for 10 minutes, based on the video. While participants watched the video, they were instructed not to follow the motions of the video or move. Models of videos were normal adult men and women in their 50s, which is similar to the mean age of patients, so as to raise their concentration on understanding the motions | The exercise program included training of the trunk for learning supine to rolling movements, sit to stand, and normal gait pattern, as well as training of the lower extremity, weight shifting, and gait level surface and gait stairs | 30‐minute training session 5 times per week for a period of 4 weeks | The training program consisted of four stages, according to the content and level of difficulty. Participants watched a video of each stage for a period of one week. Stage 1 was composed of pelvic tilting, trunk flexion and extension, and trunk rotation in the sitting position for enhancement of trunk stability and mobility. Stage 2 was composed of sit‐to‐stand and stand‐to‐sit. Stage 3 was composed of a weight shift to the front and back, left and right, and weight shift involved lifting a foot on the block while standing for balance training in the standing position. Stage 4 was composed of a gait level surface and step over obstacle for improvement of gait ability | |
| Audio‐based lower extremity tasks for imagery practice. | Patients task‐oriented training for lower extremity. | Experimental group: total intervention time per session was about 60 minutes (45 minutes for physical practice and 15 minutes for mental practice). 5 days a week, for 3 weeks Control group: total intervention time per session was about 45 minutes. 5 days a week, for 3 weeks | Author did not give details about the MI protocol | |
| Mental practice program started with a familiarization period and was followed by training of lower extremity tasks | Task‐specific training program focused on improving the performance and endurance of functional tasks involving the lower | 45 to 60 minutes per session, conducted 4 times a week for 3 weeks | In the familiarization phase the participants were explained about the basic action thoughts or motor representations of complex movements (e.g. drinking a cup of tea using Structural Dimension Analysis of Motor Memory). To enhance the imagery ability, verbal instructions and explanation of the lower extremity task components which were practiced in physical practice, by means of pre‐recorded audio tape with total duration 15 minutes delivered in participant's own language, before and during the physical practice training. The taped intervention consists of 2 minutes relaxation followed by 12 minutes of cognitive visual images related to the lower extremity task characteristics (e.g. imagine yourself in a warm, relaxing place and you are bending your knee and feel the tightness in your muscles). Participants were then taught to visualize themselves performing the required task and also experience kinesthetic sensations related to the task. This was followed by refocusing of attention to the immediate surroundings and genuine body position | |
| The visual offerings consisted of 4 courses. Each motion was produced as a moving picture | Functional exercise was applied | (6 weeks, 3 times a week). 30 minutes for imagination training, 1 hour for functional training | Participants were asked to imagine and focus on movements. Participants were then asked to describe the imagined movements | |
| The provision of visual and auditory information was composed of: watching a video clip of normal gait movement being performed by normal people, and listening to a researcher’s explanation of normal gait movement. MI training was divided between visual imagery and kinematic imagery. In the visual imagery of this study, participants imagined affected leg movement as if it were the unaffected leg after imagining the normal movement of the unaffected side from an external point of view. In the kinematic imagery of this study, participants imagined body moving on the affected side as if it were the unaffected side after imagining the sensory information felt during the movement of the unaffected side | Participants in the control group underwent 30 minutes of treadmill gait training, 3 times a week for 6 weeks | Experimental group: total intervention time per session was about 30 minutes for treadmill gait training and 30 minutes for MI, 3 times a week for 6 weeks Control group: total intervention time per session was about 30 minutes | Participants in the experimental underwent 30 minutes of treadmill gait training. After that, MI training was composed of imagination of normal gait movement. It was carried out for 15 minutes after provision of visual and auditory information for 15 minutes. The provision of visual and auditory information was composed of: watching a video clip of normal gait movement being performed by normal people, and listening to a researcher’s explanation of normal gait movement | |
| MI training was performed in the cognitive rehabilitation room at a proper temperature, with no noise, in order to enhance concentration on the MI training. To lower the stress and anxiety of the participants, and relax the body and mind, armchairs with a backrest were used so that participants could comfortably lean on them and close their eyes | The proprioception training program was conducted in 2 phases (phase I and II) Phase I (5 sets for 30 minutes each for 4 weeks): balance pad Phase II (5 sets for 30 minutes each for 4 weeks): balance board | Total duration: 8 weeks; total time: 30 minutes; 5 days per week Experimental group: Time of MI training applied was 5 minutes and proprioception training program was 25 minutes Control group: the time of proprioception training program applied was 30 minutes | MI training was divided into mobility imagery and visual imagery. The objective of mobility imagery is to imagine the inner sensory information during actual movements of body from the first‐person view, and the purpose of visual imagery is to imagine one’s own movements of the body from a third‐person view. The mobility imagery training was conducted to encourage the participants to feel the position senses of the ankle, knee, and hip joints, the peripheral muscles, and sole. Participants actively participated in the proprioception training program. In the MI training, therapists asked participants to imagine the contents of the proprioception program for 5 minutes, by directly reading aloud to them while reading. Participants were asked some questions in order to ensure they were adequately performing the imagery training. Proprioception program consisted of 4 sets performed in 25 minutes before the MI training | |
| In the mental imagery program, participants were trained in the technique of mental imagery to practice specific tasks. Different but related mental imagery skills and the actual performance of tasks were practiced each week to help patients develop competence in using imagery as a learning tool | In the functional retraining program, the demonstration and then practice method was adopted. Participants were required to practice the same tasks following a sequence and training schedule similar to that of the mental imagery program | In both groups, participants received training for a total of 3 weeks with 5 x 1‐hour sessions each week | In the first week, the focus was on analyzing task sequences to facilitate the motor planning and problem identification process using computer‐generated pictures and movies. In the second week, participants identified their own problems for rectification through the use of mental imagery. Picture cards depicting the task sequences were used if participants needed help recalling the steps. In the third week, the focus was on practicing the rectified task performance using mental imagery and actual practice. To further standardize the protocol, a computer program was developed to guide participants to relearn the steps involved in performing each of the 15 tasks. Each step was presented as a picture, with verbal explanations of physical and mental demands of that particular step (to enhance task analysis). Visual aids were also used to help participants' reflection on problems that they encountered when they actually performed the tasks. They watched the video playback to confirm the problems that they identified (to enhance problem identification). Participants were guided to develop strategies to overcome problems | |
| Participants in the MI group received 1 hour of MI per treatment and those in the functional rehabilitation (FR) group were given conventional occupational therapy | In the FR group, participants were given conventional occupational therapy using demonstration‐and‐practice methods to train them to perform the same 15 daily tasks.= | All treatment protocols were administered 5 times a week for 3 weeks (a total of 15 treatments). Participants in both groups received similar levels of therapist attention during their programs. All participants had 1 hour of physical therapy daily that involved mobilization, strengthening, and walking exercises | 5 tasks with a similar difficulty level were covered each week, progressing from the easiest to the most difficult. The MI intervention involved the participants’ self‐reflection on their abilities and deficits: mentally imagining, then actually performing, the task | |
| Participants received a standard rehabilitation program. It consisted of 2 hours physical therapy and 1 hour occupational therapy daily. In addition to standard training, the MI training group received 30‐minute daily mental practice treatment sessions. Each session was individually delivered in a quiet room in the hospital by 2 experienced therapists who were not involved in any other part of the study | The group received the same amount of muscle relaxation therapy over and above the standard rehabilitation training. Muscle relaxation was used to control for therapeutic attention and consisted of relaxation therapy of daily 30‐minute one‐to‐one sessions.The basic principle of this technique is to begin by instructing participants to physically tense particular muscle groups in a given order and then to relax and let go of the muscle contraction. During the same session the participants were asked to concentrate on using diaphragmatic breathing to aid relaxation | All participants received a standard rehabilitation program, consisting of 2 hours physical therapy and 1 hour occupational therapy daily, 5 days per week. In addition to standard training, the experimental group received 30‐minute daily mental practice treatment sessions | Every session started with 2 minutes of relaxation | |
| The participants in MIT EMG NMES group were asked to comfortably sit on the chair, place their upper limb on the desk, and flex and rotate their elbow about 90. MIT EMG‐NMES consists of 3 phases: relaxation phase, mental imagery phase, and stimulation phase. Each phase proceeded according to the menu presented on the MIT EMG NMES monitor. First, the relaxation phase maintains mental relaxation for 12 seconds. Second, in the mental imagery phase, participants were asked to imagine rigorous sports movements such as tennis stroke, throwing a baseball ball, or spiking a volley ball using their affected upper limb. Finally, in the stimulation phase, once the electric potential generated through mental imagery reaches the set EMG threshold, electrical stimulation is applied to the affected upper limb for 6 seconds, which causes substantial muscle contraction. However, if the electric potential generated by mental imagery did not reach the set threshold, it returned to the relaxation phase without electrical stimulation. The instructions are as follows: “when the relaxation phase lights up on the screen of the device, keep relaxed without imagining the movements. After that, when mental imagery phase lights up on the screen of the device, imagine the intensive movement of the affected upper limb.” | The participants in the EMG NMES group were attached to extensor pollicis brevis and longus using 3 surface electrodes in the same way as the participants in MIT EMG NMES. First, the voluntary wrist extension of the participant was induced, and the threshold was set based on the level of electrical potential according to muscle contraction and the threshold was reset every session. When the electric potential reaches the threshold and electrical stimulation is induced, biphasic pulses with a frequency of 35 Hz and a pulse width of 200 microseconds were applied to the affected upper limb for 6 seconds. Then intensity of stimulation was set to be between 15 and 30mA just as in the MIT EMG‐NMES. If the electrical potential generated by muscle contraction did not reach the threshold, electrical stimulation was automatically applied to the affected upper limb after 20 seconds. | Both groups performed intervention for 30 minutes a day, 5 days a week, for 6 weeks | Consisted of 3 phases: | |
| In total, treatment time was about 45 to 50 minutes. Training consisted of the following aspects: | Besides receiving physiotherapy during a 30‐minute session, participants in the control group listened to a 17‐minute tape (average). The tape started with a short relaxation period (about 3.5 minutes). Afterwards, participants listened to information about stroke: causes, consequences for different body functions and recovery phase, therapy options, prevention of potential complications, self‐help groups and their offers | Total duration per session was about 45 to 50 minutes. A total of 6 therapy sessions during 2 weeks | Complete motor task was divided into its 13 stages. Each stage was imagined 5 times before it was physically practiced once. At the end of each physiotherapy session, participants imagined the complete task 4 times while lying supine on the treatment bench and 4 times while standing against a wall. To control for every imagination trial each of the 8 MI trials were timed with a stopwatch by the participant and by the therapist | |
| Received 30 minutes of mental imagery, in addition to 30 minutes of conventional therapy which included neurodevelopmental facilitation technique, stretching, and gait training | Received 30 minutes of mirror therapy, in addition to 30 minutes of conventional therapy which included neurodevelopmental facilitation technique, stretching and gait training | Total of 1 hour per day for 5 days per week for 4 weeks | Study author did not give details about the MI protocol | |
| MI comprised imagining walking abilities and tasks related to a real‐life situation. Participants were familiarized with MI during a pre‐intervention session and educated about the basic imagery principles | Participants in the control group participated in the conventional poststroke lower extremity rehabilitation program based on the Bobath’s neurodevelopmental technique. The control group program was matched for duration, number, and frequency of the sessions with the experimental group program | Experimental group received 15 minutes of MI followed by 25 minutes of TOCCT for a total of 40 minutes, 7 days per week for 2 weeks (14 sessions). Control group program was matched for duration, number, and frequency of the sessions with the experimental group program | The MI program of 15 to 25 minutes was given on an individual basis. Participants were also asked to keep a diary of their MI practice to measure the rehearsal frequency after each treatment session | |
| Before training, the therapist explained the purpose, method and precautions of the training to the participant, and guided the participant to do the dorsiflexion of the contralateral limbs first, so that they can master the joint activities of the affected side | Conventional rehabilitation therapy + tactiles foot dorsiflexion training, continuous for 6 weeks | Once a day, approximately 20 to 30 minutes, rest on Sunday, for 6 consecutive weeks | Training method: the participant was placed in a quiet room and closed his eyes on the bed, relaxed for 2 to 3 minutes before exercise imaging training, imagined the content as the details of the action of passive foot dorsiflexion in rehabilitation training, and repeatedly felt the amount of ankle joint training. The key action of dorsiflexion of the toes was to relax after approximately 5 to 7 minutes. Rested for 1 to 2 minutes, and then 5 to 7 minutes to imagine exercise. Finally, used 2 minutes to guide the participant back to the treatment room from the imaginary situation, and focused on the body and the surrounding environment to make them feel the body. Changed, listened to the sound of the surrounding environment (such as people's voice, footsteps or noise inside and outside the room), and finally the trainer counted down for 10 seconds, when the time was finished, let the participant open his eyes, rest for a while and then the therapist performed the dorsiflexion training | |
| Experimental group received routine training combined with motor imaging therapy in the first stage, and only routine training in the third stage | Control group only conducted routine training in the first stage | The total trial duration was 8 weeks, divided into 3 phases, which were 3 weeks, 2 weeks, and 3 weeks | The therapist does a demonstration, explaining the movements that need to be imagined, explaining the parts of the limbs that need to be moved, and explaining the feeling of movement; participant imagines the movements alone; participant performs the imagination exercises according to the instructions recorded | |
| The experimental group was supplemented with electroacupuncture and motor imaging treatment | Routine care, drug treatment, routine rehabilitation treatment and electroacupuncture treatment | Treatment was given once a day, 5 treatments per week. In total, 4 weeks of treatment was performed | MI treatment involves: (1) pre‐training preparation: before the training is performed the participant's level of motor functions is assessed. Cognitive ability and exercise of imagining the action is also evaluated (3) start of training action: according to the video, the participant follows the orientation to relax the whole body (2 minutes) → visualizes the actual action of the scene of a video of 5 to 10 seconds → then with eyes closed, according to the orientation, it is enough to imagine the action (the therapist remains on the hemiplegic side of the participant and performs tactile and proprioceptive stimulation for 5 to 10 seconds → the participant relaxes for 10 seconds → each operation was repeated 5 times → 20 minutes of the imagination of the movement | |
| MI: motor imagery; MIT‐EMG NMES: motor imagery training and electromyogram‐triggered neuromuscular electrical stimulation; TOCCT: task‐oriented circuit class training | ||||
| Outcome or subgroup title | No. of studies | No. of participants | Statistical method | Effect size |
| 1.1 Walking speed Show forest plot | 6 | 191 | Std. Mean Difference (IV, Random, 95% CI) | 0.44 [0.06, 0.81] |
| 1.2 Subgroup analysis: post‐stroke time Show forest plot | 6 | 191 | Std. Mean Difference (IV, Random, 95% CI) | 0.44 [0.06, 0.81] |
| 1.2.1 Subacute | 3 | 104 | Std. Mean Difference (IV, Random, 95% CI) | 0.67 [‐0.08, 1.43] |
| 1.2.2 Chronic | 2 | 47 | Std. Mean Difference (IV, Random, 95% CI) | 0.20 [‐0.37, 0.78] |
| 1.2.3 Subacute and chronic | 1 | 40 | Std. Mean Difference (IV, Random, 95% CI) | 0.26 [‐0.36, 0.88] |
| 1.3 Subgroup analysis: treatment dose Show forest plot | 5 | 161 | Std. Mean Difference (IV, Random, 95% CI) | 0.28 [‐0.03, 0.59] |
| 1.3.1 More than 1000 minutes | 2 | 68 | Std. Mean Difference (IV, Random, 95% CI) | 0.09 [‐0.38, 0.57] |
| 1.3.2 Less than 1000 minutes | 3 | 93 | Std. Mean Difference (IV, Random, 95% CI) | 0.42 [0.00, 0.83] |
| 1.4 Subgroup analysis: type of treatment Show forest plot | 6 | 191 | Std. Mean Difference (IV, Random, 95% CI) | 0.44 [0.06, 0.81] |
| 1.4.1 Motor imagery alone | 1 | 23 | Std. Mean Difference (IV, Random, 95% CI) | 0.19 [‐0.63, 1.01] |
| 1.4.2 Motor imagery associated with action observation or physical practice | 5 | 168 | Std. Mean Difference (IV, Random, 95% CI) | 0.48 [0.04, 0.92] |
| 1.5 Subgroup analysis: walking dependence Show forest plot | 4 | 117 | Std. Mean Difference (IV, Random, 95% CI) | 0.38 [0.01, 0.74] |
| 1.5.1 Dependent and independent of personal assistance | 2 | 63 | Std. Mean Difference (IV, Random, 95% CI) | 0.24 [‐0.26, 0.73] |
| 1.5.2 Independent of personal assistance | 2 | 54 | Std. Mean Difference (IV, Random, 95% CI) | 0.54 [‐0.06, 1.15] |
| 1.6 Subgroup analysis: forms of application of MI Show forest plot | 6 | 191 | Std. Mean Difference (IV, Random, 95% CI) | 0.44 [0.06, 0.81] |
| 1.6.1 Visual imagery | 1 | 44 | Std. Mean Difference (IV, Random, 95% CI) | 0.03 [‐0.56, 0.62] |
| 1.6.2 Kinesthetic imagery | 1 | 30 | Std. Mean Difference (IV, Random, 95% CI) | 0.84 [0.08, 1.59] |
| 1.6.3 Both visual and kinesthetic imagery | 4 | 117 | Std. Mean Difference (IV, Random, 95% CI) | 0.47 [‐0.02, 0.97] |
| Outcome or subgroup title | No. of studies | No. of participants | Statistical method | Effect size |
| 2.1 Motor function Show forest plot | 3 | 130 | Mean Difference (IV, Random, 95% CI) | 2.24 [‐1.20, 5.69] |
| 2.2 Subgroup analysis: post‐stroke time Show forest plot | 2 | 70 | Mean Difference (IV, Random, 95% CI) | 2.08 [‐5.06, 9.22] |
| 2.2.1 Subacute | 1 | 42 | Mean Difference (IV, Random, 95% CI) | ‐1.80 [‐5.75, 2.15] |
| 2.2.2 Chronic | 1 | 28 | Mean Difference (IV, Random, 95% CI) | 5.50 [3.79, 7.21] |
| 2.3 Subgroup analysis ‐ treatment dose Show forest plot | 3 | 130 | Mean Difference (IV, Random, 95% CI) | 2.24 [‐1.20, 5.69] |
| 2.3.1 More than 1000 minutes | 2 | 102 | Mean Difference (IV, Random, 95% CI) | 0.52 [‐2.99, 4.03] |
| 2.3.2 Less than 1000 minutes | 1 | 28 | Mean Difference (IV, Random, 95% CI) | 5.50 [3.79, 7.21] |
| 2.4 Subgroup analysis: forms of application of MI Show forest plot | 3 | 130 | Mean Difference (IV, Random, 95% CI) | 2.24 [‐1.20, 5.69] |
| 2.4.1 Visual imagery | 1 | 42 | Mean Difference (IV, Random, 95% CI) | ‐1.80 [‐5.75, 2.15] |
| 2.4.2 Kinesthetic imagery | 1 | 60 | Mean Difference (IV, Random, 95% CI) | 1.90 [0.37, 3.43] |
| 2.4.3 Both visual and kinesthetic imagery | 1 | 28 | Mean Difference (IV, Random, 95% CI) | 5.50 [3.79, 7.21] |
| Outcome or subgroup title | No. of studies | No. of participants | Statistical method | Effect size |
| 3.1 Functional mobility Show forest plot | 4 | 116 | Std. Mean Difference (IV, Random, 95% CI) | 0.55 [‐0.45, 1.56] |
| 3.1.1 Functional mobility ‐ Rivermead mobility index | 1 | 34 | Std. Mean Difference (IV, Random, 95% CI) | ‐0.34 [‐1.02, 0.34] |
| 3.1.2 Functional mobility ‐ Timed Up and Go test | 3 | 82 | Std. Mean Difference (IV, Random, 95% CI) | 0.88 [‐0.38, 2.14] |
| 3.2 Subgroup analysis: treatment dose Show forest plot | 2 | 64 | Std. Mean Difference (IV, Random, 95% CI) | 1.21 [‐0.85, 3.27] |
| 3.2.1 More than 1000 minutes | 1 | 36 | Std. Mean Difference (IV, Random, 95% CI) | 0.19 [‐0.46, 0.85] |
| 3.2.2 Less than 1000 minutes | 1 | 28 | Std. Mean Difference (IV, Random, 95% CI) | 2.30 [1.31, 3.28] |
| 3.3 Functional mobility ‐ sensitivity analysis: studies without high risk of bias Show forest plot | 2 | 62 | Std. Mean Difference (IV, Random, 95% CI) | 0.95 [‐1.63, 3.54] |
| 3.4 Functional mobility ‐ sensitivity analysis: without peripheral studies Show forest plot | 3 | 88 | Std. Mean Difference (IV, Random, 95% CI) | ‐0.00 [‐0.42, 0.42] |
| 3.5 Subgroup analysis: forms of application of MI Show forest plot | 3 | 82 | Std. Mean Difference (IV, Random, 95% CI) | 0.88 [‐0.38, 2.14] |
| 3.5.1 Visual imagery | 1 | 18 | Std. Mean Difference (IV, Random, 95% CI) | 0.25 [‐0.68, 1.18] |
| 3.5.2 Both visual and kinesthetic imagery | 2 | 64 | Std. Mean Difference (IV, Random, 95% CI) | 1.21 [‐0.85, 3.27] |