Agonistas beta2 de acción prolongada y antagonistas muscarínicos de acción prolongada una vez al día en un inhalador combinado versus placebo para la enfermedad pulmonar obstructiva crónica
Resumen
Antecedentes
La enfermedad pulmonar obstructiva crónica (EPOC) es un trastorno respiratorio que causa acumulación de moco en las vías respiratorias, tos y disnea; la enfermedad es progresiva y es la cuarta causa más común de muerte en todo el mundo. Las estrategias de tratamiento actuales para la EPOC son multimodales y procuran reducir la morbilidad y la mortalidad y aumentar la calidad de vida del paciente al desacelerar la progresión de la enfermedad y prevenir las exacerbaciones. Las combinaciones de dosis fija (CDF) de un agonista beta2 de acción prolongada (ABAP) más un antagonista muscarínico de acción prolongada (AMAP) administrados vía un único inhalador están autorizados por las autoridades reguladoras de los EE.UU., Europa y Japón para el tratamiento de la EPOC. Hay varias CDF de ABAP/AMAP disponibles y los metanálisis recientes han aclarado su utilidad versus sus mono‐componentes en la EPOC. La evaluación de la eficacia y la seguridad de las CDF de ABAP/AMAP una vez al día versus placebo facilitará la comparación de diferentes CDF en los metanálisis de redes futuros.
Objetivos
Se evaluó la evidencia de las combinaciones de ABAP/AMAP una vez al día (administradas en un único inhalador) versus placebo en los resultados clínicamente significativos en pacientes con EPOC estable.
Métodos de búsqueda
Se identificaron ensayos en el registro especializado de ensayos del Grupo Cochrane de Vías Respiratorias (Cochrane Airways' Specialised Register, CASR) y también se realizó una búsqueda en el US National Institutes of Health Ongoing Trials Register ClinicalTrials.gov (www.clinicaltrials.gov) y en la World Health Organization International Clinical Trials Registry Platform (apps.who.int/trialsearch). Se hicieron búsquedas en el CASR y en registros de ensayos, desde su inicio hasta el 3 diciembre 2018; no se impuso ninguna restricción en el idioma de publicación.
Criterios de selección
Se incluyeron ensayos controlados aleatorios (ECA) de grupos paralelos y cruzados que comparaban CDF de ABAP/AMAP una vez al día versus placebo. Se incluyeron los estudios informados como texto completo, los publicados como resumen solo y los datos no publicados. Se excluyeron los ensayos a muy corto plazo con una duración de menos de 3 semanas. Se incluyeron adultos (≥ 40 años) con diagnóstico de EPOC estable. Se incluyeron estudios que permitían a los participantes continuar utilizando CSI durante el ensayo siempre que el CSI no fuera parte del tratamiento asignado al azar.
Obtención y análisis de los datos
Dos autores de la revisión de forma independiente cribaron los resultados de la búsqueda para determinar la inclusión de los estudios, extrajeron los datos sobre los resultados de interés predeterminados y evaluaron el riesgo de sesgo de los estudios incluidos; los desacuerdos se resolvieron mediante discusión con un tercer autor de la revisión. Cuando fue posible, se usó un modelo de efectos aleatorios para realizar un metanálisis de los datos extraídos. Todos los resultados se calificaron mediante los criterios GRADE (Grades of Recommendation, Assessment, Development and Evaluation) y los resultados se presentaron en la tabla "Resumen de resultados".
Resultados principales
Se identificaron e incluyeron 22 ECA que habían asignado al azar a 8641 pacientes con EPOC a la CDF de ABAP/AMAP una vez al día (6252 participantes) o al placebo (3819 participantes); nueve estudios tuvieron un diseño cruzado. Los estudios tuvieron una duración de entre tres y 52 semanas (mediana 12 semanas). La media de edad de los participantes entre los estudios incluidos varió de 59 a 65 años y en 21 de 22 estudios, los participantes tenían EPOC de estadio II o III de GOLD. La administración concomitante de corticosteroides inhalados (CSI) se permitió en todos los estudios incluidos (cuando se declaró); en los estudios incluidos, entre un 28% a un 58% de los participantes estaban recibiendo CSI al inicio. Seis estudios evaluaron la combinación de una vez al día de IND/GLI (110/50 μg), siete estudios evaluaron TIO/OLO (2,5/5 o 5/5 μg), ocho estudios evaluaron UMEC/VI (62,5/5; 125/25 o 500/25 μg) y un estudio evaluó ACD/FOR (200/6; 200/12 o 200/18 μg); todas las combinaciones de ABAP/AMAP se compararon con placebo.
El riesgo de sesgo en general se consideró bajo o desconocido (detalles insuficientes proporcionados) y sólo un estudio por dominio se consideró en alto riesgo de sesgo excepto por el dominio de ‘otro sesgo’ que se determinó como en alto riesgo de sesgo en cuatro estudios (en tres estudios, la gravedad de la enfermedad fue mayor al inicio en los participantes que recibieron ABAP/AMAP en comparación con los participantes que recibieron placebo, lo cual se esperaría que cambie el efecto del tratamiento a favor del placebo).
En comparación con placebo, los resultados agrupados para los resultados primarios para el brazo de ABAP/AMAP una vez al día fueron los siguientes: mortalidad por todas las causas, OR 1,88 (IC del 95%: 0,81 a 4,36; evidencia de certeza baja); eventos adversos graves (EAG) por todas las causas, OR 1,06 (IC del 95%: 0,88 a 1,28; evidencia de certeza alta); exacerbaciones agudas de la EPOC (EAEPOC), OR 0,53 (IC del 95%: 0,36 a 0,78; evidencia de certeza moderada); puntuación ajustada del St George's Respiratory Questionnaire (SGRQ), DM ‐4,08 (IC del 95%: ‐4,80 a ‐3,36; evidencia de certeza alta); proporción de pacientes que responden en el SGRQ, OR 1,75 (IC del 95%: 1,54 a 1,99). En comparación con placebo, los resultados agrupados para los resultados secundarios para el brazo de ABAP/AMAP una vez al día fueron los siguientes: volumen espiratorio forzado en un segundo (VEF1) ajustado mínimo, DM 0,20 L (IC del 95%: 0,19 a 0,21; evidencia de certeza moderada); VEF1 ajustado máximo, DM 0,31 L (IC del 95%: 0,29 a 0,32; evidencia de certeza moderada); y los EA por todas las causas, OR 0,95 (CR 95% de 0,86 a 1,04; evidencia de certeza alta). Ningún estudio informó los datos de la prueba de caminata de seis minutos. Los resultados por lo general fueron consistentes a través de los subgrupos para diferentes combinaciones y dosis de ABAP/AMAP.
Conclusiones de los autores
En comparación con placebo, los ABAP/AMAP una vez al día (IND/GLI, UMEC/VI o TIO/OLO) vía un inhalador de combinación se asocian con una mejoría clínicamente significativa en la función pulmonar y la calidad de vida relacionada con la salud en pacientes con EPOC leve a moderada; El UMEC/VI parece reducir la tasa de exacerbaciones en esta población. Estas conclusiones son apoyadas por evidencia de certeza moderada o alta basada en estudios con un período de observación de hasta un año.
PICO
Resumen en términos sencillos
Agonistas beta2 de acción prolongada y antagonistas muscarínicos de acción prolongada una vez al día en un inhalador combinado versus placebo para la EPOC
Se deseaba saber si el tratamiento una vez al día con una combinación de dosis fija de un agonista beta2 de acción prolongada (ABAP) más un antagonista muscarínico de acción prolongada (AMAP) administrados vía un único inhalador es mejor que el tratamiento con un inhalador de simulacro (placebo) para los pacientes con enfermedad pulmonar obstructiva crónica (EPOC).
Antecedentes de la revisión
La EPOC es una enfermedad pulmonar y es la cuarta causa más común de muerte en todo el mundo. Los pacientes con EPOC presentan síntomas de tos, disnea y acumulación de moco, que se vuelve peor con el transcurso del tiempo. Los tratamientos actuales para la EPOC procuran controlar estos síntomas y mejorar la calidad de vida de los pacientes con la enfermedad.
Se ha demostrado que la combinación de un ABAP más un AMAP administrada una vez al día en un único inhalador (ABAP/AMAP) es más efectiva que la administración de cada uno por separado en inhaladores individuales. Hay varias combinaciones diferentes de ABAP y AMAP inhalados disponibles (p.ej. indacaterol/glicopirronio, olodaterol/tiotropio, formoterol/aclidinium y vilanterol/umeclidinium) y se usan para el tratamiento de la EPOC. Al recopilar la información de los ensayos clínicos que comparan ABAP/AMAP una vez al día con placebo en un inhalador de simulacro se proporcionará información para ayudar a la investigación futura a decidir qué combinación es mejor para el tratamiento de los pacientes con EPOC.
¿Qué se encontró?
Veintidós estudios (incluidos 8641 pacientes con EPOC) compararon ABAP/AMAP una vez al día en un único inhalador con un inhalador de simulacro. A los pacientes se les permitió continuar utilizando corticosteroides inhalados (CSI) durante los estudios; aproximadamente un tercio a una mitad de los pacientes estaban usando CSI al comienzo de cada estudio. La evidencia presentada en esta revisión está actualizada hasta diciembre de 2018. La mayoría de los pacientes que participaron en los estudios tenía EPOC leve a moderada y la edad promedio de los pacientes de cada estudio varió de 59 a 65 años. Seis estudios evaluaron la combinación una vez al día de indacaterol/glicopirronio, siete estudios evaluaron tiotropio/olodaterol, ocho estudios evaluaron umeclidinium/vilanterol y un estudio evaluó aclidinium/formoterol.
Los pacientes que recibieron ABAP/AMAP una vez al día mediante un único inhalador mostraron una mejoría mayor en la calidad de vida que los que recibieron placebo en un inhalador de simulacro; la función pulmonar también mejoró en los pacientes que recibieron ABAP/AMAP una vez al día. Los pacientes que recibieron umeclidinium/vilanterol tuvieron menos exacerbaciones. No hubo diferencias significativas entre los grupos (ABAP/AMAP versus placebo) en la cantidad de pacientes que murieron, o en la cantidad de pacientes que experimentaron eventos adversos graves o cualquier evento adverso. Los resultados fueron similares para las diferentes combinaciones y dosis de ABAP/AMAP que se evaluaron.
Los estudios incluidos por lo general fueron bien diseñados y bien informados. Los pacientes de los estudios y los que realizaron la investigación no sabían qué tratamiento estaban recibiendo los pacientes, lo cual asegura una evaluación justa de los tratamientos.
En tres de los estudios, los pacientes que estaban recibiendo ABAP/AMAP una vez al día presentaron EPOC más grave al comienzo del estudio que los pacientes que recibieron inhaladores de simulacro; lo anterior podría haber reducido el efecto del tratamiento observado con ABAP/AMAP en estos estudios por lo que es posible tener seguridad en cuanto a que los resultados no sobrestiman el efecto observado con ABAP/AMAP una vez al día. Uno de los resultados de interés (la distancia que puede caminar el paciente en seis minutos) no se informó en ninguno de los estudios incluidos. En términos generales, es posible confiar en las conclusiones de esta revisión.
Conclusiones de los autores
Summary of findings
| Once daily LABA/LAMA in a combined inhaler compared with placebo in adults with COPD | ||||||
| Patient or population: Adults with COPD | ||||||
| Outcomes | Anticipated absolute effects* (95% CI) | Relative effect | № of participants | Certainty of the evidence | Comments | |
| Risk with placebo | Risk with once daily LABA/LAMA in a combined inhaler | |||||
| All‐cause mortality | 1 per 1,000 | 2 per 1,000 | OR 1.88 | 8752 | ⊕⊕⊝⊝ | |
| Serious adverse events (3‐week to 1‐year follow‐up) | 47 per 1,000 | 50 per 1,000 | OR 1.06 | 10536 | ⊕⊕⊕⊕ | |
| Acute exacerbations of COPD (4‐week to 24‐week follow‐up) | 136 per 1,000 | 77 per 1,000 | OR 0.53 | 1127 | ⊕⊕⊕⊝ | Data limited to UMEC/VI versus placebo comparison |
| Difference vs placebo in adjusted SGRQ score (HRQoL) Scale 0‐100, lower on the scale is better. (12‐week to 1‐year follow‐up) | Mean change from baseline in SGRQ score with placebo ranged from 6.39 lower to 0.12 higher | MD 4.08 points lower | ‐ | 4952 | ⊕⊕⊕⊕ | MD exceeded MCID (4 points). |
| Difference vs placebo in adjusted trough FEV1 at EOT (3‐week to 1‐year follow‐up) | Mean change from baseline in trough FEV1 with placebo ranged from 0.08 L lower to 0.01 L higher | MD 0.20 L higher | ‐ | 6598 | ⊕⊕⊕⊝ | MD exceeded MCID. |
| Difference vs placebo in adjusted peak FEV1 (3‐week to 6‐month follow‐up) | Mean change from baseline in peak FEV1 with placebo ranged from 0.04 to 0.1 L higher | MD 0.31 L higher | ‐ | 4188 | ⊕⊕⊕⊝ | |
| Adverse events (3‐week to 1‐year follow‐up) | 448 per 1,000 | 435 per 1,000 | OR 0.95 | 8235 | ⊕⊕⊕⊕ | |
| *The risk in the intervention group (and its 95% confidence interval) is based on the assumed risk in the comparison group and the relative effect of the intervention (and its 95% CI). | ||||||
| GRADE Working Group grades of evidence | ||||||
| 1 Downgraded once for indirectness; duration of treatment varied widely: maximum duration 52 weeks, n = 3 studies duration < 6 weeks. 2 Downgraded once for imprecision; wide 95% confidence intervals due to low number of events – confidence intervals encompassed no effect, benefit, and risk. 3 Downgraded once for indirectness as all studies examined UMEC/VI. 4 Downgraded once for inconsistency; significant heterogeneity (overall I2 ≥ 68%), noting that effect sizes were similar between studies with the exception of ACLID/FORM. | ||||||
Antecedentes
Descripción de la afección
La enfermedad pulmonar obstructiva crónica (EPOC) es un trastorno progresivo que es resultado de la interacción compleja entre las exposiciones ambientales (p.ej. humo de cigarrillo) y los factores genéticos (Barnes 2015). La enfermedad se caracteriza por una limitación crónica del flujo aéreo, que no es del todo reversible y exacerbaciones intermitentes durante las cuales aumenta la gravedad de los síntomas. Los síntomas incluyen disnea, mayor producción de esputo y tos. El trastorno se diagnostica de forma objetiva mediante la evaluación espirométrica, con un volumen espiratorio forzado en un segundo / capacidad vital forzada (VEF1/CVF) posbroncodilatador < 0,70 que confirma la presencia de la limitación del flujo aéreo. La gravedad de la EPOC es calificada por el grado de la limitación del flujo aéreo según los criterios de las guías internacionales (GOLD 2017).
La EPOC es la cuarta causa más habitual de muerte en todo el mundo (WHO 2015), y tiene una prevalencia estimada de 6,4%; la carga en los servicios de asistencia sanitaria a nivel mundial es significativa (CDC 2016; GOLD 2017).
Las estrategias de tratamiento actuales son multimodales y procuran reducir la morbilidad y la mortalidad y aumentar la calidad de vida del paciente al desacelerar la progresión de la enfermedad y prevenir las exacerbaciones. Las intervenciones incluyen abandono del hábito de fumar y rehabilitación pulmonar, vacunación contra la influenza y neumonía y la administración de corticosteroides inhalados (CSI) y broncodilatadores (GOLD 2017). El oxígeno suplementario es una opción para prolongar la vida en los pacientes hipoxémicos. Aunque el tratamiento no es curativo, de manera ocasional los pacientes pueden ser candidatos a un trasplante de pulmones (GOLD 2017).
Descripción de la intervención
Los agonistas beta2 de acción prolongada (ABAP) y los anticolinérgicos de acción prolongada (AMAP) se usan con frecuencia en pacientes con EPOC según lo recomendado por las guías de la EPOC (GOLD 2017; Wedzicha 2017). Cada broncodilatador puede administrarse de forma individual o en combinación mediante dos inhaladores separados o un único inhalador en una combinación de dosis fija (CDF; denotado aquí como ABAP/AMAP). La evidencia indica que la combinación de un ABAP y tiotropio en los inhaladores individuales ofrece beneficios sobre la administración de cualquiera de los componentes solos, en cuanto a la función pulmonar y la calidad de vida (Farne 2015). La necesidad de combinaciones de dosis fijas de único inhalador surgió por varias razones incluida la eficacia insuficiente del salmeterol y el tiotropio administrados a través de dispositivos separados (Aaron 2007) y las ventajas potenciales en cuanto a la comodidad y adherencia (Bangalore 2007). Esta revisión ha sintetizado la evidencia de la seguridad y la eficacia de la CDF de ABAP/AMAP una vez al día versus placebo en pacientes con EPOC.
De qué manera podría funcionar la intervención
La administración concurrente de ABAP/AMAP en la EPOC tiene efectos beneficiosos sobre la función pulmonar, las puntuaciones de la disnea, la calidad de vida relacionada con la salud y posiblemente la prevención de las exacerbaciones agudas de la EPOC (EAEPOC) (Calzetta 2016; Wedzicha 2014). Se cree que la broncodilatación forma la base de estos beneficios, aunque existe la teoría de que una reducción de la hiperinflación, la modulación de la producción y la depuración del moco y los efectos potencialmente antiinflamatorios también contribuyen (Beeh 2016). En cuanto a la broncodilatación, la administración de ABAP y AMAP juntos es más efectiva en comparación con cualquiera de los agentes solos (Singh 2014a; van noord 2005), aunque la naturaleza de esta interacción no está del todo clara y los estudios in vitro y clínicos sugieren que hay un efecto sinérgico en lugar de aditivo (cazzola 2015). El mecanismo del aumento de la broncodilatación se ha atribuido principalmente a la activación de los receptores beta2 presinápticos, que atenúan la liberación de la acetilcolina de unión (Calzetta 2015). Además, la relajación de los músculos lisos de las vías respiratorias lograda con un ABAP (a través del aumento del monofosfato de adenosina cíclica) es amplificada por el bloqueo de la acetilcolina mediante la inhibición de los receptores muscarínicos M3 (Cazzola 2010) y hay evidencia para sugerir que los receptores M2 interactúan también con la adenil ciclasa (Beeh 2016).
Por qué es importante realizar esta revisión
Las combinaciones de dosis fija (CDF) de un agonista beta2 de acción prolongada (ABAP) más un antagonista muscarínico de acción prolongada (AMAP) administradas vía un único inhalador están autorizados por las autoridades reguladoras de los EE.UU., Europa y Japón para el tratamiento de la EPOC. La introducción de estos inhaladores siguen las recomendaciones basadas en las guías para optimizar el uso de broncodilatadores inhalados (Quaseem 2011; Vestbo 2013). Los metanálisis recientes han aclarado la utilidad de los inhaladores de combinación de ABAP/AMAP en comparación con sus mono‐componentes en la EPOC, en particular en lo que se refiere al VEF1 mínimo, el índice de disnea transitoria (IDT), el St. George’s Respiratory Questionnaire (SGRQ) y la seguridad (Calzetta 2016; Calzetta 2017). Encontraron mejorías estadística y clínicamente significativas en el VEF1 mínimo para todas las combinaciones de dosis fija (CDF) en comparación con sus mono‐componentes. Aunque hubo mejorías estadísticamente significativas en el IDT y el SGRQ, las mismas estuvieron por debajo de las diferencias mínimas clínicamente importantes (DMCI) previamente establecidas y por lo tanto el significado clínico de este beneficio no está claro. Los efectos secundarios, incluidos los eventos cardíacos, no fueron mayores en los que recibieron ABAP/AMAP. No hubo diferencias significativas entre las diferentes CDF para los resultados examinados (Calzetta 2016; Calzetta 2017). Los ensayos clínicos individuales han demostrado una reducción de la EAEPOC con ABAP/AMAP versus mono‐componentes y versus placebo (Bateman 2015; Wedzicha 2017). Lamentablemente, los beneficios de los ABAP/AMAP en las EAEPOC no se incluyeron en los metanálisis y por lo tanto aún deben aclararse. La evaluación de la eficacia y la seguridad de las combinaciones de dosis fija de ABAP/AMAP una vez al día versus placebo facilitará la comparación de diferentes CDF en los metanálisis de redes futuros.
Objetivos
Evaluar los efectos de las combinaciones de ABAP/AMAP de único inhalador versus placebo sobre los resultados clínicamente significativos en pacientes con EPOC estable.
Métodos
Criterios de inclusión de estudios para esta revisión
Tipos de estudios
Se incluyeron ensayos controlados aleatorios (ECA) cruzados y de grupos paralelos. Se incluyeron los estudios informados como texto completo, los publicados como resumen solo y los datos no publicados. Se excluyeron los ensayos a muy corto plazo (es decir, ≤ tres semanas de duración).
Tipos de participantes
Se incluyeron adultos (≥ 40 años) con diagnóstico de EPOC estable. Se registró la definición de los autores del estudio de la EPOC estable. No se excluyó a los participantes con comorbilidades.
Tipos de intervenciones
Se incluyeron ensayos que comparaban ABAP/AMAP una vez al día en un único inhalador (es decir combinación de dosis fija) versus placebo.
Se incluyeron estudios que permitían a los participantes continuar utilizando CSI durante el ensayo siempre que el CSI no fuera parte del tratamiento asignado al azar; si el CSI se administraba en combinación con ABAP antes del ensayo, los participantes debían realizar la transición a la monoterapia con el CSI equivalente antes del comienzo del estudio. Se planificó examinar el efecto del uso continuo de CSI mediante el análisis de subgrupos (ver Análisis de subgrupos e investigación de la heterogeneidad).
Tipos de medida de resultado
Resultados primarios
-
Mortalidad por todas las causas.
-
Eventos adversos graves (EAG) de cualquier causa.
-
Exacerbaciones agudas de la EPOC (EAEPOC).
-
Calidad de vida relacionada con la salud respiratoria (CVRS) medida con el
-
St. George's Respiratory Questionnaire (SGRQ).
-
Chronic Respiratory Diseases Questionnaire (CRQ).
-
Observaciones acerca de los resultados primarios
Eventos adversos graves
Los EAG pueden incluir la muerte, reacciones adversas potencialmente mortales, la hospitalización o una mayor duración de la estancia hospitalaria, discapacidad y defectos congénitos. Se registró la definición de cada estudio de un EAG cuando variaba en cuanto a la definición.
La calidad de vida relacionada con la salud respiratoria
El CRQ y el SGRQ son medidas fiables y válidas ampliamente usadas del estado de salud informado por el paciente en la EPOC (Guyatt 1987; Jones 1992). El SGRQ califica tres dominios del estado de salud (síntomas, actividad del paciente y repercusión de la enfermedad) e informa puntuaciones que varían de cero (mejor) a 100 (peor). La Diferencia Mínima Clínicamente Importante (DMCI) es aproximadamente de cuatro (Schunemann 2003). O sea, un cambio clínicamente significativo en el estado de salud es igual a un cambio de alrededor de cuatro puntos en el SGRQ. El CRQ califica cuatro dominios (disnea, fatiga, función emocional y dominio), informa puntuaciones que varían de uno (peor) a siete (mejor) y tiene una DMCI de 0,5 (Schunemann 2005). Aunque el CRQ y el SGRQ proporcionan información muy similar y están muy correlacionados, el SGRQ es menos receptivo; se observó que subestima los efectos del tratamiento en comparación con el CRQ en poblaciones idénticas (Puhan 2006). Por lo tanto, el agrupamiento de los datos del SGRQ con datos del CRQ puede indicar heterogeneidad del efecto del tratamiento de forma errónea. Por lo tanto, el SGRQ y el CRQ se consideraron resultados separados; este enfoque está de acuerdo con las recomendaciones de Puhan 2006 que indican que las diferencias medias para el SGRQ y el CRQ deben informarse por separado.
Exacerbaciones agudas de la EPOC
Se incluyeron las EAEPOC como un resultado principal debido a que las exacerbaciones están vinculadas de manera sistemática a la mortalidad, la morbilidad y las hospitalizaciones costosas. Debido a que no existe una definición de consenso ni criterios de informe estándar para las EAEPOC (Cazzola 2008), se realizó un metanálisis de los datos de las EAEPOC sólo cuando los autores del estudio usaron una de las siguientes definiciones: aumento de los síntomas que precipitan la administración de antibióticos; aumento de los síntomas que precipitan la administración de esteroides sistémicos; aumento de los síntomas que precipitan la visita a sala de urgencias; u hospitalización. La DMCI para los resultados de las EAEPOC no está establecida: Calverley 2005 calculó una DMCI de un 20% a un 25% mediante un enfoque de anclaje ordinario, mientras que Chapman 2013 usó un proceso de consenso de expertos para calcular una DMCI de un 11%.
Resultados secundarios
-
Volumen Espiratorio Forzado en Un Segundo (VEF1) mínimo (predosis).
-
VEF1 máximo (posdosis).
-
Prueba de caminata de seis minutos (6MWT).
-
Efectos adversos
Observaciones acerca de los resultados secundarios
Volumen espiratorio forzado
El VEF1 es el volumen de aire espirado a la fuerza un segundo después de la máxima inhalación. El VEF1 a menudo se usa para la clasificación de la EPOC (GOLD 2017): El VEF1 es un 20% inferior a lo normal para los pacientes con EPOC leve y un 70% inferior a lo normal para los pacientes con EPOC muy grave. El VEF1 también se usa para evaluar el efecto del tratamiento. Sin embargo, la DMCI para el VEF1 no se ha establecido de manera cuantitativa (el dictamen pericial propone una DMCI de 100 mL a 140 mL) (Cazzola 2008). Además, el VEF1 es una variable de evaluación intermedia, y representa el flujo aéreo como un substituto para los resultados clínicamente importantes. Los resultados substitutivos no están centrados en el paciente. No obstante, se incluyó el VEF1 mínimo debido a que un metanálisis apunta hacia a una correlación moderada entre el aumento del VEF1 mínimo y la mejoría en el SGRQ (Westwood 2011). Con objeto de realizar esta revisión se considerará que la DMCI para el VEF1 es de 100 mL (Donohue 2005).
Prueba de caminata de seis minutos
En el estudio ECLIPSE (un estudio de cohortes no intervencional de los pacientes tratados con EPOC), el cambio a un año en la 6MWT predijo la muerte en los 12 meses posteriores. El cambio medio entre los grupos entre los supervivientes y los no supervivientes fue de 30 metros (IC del 95%: 26 a 34). Mediante estos resultados, Polkey 2013 propuso una DMCI de alrededor de 30 metros.
Efectos adversos
Se analizaron los efectos adversos por todas las causas y los eventos adversos graves informados en los estudios de los ABAP o los AMAP.
Métodos de búsqueda para la identificación de los estudios
Búsquedas electrónicas
We searched the Cochrane Airways Trials Register on 3 December 2018. The Cochrane Airways Trials Register is maintained by the Information Specialist for the Group and contains studies identified from several sources:
-
Monthly searches of the Cochrane Central Register of Controlled Trials (CENTRAL), through the Cochrane Register of Studies ‐ CRS Web;
-
Weekly searches of MEDLINE Ovid SP;
-
Weekly searches of Embase Ovid SP;
-
Monthly searches of PsycINFO Ovid SP;
-
Monthly searches of CINAHL EBSCO (Cumulative Index to Nursing and Allied Health Literature);
-
Monthly searches of AMED EBSCO (Allied and Complementary Medicine);
-
Handsearches of the proceedings of major respiratory conferences.
Studies contained in the Trials Register were identified through search strategies based on the scope of Cochrane Airways. Details of these strategies, as well as a list of handsearched conference proceedings, are in Appendix 1. See Appendix 2 for search terms used to identify studies for this review.
We searched the following trials registries on 3 December 2018:
-
US National Institutes of Health Ongoing Trials Register ClinicalTrials.gov (www.clinicaltrials.gov);
-
World Health Organization International Clinical Trials Registry Platform (apps.who.int/trialsearch).
We searched the Cochrane Airways Trials Register and additional sources from inception, with no restriction on language of publication.
Búsqueda de otros recursos
We checked reference lists of all primary studies and review articles for additional references. We searched relevant manufacturers' web sites for trial information.
We searched for errata or retractions from included studies published in full‐text on PubMed (www.ncbi.nlm.nih.gov/pubmed) and reported the date this was done within the review.
Obtención y análisis de los datos
Selección de los estudios
Two review authors (DE, UM, RW, or TH) independently screened each title and abstract for inclusion of all the potential studies we identified as a result of the search and coded them as 'retrieve' (eligible or potentially eligible/unclear) or 'do not retrieve'. We retrieved the full‐text study reports/publications that appeared eligible and two review authors (DE, UM, TH, or RW) independently screened each full‐text paper and identified studies for inclusion, or identified and recorded reasons for exclusion of the ineligible studies. We resolved any disagreement through discussion or, if required, we consulted a third person (DE, UM, RW, or TH). We identified and excluded duplicates and collated multiple reports of the same study so that each study rather than each report was the unit of interest in the review. We recorded the selection process in sufficient detail to complete a PRISMA flow diagram and Characteristics of excluded studies table.
Extracción y manejo de los datos
We used a data collection form for study characteristics and outcome data which had been piloted on at least one study in the review. Two review authors (DE, UM, RW, or TH) extracted study characteristics from each included study. We extracted the following study characteristics.
-
Methods: study design, total duration of study, details of any 'run‐in' period, number of study centres and location, study setting, withdrawals, and date of study.
-
Participants: N, mean age, age range, gender, severity of condition, diagnostic criteria, baseline lung function, smoking history, inclusion criteria, and exclusion criteria.
-
Interventions: intervention, comparison, concomitant medications, and excluded medications.
-
Outcomes: primary and secondary outcomes specified and collected, and time points reported.
-
Notes: funding for trial, and notable conflicts of interest of trial authors.
Two review authors (DE, UM, RW, or TH) independently extracted outcome data from each included study. We noted in the Characteristics of included studies table if outcome data were not reported in a usable way. We resolved disagreements by consensus or by involving a third person (DE, UM, RW, or TH). One review author (DE) transferred data into the Review Manager file. We double‐checked that data have been entered correctly by comparing the data presented in the systematic review with the study reports. A second review author (RW) spot‐checked study characteristics for accuracy against the trial report.
Trials may report continuous outcomes as change scores (i.e. change from baseline) or final values. As per the Cochrane Handbook for Systematic Reviews of Interventions (Higgins 2011), we presented mean differences in change scores in one subgroup, mean differences in final values in another, and pooled both subgroups for an overall analysis.
Where multiple time points were reported for outcomes, we chose the time point that maximised length of follow‐up for the randomised treatment period.
Evaluación del riesgo de sesgo de los estudios incluidos
Two review authors (DE, KP, or FE) independently assessed the risk of bias for each study using the criteria outlined in the Cochrane Handbook for Systematic Reviews of Interventions (Higgins 2011). We resolved any disagreements by discussion or by involving a third author (DE, KP, or FE). We assessed the risk of bias according to the following domains.
-
Random sequence generation.
-
Allocation concealment.
-
Blinding of participants and personnel.
-
Blinding of outcome assessment.
-
Incomplete outcome data.
-
Selective outcome reporting.
-
Other bias.
We graded each potential source of bias as high, low, or unclear and provided a quote from the study report together with a justification for our judgement in the 'Risk of bias' table. We summarised the risk of bias judgements across different studies for each of the domains listed. We considered blinding separately for different key outcomes, where necessary (e.g. for unblinded outcome assessment, risk of bias for all‐cause mortality may be very different than for a patient‐reported pain scale). Where information on risk of bias related to unpublished data or correspondence with a trialist, we noted this in the 'Risk of bias' table.
When considering treatment effects, we took into account the risk of bias for the studies that contributed to that outcome.
Assessment of bias in conducting the systematic review
We conducted the review according to this published protocol and reported any deviations from it in the Differences between protocol and review section of the systematic review.
Medidas del efecto del tratamiento
We analysed dichotomous data as odds ratios and continuous data as mean differences or standardised mean differences. We entered data presented as a scale with a consistent direction of effect.
We performed meta‐analyses only where this was meaningful, i.e. if the treatments, participants, and the underlying clinical question were similar enough for pooling to make sense.
We narratively described skewed data reported as medians and interquartile ranges.
Where multiple trial arms were reported in a single trial, we included only the relevant arms. If two comparisons (e.g. drug A versus placebo and drug B versus placebo) were combined in the same meta‐analysis, we halved the control group to avoid double‐counting.
Cuestiones relativas a la unidad de análisis
We analysed dichotomous data using participants as the unit of analysis (rather than events) to avoid counting the same participant more than once. Paired data from each participant in cross‐over trials were analysed using the Generic Inverse Variance method.
Manejo de los datos faltantes
We contacted investigators or study sponsors in order to obtain missing numerical outcome data where possible (e.g. when a study was identified as abstract only). That is, if study authors did not report true intention‐to‐treat (ITT) data, we attempted an available case analysis by including data for all participants for whom outcome data were collected (whether the participants completed or did not complete the trial). Please note that a case analysis is not a true ITT analysis, nor a per‐protocol analysis.
If we could not obtain missing data from study authors, we planned to:
-
compare our available case analysis with an imputed, true ITT analysis (see Sensitivity Analyses);
-
use an average standard deviation (SD) borrowed from other studies included in our meta‐analysis if the SD for a mean difference was unavailable (or incalculable);
-
use final values instead of the change‐from‐baseline values if the standard deviation for a change score was missing.
If the missing data were thought to introduce serious bias, we planned to explore the impact of including such studies in the overall assessment of results by a sensitivity analysis.
Evaluación de la heterogeneidad
We used the I² statistic to measure heterogeneity among the trials in each analysis. If we identified substantial heterogeneity (i.e. I2 greater than 30%) we reported it and explored possible causes by prespecified subgroup analysis.
Evaluación de los sesgos de notificación
If we were able to pool more than 10 trials, we planned to create and examine a funnel plot to explore possible small study and publication biases.
Síntesis de los datos
We used a fixed‐effect model and performed a sensitivity analysis with a random‐effects model. Where study authors reported exacerbation rate, we meta‐analysed rate data when study authors accounted for duration of follow‐up and inter‐patient variability (Aaron 2008). The odds ratio was our primary summary statistic. Where possible, we also reported AECOPD as the percentage of participants experiencing at least one exacerbation. This way, AECOPD could be presented as a dichotomous outcome, and a patient‐based number needed to treat for an additional beneficial outcome (NNTB) could be reported. When possible, we also reported SGRQ and CRQ as dichotomous outcomes (i.e. participants who reached the MCID versus participants who did not).
Summary of findings table
We created a 'Summary of findings' table using the seven primary and secondary outcomes identified above; for health‐related quality of life, SGRQ was reported in the 'summary of findings' table. We used the five GRADE considerations (study limitations, consistency of effect, imprecision, indirectness, and publication bias) to assess the certainty of a body of evidence as it related to the studies which contributed data to the meta‐analyses for the prespecified outcomes. We used the methods and recommendations described in Section 8.5 and Chapter 12 of the Cochrane Handbook for Systematic Reviews of Interventions (Higgins 2011) using GRADEpro software. We justified all decisions to downgrade or upgrade the certainty of the evidence using footnotes and we made comments to aid reader's understanding of the review, where necessary.
Análisis de subgrupos e investigación de la heterogeneidad
We planned to carry out the following subgroup analyses:
-
participants with ICS use during the trial versus participants without ICS use during the trial;
-
different LABA/LAMA combinations (IND/GLY; UMEC/VI; TIO/OLO; ACM/FOR);
-
length of follow‐up (less than six months versus six months or longer);
-
baseline COPD severity (mild or moderate disease versus severe disease, according to GOLD criteria).
We used our primary outcomes in subgroup analyses.
We used the formal test for subgroup interactions in Review Manager.
Análisis de sensibilidad
We planned to carry out the following sensitivity analyses:
-
a comparison of available case analysis to true ITT analyses, where the ITT analyses were imputed with best‐case and worse‐case outcome data;
-
a comparison of results from fixed‐effect models with results from random‐effects models;
-
a comparison based on our 'risk of bias' assessments (i.e. exclusion of studies with a high risk of bias).
Results
Description of studies
The Characteristics of included studies tables presents details of the included studies; a summary table is also provided (Table 1). In the Characteristics of excluded studies table, we reported reasons for the exclusion of studies considered during review of full‐text articles.
| Study | RCT Design | N rand. | Country/region | Interventiona (dose in μg) | Participant baseline characteristics | ||||
| Age, yearsb | Male (%)b | % pred. FEV1c | Smoking status | ICS use (%)b,d | |||||
| Parallel | 709 | Worldwide | IND/GLY 110/50 | 64.0‐64.4 | 73‐76 | 55 | 40.1‐40.5 | 56.5‐57.8 | |
| Cross‐over | 85 | NS | IND/GLY 110/50 | 62.1 | 63 | 47 | 45 | 31 | |
| Cross‐over | 219 | Europe, N. America | TIO/OLO 2.5/5; 5/5 | 61.1 | 59 | 54 | 62.6 | 41.1 | |
| Parallel | 678 | NS | UMEC/VI 125/25 | 62.2‐63.4 | 64‐66 | 48 | 50‐52 | 44‐50 | |
| Parallel | 339 | Europe, Canada, Asia and South Africa | IND/GLY 110/50 | 62.5‐62.9 | 76‐77 | 57.5 | 45.1‐45.3 | 38.9‐45.8 | |
| Parallel | 693 | Worldwide | UMEC/VI 62.5/25 | 62.2‐63.1 | 70‐74 | 47.5 | 49‐54 | 49‐51 | |
| Parallel | 51 | USA | UMEC/VI 500/25 | 58.7‐59.2 | 57‐78 | 50 | 57‐78 | NR | |
| Parallel | 811 | Worldwide | IND/GLY 110/50 | 64.6‐64.9 | 71‐77 | NR | NR | NR | |
| Cross‐over | 247 | Europe, N. America | IND/GLY 110/50 | 62.8 | 70 | 56 | 45.5 | 54.9 | |
| Parallel | 404 | Europe, N. America, S. America | TIO/OLO 2.5/5; 5/5 | 60.8‐63.1 | 65‐68 | 59 | NR | NR | |
| Cross‐over | 349 | Europe, N. America, S. Africa | UMEC/VI 62.5/25; 125/25 | 61.6 | 56 | 51 | 63.2 | 28.2 | |
| Cross‐over | 308 | Europe, N. America, Russia | UMEC/VI 62.5/25; 125/25 | 62.6 | 55 | 51 | 60.6 | 39.4 | |
| Parallel | 425 | Europe, Australia, Russia | ACD/FOR 200/6; 200/12; 200/18 | 60.7‐63.9 | 75‐82 | NR | NR | NR | |
| Cross‐over | 99 | USA | UMEC/VI 62.5/25 | 60.7 | 53 | NR | NR | NR | |
| Cross‐over | 586 | N. America, S. America, Oceania, Europe | TIO/OLO 2.5/5; 5/5 | 61.7 | 71 | 58 | 39.1 | NR | |
| Cross‐over | N, America, S. America, Russia, Europe | TIO/OLO 2.5/5; 5/5 | 61.7 | 71 | 58 | 39.1 | NR | ||
| Parallel | 498 | Europe, USA, Russia | UMEC/VI 62.5/25 | 62.6‐64.1 | 58‐60 | 47.5 | 52‐55 | 45‐50 | |
| Parallel | 608 | Europe, N. America, S. Africa | TIO/OLO 2.5/5; 5/5 | 64.7‐65.1 | 56‐62 | 55.5 | 43.1‐54.7 | 34.8‐41.9 | |
| Parallel | 606 | Europe N. America, S. Africa, Oceania | TIO/OLO 2.5/5; 5/5 | 64.0‐65.2 | 58‐66 | 54.5 | 44.6‐47.0 | 35.1‐41.1 | |
| Parallel | 152 | Europe, Canada, Oceania | TIO/OLO 5/5 | 64.4‐65.0 | 63‐69 | NR | NR | NR | |
| Cross‐over | 194 | Germany | IND/GLY 110/50 | 62.8 | 66 | 62 | 56.7 | NR | |
| Parallel | 580 | China, South‐east Asia | UMEC/VI 62.5/25; 125/5 | 63.7‐64.3 | 92‐94 | NR | 25‐34 | 51‐54 | |
aPlacebo was the comparator in all studies.
bRange across treatment arms reported where overall data were not reported.
c % predicted FEV1 post‐bronchodilator.
dConcomitant ICS use was permitted in all studies (not stated for Celli 2014, Larbig 2015; NCT00626522; Troosters 2016).
Abbreviations: ACD: aclidinium; FOR: formoterol; GLY: glycopyrronium; IND: indacaterol; NR: not reported; OLO: olodaterol; rand: randomised; RCT: randomised controlled trial; TIO: tiotropium; UMEC: umeclidinium; VI: vilanterol.
Results of the search
We identified 1114 records by performing electronic searches of bibliographic databases . Of a total of 1059 records (55 duplicates removed), we excluded 765 upon screening titles and abstracts. We examined full‐text articles of the remaining 294 records and excluded 220 records (reporting 96 studies; see Excluded studies). The remaining 74 records reported the findings of 23 studies, which we included in this review (studies included in quantitative analyses, n = 22; studies awaiting classification, n = 1). Figure 1 depicts the flow of information through the different stages of this systematic review.
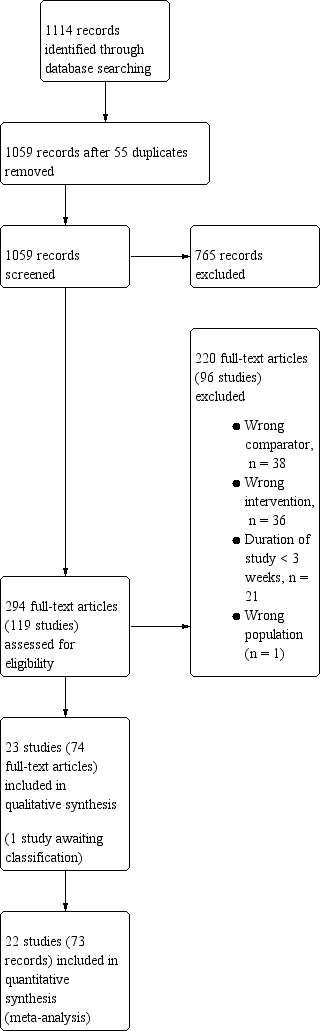
Study flow diagram.
Included studies
Of the 23 studies that met the inclusion criteria, there were twenty‐two included studies (Bateman 2013; Beeh 2014; Beeh 2015; Celli 2014; Dahl 2013; Donohue 2013; Feldman 2012; Larbig 2015; Mahler 2014; Maltais 2014b; Maltais 2014c; Maltais 2014; NCT00626522; NCT02275052; O'Donnell 2015a; O'Donnell 2015b; Siler 2016; Singh 2016a; Singh 2016b; Troosters 2016; Watz 2016; Zheng 2014) and one study awaiting classification (NCT02233543 2014). A majority of included studies were reported as full peer‐reviewed articles, with the exception of those reported as abstract only (Larbig 2015) or trial registry only (NCT00626522 and NCT02275052).
Methods
Of the included studies, 13 had a parallel‐group design and nine had a cross‐over design; all 22 studies were described as double‐blind (blinding of participants and staff occurred in 15 studies and was unclear in seven studies; blinding of outcome assessors occurred in six studies and was unclear in 16 studies). Studies had a randomly assigned treatment period ranging from three weeks to 52 weeks (mean 11 weeks; median 12 weeks; mode 12 weeks); a minority of studies had a duration of six months or longer (6 months, n = 4; 12 months, n = 2). All studies were multicentre studies; 19 of 22 studies were international, with the exception of trials performed solely in Germany (Watz 2016) or the USA (Feldman 2012; NCT02275052). Overall, there was good geographical coverage; the majority of studies (16/22) enrolled participants from both Europe and North America and studies also enrolled a proportion of participants from China and Asia (Bateman 2013; Dahl 2013; Donohue 2013; Larbig 2015; Siler 2016), Oceania (O'Donnell 2015a; O'Donnell 2015b; Singh 2016a; Singh 2016b; Troosters 2016), Russia (Maltais 2014c; NCT00626522; O'Donnell 2015a; O'Donnell 2015b; Siler 2016) and South Africa (Dahl 2013; Maltais 2014b; Singh 2016a; Singh 2016b). Study setting was poorly reported, but appeared to represent a mix of academic/clinical research centres and primary or secondary care units.
Participants
The twenty‐two included studies randomised a total of 8641 participants (Table 1). Baseline characteristics were generally consistent across studies. Inclusion criteria for the majority of studies (n = 21/22) specified either GOLD stage II/III, or criteria aligned with this disease severity (i.e. post‐bronchodilator FEV1 < 70% or 80%; post‐bronchodilator FVC/FEV1 < 70%; MRC dyspnoea score ≥ 2); Beeh 2015 permitted inclusion of participants with GOLD stage II to IV. The mean ages of participants across the relevant arms of all included studies ranged from 59 to 65 years; the proportion of current smokers generally ranged from 40% to 55% (n = 20; two outliers: 25% (Zheng 2014) and 78% (Feldman 2012)). In each trial, a majority of participants were male (range across studies 53% to 82%; one outlier, 92% to 94% (Zheng 2014)). Where reported, post‐bronchodilator percent predicted FEV1 ranged from 47% to 62% (median ˜58%); Zheng 2014 did not report % predicted FEV1, but pre‐bronchodilator FEV1 was 1.2 L to 1.3 L; Larbig 2015, NCT00626522, NCT02275052 and Troosters 2016 did not report baseline lung‐function (abstract or trial registry only). Concomitant inhaled corticosteroid (ICS) use was permitted in all of the included studies (where stated); across the included studies, between 28% to 58% of participants were using ICS at baseline.
Intervention
Of the 8641 randomised participants across the 22 studies, and accounting for the enrolment in multiple arms of cross‐over studies, a total of 6252 participants were randomised to receive once‐daily LABA/LAMA via a combined inhaler, and 3819 participants were randomised to receive placebo. In the subgroup of parallel‐group trials, 4124 participants were randomised to receive once‐daily LABA/LAMA via a combined inhaler and 2520 participants were randomised to receive placebo. Across the 22 studies, six studies evaluated the once‐daily combination of IND/GLY (110/50 μg), seven studies evaluated TIO/OLO (2.5/5 or 5/5 μg), eight studies evaluated UMEC/VI (62.5/5, 125/25 or 500/25 μg) and one study evaluated ACD/FOR (200/6, 200/12 or 200/18 μg); all LABA/LAMA combinations were compared with placebo. Where reported, concomitant treatment with ICS was permitted by all studies with various restrictions relating to prior use and stable dose for a prespecified time prior to study initiation; whether concomitant ICS was permitted was not reported for one study (Troosters 2016).
Outcomes
With the exception of the 6MWT (secondary outcome), all of the prespecified outcomes were reported by at least three of the included studies. All‐cause mortality was reported by 18 studies, SAEs, by all 22 studies, AECOPD by three studies, difference versus placebo in adjusted trough FEV1 by 13 studies, difference versus placebo in adjusted peak FEV1 by seven studies, difference versus placebo in adjusted SGRQ score by eight studies, and all‐cause AEs by 18 studies (summary of findings Table for the main comparison). 6MWT was not reported by any of the included studies.
Excluded studies
Ninety‐six studies were excluded, primarily because either the intervention did not meet the inclusion criteria (i.e. the LAMA and LABA were not administered once‐daily in a fixed dose combination, or the combination was administered twice daily; n = 36 studies) or because the study did not include a placebo arm (n = 38). It was often difficult to ascertain from the abstract whether the LAMA and LABA were administered as a fixed‐dose combination and from the clinical trial record headers it was not always possible to identify whether a placebo group was included; this resulted in a high rate of exclusions at full‐text review stage. Other reasons for exclusion at this stage included 'duration < 3 weeks' (n = 21), 'wrong participant population' (healthy volunteers; n = 1).
Risk of bias in included studies
Please refer to the Characteristics of included studies tables for details on risk of bias and for supporting evidence for each study. Figure 2 provides a summary of 'risk of bias' judgements, presented by study and domain (sequence generation, allocation concealment, blinding, incomplete data, selective reporting and 'other'). Figure 3 depicts the risk of bias for each domain, presented as percentages across all included studies. Across 198 assessments (22 studies, nine risk of bias domains), 146 were considered to be at a low risk of bias, seven at a high risk of bias and 45 to have an unclear risk of bias.
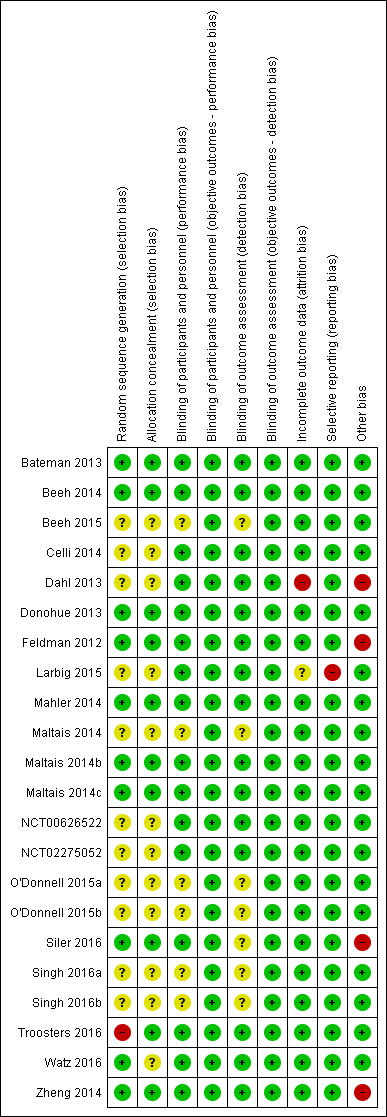
Risk of bias summary: review authors' judgements about each risk of bias item for each included study.
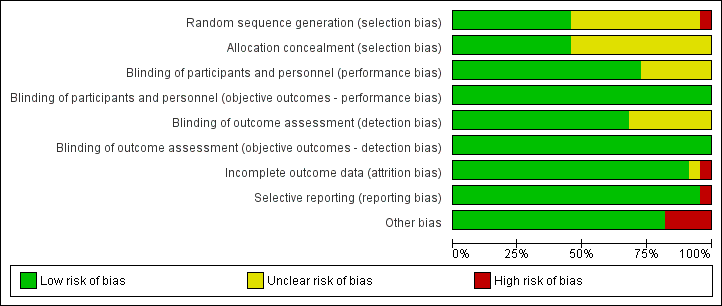
Risk of bias graph: review authors' judgements about each risk of bias item presented as percentages across all included studies.
Allocation
More than half of the included studies provided insufficient information regarding methods of random sequence generation (11 of 22 studies) and concealment of treatment allocation (12 of 22 studies) to allow a judgement on risk of bias; the risk of bias for these studies was rated as unclear. Ten studies employed adequate methods of random sequence generation and were considered to be at low risk of bias. (Bateman 2013; Beeh 2014; Donohue 2013; Feldman 2012; Mahler 2014; Maltais 2014b; Maltais 2014c; Siler 2016; Watz 2016; Zheng 2014) or adequate methods of allocation concealment (Bateman 2013; Beeh 2014; Donohue 2013; Feldman 2012; Mahler 2014; Maltais 2014b; Maltais 2014c; Siler 2016; Troosters 2016; Zheng 2014). Inadequate methods of random sequence generation (pseudo‐random number generator and block randomisation) were employed in one study (Troosters 2016), which was considered to be at high risk of bias.
Blinding
We considered the risk of performance and detection bias separately for objective and subjective outcomes. For objective outcomes (all‐cause mortality, SAEs, AECOPD, lung function and AEs) we considered that a lack of blinding would not result in a risk of detection or performance bias; therefore all studies were considered to be at low risk of bias with respect to these outcomes. The only subjective outcome relevant to this review was HRQoL based on assessment by SGRQ; sixteen studies were considered to be at a low risk of performance bias (Bateman 2013; Beeh 2014; Celli 2014; Dahl 2013; Donohue 2013; Feldman 2012; Larbig 2015; Mahler 2014; Maltais 2014b; Maltais 2014c; NCT00626522; NCT02275052; Siler 2016; Troosters 2016; Watz 2016; Zheng 2014); and the risk of performance bias was unclear for the remaining six studies (Beeh 2015; Maltais 2014; O'Donnell 2015a; O'Donnell 2015b; Singh 2016a; Singh 2016b). For HRQoL, the risk of detection bias was considered low for fifteen studies (Bateman 2013; Beeh 2014; Celli 2014; Dahl 2013; Donohue 2013; Feldman 2012; Larbig 2015; Maltais 2014b; Maltais 2014c; Mahler 2014; NCT00626522; NCT02275052; Watz 2016; Troosters 2016; Zheng 2014) and unclear in seven studies (Beeh 2015; Maltais 2014; O'Donnell 2015a; O'Donnell 2015b; Siler 2016; Singh 2016a; Singh 2016b).
Incomplete outcome data
We considered 20 of 22 studies to be at low risk of attrition bias on the basis of low and balanced rates of participant withdrawal, which were adequately documented in the trial reports. One study (Dahl 2013) was considered to be at high risk for attrition bias based on a greater than 20% rate of attrition in the placebo arm versus < 15% in the IND/GLY arm; insufficient information was reported by one study (Larbig 2015), resulting in a rating of unclear risk of attrition bias.
Selective reporting
We considered 21 of 22 studies to be at low risk of reporting bias. One study (Larbig 2015) was considered to be at high risk for reporting bias as the abstract (abstract only) did not report key prespecified outcomes (as reported on the trial registry site).
Other potential sources of bias
We considered there to be potential sources of bias present in four of the studies. In Dahl 2013, more participants in the QVA149 group had severe COPD versus those in the placebo group; however, this would likely skew treatment effect in favour of placebo. An imbalance in baseline characteristics in Feldman 2012 suggested that randomisation was not robust, although the limited sample size of the placebo group could also account for imbalance in baseline characteristics. In Siler 2016, a greater proportion of participants with GOLD category D were enrolled in the active treatment group, possibly favouring placebo and underestimation of the treatment effect. In Zheng 2014, a higher proportion of participants with GOLD Stage IV were enrolled in the UMEC/VI 62.5/25 µg group compared with placebo and could potentially skew the treatment effect in favour of placebo. These four studies were considered to be at high risk of 'other' bias; however, we noted that in three cases, the issue would tend to skew the results in favour or placebo, resulting in a potential underestimation of the treatment effect.
Effects of interventions
Structure of the meta‐analysis
As per the protocol, we elected to perform a meta‐analysis only when interventions and outcomes were sufficiently similar for pooling of the data. We subgrouped the data in the forest plots according to the type and dose of LABA/LAMA combination. However, some comparisons (stated below) should be interpreted with caution because of the relatively small number of trials for each subgrouping, heterogeneity in study design (i.e. length, inclusion and exclusion criteria), and the low number of events for all‐cause mortality and SAEs.
Structure of the narrative synthesis
In the following sections, we present a narrative summary of study results according to the prespecified outcomes. We present primary outcomes (all‐cause mortality, SAEs, AECOPD, respiratory HRQoL) followed by secondary outcomes (trough FEV1, peak FEV1, 6MWT, AEs). For each outcome, we describe the overall effect of the intervention irrespective of LABA/LAMA type or dose, followed by the effect of the intervention in subgroups according to LABA/LAMA type and dose.
Primary outcomes
All‐cause mortality
Eighteen studies (8752 participants) reported all‐cause mortality, although the number of reported deaths was low. There was no significant difference in the number of deaths reported in participants receiving a once‐daily LABA/LAMA fixed‐dose combination compared with those receiving placebo (OR 1.88, 95% CI 0.81 to 4.36; I2 = 0%; Analysis 1.1). The overall certainty of the evidence for this outcome was rated as low, having been downgraded once for indirectness (duration of studies varied widely from six weeks to 52 weeks) and once for imprecision (wide confidence intervals due to a low number of events).
The results were generally consistent (i.e. overlapping CIs) across subgroups for different LABA/LAMA combinations and doses, with ORs ranging from 1.88 with UMEC/VI 500/25 μg to 3.12 with UMEC/VI 62.5/25 μg (Figure 4); the only exception was the UMEC/VI 125/25 μg subgroup with two deaths reported in the placebo arm of one of four studies and no other deaths reported in the remaining three studies, resulting in an OR of 0.14 (95% CI 0.01 to 2.83).
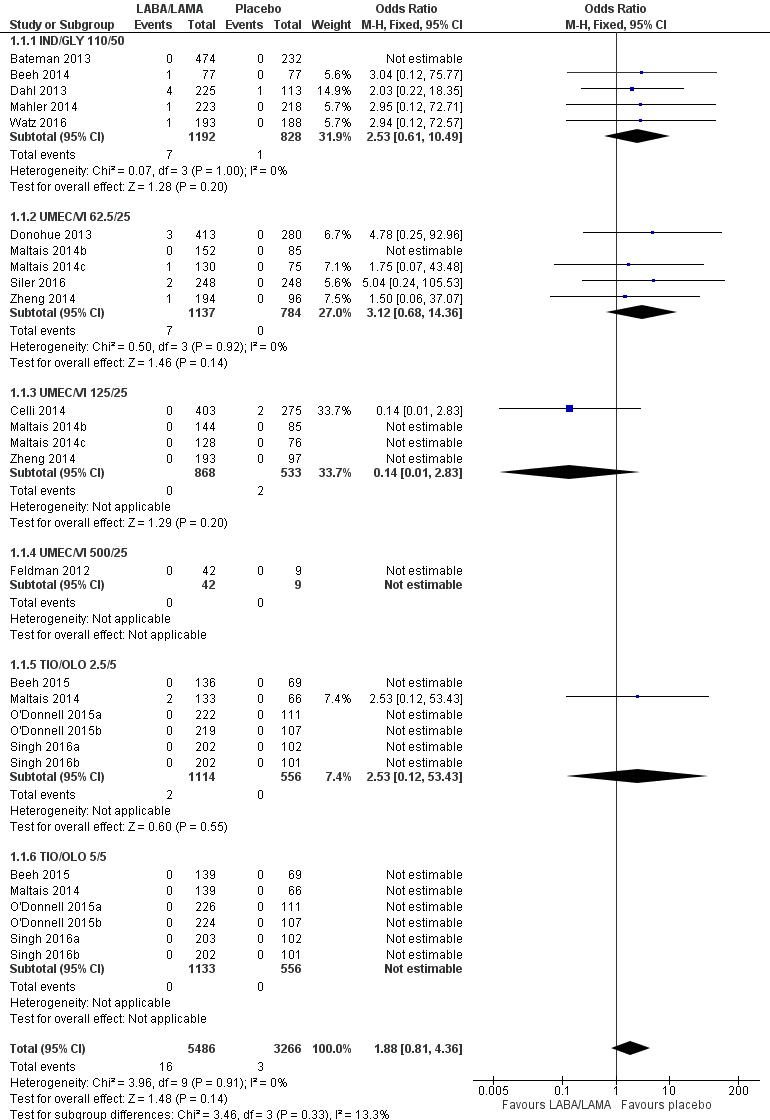
Forest plot of comparison: 1 LABA/LAMA versus placebo, outcome: 1.1 All‐cause mortality.
Serious adverse events
Twenty‐two studies (10,536 participants) reported the number of participants experiencing serious, but non‐fatal adverse events during the study period, for which there was no statistically significant difference (OR 1.06, 95% CI 0.88 to 1.28; I2 = 0%; Analysis 1.2). Compared with taking placebo, we estimated that taking once‐daily LABA/LAMA in a combined inhaler would result in three more people per 1000 experiencing a SAE, but the confidence intervals ranged from five fewer to nine more people per 1000. The overall certainty of the evidence for this outcome was rated as high.
The results were generally consistent across subgroups for different LABA/LAMA combinations and doses, with ORs ranging from 0.75 with UMEC/VI 125/25 μg to 1.29 with UMEC/VI 62.5/25 μg (Figure 5). The only exceptions were the ACM/FOR 200/6 μg and 200/12 μg subgroups, where the ORs were 0.51 (95% CI 0.02 to 12.96) and 0.51 (95% CI 0.02 to 13.07), respectively; however, these results should be interpreted cautiously as they were based on a small sample size from a single study, resulting in wide confidence intervals.
Forest plot of comparison: 1 LABA/LAMA versus placebo, outcome: 1.2 SAEs.
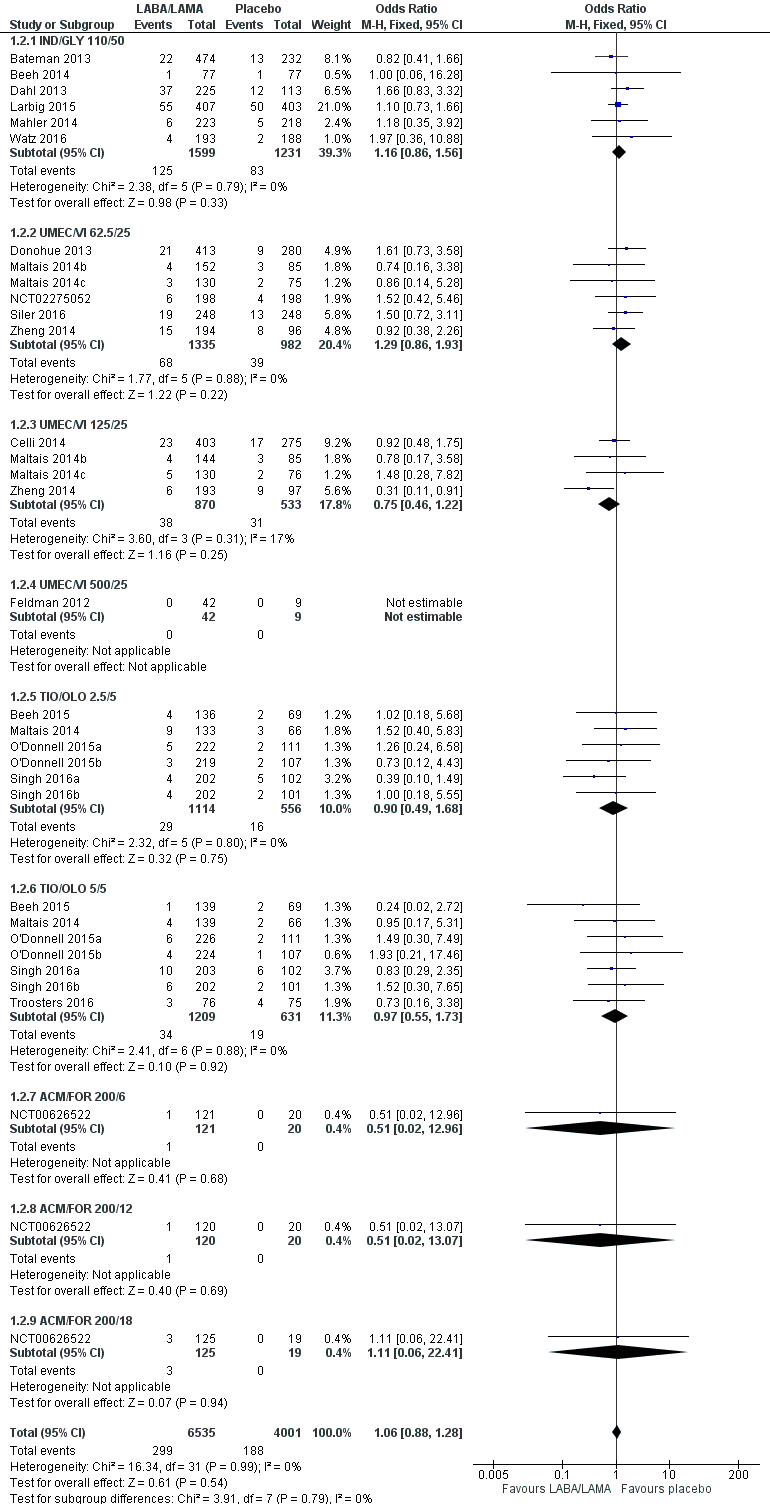
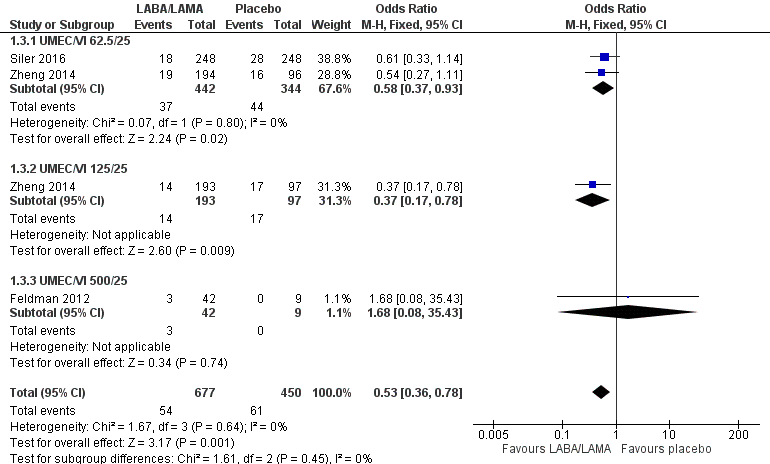
AECOPD
Three studies (1127 participants) reported the number of participants experiencing an AECOPD; all three studies examined UMEC/VI versus placebo. Significantly fewer people receiving once‐daily LABA/LAMA in a combined inhaler experienced an AECOPD compared with those receiving placebo (OR 0.53, 95% CI 0.36 to 0.78; I2 = 0%; Analysis 1.3; Figure 6). Compared with taking placebo, we estimated that taking once‐daily LABA/LAMA in a combined inhaler would result in 59 fewer people per 1000 experiencing an AECOPD, with the confidence intervals ranging from 27 to 83 fewer people per 1000. The overall certainty of the evidence for this outcome was rated as moderate, having been downgraded once for indirectness (all studies related to UMEC/VI). The results were consistent for two of three UMEC/VI doses examined, with ORs of 0.58 (95% CI 0.37 to 0.93) and 0.37 (0.17 to 0.78) for the 62.5/25 μg and 125/25 μg groups, respectively; the OR for the 500/25 μg dose was 1.68 (0.08 to 35.43) but was based on data from a small sample size (n = 51 participants).
Forest plot of comparison: 1 LABA/LAMA versus placebo, outcome: 1.3 AECOPD.
Two studies (1371 participants), reported the time to first AECOPD; both studies examined UMEC/VI 125/25 μg versus placebo. The mean time to first AECOPD was statistically significantly longer in people receiving once‐daily LABA/LAMA in a combined inhaler compared with those receiving placebo (Hazard Ratio 0.44, 95% CI 0.31 to 0.63; Analysis 1.4).
Health‐related quality of life
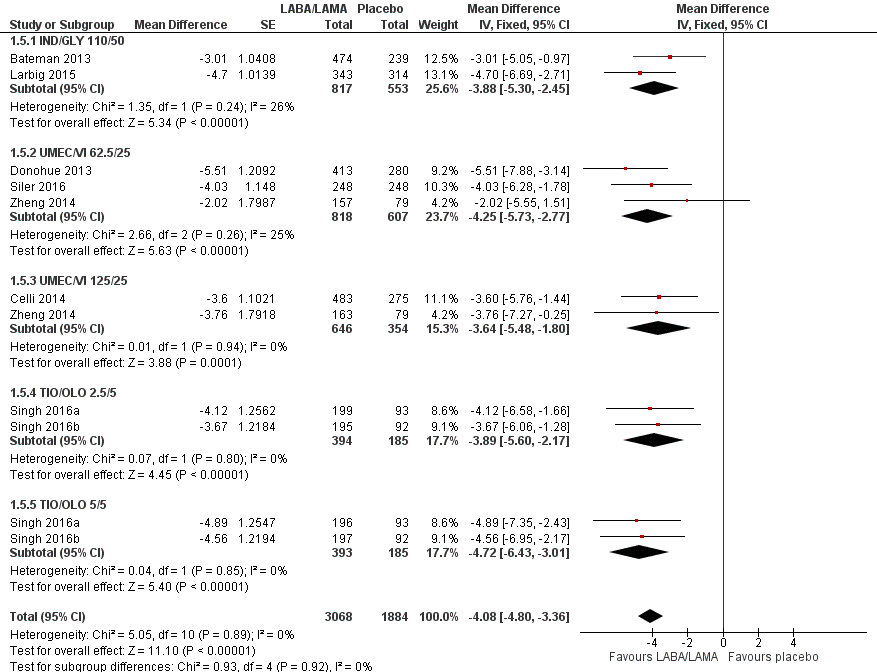
SGRQ
Eight studies (4952 participants) reported health‐related quality of life as assessed using the SGRQ, at the end of treatment. A decrease in SGRQ represents an improvement in quality of life and the MCID is considered to be a change of four units (SGRQ‐C Manual). At the end of treatment in participants receiving once‐daily LABA/LAMA in a combined inhaler, the mean improvement versus placebo in adjusted SGRQ score was ‐4.08 (95% CI ‐4.80 to ‐3.36; Analysis 1.5), which was statistically significant and clinically relevant, exceeding the MCID. The overall certainty of the evidence for this outcome was rated as high.
The results were generally consistent across subgroups for different LABA/LAMA combinations and doses, with mean differences versus placebo ranging from ‐3.64 with UMEC/VI 125/25 μg to ‐4.72 with TIO/OLO 5/5 μg (Figure 7). The mean difference in SGRQ score versus placebo was statistically significant for all LABA/LAMA combinations and doses for which data were available (IND/GLY 110/50 μg; UMEC/VI 125/25 μg; UMEC/VI 62.5/25 μg; TIO/OLO 2.5/5 μg; TIO/OLO 5/5 μg); however, the MCID (4.00) was only exceeded with UMEC/VI 62.5/25 μg, TIO/OLO 2.5 μg and TIO/OLO 5/5 μg.
Forest plot of comparison: 1 LABA/LAMA versus placebo, outcome: 1.5 Difference vs placebo in adjusted SGRQ score (HRQoL).
Seven studies (4258 participants) reported SGRQ responder status (i.e. the proportion of participants who achieved a ≥ 4 point improvement from baseline in SGRQ total score) at the end of treatment. Compared with placebo, a greater proportion of participants receiving once‐daily LABA/LAMA were responders (OR 1.75, 95% CI 1.54 to 1.99; I2 = 0%; Analysis 1.6) and this difference was statistically significant. Compared with taking placebo, we estimated that taking a once‐daily LABA/LAMA in a combined inhaler would result in 138 more people per 1000 achieving a clinically meaningful improvement in quality of life, with the confidence intervals ranging from 106 to 170 more people per 1000. This finding is in agreement with the mean improvement in SGRQ total score for LABA/LAMA versus placebo, as reported above. The results were generally consistent across subgroups for different LABA/LAMA combinations and doses, with ORs versus placebo ranging from 1.70 with UMEC/VI 62.52/5 μg to 2.35 with TIO/OLO 5/5 μg; the exception was IND/GLY 110/50 μg for which the OR (95% CI) versus placebo was 1.35 (0.98 to 1.86), thus narrowly missing out on statistical significance. We note that the latter result was based on a single study, for which data were presented as percentages and extrapolated to participant numbers; given uncertainty around the precise raw data, this finding should be interpreted cautiously.
Secondary outcomes
Trough FEV1
Adjusted difference versus placebo in trough FEV1 at end of treatment
Thirteen studies (6598 participants) reported adjusted trough FEV1 at the end of treatment (i.e. change from baseline in FEV1). In participants receiving once‐daily LABA/LAMA in a combined inhaler, the mean difference versus placebo in adjusted trough FEV1 was 0.20 L (95% CI 0.19 to 0.21; Analysis 1.7), which was statistically significant and clinically relevant, exceeding the MCID of 100 mL (Donohue 2005). The overall certainty of the evidence for this outcome was rated as moderate, having been downgraded once for inconsistency (significant heterogeneity, I2= 71%), noting that heterogeneity was due to a different magnitude of treatment effect in a single study (NCT00626522; see below).
The results were generally consistent (i.e. overlapping CIs) across subgroups for different LABA/LAMA combinations and doses, with mean differences versus placebo ranging from 0.18 L with UMEC/VI 62.5/25 μg to 0.25 L with IND/GLY 110/50 μg; the exception was the results for ACLID/FORM, which were based on a single study (NCT00626522); mean differences were 0.07, 0.12 and 0.07 L for the 200/6, 200/12 and 200/18 μg subgroups, respectively. The MCID (0.1 L) was exceeded with IND/GLY 110/50 μg, UMEC/VI 62.5/25 μg, UMEC/VI 125/25 μg, TIO/OLO 2.5 μg, and TIO/OLO 5/5 μg.
Unadjusted difference versus placebo in trough FEV1 at end of treatment
Five studies (2330 participants) reported trough FEV1 at the end of treatment (i.e. not adjusted for baseline values). In participants receiving once‐daily LABA/LAMA in a combined inhaler, the mean difference versus placebo in trough FEV1 was 0.18 L (95% CI 0.16 to 0.20; Analysis 1.8), which was statistically significant and clinically relevant, exceeding the MCID of 100 mL (Donohue 2005). The overall certainty of the evidence for this outcome was rated as high.
The results were consistent across subgroups for different LABA/LAMA combinations and doses, with mean differences versus placebo ranging from 0.16 L with TIO/OLO (2.5/5 and 5/5 μg doses) to 0.20 L with IND/GLY 110/50 μg. The MCID (0.1L) was exceeded with all LABA/LAMA combinations/doses for which data were available (IND/GLY 110/50 μg; TIO/OLO 2.5/5 μg; TIO/OLO 5/5 μg).
Pooled analyses for trough FEV1
When the adjusted and unadjusted data for trough FEV1 were pooled, there was no appreciable change in the overall mean difference (adjusted: MD 0.20 L, 95% CI 0.19 to 0.21; unadjusted: 0.18 L, 95% CI 0.16 to 0.20; pooled: MD 0.20 L, 95% CI 0.19 to 0.20 Analysis 1.9).
Adjusted peak FEV1
Seven studies (4188 participants) reported peak FEV1 at the end of treatment (i.e. peak FEV1 was explicitly specified, rather than 1‐hour FEV1, 2‐hour FEV1, etc). In participants receiving once‐daily LABA/LAMA in a combined inhaler, the mean difference versus placebo in peak FEV1 was 0.31 L (95% CI 0.29 to 0.32; Analysis 1.10), which was statistically significant. The overall certainty of the evidence for this outcome was rated as moderate, having been downgraded once for inconsistency (significant heterogeneity, I2= 68%).
The results were consistent across subgroups for different LABA/LAMA combinations and doses, with mean differences versus placebo ranging from 0.22 L with UMEC/VI 62.52/5 μg to 0.35 L with IND/GLY 110/50 μg.
6MWT
No studies reported data for this outcome.
Adverse events
Seventeen studies (8235 participants) reported the number of participants experiencing adverse events during the study period, for which there was no statistically significant difference (OR 0.95, 95% CI 0.86 to 1.04; I2 = 0%; Analysis 1.11). Compared with taking placebo, we estimated that taking once‐daily LABA/LAMA in a combined inhaler would result in 13 fewer people per 1000 experiencing a AE, with the confidence intervals ranging from 37 fewer to 10 more people per 1000. The overall certainty of the evidence for this outcome was rated as high.
The results were generally consistent across subgroups for different LABA/LAMA combinations and doses, with ORs ranging from 0.78 with TIO/OLO 5/5 μg to 1.08 with UMEC/VI 125/25 μg (Figure 5). The only exception was the UMEC/VI 500/25 μg subgroup (OR 2.84, 95% CI 0.32 to 25.36; participants = 51); however, these results should be interpreted cautiously as they were based on a small sample size from a single study, resulting in wide confidence intervals.
Subgroup analyses
Participants with ICS use during the trial versus participants without ICS use during the trial
All studies permitted the use of ICS during the trial, provided that participants had used ICS prior to the trial, and, in some cases, that the dose was stable prior to study initiation. Therefore, no subgroup analysis was performed.
Different LABA/LAMA combinations
The main analyses were split out by different LABA/LAMA combinations; please see the main results section above for a summary of different LABA/LAMA combinations.
Length of follow‐up (less than six months versus six months or longer)
Three studies had a duration of six months or longer (Bateman 2013; Dahl 2013; Larbig 2015) and all evaluated IND/GLY 110/50 versus placebo. This subanalysis was only relevant for three of the four primary outcomes as no studies evaluating IND/GLY contributed data to the meta‐analyses for AECOPD.
For all‐cause mortality, no significant difference between LABA/LAMA and placebo groups was identified, regardless of study duration (overall: < 6 months, OR 1.86, 95% CI 0.75 to 4.60 (25 studies); ≥ 6 months, OR 2.03, 95% CI 0.22 to 18.35 (2 studies); IND/GLY: < 6 months, OR 2.97, 95% CI 0.47 to 18.97 (3 studies); ≥ 6 months, OR 2.03, 95% CI 0.22 to 18.35 (2 studies)) (Analysis 2.1; Analysis 3.1).
For SAEs, there was no statistically significant difference in the number of participants experiencing serious, but non‐fatal, adverse events during the study period, regardless of study duration (overall: < 6 months, OR 1.02, 95% CI 0.80 to 1.29 (19 studies); ≥ 6 months, OR 1.14, 95% CI 0.83 to 1.56 (3 studies); IND/GLY: < 6 months, OR 1.35, 95% CI 0.54 to 3.40 (3 studies); ≥ 6 months, OR 1.14, 95% CI 0.83 to 1.56 (3 studies)) (Analysis 2.2; Analysis 3.2).
For HRQoL, a statistically significant and clinically relevant improvement (i.e. exceeding MCID) in SGRQ score was observed with LABA/LAMA compared with placebo based on studies with a duration of < 6 months (MD ‐4.15, 95% CI ‐4.99 to ‐3.32; 9 studies). Three studies with a duration of ≥ 6 months reported SGRQ score and all evaluated IND/GLY 110/50 μg. As in the primary analyses, a statistically significant improvement was observed but did not exceed the MCID (MD ‐3.88, 95% CI ‐5.30 to ‐2.45; 2 studies).
For each outcome (all‐cause mortality, SAEs, and HRQoL), given the overlapping confidence intervals for the < 6‐month versus ≥ 6‐month comparison, we concluded that study duration had no statistically significant effect on the results.
Baseline COPD severity
All of the included studies that contributed data to the quantitative analyses enrolled a majority (> 97%) of participants with GOLD Stage II/III COPD. Therefore, subanalyses based on baseline disease severity were not performed.
Sensitivity analyses
The following sensitivity analyses were performed for the primary outcomes.
Available case analysis versus true ITT analysis
All included studies claimed to analyse the ITT population or 'full analysis set'; however, in the majority of studies it was not possible to determine whether missing values were imputed. Therefore, this sensitivity analysis was not performed.
Fixed‐ versus random‐effect models
The results were consistent regardless of choice of analysis model (fixed‐ versus random‐effects model) (Table 2).
| Outcome | Fixed‐effect model | Random‐effects model |
| All‐cause mortality | OR 1.88, 95% CI 0.81 to 4.36 (P = 8752; S = 18) | OR 2.02, 95% CI 0.79 to 5.17 (P = 8752; S = 18) |
| SAEs | OR 1.06, 95% CI 0.88 to 1.28 (P = 10536; S = 22) | OR 1.05, 95% CI 0.87 to 1.27 (P = 10536; S = 22) |
| AECOPD | OR 0.53, 95% CI 0.36 to 0.78 (P = 1127; S = 3) | OR 0.52, 95% CI 0.35 to 0.78 (P = 1127; S = 3) |
| Adjusted SGRQ score (HRQoL) | MD ‐4.08, 95% CI ‐4.80 to ‐3.36 (P = 4952; S = 8) | MD ‐4.08, 95% CI ‐4.80 to ‐3.36 (P = 4952; S = 8) |
| Adjusted trough FEV1 at EOT | MD 0.19, 95% CI 0.20 to 0.21 (P = 6598; S = 13) | MD 0.20, 95% CI 0.18 to 0.21 (P = 6598; S = 13) |
| Adjusted peak FEV1 | MD 0.31, 95% CI 0.29 to 0.32 (P = 4188; S = 7) | MD 0.30, 95% CI 0.28 to 0.33 (P = 4188; S = 7) |
| AEs | OR 0.95, 95% CI 0.86 to 1.04 (P = 8235; S = 17) | OR 0.95, 95% CI 0.86 to 1.04 (P = 8235; S = 17) |
OR and MD are for LABA/LAMA relative to placebo. Note that studies and participants can be counted multiple times as analyses were split by dose groups (several dose groups were examined in a single trial).
CI: confidence interval; HRQoL: health‐related quality of life; OR: odds ratio; MD, mean difference; P: participants; S: studies; SGRQ: St George's Respiratory Questionnaire.
Risk of bias assessments
The results were consistent regardless of the inclusion of studies with a high risk of bias for one or more domains (i.e. any risk of bias versus low/unclear risk of bias) (Table 3).
| Outcome | Any risk of bias | Low/unclear risk of bias |
| All‐cause mortality | OR 1.88, 95% CI 0.81 to 4.36 (P = 8752; S = 18) | OR 1.65, 95% CI 0.60 to 4.50 (P = 7287; S = 13) |
| SAEs | OR 1.06, 95% CI 0.88 to 1.28 (P = 10536; S = 22) | OR 1.09, 95% CI 0.86 to 1.40 (P = 8448; S = 17) |
| AECOPD | OR 0.53, 95% CI 0.36 to 0.78 (P = 1127; S = 3) | NA |
| Adjusted SGRQ score (HRQoL) | MD ‐4.08, 95% CI ‐4.80 to ‐3.36 (P = 4952; S = 8) | MD ‐4.12, 95% CI ‐4.99 to ‐3.24 (P = 3321; S = 3) |
| Adjusted trough FEV1 at EOT | MD 0.20, 95% CI 0.19 to 0.21 (P = 6598; S = 13) | MD 0.20, 95% CI 0.19 to 0.22 (P = 4977; S = 13) |
| Adjusted peak FEV1 | MD 0.31, 95% CI 0.29 to 0.32 (P = 4188; S = 7) | MD 0.31, 95% CI 0.29 to 0.32 (P = 4188; S = 7) |
| AEs | OR 0.95, 95% CI 0.86 to 1.04 (P = 8235; S = 17) | OR 0.97, 95% CI 0.86 to 1.08 (P = 5579; S = 10) |
OR and MD are for LABA/LAMA relative to placebo. Note that studies and participants can be counted multiple times as analyses were split by dose groups (several dose groups were examined in a single trial).
CI: confidence interval; HRQoL: health‐related quality of life; OR: odds ratio; MD: mean difference; NA: not applicable (no studies reported this outcome); P: participants; S: studies; SGRQ: St George's Respiratory Questionnaire.
Discusión
Resumen de los resultados principales
Se incluyeron veintidós estudios (13 diseños de grupos paralelos y nueve diseños cruzados [cross‐over]), que asignaron al azar a un total de 8461 participantes. Todos los estudios eran ECA que comparaban ABAP/AMAP una vez al día a través del inhalador de combinación (n = 6252) con placebo (n = 3819). La mayoría de los participantes eran adultos con EPOC en estadio II/III de GOLD y entre un 28% a un 58% de los participantes estaban recibiendo CSI al inicio. La duración del tratamiento varió de tres a 52 semanas (media = 11 semanas; mediana = 12 semanas) y sólo tres estudios tuvieron una duración de seis meses o más. Todos los estudios se realizaron en centros múltiples y 19 de 22 estudios fueron internacionales. La mayoría de los estudios se diseñaron de forma adecuada y se consideraron en riesgo bajo de sesgo. En comparación con placebo, los ABAP/AMAP una vez al día en un inhalador combinado dieron lugar a una mejoría en la CdVRS (medida mediante el SGRQ) y la función pulmonar y una disminución en las EAEPOC. En general, la seguridad y la tolerabilidad de los ABAP/AMAP una vez al día parecieron equivalentes a las observadas en los participantes tratados con placebo y se observaron tasas similares de EA y EAG en cada grupo. No hubo diferencias significativas en la cantidad de muertes informadas en los participantes que recibieron una combinación de dosis fija de ABAP/AMAP una vez al día (uno por 1000) en comparación con los que recibieron placebo (2 por 1000); se evaluó la certeza de la evidencia como baja habiéndose disminuido debido a la imprecisión y la imposibilidad para su generalización. Por lo general los efectos del tratamiento fueron consistentes a través de diferentes combinaciones y dosis de ABAP/AMAP. Las mejorías en la CdVRS que excedieron estadística y significativamente la DMCI se lograron con UMEC/VI 62,5/25μg y TIO/OLO (2,5/5 y 5/5μg) pero no con IND/GLI 110/50μg o UMEC/VI 125/25 μg. Las mejorías en la función pulmonar (VEF1 mínimo y VEF1 máximo) que excedieron estadística y significativamente la DMCI se lograron con IND/GLI 110/50 μg, UMEC/VI (62,5/25 y 125/25 μg) y TIO/OLO (2,5/5 y 5/5 μg); estos resultados deben interpretarse con cautela debido a la incertidumbre en cuanto a la DMCI para el VEF1 (ver Tipos de medidas de resultado). Se observó una mejoría clínicamente significativa en el VEF1 máximo, pero no en el VEF1 mínimo, con ACLID/FORM, aunque la evidencia para esta combinación se basó sólo en un único estudio con un tamaño de la muestra relativamente pequeño. Se observó un reducción estadísticamente significativa tanto en el tiempo hasta la primera EAEPOC como en la tasa de EAEPOC con UMEC/VI; los datos para estos resultados de las EAEPOC no estuvieron disponibles para otras combinaciones.
Compleción y aplicabilidad general de las pruebas
Las demografías entre los 8641 participantes asignados al azar fueron representativas de los pacientes con EPOC (GOLD 2017). Por ejemplo, los participantes tenían una media de edad de alrededor de 60 a 65 años, con mayor frecuencia eran hombres y la mayoría actualmente fumaba o tenía antecedentes de consumo de tabaco. Los criterios de inclusión para 21 de 22 estudios incluidos especificaron el estadio II/III de GOLD, o criterios alineados con esta gravedad de la enfermedad; sólo uno de los estudios incluidos permitió la inclusión de individuos con EPOC moderada a grave. Por lo tanto, la evidencia sintetizada aquí no es aplicable a los individuos con EPOC leve a moderada. Todos los resultados predeterminados, excepto por la 6MWT, se informaron de manera adecuada a través de los 22 estudios, aunque el informe de la cantidad de participantes que experimentaron EAEPOC se basó en sólo tres estudios y el tiempo hasta la primera EAEPOC en sólo dos estudios; lo anterior se tuvo en cuenta al evaluar la solidez de la evidencia para estos resultados. Seis estudios evaluaron la combinación de una vez al día de IND/GLI (110/50μg), siete estudios evaluaron TIO/OLO (2,5/5 o 5/5 μg), ocho estudios evaluaron UMEC/VI (62,5/5 μg, 125/25 o 500/25μg) y un estudio evaluó ACD/FOR (200/6; 200/12 o 200/18 μg). El subagrupamiento de los estudios por combinación y dosis de ABAP/AMAP tuvo un efecto de reducción del tamaño de la muestra para cada comparación; en particular, sólo un estudio con una duración corta examinó la combinación de ACLID/FORM por lo cual existe menos certeza en cuanto a cómo los resultados generales se aplican a la combinación de ACLID/FORM. La media de la duración del estudio fue de 12 semanas; sólo tres estudios tuvieron una duración de seis meses o más y todos evaluaron ING/GLI 110/50 μg. En estos estudios con una duración de seis meses o más, los resultados de los metanálisis para la mortalidad por todas las causas, los EAG y la CdVRS fueron consistentes con los basados en los estudios con una duración de menos de seis meses.
Calidad de la evidencia
La certeza de la evidencia en general se consideró moderada o alta con la excepción de la mortalidad por todas las causas, que se consideró baja, habiéndola disminuido una vez debido a la imposibilidad para generalizar la evidencia y una vez por la imprecisión debido al número reducido de eventos. La certeza de la evidencia para los EAG, la CdVRS y los EA se consideró alta. La certeza de la evidencia para la función pulmonar (VEF1 mínimo y máximo) se consideró moderada habiéndose disminuido por la inconsistencia debido a la heterogeneidad significativa. La certeza de la evidencia para las EAEPOC se consideró moderada habiéndose disminuido una vez por la imposibilidad para generalizar la evidencia debido a que la evidencia se relacionó sólo al UMEC/VI. No fue posible descartar la posibilidad de sesgo de publicación para este resultado aunque no fue posible demostrar de una manera concluyente que existió sesgo de publicación, debido al número reducido de estudios que informaron dicho resultado (es decir la validez de un gráfico en embudo [funnel plot] es limitada cuando se basa en menos de diez estudios). Además, no se observó un informe selectivo para este resultado en los estudios de otras combinaciones de ABAP/AMAP sobre la base de la comparación de los informes primarios con entradas en el registro del ensayo.
El riesgo de sesgo en los estudios incluidos en general se consideró bajo o estuvo poco claro debido a la ausencia de información necesaria proporcionada en los informes del estudio. A través de 198 evaluaciones (22 estudios, nueve dominios cada uno), más de tres cuartos se consideraron en riesgo bajo de sesgo y sólo siete se consideraron en riesgo alto de sesgo. El riesgo de sesgo se consideró poco claro en las 37 evaluaciones restantes. Cuatro estudios se consideraron en alto riesgo para ‘otros’ sesgos, en tres casos, debido a la mayor gravedad de la enfermedad en el grupo de ABAP/AMAP en comparación con el grupo de placebo; este problema tendería a sesgar los resultados a favor del placebo, lo cual da lugar a una subestimación potencial del efecto del tratamiento. Sin embargo, los resultados fueron consistentes a la extracción de los estudios con cualquier dominio considerado en alto riesgo de sesgo y no se realizó ninguna disminución de la solidez de la evidencia (según GRADE) sobre la base del riesgo de sesgo.
Sesgos potenciales en el proceso de revisión
La revisión se realizó de acuerdo a los estándares establecidos por MECIR (MECIR 2018) y en conformidad con el protocolo publicado. En particular, dos autores, de forma independiente, seleccionaron los resultados de la búsqueda, determinaron los estudios para la inclusión, evaluaron el riesgo de sesgo, extrajeron los datos relevantes y realizaron la evaluación GRADE (es decir todos los pasos que involucran decisiones subjetivas). Hubo varias desviaciones menores del protocolo (ver Diferencias entre el protocolo y la revisión). Es improbable que se omitiera algún estudio relevante, debido a que un especialista en información experto realizó las principales búsquedas electrónicas. Además, las búsquedas principales fueron complementadas por búsquedas manuales en las listas de referencias de los estudios y las revisiones asociadas. Finalmente, esta revisión se ha sometido a una evaluación editorial y por pares y por lo tanto considera las opiniones de expertos externos independientes. En resumen, la revisión se realizó de una manera que debe asegurar que las conclusiones representen de forma justa y exacta los resultados sintetizados durante el proceso de revisión.
Acuerdos y desacuerdos con otros estudios o revisiones
La mayoría de las revisiones sistemáticas relevantes compararon la CDF de ABAP/AMAP con sus mono‐componentes (Calzetta 2016; Calzetta 2017). Sin embargo, los resultados son consistentes con los de un metanálisis de redes reciente de los ABAP/AMAP versus sus mono‐componentes y placebo (Oba 2016). Por ejemplo, las combinaciones de ABAP/AMAP demostraron una mejoría media en el VEF1 mínimo sobre el placebo de 0,21 (IC del 95%: 0,19; 0,23), 0,20 L (IC del 95%: 0,17 a 0,23) y 0,24 L (IC del 95%: 0,14 a 0,35) a los tres, seis y 12 meses, respectivamente, lo cual concuerda con el 0,20 L informado aquí. También se observaron mejorías clínicamente significativas en la CdVRS con ABAP/AMAP sobre el placebo, con un cambio medio desde el inicio en la puntuación del SGRQ de ‐4,6 (‐5,9; ‐3,3) tres meses más tarde y ‐4,1 (‐5,9; ‐2,3) a los seis meses, lo cual concuerda con la mejoría de 4,08 puntos informada aquí. Además y de acuerdo con los resultados, no se observó ninguna diferencia significativa en la mortalidad o los EAG totales entre los ABAP/AMAP y el placebo (Oba 2016).

Study flow diagram.

Risk of bias summary: review authors' judgements about each risk of bias item for each included study.

Risk of bias graph: review authors' judgements about each risk of bias item presented as percentages across all included studies.

Forest plot of comparison: 1 LABA/LAMA versus placebo, outcome: 1.1 All‐cause mortality.

Forest plot of comparison: 1 LABA/LAMA versus placebo, outcome: 1.2 SAEs.

Forest plot of comparison: 1 LABA/LAMA versus placebo, outcome: 1.3 AECOPD.

Forest plot of comparison: 1 LABA/LAMA versus placebo, outcome: 1.5 Difference vs placebo in adjusted SGRQ score (HRQoL).

Comparison 1 LABA/LAMA versus placebo, Outcome 1 All‐cause mortality.

Comparison 1 LABA/LAMA versus placebo, Outcome 2 SAEs.

Comparison 1 LABA/LAMA versus placebo, Outcome 3 AECOPD.

Comparison 1 LABA/LAMA versus placebo, Outcome 4 Time to first AECOPD.

Comparison 1 LABA/LAMA versus placebo, Outcome 5 Difference vs placebo in adjusted SGRQ score (HRQoL).
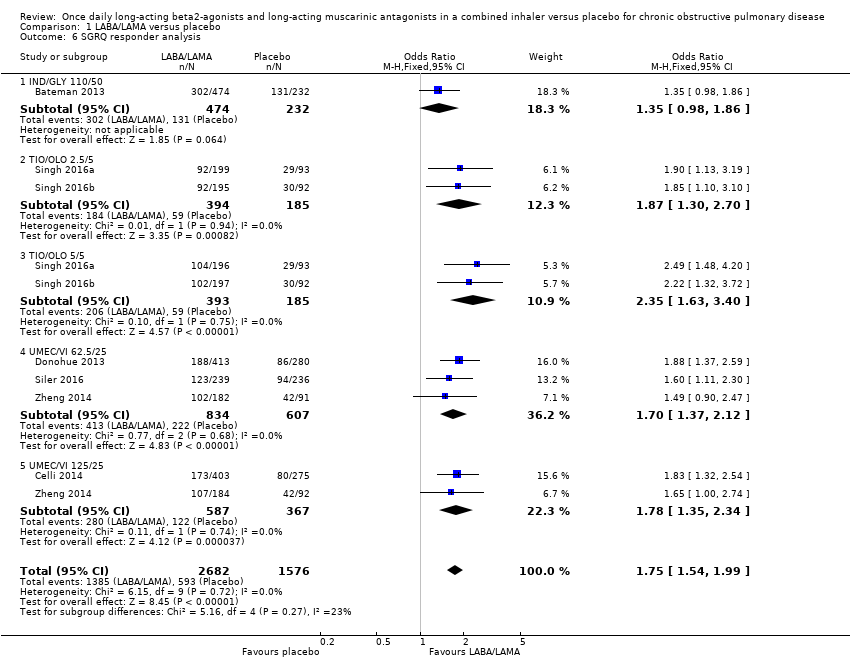
Comparison 1 LABA/LAMA versus placebo, Outcome 6 SGRQ responder analysis.

Comparison 1 LABA/LAMA versus placebo, Outcome 7 Difference vs placebo in adjusted trough FEV1 at EOT.

Comparison 1 LABA/LAMA versus placebo, Outcome 8 Difference vs placebo in trough FEV1 at EOT.

Comparison 1 LABA/LAMA versus placebo, Outcome 9 Difference vs placebo in trough FEV1 ‐ pooled adjusted and EOT analyses.

Comparison 1 LABA/LAMA versus placebo, Outcome 10 Difference vs placebo in adjusted peak FEV1.

Comparison 1 LABA/LAMA versus placebo, Outcome 11 AEs.

Comparison 2 LABA/LAMA versus placebo < 6 months, Outcome 1 All‐cause mortality.

Comparison 2 LABA/LAMA versus placebo < 6 months, Outcome 2 SAEs.

Comparison 2 LABA/LAMA versus placebo < 6 months, Outcome 3 AECOPD.

Comparison 2 LABA/LAMA versus placebo < 6 months, Outcome 4 Time to first AECOPD.

Comparison 2 LABA/LAMA versus placebo < 6 months, Outcome 5 Difference vs placebo in adjusted SGRQ score (HRQoL).

Comparison 2 LABA/LAMA versus placebo < 6 months, Outcome 6 SGRQ responder analysis.

Comparison 3 LABA/LAMA versus placebo ≥ 6 months, Outcome 1 All‐cause mortality.

Comparison 3 LABA/LAMA versus placebo ≥ 6 months, Outcome 2 SAEs.

Comparison 3 LABA/LAMA versus placebo ≥ 6 months, Outcome 3 Difference vs placebo in adjusted SGRQ score (HRQoL).

Comparison 3 LABA/LAMA versus placebo ≥ 6 months, Outcome 4 SGRQ responder analysis.
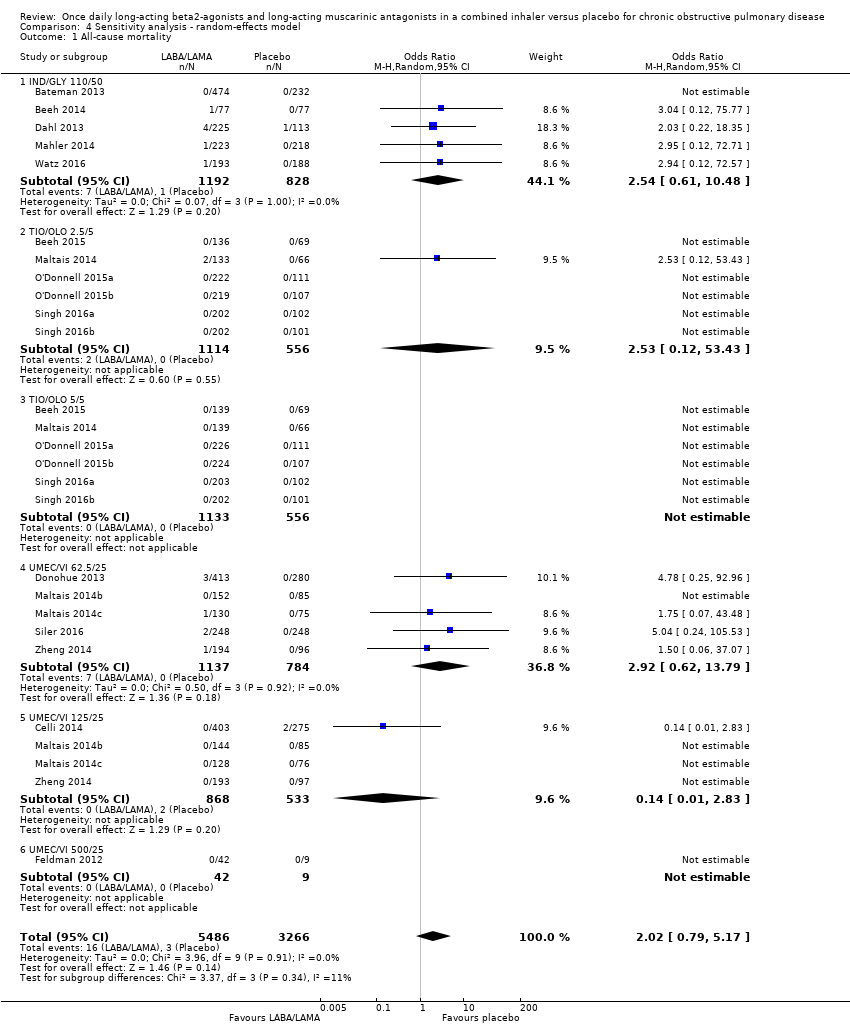
Comparison 4 Sensitivity analysis ‐ random‐effects model, Outcome 1 All‐cause mortality.

Comparison 4 Sensitivity analysis ‐ random‐effects model, Outcome 2 SAEs.

Comparison 4 Sensitivity analysis ‐ random‐effects model, Outcome 3 AECOPD.

Comparison 4 Sensitivity analysis ‐ random‐effects model, Outcome 4 Time to first AECOPD.

Comparison 4 Sensitivity analysis ‐ random‐effects model, Outcome 5 Difference vs placebo in adjusted SGRQ score (HRQoL).

Comparison 4 Sensitivity analysis ‐ random‐effects model, Outcome 6 SGRQ responder analysis.

Comparison 4 Sensitivity analysis ‐ random‐effects model, Outcome 7 Difference vs placebo in adjusted trough FEV1 at EOT.

Comparison 4 Sensitivity analysis ‐ random‐effects model, Outcome 8 Difference vs placebo in trough FEV1 at EOT.

Comparison 4 Sensitivity analysis ‐ random‐effects model, Outcome 9 Difference vs placebo in adjusted peak FEV1.

Comparison 4 Sensitivity analysis ‐ random‐effects model, Outcome 10 AEs.

Comparison 4 Sensitivity analysis ‐ random‐effects model, Outcome 11 Difference vs placebo in trough FEV1 ‐ pooled adjusted and EOT analyses.

Comparison 5 Sensitivity analysis ‐ RoB, Outcome 1 All‐cause mortality.

Comparison 5 Sensitivity analysis ‐ RoB, Outcome 2 SAEs.

Comparison 5 Sensitivity analysis ‐ RoB, Outcome 3 Time to first AECOPD.
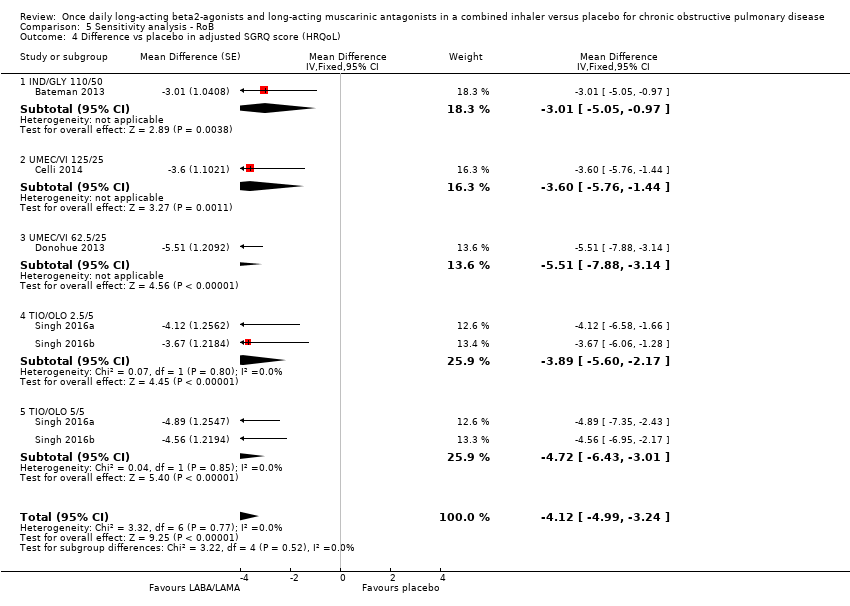
Comparison 5 Sensitivity analysis ‐ RoB, Outcome 4 Difference vs placebo in adjusted SGRQ score (HRQoL).

Comparison 5 Sensitivity analysis ‐ RoB, Outcome 5 SGRQ responder analysis.

Comparison 5 Sensitivity analysis ‐ RoB, Outcome 6 Difference vs placebo in adjusted trough FEV1 at EOT.

Comparison 5 Sensitivity analysis ‐ RoB, Outcome 7 Difference vs placebo in trough FEV1 at EOT.

Comparison 5 Sensitivity analysis ‐ RoB, Outcome 8 Difference vs placebo in adjusted peak FEV1.

Comparison 5 Sensitivity analysis ‐ RoB, Outcome 9 AEs.

Comparison 5 Sensitivity analysis ‐ RoB, Outcome 10 Difference vs placebo in trough FEV1 ‐ pooled adjusted and EOT analyses.
| Once daily LABA/LAMA in a combined inhaler compared with placebo in adults with COPD | ||||||
| Patient or population: Adults with COPD | ||||||
| Outcomes | Anticipated absolute effects* (95% CI) | Relative effect | № of participants | Certainty of the evidence | Comments | |
| Risk with placebo | Risk with once daily LABA/LAMA in a combined inhaler | |||||
| All‐cause mortality | 1 per 1,000 | 2 per 1,000 | OR 1.88 | 8752 | ⊕⊕⊝⊝ | |
| Serious adverse events (3‐week to 1‐year follow‐up) | 47 per 1,000 | 50 per 1,000 | OR 1.06 | 10536 | ⊕⊕⊕⊕ | |
| Acute exacerbations of COPD (4‐week to 24‐week follow‐up) | 136 per 1,000 | 77 per 1,000 | OR 0.53 | 1127 | ⊕⊕⊕⊝ | Data limited to UMEC/VI versus placebo comparison |
| Difference vs placebo in adjusted SGRQ score (HRQoL) Scale 0‐100, lower on the scale is better. (12‐week to 1‐year follow‐up) | Mean change from baseline in SGRQ score with placebo ranged from 6.39 lower to 0.12 higher | MD 4.08 points lower | ‐ | 4952 | ⊕⊕⊕⊕ | MD exceeded MCID (4 points). |
| Difference vs placebo in adjusted trough FEV1 at EOT (3‐week to 1‐year follow‐up) | Mean change from baseline in trough FEV1 with placebo ranged from 0.08 L lower to 0.01 L higher | MD 0.20 L higher | ‐ | 6598 | ⊕⊕⊕⊝ | MD exceeded MCID. |
| Difference vs placebo in adjusted peak FEV1 (3‐week to 6‐month follow‐up) | Mean change from baseline in peak FEV1 with placebo ranged from 0.04 to 0.1 L higher | MD 0.31 L higher | ‐ | 4188 | ⊕⊕⊕⊝ | |
| Adverse events (3‐week to 1‐year follow‐up) | 448 per 1,000 | 435 per 1,000 | OR 0.95 | 8235 | ⊕⊕⊕⊕ | |
| *The risk in the intervention group (and its 95% confidence interval) is based on the assumed risk in the comparison group and the relative effect of the intervention (and its 95% CI). | ||||||
| GRADE Working Group grades of evidence | ||||||
| 1 Downgraded once for indirectness; duration of treatment varied widely: maximum duration 52 weeks, n = 3 studies duration < 6 weeks. 2 Downgraded once for imprecision; wide 95% confidence intervals due to low number of events – confidence intervals encompassed no effect, benefit, and risk. 3 Downgraded once for indirectness as all studies examined UMEC/VI. 4 Downgraded once for inconsistency; significant heterogeneity (overall I2 ≥ 68%), noting that effect sizes were similar between studies with the exception of ACLID/FORM. | ||||||
| Study | RCT Design | N rand. | Country/region | Interventiona (dose in μg) | Participant baseline characteristics | ||||
| Age, yearsb | Male (%)b | % pred. FEV1c | Smoking status | ICS use (%)b,d | |||||
| Parallel | 709 | Worldwide | IND/GLY 110/50 | 64.0‐64.4 | 73‐76 | 55 | 40.1‐40.5 | 56.5‐57.8 | |
| Cross‐over | 85 | NS | IND/GLY 110/50 | 62.1 | 63 | 47 | 45 | 31 | |
| Cross‐over | 219 | Europe, N. America | TIO/OLO 2.5/5; 5/5 | 61.1 | 59 | 54 | 62.6 | 41.1 | |
| Parallel | 678 | NS | UMEC/VI 125/25 | 62.2‐63.4 | 64‐66 | 48 | 50‐52 | 44‐50 | |
| Parallel | 339 | Europe, Canada, Asia and South Africa | IND/GLY 110/50 | 62.5‐62.9 | 76‐77 | 57.5 | 45.1‐45.3 | 38.9‐45.8 | |
| Parallel | 693 | Worldwide | UMEC/VI 62.5/25 | 62.2‐63.1 | 70‐74 | 47.5 | 49‐54 | 49‐51 | |
| Parallel | 51 | USA | UMEC/VI 500/25 | 58.7‐59.2 | 57‐78 | 50 | 57‐78 | NR | |
| Parallel | 811 | Worldwide | IND/GLY 110/50 | 64.6‐64.9 | 71‐77 | NR | NR | NR | |
| Cross‐over | 247 | Europe, N. America | IND/GLY 110/50 | 62.8 | 70 | 56 | 45.5 | 54.9 | |
| Parallel | 404 | Europe, N. America, S. America | TIO/OLO 2.5/5; 5/5 | 60.8‐63.1 | 65‐68 | 59 | NR | NR | |
| Cross‐over | 349 | Europe, N. America, S. Africa | UMEC/VI 62.5/25; 125/25 | 61.6 | 56 | 51 | 63.2 | 28.2 | |
| Cross‐over | 308 | Europe, N. America, Russia | UMEC/VI 62.5/25; 125/25 | 62.6 | 55 | 51 | 60.6 | 39.4 | |
| Parallel | 425 | Europe, Australia, Russia | ACD/FOR 200/6; 200/12; 200/18 | 60.7‐63.9 | 75‐82 | NR | NR | NR | |
| Cross‐over | 99 | USA | UMEC/VI 62.5/25 | 60.7 | 53 | NR | NR | NR | |
| Cross‐over | 586 | N. America, S. America, Oceania, Europe | TIO/OLO 2.5/5; 5/5 | 61.7 | 71 | 58 | 39.1 | NR | |
| Cross‐over | N, America, S. America, Russia, Europe | TIO/OLO 2.5/5; 5/5 | 61.7 | 71 | 58 | 39.1 | NR | ||
| Parallel | 498 | Europe, USA, Russia | UMEC/VI 62.5/25 | 62.6‐64.1 | 58‐60 | 47.5 | 52‐55 | 45‐50 | |
| Parallel | 608 | Europe, N. America, S. Africa | TIO/OLO 2.5/5; 5/5 | 64.7‐65.1 | 56‐62 | 55.5 | 43.1‐54.7 | 34.8‐41.9 | |
| Parallel | 606 | Europe N. America, S. Africa, Oceania | TIO/OLO 2.5/5; 5/5 | 64.0‐65.2 | 58‐66 | 54.5 | 44.6‐47.0 | 35.1‐41.1 | |
| Parallel | 152 | Europe, Canada, Oceania | TIO/OLO 5/5 | 64.4‐65.0 | 63‐69 | NR | NR | NR | |
| Cross‐over | 194 | Germany | IND/GLY 110/50 | 62.8 | 66 | 62 | 56.7 | NR | |
| Parallel | 580 | China, South‐east Asia | UMEC/VI 62.5/25; 125/5 | 63.7‐64.3 | 92‐94 | NR | 25‐34 | 51‐54 | |
| aPlacebo was the comparator in all studies. Abbreviations: ACD: aclidinium; FOR: formoterol; GLY: glycopyrronium; IND: indacaterol; NR: not reported; OLO: olodaterol; rand: randomised; RCT: randomised controlled trial; TIO: tiotropium; UMEC: umeclidinium; VI: vilanterol. | |||||||||
| Outcome | Fixed‐effect model | Random‐effects model |
| All‐cause mortality | OR 1.88, 95% CI 0.81 to 4.36 (P = 8752; S = 18) | OR 2.02, 95% CI 0.79 to 5.17 (P = 8752; S = 18) |
| SAEs | OR 1.06, 95% CI 0.88 to 1.28 (P = 10536; S = 22) | OR 1.05, 95% CI 0.87 to 1.27 (P = 10536; S = 22) |
| AECOPD | OR 0.53, 95% CI 0.36 to 0.78 (P = 1127; S = 3) | OR 0.52, 95% CI 0.35 to 0.78 (P = 1127; S = 3) |
| Adjusted SGRQ score (HRQoL) | MD ‐4.08, 95% CI ‐4.80 to ‐3.36 (P = 4952; S = 8) | MD ‐4.08, 95% CI ‐4.80 to ‐3.36 (P = 4952; S = 8) |
| Adjusted trough FEV1 at EOT | MD 0.19, 95% CI 0.20 to 0.21 (P = 6598; S = 13) | MD 0.20, 95% CI 0.18 to 0.21 (P = 6598; S = 13) |
| Adjusted peak FEV1 | MD 0.31, 95% CI 0.29 to 0.32 (P = 4188; S = 7) | MD 0.30, 95% CI 0.28 to 0.33 (P = 4188; S = 7) |
| AEs | OR 0.95, 95% CI 0.86 to 1.04 (P = 8235; S = 17) | OR 0.95, 95% CI 0.86 to 1.04 (P = 8235; S = 17) |
| OR and MD are for LABA/LAMA relative to placebo. Note that studies and participants can be counted multiple times as analyses were split by dose groups (several dose groups were examined in a single trial). CI: confidence interval; HRQoL: health‐related quality of life; OR: odds ratio; MD, mean difference; P: participants; S: studies; SGRQ: St George's Respiratory Questionnaire. | ||
| Outcome | Any risk of bias | Low/unclear risk of bias |
| All‐cause mortality | OR 1.88, 95% CI 0.81 to 4.36 (P = 8752; S = 18) | OR 1.65, 95% CI 0.60 to 4.50 (P = 7287; S = 13) |
| SAEs | OR 1.06, 95% CI 0.88 to 1.28 (P = 10536; S = 22) | OR 1.09, 95% CI 0.86 to 1.40 (P = 8448; S = 17) |
| AECOPD | OR 0.53, 95% CI 0.36 to 0.78 (P = 1127; S = 3) | NA |
| Adjusted SGRQ score (HRQoL) | MD ‐4.08, 95% CI ‐4.80 to ‐3.36 (P = 4952; S = 8) | MD ‐4.12, 95% CI ‐4.99 to ‐3.24 (P = 3321; S = 3) |
| Adjusted trough FEV1 at EOT | MD 0.20, 95% CI 0.19 to 0.21 (P = 6598; S = 13) | MD 0.20, 95% CI 0.19 to 0.22 (P = 4977; S = 13) |
| Adjusted peak FEV1 | MD 0.31, 95% CI 0.29 to 0.32 (P = 4188; S = 7) | MD 0.31, 95% CI 0.29 to 0.32 (P = 4188; S = 7) |
| AEs | OR 0.95, 95% CI 0.86 to 1.04 (P = 8235; S = 17) | OR 0.97, 95% CI 0.86 to 1.08 (P = 5579; S = 10) |
| OR and MD are for LABA/LAMA relative to placebo. Note that studies and participants can be counted multiple times as analyses were split by dose groups (several dose groups were examined in a single trial). CI: confidence interval; HRQoL: health‐related quality of life; OR: odds ratio; MD: mean difference; NA: not applicable (no studies reported this outcome); P: participants; S: studies; SGRQ: St George's Respiratory Questionnaire. | ||
| Outcome or subgroup title | No. of studies | No. of participants | Statistical method | Effect size |
| 1 All‐cause mortality Show forest plot | 18 | 8752 | Odds Ratio (M‐H, Fixed, 95% CI) | 1.88 [0.81, 4.36] |
| 1.1 IND/GLY 110/50 | 5 | 2020 | Odds Ratio (M‐H, Fixed, 95% CI) | 2.53 [0.61, 10.49] |
| 1.2 UMEC/VI 62.5/25 | 5 | 1921 | Odds Ratio (M‐H, Fixed, 95% CI) | 3.12 [0.68, 14.36] |
| 1.3 UMEC/VI 125/25 | 4 | 1401 | Odds Ratio (M‐H, Fixed, 95% CI) | 0.14 [0.01, 2.83] |
| 1.4 UMEC/VI 500/25 | 1 | 51 | Odds Ratio (M‐H, Fixed, 95% CI) | 0.0 [0.0, 0.0] |
| 1.5 TIO/OLO 2.5/5 | 6 | 1670 | Odds Ratio (M‐H, Fixed, 95% CI) | 2.53 [0.12, 53.43] |
| 1.6 TIO/OLO 5/5 | 6 | 1689 | Odds Ratio (M‐H, Fixed, 95% CI) | 0.0 [0.0, 0.0] |
| 2 SAEs Show forest plot | 22 | 10536 | Odds Ratio (M‐H, Fixed, 95% CI) | 1.06 [0.88, 1.28] |
| 2.1 IND/GLY 110/50 | 6 | 2830 | Odds Ratio (M‐H, Fixed, 95% CI) | 1.16 [0.86, 1.56] |
| 2.2 UMEC/VI 62.5/25 | 6 | 2317 | Odds Ratio (M‐H, Fixed, 95% CI) | 1.29 [0.86, 1.93] |
| 2.3 UMEC/VI 125/25 | 4 | 1403 | Odds Ratio (M‐H, Fixed, 95% CI) | 0.75 [0.46, 1.22] |
| 2.4 UMEC/VI 500/25 | 1 | 51 | Odds Ratio (M‐H, Fixed, 95% CI) | 0.0 [0.0, 0.0] |
| 2.5 TIO/OLO 2.5/5 | 6 | 1670 | Odds Ratio (M‐H, Fixed, 95% CI) | 0.90 [0.49, 1.68] |
| 2.6 TIO/OLO 5/5 | 7 | 1840 | Odds Ratio (M‐H, Fixed, 95% CI) | 0.97 [0.55, 1.73] |
| 2.7 ACM/FOR 200/6 | 1 | 141 | Odds Ratio (M‐H, Fixed, 95% CI) | 0.51 [0.02, 12.96] |
| 2.8 ACM/FOR 200/12 | 1 | 140 | Odds Ratio (M‐H, Fixed, 95% CI) | 0.51 [0.02, 13.07] |
| 2.9 ACM/FOR 200/18 | 1 | 144 | Odds Ratio (M‐H, Fixed, 95% CI) | 1.11 [0.06, 22.41] |
| 3 AECOPD Show forest plot | 3 | 1127 | Odds Ratio (M‐H, Fixed, 95% CI) | 0.53 [0.36, 0.78] |
| 3.1 UMEC/VI 62.5/25 | 2 | 786 | Odds Ratio (M‐H, Fixed, 95% CI) | 0.58 [0.37, 0.93] |
| 3.2 UMEC/VI 125/25 | 1 | 290 | Odds Ratio (M‐H, Fixed, 95% CI) | 0.37 [0.17, 0.78] |
| 3.3 UMEC/VI 500/25 | 1 | 51 | Odds Ratio (M‐H, Fixed, 95% CI) | 1.68 [0.08, 35.43] |
| 4 Time to first AECOPD Show forest plot | 2 | 1371 | Hazard Ratio (Fixed, 95% CI) | 0.44 [0.31, 0.63] |
| 4.1 UMEC/VI 125/25 | 2 | 1371 | Hazard Ratio (Fixed, 95% CI) | 0.44 [0.31, 0.63] |
| 5 Difference vs placebo in adjusted SGRQ score (HRQoL) Show forest plot | 8 | 4952 | Mean Difference (Fixed, 95% CI) | ‐4.08 [‐4.80, ‐3.36] |
| 5.1 IND/GLY 110/50 | 2 | 1370 | Mean Difference (Fixed, 95% CI) | ‐3.88 [‐5.30, ‐2.45] |
| 5.2 UMEC/VI 62.5/25 | 3 | 1425 | Mean Difference (Fixed, 95% CI) | ‐4.25 [‐5.73, ‐2.77] |
| 5.3 UMEC/VI 125/25 | 2 | 1000 | Mean Difference (Fixed, 95% CI) | ‐3.64 [‐5.48, ‐1.80] |
| 5.4 TIO/OLO 2.5/5 | 2 | 579 | Mean Difference (Fixed, 95% CI) | ‐3.89 [‐5.60, ‐2.17] |
| 5.5 TIO/OLO 5/5 | 2 | 578 | Mean Difference (Fixed, 95% CI) | ‐4.72 [‐6.43, ‐3.01] |
| 6 SGRQ responder analysis Show forest plot | 7 | 4258 | Odds Ratio (M‐H, Fixed, 95% CI) | 1.75 [1.54, 1.99] |
| 6.1 IND/GLY 110/50 | 1 | 706 | Odds Ratio (M‐H, Fixed, 95% CI) | 1.35 [0.98, 1.86] |
| 6.2 TIO/OLO 2.5/5 | 2 | 579 | Odds Ratio (M‐H, Fixed, 95% CI) | 1.87 [1.30, 2.70] |
| 6.3 TIO/OLO 5/5 | 2 | 578 | Odds Ratio (M‐H, Fixed, 95% CI) | 2.35 [1.63, 3.40] |
| 6.4 UMEC/VI 62.5/25 | 3 | 1441 | Odds Ratio (M‐H, Fixed, 95% CI) | 1.70 [1.37, 2.12] |
| 6.5 UMEC/VI 125/25 | 2 | 954 | Odds Ratio (M‐H, Fixed, 95% CI) | 1.78 [1.35, 2.34] |
| 7 Difference vs placebo in adjusted trough FEV1 at EOT Show forest plot | 13 | 6598 | Mean Difference (Fixed, 95% CI) | 0.20 [0.19, 0.21] |
| 7.1 IND/GLY 110/50 | 2 | 1018 | Mean Difference (Fixed, 95% CI) | 0.25 [0.22, 0.28] |
| 7.2 UMEC/VI 62.5/25 | 6 | 2158 | Mean Difference (Fixed, 95% CI) | 0.18 [0.17, 0.20] |
| 7.3 UMEC/VI 125/25 | 4 | 1304 | Mean Difference (Fixed, 95% CI) | 0.22 [0.20, 0.25] |
| 7.4 TIO/OLO 2.5/5 | 3 | 845 | Mean Difference (Fixed, 95% CI) | 0.18 [0.15, 0.20] |
| 7.5 TIO/OLO 5/5 | 3 | 859 | Mean Difference (Fixed, 95% CI) | 0.21 [0.18, 0.23] |
| 7.6 ACLID/FORM 200/6 | 1 | 137 | Mean Difference (Fixed, 95% CI) | 0.07 [‐0.04, 0.18] |
| 7.7 ACLID/FORM 200/12 | 1 | 137 | Mean Difference (Fixed, 95% CI) | 0.12 [0.01, 0.22] |
| 7.8 ACLID/FORM 200/18 | 1 | 140 | Mean Difference (Fixed, 95% CI) | 0.08 [‐0.04, 0.19] |
| 8 Difference vs placebo in trough FEV1 at EOT Show forest plot | 5 | 2330 | Mean Difference (Fixed, 95% CI) | 0.18 [0.16, 0.20] |
| 8.1 IND/GLY 110/50 | 3 | 1139 | Mean Difference (Fixed, 95% CI) | 0.20 [0.17, 0.22] |
| 8.2 TIO/OLO 2.5/5 | 2 | 596 | Mean Difference (Fixed, 95% CI) | 0.16 [0.13, 0.19] |
| 8.3 TIO/OLO 5/5 | 2 | 595 | Mean Difference (Fixed, 95% CI) | 0.16 [0.13, 0.20] |
| 9 Difference vs placebo in trough FEV1 ‐ pooled adjusted and EOT analyses Show forest plot | 18 | Mean Difference (Fixed, 95% CI) | 0.20 [0.19, 0.20] | |
| 9.1 IND/GLY 110/50 | 5 | Mean Difference (Fixed, 95% CI) | 0.22 [0.21, 0.24] | |
| 9.2 UMEC/VI 125/25 | 4 | Mean Difference (Fixed, 95% CI) | 0.22 [0.20, 0.25] | |
| 9.3 UMEC/VI 62.5/25 | 6 | Mean Difference (Fixed, 95% CI) | 0.18 [0.17, 0.20] | |
| 9.4 TIO/OLO 2.5/5 | 5 | Mean Difference (Fixed, 95% CI) | 0.17 [0.15, 0.19] | |
| 9.5 TIO/OLO 5/5 | 5 | Mean Difference (Fixed, 95% CI) | 0.19 [0.17, 0.21] | |
| 9.6 ACLID/FORM 200/6 | 1 | Mean Difference (Fixed, 95% CI) | 0.07 [‐0.04, 0.18] | |
| 9.7 ACLID/FORM 200/12 | 1 | Mean Difference (Fixed, 95% CI) | 0.12 [0.01, 0.22] | |
| 9.8 ACLID/FORM 200/18 | 1 | Mean Difference (Fixed, 95% CI) | 0.08 [‐0.04, 0.19] | |
| 10 Difference vs placebo in adjusted peak FEV1 Show forest plot | 7 | 4188 | Mean Difference (Fixed, 95% CI) | 0.31 [0.29, 0.32] |
| 10.1 IND/GLY 110/50 | 2 | 1094 | Mean Difference (Fixed, 95% CI) | 0.35 [0.32, 0.38] |
| 10.2 UMEC/VI 62.5/25 | 1 | 693 | Mean Difference (Fixed, 95% CI) | 0.22 [0.18, 0.27] |
| 10.3 UMEC/VI 125/25 | 1 | 678 | Mean Difference (Fixed, 95% CI) | 0.28 [0.24, 0.32] |
| 10.4 TIO/OLO 2.5/5 | 2 | 644 | Mean Difference (Fixed, 95% CI) | 0.29 [0.27, 0.32] |
| 10.5 TIO/OLO 5/5 | 2 | 656 | Mean Difference (Fixed, 95% CI) | 0.33 [0.30, 0.35] |
| 10.6 ACLID/FORM 200/6 | 1 | 140 | Mean Difference (Fixed, 95% CI) | 0.25 [0.13, 0.37] |
| 10.7 ACLID/FORM 200/12 | 1 | 139 | Mean Difference (Fixed, 95% CI) | 0.31 [0.20, 0.43] |
| 10.8 ACLID/FORM 200/18 | 1 | 144 | Mean Difference (Fixed, 95% CI) | 0.31 [0.19, 0.42] |
| 11 AEs Show forest plot | 17 | 8235 | Odds Ratio (M‐H, Fixed, 95% CI) | 0.95 [0.86, 1.04] |
| 11.1 IND/GLY 110/50 | 6 | 2830 | Odds Ratio (M‐H, Fixed, 95% CI) | 0.90 [0.76, 1.07] |
| 11.2 UMEC/VI 62.5/25 | 5 | 1921 | Odds Ratio (M‐H, Fixed, 95% CI) | 1.07 [0.88, 1.29] |
| 11.3 UMEC/VI 125/25 | 4 | 1401 | Odds Ratio (M‐H, Fixed, 95% CI) | 1.08 [0.86, 1.34] |
| 11.4 UMEC/VI 500/25 | 1 | 51 | Odds Ratio (M‐H, Fixed, 95% CI) | 2.84 [0.32, 25.36] |
| 11.5 TIO/OLO 2.5/5 | 4 | 1011 | Odds Ratio (M‐H, Fixed, 95% CI) | 0.85 [0.66, 1.11] |
| 11.6 TIO/OLO 5/5 | 4 | 1021 | Odds Ratio (M‐H, Fixed, 95% CI) | 0.78 [0.60, 1.01] |
| Outcome or subgroup title | No. of studies | No. of participants | Statistical method | Effect size |
| 1 All‐cause mortality Show forest plot | 16 | 7708 | Odds Ratio (M‐H, Fixed, 95% CI) | 1.86 [0.75, 4.60] |
| 1.1 IND/GLY 110/50 | 3 | 976 | Odds Ratio (M‐H, Fixed, 95% CI) | 2.97 [0.47, 18.97] |
| 1.2 UMEC/VI 62.5/25 | 5 | 1921 | Odds Ratio (M‐H, Fixed, 95% CI) | 3.12 [0.68, 14.36] |
| 1.3 UMEC/VI 125/25 | 4 | 1401 | Odds Ratio (M‐H, Fixed, 95% CI) | 0.14 [0.01, 2.83] |
| 1.4 UMEC/VI 500/25 | 1 | 51 | Odds Ratio (M‐H, Fixed, 95% CI) | 0.0 [0.0, 0.0] |
| 1.5 TIO/OLO 2.5/5 | 6 | 1670 | Odds Ratio (M‐H, Fixed, 95% CI) | 2.53 [0.12, 53.43] |
| 1.6 TIO/OLO 5/5 | 6 | 1689 | Odds Ratio (M‐H, Fixed, 95% CI) | 0.0 [0.0, 0.0] |
| 2 SAEs Show forest plot | 19 | 8682 | Odds Ratio (M‐H, Fixed, 95% CI) | 1.02 [0.80, 1.29] |
| 2.1 IND/GLY 110/50 | 3 | 976 | Odds Ratio (M‐H, Fixed, 95% CI) | 1.35 [0.54, 3.40] |
| 2.2 UMEC/VI 62.5/25 | 6 | 2317 | Odds Ratio (M‐H, Fixed, 95% CI) | 1.29 [0.86, 1.93] |
| 2.3 UMEC/VI 125/25 | 4 | 1403 | Odds Ratio (M‐H, Fixed, 95% CI) | 0.75 [0.46, 1.22] |
| 2.4 UMEC/VI 500/25 | 1 | 51 | Odds Ratio (M‐H, Fixed, 95% CI) | 0.0 [0.0, 0.0] |
| 2.5 TIO/OLO 2.5/5 | 6 | 1670 | Odds Ratio (M‐H, Fixed, 95% CI) | 0.90 [0.49, 1.68] |
| 2.6 TIO/OLO 5/5 | 7 | 1840 | Odds Ratio (M‐H, Fixed, 95% CI) | 0.97 [0.55, 1.73] |
| 2.7 ACM/FOR 200/6 | 1 | 141 | Odds Ratio (M‐H, Fixed, 95% CI) | 0.51 [0.02, 12.96] |
| 2.8 ACM/FOR 200/12 | 1 | 140 | Odds Ratio (M‐H, Fixed, 95% CI) | 0.51 [0.02, 13.07] |
| 2.9 ACM/FOR 200/18 | 1 | 144 | Odds Ratio (M‐H, Fixed, 95% CI) | 1.11 [0.06, 22.41] |
| 3 AECOPD Show forest plot | 3 | 1127 | Odds Ratio (M‐H, Fixed, 95% CI) | 0.53 [0.36, 0.78] |
| 3.1 UMEC/VI 62.5/25 | 2 | 786 | Odds Ratio (M‐H, Fixed, 95% CI) | 0.58 [0.37, 0.93] |
| 3.2 UMEC/VI 125/25 | 1 | 290 | Odds Ratio (M‐H, Fixed, 95% CI) | 0.37 [0.17, 0.78] |
| 3.3 UMEC/VI 500/25 | 1 | 51 | Odds Ratio (M‐H, Fixed, 95% CI) | 1.68 [0.08, 35.43] |
| 4 Time to first AECOPD Show forest plot | 2 | Hazard Ratio (Fixed, 95% CI) | 0.44 [0.31, 0.63] | |
| 4.1 UMEC/VI 125/25 | 2 | Hazard Ratio (Fixed, 95% CI) | 0.44 [0.31, 0.63] | |
| 5 Difference vs placebo in adjusted SGRQ score (HRQoL) Show forest plot | 6 | Mean Difference (Fixed, 95% CI) | ‐4.15 [‐4.99, ‐3.32] | |
| 5.1 UMEC/VI 62.5/25 | 3 | Mean Difference (Fixed, 95% CI) | ‐4.25 [‐5.73, ‐2.77] | |
| 5.2 UMEC/VI 125/25 | 2 | Mean Difference (Fixed, 95% CI) | ‐3.64 [‐5.48, ‐1.80] | |
| 5.3 TIO/OLO 2.5/5 | 2 | Mean Difference (Fixed, 95% CI) | ‐3.89 [‐5.60, ‐2.17] | |
| 5.4 TIO/OLO 5/5 | 2 | Mean Difference (Fixed, 95% CI) | ‐4.72 [‐6.43, ‐3.01] | |
| 6 SGRQ responder analysis Show forest plot | 6 | 3552 | Odds Ratio (M‐H, Fixed, 95% CI) | 1.84 [1.59, 2.12] |
| 6.1 TIO/OLO 2.5/5 | 2 | 579 | Odds Ratio (M‐H, Fixed, 95% CI) | 1.87 [1.30, 2.70] |
| 6.2 TIO/OLO 5/5 | 2 | 578 | Odds Ratio (M‐H, Fixed, 95% CI) | 2.35 [1.63, 3.40] |
| 6.3 UMEC/VI 62.5/25 | 3 | 1441 | Odds Ratio (M‐H, Fixed, 95% CI) | 1.70 [1.37, 2.12] |
| 6.4 UMEC/VI 125/25 | 2 | 954 | Odds Ratio (M‐H, Fixed, 95% CI) | 1.78 [1.35, 2.34] |
| Outcome or subgroup title | No. of studies | No. of participants | Statistical method | Effect size |
| 1 All‐cause mortality Show forest plot | 2 | 1044 | Odds Ratio (M‐H, Fixed, 95% CI) | 2.03 [0.22, 18.35] |
| 1.1 IND/GLY 110/50 | 2 | 1044 | Odds Ratio (M‐H, Fixed, 95% CI) | 2.03 [0.22, 18.35] |
| 2 SAEs Show forest plot | 3 | 1854 | Odds Ratio (M‐H, Fixed, 95% CI) | 1.14 [0.83, 1.56] |
| 2.1 IND/GLY 110/50 | 3 | 1854 | Odds Ratio (M‐H, Fixed, 95% CI) | 1.14 [0.83, 1.56] |
| 3 Difference vs placebo in adjusted SGRQ score (HRQoL) Show forest plot | 2 | Mean Difference (Fixed, 95% CI) | ‐3.88 [‐5.30, ‐2.45] | |
| 3.1 IND/GLY 110/50 | 2 | Mean Difference (Fixed, 95% CI) | ‐3.88 [‐5.30, ‐2.45] | |
| 4 SGRQ responder analysis Show forest plot | 1 | 706 | Odds Ratio (M‐H, Fixed, 95% CI) | 1.35 [0.98, 1.86] |
| 4.1 IND/GLY 110/50 | 1 | 706 | Odds Ratio (M‐H, Fixed, 95% CI) | 1.35 [0.98, 1.86] |
| Outcome or subgroup title | No. of studies | No. of participants | Statistical method | Effect size |
| 1 All‐cause mortality Show forest plot | 18 | 8752 | Odds Ratio (M‐H, Random, 95% CI) | 2.02 [0.79, 5.17] |
| 1.1 IND/GLY 110/50 | 5 | 2020 | Odds Ratio (M‐H, Random, 95% CI) | 2.54 [0.61, 10.48] |
| 1.2 TIO/OLO 2.5/5 | 6 | 1670 | Odds Ratio (M‐H, Random, 95% CI) | 2.53 [0.12, 53.43] |
| 1.3 TIO/OLO 5/5 | 6 | 1689 | Odds Ratio (M‐H, Random, 95% CI) | 0.0 [0.0, 0.0] |
| 1.4 UMEC/VI 62.5/25 | 5 | 1921 | Odds Ratio (M‐H, Random, 95% CI) | 2.92 [0.62, 13.79] |
| 1.5 UMEC/VI 125/25 | 4 | 1401 | Odds Ratio (M‐H, Random, 95% CI) | 0.14 [0.01, 2.83] |
| 1.6 UMEC/VI 500/25 | 1 | 51 | Odds Ratio (M‐H, Random, 95% CI) | 0.0 [0.0, 0.0] |
| 2 SAEs Show forest plot | 22 | 10536 | Odds Ratio (M‐H, Random, 95% CI) | 1.05 [0.87, 1.27] |
| 2.1 IND/GLY 110/50 | 6 | 2830 | Odds Ratio (M‐H, Random, 95% CI) | 1.15 [0.85, 1.55] |
| 2.2 TIO/OLO 2.5/5 | 6 | 1670 | Odds Ratio (M‐H, Random, 95% CI) | 0.89 [0.47, 1.68] |
| 2.3 TIO/OLO 5/5 | 7 | 1840 | Odds Ratio (M‐H, Random, 95% CI) | 0.96 [0.53, 1.74] |
| 2.4 UMEC/VI 62.5/25 | 6 | 2317 | Odds Ratio (M‐H, Random, 95% CI) | 1.28 [0.85, 1.92] |
| 2.5 UMEC/VI 125/25 | 4 | 1403 | Odds Ratio (M‐H, Random, 95% CI) | 0.73 [0.41, 1.30] |
| 2.6 UMEC/VI 500/25 | 1 | 51 | Odds Ratio (M‐H, Random, 95% CI) | 0.0 [0.0, 0.0] |
| 2.7 ACM/FOR 200/6 | 1 | 141 | Odds Ratio (M‐H, Random, 95% CI) | 0.51 [0.02, 12.96] |
| 2.8 ACM/FOR 200/12 | 1 | 140 | Odds Ratio (M‐H, Random, 95% CI) | 0.51 [0.02, 13.07] |
| 2.9 ACM/FOR 200/18 | 1 | 144 | Odds Ratio (M‐H, Random, 95% CI) | 1.11 [0.06, 22.41] |
| 3 AECOPD Show forest plot | 3 | 1127 | Odds Ratio (M‐H, Random, 95% CI) | 0.52 [0.35, 0.78] |
| 3.1 UMEC/VI 62.5/25 | 2 | 786 | Odds Ratio (M‐H, Random, 95% CI) | 0.58 [0.36, 0.93] |
| 3.2 UMEC/VI 125/25 | 1 | 290 | Odds Ratio (M‐H, Random, 95% CI) | 0.37 [0.17, 0.78] |
| 3.3 UMEC/VI 500/25 | 1 | 51 | Odds Ratio (M‐H, Random, 95% CI) | 1.68 [0.08, 35.43] |
| 4 Time to first AECOPD Show forest plot | 2 | Hazard Ratio (Random, 95% CI) | 0.44 [0.31, 0.63] | |
| 4.1 UMEC/VI 125/25 | 2 | Hazard Ratio (Random, 95% CI) | 0.44 [0.31, 0.63] | |
| 5 Difference vs placebo in adjusted SGRQ score (HRQoL) Show forest plot | 8 | Mean Difference (Random, 95% CI) | ‐4.08 [‐4.80, ‐3.36] | |
| 5.1 IND/GLY 110/50 | 2 | Mean Difference (Random, 95% CI) | ‐3.87 [‐5.53, ‐2.22] | |
| 5.2 UMEC/VI 125/25 | 2 | Mean Difference (Random, 95% CI) | ‐3.64 [‐5.48, ‐1.80] | |
| 5.3 UMEC/VI 62.5/25 | 3 | Mean Difference (Random, 95% CI) | ‐4.18 [‐5.92, ‐2.44] | |
| 5.4 TIO/OLO 2.5/5 | 2 | Mean Difference (Random, 95% CI) | ‐3.89 [‐5.60, ‐2.17] | |
| 5.5 TIO/OLO 5/5 | 2 | Mean Difference (Random, 95% CI) | ‐4.72 [‐6.43, ‐3.01] | |
| 6 SGRQ responder analysis Show forest plot | 7 | 4258 | Odds Ratio (M‐H, Random, 95% CI) | 1.74 [1.53, 1.99] |
| 6.1 IND/GLY 110/50 | 1 | 706 | Odds Ratio (M‐H, Random, 95% CI) | 1.35 [0.98, 1.86] |
| 6.2 TIO/OLO 2.5/5 | 2 | 579 | Odds Ratio (M‐H, Random, 95% CI) | 1.87 [1.30, 2.70] |
| 6.3 TIO/OLO 5/5 | 2 | 578 | Odds Ratio (M‐H, Random, 95% CI) | 2.35 [1.63, 3.40] |
| 6.4 UMEC/VI 62.5/25 | 3 | 1441 | Odds Ratio (M‐H, Random, 95% CI) | 1.70 [1.37, 2.12] |
| 6.5 UMEC/VI 125/25 | 2 | 954 | Odds Ratio (M‐H, Random, 95% CI) | 1.78 [1.35, 2.34] |
| 7 Difference vs placebo in adjusted trough FEV1 at EOT Show forest plot | 13 | Mean Difference (Random, 95% CI) | 0.20 [0.18, 0.21] | |
| 7.1 IND/GLY 110/50 | 2 | Mean Difference (Random, 95% CI) | 0.25 [0.20, 0.30] | |
| 7.2 UMEC/VI 125/25 | 4 | Mean Difference (Random, 95% CI) | 0.22 [0.18, 0.26] | |
| 7.3 UMEC/VI 62.5/25 | 6 | Mean Difference (Random, 95% CI) | 0.18 [0.15, 0.22] | |
| 7.4 TIO/OLO 2.5/5 | 3 | Mean Difference (Random, 95% CI) | 0.18 [0.15, 0.20] | |
| 7.5 TIO/OLO 5/5 | 3 | Mean Difference (Random, 95% CI) | 0.21 [0.18, 0.23] | |
| 7.6 ACLID/FORM 200/6 | 1 | Mean Difference (Random, 95% CI) | 0.07 [‐0.04, 0.18] | |
| 7.7 ACLID/FORM 200/12 | 1 | Mean Difference (Random, 95% CI) | 0.12 [0.01, 0.22] | |
| 7.8 ACLID/FORM 200/18 | 1 | Mean Difference (Random, 95% CI) | 0.08 [‐0.04, 0.19] | |
| 8 Difference vs placebo in trough FEV1 at EOT Show forest plot | 5 | Mean Difference (Random, 95% CI) | 0.18 [0.16, 0.20] | |
| 8.1 IND/GLY 110/50 | 3 | Mean Difference (Random, 95% CI) | 0.20 [0.17, 0.22] | |
| 8.2 TIO/OLO 2.5/5 | 2 | Mean Difference (Random, 95% CI) | 0.16 [0.13, 0.19] | |
| 8.3 TIO/OLO 5/5 | 2 | Mean Difference (Random, 95% CI) | 0.16 [0.13, 0.20] | |
| 9 Difference vs placebo in adjusted peak FEV1 Show forest plot | 7 | Mean Difference (Random, 95% CI) | 0.30 [0.28, 0.33] | |
| 9.1 IND/GLY 110/50 | 2 | Mean Difference (Random, 95% CI) | 0.35 [0.31, 0.39] | |
| 9.2 UMEC/VI 125/25 | 1 | Mean Difference (Random, 95% CI) | 0.28 [0.24, 0.32] | |
| 9.3 UMEC/VI 62.5/25 | 1 | Mean Difference (Random, 95% CI) | 0.22 [0.18, 0.27] | |
| 9.4 TIO/OLO 2.5/5 | 2 | Mean Difference (Random, 95% CI) | 0.29 [0.27, 0.32] | |
| 9.5 TIO/OLO 5/5 | 2 | Mean Difference (Random, 95% CI) | 0.33 [0.30, 0.35] | |
| 9.6 ACLID/FORM 200/6 | 1 | Mean Difference (Random, 95% CI) | 0.25 [0.13, 0.37] | |
| 9.7 ACLID/FORM 200/12 | 1 | Mean Difference (Random, 95% CI) | 0.31 [0.20, 0.43] | |
| 9.8 ACLID/FORM 200/18 | 1 | Mean Difference (Random, 95% CI) | 0.31 [0.19, 0.42] | |
| 10 AEs Show forest plot | 17 | 8235 | Odds Ratio (M‐H, Random, 95% CI) | 0.95 [0.86, 1.04] |
| 10.1 IND/GLY 110/50 | 6 | 2830 | Odds Ratio (M‐H, Random, 95% CI) | 0.90 [0.76, 1.07] |
| 10.2 TIO/OLO 2.5/5 | 4 | 1011 | Odds Ratio (M‐H, Random, 95% CI) | 0.85 [0.65, 1.11] |
| 10.3 TIO/OLO 5/5 | 4 | 1021 | Odds Ratio (M‐H, Random, 95% CI) | 0.78 [0.60, 1.01] |
| 10.4 UMEC/VI 62.5/25 | 5 | 1921 | Odds Ratio (M‐H, Random, 95% CI) | 1.07 [0.88, 1.29] |
| 10.5 UMEC/VI 125/25 | 4 | 1401 | Odds Ratio (M‐H, Random, 95% CI) | 1.08 [0.86, 1.34] |
| 10.6 UMEC/VI 500/25 | 1 | 51 | Odds Ratio (M‐H, Random, 95% CI) | 2.84 [0.32, 25.36] |
| 11 Difference vs placebo in trough FEV1 ‐ pooled adjusted and EOT analyses Show forest plot | 18 | Mean Difference (Random, 95% CI) | 0.20 [0.19, 0.21] | |
| 11.1 IND/GLY 110/50 | 5 | Mean Difference (Random, 95% CI) | 0.22 [0.19, 0.26] | |
| 11.2 UMEC/VI 125/25 | 4 | Mean Difference (Random, 95% CI) | 0.22 [0.18, 0.26] | |
| 11.3 UMEC/VI 62.5/25 | 6 | Mean Difference (Random, 95% CI) | 0.18 [0.15, 0.22] | |
| 11.4 TIO/OLO 2.5/5 | 5 | Mean Difference (Random, 95% CI) | 0.18 [0.15, 0.20] | |
| 11.5 TIO/OLO 5/5 | 5 | Mean Difference (Random, 95% CI) | 0.20 [0.18, 0.21] | |
| 11.6 ACLID/FORM 200/6 | 1 | Mean Difference (Random, 95% CI) | 0.07 [‐0.04, 0.18] | |
| 11.7 ACLID/FORM 200/12 | 1 | Mean Difference (Random, 95% CI) | 0.12 [0.01, 0.22] | |
| 11.8 ACLID/FORM 200/18 | 1 | Mean Difference (Random, 95% CI) | 0.08 [‐0.04, 0.19] | |
| Outcome or subgroup title | No. of studies | No. of participants | Statistical method | Effect size |
| 1 All‐cause mortality Show forest plot | 14 | 7287 | Odds Ratio (M‐H, Fixed, 95% CI) | 1.65 [0.60, 4.50] |
| 1.1 IND/GLY 110/50 | 4 | 1682 | Odds Ratio (M‐H, Fixed, 95% CI) | 2.97 [0.47, 18.97] |
| 1.2 TIO/OLO 2.5/5 | 6 | 1670 | Odds Ratio (M‐H, Fixed, 95% CI) | 2.53 [0.12, 53.43] |
| 1.3 TIO/OLO 5/5 | 6 | 1689 | Odds Ratio (M‐H, Fixed, 95% CI) | 0.0 [0.0, 0.0] |
| 1.4 UMEC/VI 62.5/25 | 3 | 1135 | Odds Ratio (M‐H, Fixed, 95% CI) | 3.22 [0.38, 27.52] |
| 1.5 UMEC/VI 125/25 | 3 | 1111 | Odds Ratio (M‐H, Fixed, 95% CI) | 0.14 [0.01, 2.83] |
| 2 SAEs Show forest plot | 17 | 8448 | Odds Ratio (M‐H, Fixed, 95% CI) | 1.09 [0.86, 1.40] |
| 2.1 IND/GLY 110/50 | 5 | 2020 | Odds Ratio (M‐H, Fixed, 95% CI) | 1.23 [0.79, 1.89] |
| 2.2 TIO/OLO 2.5/5 | 6 | 1670 | Odds Ratio (M‐H, Fixed, 95% CI) | 0.90 [0.49, 1.68] |
| 2.3 TIO/OLO 5/5 | 6 | 1689 | Odds Ratio (M‐H, Fixed, 95% CI) | 1.02 [0.54, 1.91] |
| 2.4 UMEC/VI 62.5/25 | 4 | 1531 | Odds Ratio (M‐H, Fixed, 95% CI) | 1.34 [0.75, 2.40] |
| 2.5 UMEC/VI 125/25 | 3 | 1113 | Odds Ratio (M‐H, Fixed, 95% CI) | 0.95 [0.55, 1.66] |
| 2.6 ACM/FOR 200/6 | 1 | 141 | Odds Ratio (M‐H, Fixed, 95% CI) | 0.51 [0.02, 12.96] |
| 2.7 ACM/FOR 200/12 | 1 | 140 | Odds Ratio (M‐H, Fixed, 95% CI) | 0.51 [0.02, 13.07] |
| 2.8 ACM/FOR 200/18 | 1 | 144 | Odds Ratio (M‐H, Fixed, 95% CI) | 1.11 [0.06, 22.41] |
| 3 Time to first AECOPD Show forest plot | 2 | Hazard Ratio (Fixed, 95% CI) | 0.44 [0.31, 0.63] | |
| 3.1 UMEC/VI 125/25 | 2 | Hazard Ratio (Fixed, 95% CI) | 0.44 [0.31, 0.63] | |
| 4 Difference vs placebo in adjusted SGRQ score (HRQoL) Show forest plot | 5 | Mean Difference (Fixed, 95% CI) | ‐4.12 [‐4.99, ‐3.24] | |
| 4.1 IND/GLY 110/50 | 1 | Mean Difference (Fixed, 95% CI) | ‐3.01 [‐5.05, ‐0.97] | |
| 4.2 UMEC/VI 125/25 | 1 | Mean Difference (Fixed, 95% CI) | ‐3.60 [‐5.76, ‐1.44] | |
| 4.3 UMEC/VI 62.5/25 | 1 | Mean Difference (Fixed, 95% CI) | ‐5.51 [‐7.88, ‐3.14] | |
| 4.4 TIO/OLO 2.5/5 | 2 | Mean Difference (Fixed, 95% CI) | ‐3.89 [‐5.60, ‐2.17] | |
| 4.5 TIO/OLO 5/5 | 2 | Mean Difference (Fixed, 95% CI) | ‐4.72 [‐6.43, ‐3.01] | |
| 5 SGRQ responder analysis Show forest plot | 5 | 3234 | Odds Ratio (M‐H, Fixed, 95% CI) | 1.81 [1.56, 2.10] |
| 5.1 IND/GLY 110/50 | 1 | 706 | Odds Ratio (M‐H, Fixed, 95% CI) | 1.35 [0.98, 1.86] |
| 5.2 TIO/OLO 2.5/5 | 2 | 579 | Odds Ratio (M‐H, Fixed, 95% CI) | 1.87 [1.30, 2.70] |
| 5.3 TIO/OLO 5/5 | 2 | 578 | Odds Ratio (M‐H, Fixed, 95% CI) | 2.35 [1.63, 3.40] |
| 5.4 UMEC/VI 62.5/25 | 1 | 693 | Odds Ratio (M‐H, Fixed, 95% CI) | 1.88 [1.37, 2.59] |
| 5.5 UMEC/VI 125/25 | 1 | 678 | Odds Ratio (M‐H, Fixed, 95% CI) | 1.83 [1.32, 2.54] |
| 6 Difference vs placebo in adjusted trough FEV1 at EOT Show forest plot | 10 | Mean Difference (Fixed, 95% CI) | 0.20 [0.19, 0.22] | |
| 6.1 IND/GLY 110/50 | 1 | Mean Difference (Fixed, 95% CI) | 0.28 [0.24, 0.32] | |
| 6.2 UMEC/VI 125/25 | 3 | Mean Difference (Fixed, 95% CI) | 0.22 [0.20, 0.25] | |
| 6.3 UMEC/VI 62.5/25 | 4 | Mean Difference (Fixed, 95% CI) | 0.20 [0.18, 0.22] | |
| 6.4 TIO/OLO 2.5/5 | 3 | Mean Difference (Fixed, 95% CI) | 0.18 [0.15, 0.20] | |
| 6.5 TIO/OLO 5/5 | 3 | Mean Difference (Fixed, 95% CI) | 0.21 [0.18, 0.23] | |
| 6.6 ACLID/FORM 200/6 | 1 | Mean Difference (Fixed, 95% CI) | 0.07 [‐0.04, 0.18] | |
| 6.7 ACLID/FORM 200/12 | 1 | Mean Difference (Fixed, 95% CI) | 0.12 [0.01, 0.22] | |
| 6.8 ACLID/FORM 200/18 | 1 | Mean Difference (Fixed, 95% CI) | 0.08 [‐0.04, 0.19] | |
| 7 Difference vs placebo in trough FEV1 at EOT Show forest plot | 4 | Mean Difference (Fixed, 95% CI) | 0.18 [0.16, 0.20] | |
| 7.1 IND/GLY 110/50 | 2 | Mean Difference (Fixed, 95% CI) | 0.2 [0.17, 0.23] | |
| 7.2 TIO/OLO 2.5/5 | 2 | Mean Difference (Fixed, 95% CI) | 0.16 [0.13, 0.19] | |
| 7.3 TIO/OLO 5/5 | 2 | Mean Difference (Fixed, 95% CI) | 0.16 [0.13, 0.20] | |
| 8 Difference vs placebo in adjusted peak FEV1 Show forest plot | 7 | Mean Difference (Fixed, 95% CI) | 0.31 [0.29, 0.32] | |
| 8.1 IND/GLY 110/50 | 2 | Mean Difference (Fixed, 95% CI) | 0.35 [0.32, 0.38] | |
| 8.2 UMEC/VI 125/25 | 1 | Mean Difference (Fixed, 95% CI) | 0.28 [0.24, 0.32] | |
| 8.3 UMEC/VI 62.5/25 | 1 | Mean Difference (Fixed, 95% CI) | 0.22 [0.18, 0.27] | |
| 8.4 TIO/OLO 2.5/5 | 2 | Mean Difference (Fixed, 95% CI) | 0.29 [0.27, 0.32] | |
| 8.5 TIO/OLO 5/5 | 2 | Mean Difference (Fixed, 95% CI) | 0.33 [0.30, 0.35] | |
| 8.6 ACLID/FORM 200/6 | 1 | Mean Difference (Fixed, 95% CI) | 0.25 [0.13, 0.37] | |
| 8.7 ACLID/FORM 200/12 | 1 | Mean Difference (Fixed, 95% CI) | 0.31 [0.20, 0.43] | |
| 8.8 ACLID/FORM 200/18 | 1 | Mean Difference (Fixed, 95% CI) | 0.31 [0.19, 0.42] | |
| 9 AEs Show forest plot | 11 | 5579 | Odds Ratio (M‐H, Fixed, 95% CI) | 0.97 [0.86, 1.08] |
| 9.1 IND/GLY 110/50 | 3 | 1301 | Odds Ratio (M‐H, Fixed, 95% CI) | 0.92 [0.70, 1.19] |
| 9.2 TIO/OLO 2.5/5 | 4 | 1011 | Odds Ratio (M‐H, Fixed, 95% CI) | 0.85 [0.66, 1.11] |
| 9.3 TIO/OLO 5/5 | 4 | 1021 | Odds Ratio (M‐H, Fixed, 95% CI) | 0.78 [0.60, 1.01] |
| 9.4 UMEC/VI 62.5/25 | 3 | 1135 | Odds Ratio (M‐H, Fixed, 95% CI) | 1.14 [0.89, 1.46] |
| 9.5 UMEC/VI 125/25 | 3 | 1111 | Odds Ratio (M‐H, Fixed, 95% CI) | 1.15 [0.90, 1.48] |
| 10 Difference vs placebo in trough FEV1 ‐ pooled adjusted and EOT analyses Show forest plot | 14 | Mean Difference (Fixed, 95% CI) | 0.20 [0.20, 0.21] | |
| 10.1 IND/GLY 110/50 | 3 | Mean Difference (Fixed, 95% CI) | 0.22 [0.20, 0.25] | |
| 10.2 UMEC/VI 125/25 | 3 | Mean Difference (Fixed, 95% CI) | 0.22 [0.20, 0.25] | |
| 10.3 UMEC/VI 62.5/25 | 4 | Mean Difference (Fixed, 95% CI) | 0.20 [0.18, 0.22] | |
| 10.4 TIO/OLO 2.5/5 | 5 | Mean Difference (Fixed, 95% CI) | 0.20 [0.20, 0.20] | |
| 10.5 TIO/OLO 5/5 | 5 | Mean Difference (Fixed, 95% CI) | 0.21 [0.20, 0.21] | |
| 10.6 ACLID/FORM 200/6 | 1 | Mean Difference (Fixed, 95% CI) | 0.07 [‐0.04, 0.18] | |
| 10.7 ACLID/FORM 200/12 | 1 | Mean Difference (Fixed, 95% CI) | 0.12 [0.01, 0.22] | |
| 10.8 ACLID/FORM 200/18 | 1 | Mean Difference (Fixed, 95% CI) | 0.08 [‐0.04, 0.19] | |