Shoulder replacement surgery for osteoarthritis and rotator cuff tear arthropathy
Abstract
Background
Shoulder replacement surgery is an established treatment for patients with end‐stage glenohumeral osteoarthritis or rotator cuff tear arthropathy who have not improved with non‐operative treatment. Different types of shoulder replacement are commonly used, but their relative benefits and risks compared versus one another and versus other treatments are uncertain. This expanded scope review is an update of a Cochrane Review first published in 2010.
Objectives
To determine the benefits and harms of shoulder replacement surgery in adults with osteoarthritis (OA) of the shoulder, including rotator cuff tear arthropathy (RCTA).
Search methods
We searched the Cochrane Central Register of Controlled Trials, MEDLINE, Embase, CINAHL, SportDiscus, and Web of Science up to January 2019. We also searched clinical trial registers, conference proceedings, and reference lists from previous systematic reviews and included studies.
Selection criteria
We included randomised studies comparing any type of shoulder replacement surgery versus any other surgical or non‐surgical treatment, no treatment, or placebo. We also included randomised studies comparing any type of shoulder replacement or technique versus another. Study participants were adults with osteoarthritis of the glenohumeral joint or rotator cuff tear arthropathy.
We assessed the following major outcomes: pain, function, participant‐rated global assessment of treatment success, quality of life, adverse events, serious adverse events, and risk of revision or re‐operation or treatment failure.
Data collection and analysis
Two review authors independently assessed trial quality and extracted data. We collected trial data on benefits and harms.
Main results
We included 20 studies involving 1083 participants (1105 shoulders). We found five studies comparing one type of shoulder replacement surgery to another type of shoulder replacement surgery, including three studies comparing conventional stemmed total shoulder replacement (TSR) surgery to stemmed humeral hemiarthroplasty. The remaining 15 studies compared one type of shoulder replacement to the same type of replacement performed with a technical modification or a different prosthetic component. We found no studies comparing shoulder replacement surgery to any other type of surgical treatment or to any type of non‐surgical treatment. We found no studies comparing reverse total shoulder replacement surgery to any other type of treatment or to any type of replacement.
Trial size varied from 16 to 161 participants. Participant mean age ranged from 63 to 81 years. 47% of participants were male. Sixteen trials reported participants with a diagnosis of osteoarthritis and intact rotator cuff tendons. Four trials reported patients with osteoarthritis and a rotator cuff tear or rotator cuff tear arthropathy.
All studies were at unclear or high risk of bias for at least two domains, and only one study was free from high risk of bias (included in the main comparison). The most common sources of bias were lack of blinding of participants and assessors, attrition, and major baseline imbalance.
Three studies allowed a comparison of conventional stemmed TSR surgery versus stemmed humeral hemiarthroplasty in people with osteoarthritis. At two years, low‐quality evidence from two trials (downgraded for bias and imprecision) suggested there may be a small but clinically uncertain improvement in pain and function. On a scale of 0 to 10 (0 is no pain), mean pain was 2.78 points after stemmed humeral hemiarthroplasty and 1.49 points lower (0.1 lower to 2.88 lower) after conventional stemmed TSR. On a scale of 0 to 100 (100 = normal function), the mean function score was 72.8 points after stemmed humeral hemiarthroplasty and 10.57 points higher (2.11 higher to 19.02 higher) after conventional stemmed TSR. There may be no difference in quality of life based on low‐quality evidence, downgraded for risk of bias and imprecision. On a scale of 0 to 100 (100 = normal), mean mental quality of life was rated as 57.4 points after stemmed humeral hemiarthroplasty and 1.0 point higher (5.1 lower to 7.1 higher) after conventional stemmed TSR.
We are uncertain whether there is any difference in the rate of adverse events or the rate of revision, re‐operation, or treatment failure based on very low‐quality evidence (downgraded three levels for risk of bias and serious imprecision). The rate of any adverse event following stemmed humeral hemiarthroplasty was 286 per 1000, and following conventional stemmed TSR 143 per 1000, for an absolute difference of 14% fewer events (25% fewer to 21% more). Adverse events included fractures, dislocations, infections, and rotator cuff failure. The rate of revision, re‐operation, or treatment failure was 103 per 1000, and following conventional stemmed TSR 77 per 1000, for an absolute difference of 2.6% fewer events (8% fewer to 15% more).
Participant‐rated global assessment of treatment success was not reported.
Authors' conclusions
Although it is an established procedure, no high‐quality randomised trials have been conducted to determine whether shoulder replacement might be more effective than other treatments for osteoarthritis or rotator cuff tear arthropathy of the shoulder. We remain uncertain about which type or technique of shoulder replacement surgery is most effective in different situations. When humeral hemiarthroplasty was compared to TSR surgery for osteoarthritis, low‐quality evidence led to uncertainty about whether there is a clinically important benefit for patient‐reported pain or function and suggested there may be little or no difference in quality of life. Evidence is insufficient to show whether TSR is associated with greater or less risk of harm than humeral hemiarthroplasty. Available randomised studies did not provide sufficient data to reliably inform conclusions about adverse events and harm. Although reverse TSR is now the most commonly performed type of shoulder replacement, we found no studies comparing reverse TSR to any other type of treatment.
PICO
Plain language summary
Shoulder replacement surgery for osteoarthritis and arthritis associated with torn rotator cuff tendons
Background
Osteoarthritis is a condition of the joints. Over time, the cartilage becomes thinner and exposed bone surfaces rub against each other, causing pain and loss of movement. People with torn shoulder tendons can develop a specific type of arthritis, called rotator cuff tear arthropathy. People usually need pain relief medicines and may be offered non‐surgical treatments initially, including physiotherapy and injections. Some people with ongoing symptoms from advanced arthritis are offered shoulder replacement surgery. In 'humeral hemiarthroplasty', just the head (ball part) of the humerus is replaced with an artificial one and continues to articulate in the socket. In 'total shoulder replacement', the socket is also replaced with an artificial one. In 'reverse total shoulder replacement', the replacement is intentionally done back‐to‐front with an artificial ball fixed to the old socket and an artificial socket placed on top of the humerus. The type of replacement performed usually depends on the pattern of joint and tendon damage.
It is not clear when or whether shoulder replacement is the best treatment for people with osteoarthritis or rotator cuff tear arthropathy, or which type of replacement is best for different people. We searched for the best evidence from studies called randomised trials to try to answer these questions.
Study characteristics
This review is current to 31 January 2019 and includes only studies in which treatment was allocated randomly by type. All study participants had osteoarthritis or rotator cuff tear arthropathy of the shoulder and had tried non‐surgical treatments already. The average age of study participants was between 63 and 81 years old. Slightly more than half of the participants were female. We found no studies comparing shoulder replacement surgery to any other type of treatment, including other types of non‐replacement surgery, physiotherapy, or no treatment at all. We found five studies comparing one type of shoulder replacement to another type of shoulder replacement. We found 15 studies comparing one type of shoulder replacement technique to the same type, performed with a technical modification or a different prosthetic component. Eight out of 20 studies were funded by a shoulder replacement manufacturer. A further seven out of 20 studies were conducted by researchers who had other financial relationships with shoulder replacement manufacturers.
Key results
Three trials (126 participants) met our inclusion criteria for our main comparison of conventional stemmed total shoulder replacement (TSR) versus stemmed humeral hemiarthroplasty (HA) for treatment of osteoarthritis. TSR may result in less pain and better function compared to HA at two‐year follow‐up, but this may not be noticeable. We are very uncertain whether there are any differences in the frequency of adverse events and further operations.
TSR resulted in 15% less pain (1% less to 29% less).
• People who had HA rated their pain as 2.8 points (0 to 10 scale).
• People who had TSR rated their pain as 1.29 points.
TSR resulted in 11% better function (2% better to 19% better).
• People who had HA rated their function as 72.8 points (0 to 100 scale).
• People who had TSR rated their function as 83.4 points.
TSR resulted in similar quality of life to HA (5% lower to 7% higher, 5 points lower to 7 points higher (0 to 100 scale)).
• People who had HA rated their quality of life as 57.4 points.
• People who had TSR rated their quality of life as 58.4 points.
TSR resulted in a similar number of adverse events (25% fewer to 21% more) and a similar number of further operations on the same shoulder (8% fewer to 15% more) compared to HA.
• Following HA, 286 per 1000 people experienced an adverse event and 103 per 1000 required further operations.
• Following TSR, 143 per 1000 people experienced an adverse event and 77 per 1000 required further operations.
Quality of the evidence
For the main comparison, the quality of evidence for assessing pain, function, and quality of life was low. For assessment of adverse events and further operations, the quality of evidence was very low. Across the other 12 comparisons, the quality of evidence was also very low.
Authors' conclusions
Summary of findings
| Conventional stemmed total shoulder replacement compared to stemmed humeral hemiarthroplasty for primary glenohumeral osteoarthritis | ||||||
| Patient or population: adults aged ≥ 18 years with a diagnosis of glenohumeral osteoarthritis who have not responded to non‐operative treatments | ||||||
| Outcomes | Anticipated absolute effects* (95% CI) | Relative effect | № of participants | Quality of the evidence | Comments | |
| Risk with stemmed humeral hemiarthroplasty | Risk with conventional stemmed TSR | |||||
| Pain | Mean pain was 2.78 points | MD 1.49 cm lower | ‐ | 92 | ⊕⊕⊝⊝ | Conventional stemmed TSR may reduce pain slightly compared with stemmed hemiarthroplasty and includes both clinically important and unimportant effectsc Absolute difference 15% lower (1% lower to 29% lower); relative difference 23% lower (2% lower to 44% lower)d |
| Function | Mean function was 72.8 points | MD 10.57 points higher | ‐ | 92 | ⊕⊕⊝⊝ | Conventional stemmed TSR may result in improved function compared with stemmed hemiarthroplasty and includes both clinically important and unimportant effects Absolute difference 11% higher (2% higher to 19% higher); relative difference 32% higher (6% higher to 57% higher).d Number needed to achieve 1 additional beneficial outcome (NNTB) = 6 (95% CI 4 to 30) |
| Participant‐rated global assessment of treatment success | See comment | None of the studies measured or reported this outcome | ||||
| Quality of life assessed with Short Form‐12e | Mean quality of life was 57.4 points | MD 1 higher | ‐ | 41 | ⊕⊕⊝⊝ | Conventional stemmed TSR probably results in little to no difference in quality of life over stemmed hemiarthroplasty but we are uncertain.c Absolute difference 1% higher (5% lower to 7% higher), relative difference 2% higher (9% lower to 13% higher) |
| Adverse events (total): | 286 per 1000 | 143 per 1000 | RR 0.50 | 42 | ⊕⊝⊝⊝ | We are uncertain whether there is any difference in the rate of specific adverse events Absolute difference of 14% fewer events with TSR (25% fewer to 21% more); relative difference 50% fewer (86% fewer to 74% more).c Includes 1 fatal pulmonary embolus in the TSR group |
| Adverse events (serious ‐ resulting in hospitalisation or death) | Only 1 serious adverse event was reported in either arm. Included studies are grossly underpowered for identification of infrequent events | 42 | ⊕⊝⊝⊝ | We are uncertain whether there is any difference in the rate of serious adverse eventsg | ||
| Revision, re‐operation, or treatment failure | 103 per 1000 | 77 per 1000 | RR 0.74 | 125 | ⊕⊝⊝⊝ | We are uncertain whether there is any difference in the rate of revision, re‐operation, or treatment failurec Absolute difference of 2.6% fewer events with TSR (8% fewer to 15% more); relative difference 26% fewer (78% fewer to 146% more) |
| *The risk in the intervention group (and its 95% confidence interval) is based on the assumed risk in the comparison group and the relative effect of the intervention (and its 95% CI). | ||||||
| GRADE Working Group grades of evidence. | ||||||
| aDowngraded one level for risk of bias (at least one trial at high or unclear risk of bias). bDowngraded one level for imprecision: wide confidence intervals due to small sample size from few studies. Confidence intervals include both an important and an unimportant effect. cDowngraded two levels for serious imprecision: very wide confidence intervals. Sample size from few studies grossly underpowered for analysis of infrequent events. dTotal adverse events; includes both serious adverse events and local/specific adverse events not requiring further surgery (i.e. further operations are counted in the revision/re‐operation section only). Specific adverse events included infections, dislocations, fractures, and rotator cuff failures. eMental component score. fNumbers needed to achieve on additional beneficial or harmful outcome (NNTB/NNTH) were not calculated in the absence of a clinically important difference. gRelative changes calculated relative to baseline in control group (i.e. absolute change (mean difference) divided by mean at baseline in the placebo group from Lo 2005 (values were 6.52 points on 0 to 10‐point VAS Pain Scale; 33.5 points on 0 to 100‐point WOOS Score; 55.5 points on 100‐point SF‐36 mental component score; and 29.5 points on 100‐point SF‐36 physical component score). Absolute change calculated as mean difference divided by scale of the instrument, expressed as percentage. | ||||||
Background
Description of the condition
Shoulder osteoarthritis (OA) typically results in narrowing of the glenohumeral (shoulder) joint space due to degeneration of the articular cartilage and subchondral bone, and thickening of the joint capsule. The rotator cuff is an important group of four muscles and associated tendons around the shoulder that are vital for shoulder stability, shoulder rotation, initiation of movement, and fine control. People with advanced damage to the rotator cuff tendons around the shoulder commonly develop a specific pattern of arthritis, termed rotator cuff tear arthropathy (RCTA) (Neer 1983; Walch 2005). Shoulder OA and RCTA present primarily with shoulder pain, stiffness, limitation of shoulder function, and disability. These symptoms are common, affecting 5% to 21% of adults in the USA and in Western countries (Bergenudd 1988; Chakravarty 1990; Chard 1991; Breivik 2006; National Center for Health Statistics 2011). Shoulder OA is the underlying cause of shoulder pain in 2% to 5% of this group (Meislin 2005), although few truly population‐based studies have been done. Shoulder pain is associated with shoulder‐related disability in more than half of the people reporting this pain (Chard 1991; Croft 1996; Pope 1997), and it leads to increased use of healthcare resources (Chalmers 2019; Wofford 1997). Thus, shoulder OA leads to significant morbidity, especially in the ageing population.
Description of the intervention
Current non‐surgical treatment options for chronic shoulder pain associated with shoulder OA include oral analgesics, non‐steroidal anti‐inflammatory drugs (NSAIDs), intra‐articular injections (corticosteroids and hyaluronic acid), physical therapy, and acupuncture (Green 2005). NSAIDs can help to alleviate pain but may cause systemic side effects, including renal insufficiency and gastrointestinal problems, especially among the elderly (ACR 2000; Shamoon 2000). Intra‐articular corticosteroid injections, electrotherapies (including transcutaneous electrical nerve stimulation), exercise, and physiotherapy may provide benefit as they do for other shoulder conditions (Buchbinder 2003; Page 2016a; Page 2016b; van der Windt 2003), but their benefit in shoulder OA has not been proven. Nor has benefit been proven for intra‐articular hyaluronic acid injections for glenohumeral OA over placebo (Blaine 2008; Zhang 2019). If non‐operative treatments fail, and there is disabling pain and loss of function, surgery is usually undertaken.
Joint replacement surgery is now the main surgical treatment for shoulder OA. It involves replacement of either the humeral head (hemiarthroplasty) or the humeral head and the glenoid (total shoulder replacement (TSR)) with implants, or replacement of the humeral head and the glenoid with components in a reversed configuration, that is, through insertion of a metal ball where the native socket was and a plastic cup on a metal stem where the native head was (reverse total shoulder replacement (RTSR) (Grammont 1993)). These procedures are now performed more often, among younger people and for those with earlier degrees of OA.
Shoulder joint replacement treatment options for shoulder OA and RCTA are the focus of this review and include all types of humeral hemiarthroplasty, conventional TSR, and RTSR.
How the intervention might work
Joint replacement surgery involves the removal of damaged bone and cartilage, with release of soft tissues that are causing contractures, when necessary. These damaged tissues and the inflammation associated with them contribute to the painful symptoms of arthritis. The bone and cartilage that have been removed are replaced with new, smooth, prosthetic (man‐made) materials that try to re‐create the anatomy and function of the shoulder joint. The new joint is designed to glide smoothly and restore the centre of rotation of the shoulder joint. The result should be a joint with improved mechanical properties, allowing the muscles to work more easily to move the arm.
The specific reversed geometry design of the reverse TSR is intended to provide the maximum mechanical advantage for the deltoid muscle to move the shoulder and arm in people who do not have intact or functioning rotator cuff muscles (Walker 2011).
Why it is important to do this review
Shoulder pain due to OA is a disabling and common condition. Surgical treatment of shoulder OA with joint replacement has been reported to be associated with significant improvement in pain, function, and quality of life (Fehringer 2002). The previous version of this review found limited, low‐quality evidence to inform decision‐making for patients with shoulder arthritis (Singh 2010). There has been a rapid expansion in both the number of shoulder replacements available and the number of procedures performed annually for shoulder OA (Dillon 2017; Kim 2011; Lübbeke 2017). Therefore, an up‐to‐date synthesis of available evidence is needed to assess the effectiveness and safety of different shoulder replacement methods when compared to each other, to placebo, or to other conservative options. A priority setting partnership funded by the National Institute of Health Research and a national surgical society has identified the optimal type of shoulder replacement for OA as an ongoing research uncertainty (JLA 2015), and this topic appears within its top 10 research priorities.
Objectives
To determine the benefits and harms of shoulder replacement surgery in adults with osteoarthritis (OA) of the shoulder, including rotator cuff tear arthropathy (RCTA).
Methods
Criteria for considering studies for this review
Types of studies
We considered all randomised controlled trials (RCTs) for inclusion. We excluded non‐randomised and quasi‐randomised studies to minimise the risk of patient selection bias. We applied no language restriction on included studies, but no articles required translation.
Types of participants
We included studies of adults (aged 18 years and over) with arthritis of the shoulder joint, confirmed by radiographic examination. We included participants with primary osteoarthritis (OA) and OA secondary to rotator cuff tear arthropathy (RCTA).
We excluded studies of adults undergoing surgery for inflammatory arthritis such as rheumatoid arthritis, benign or malignant tumour, adhesive capsulitis, shoulder instability, or fracture.
Types of interventions
We included studies that compared any type of shoulder replacement surgery to any other treatment modality. We specifically included studies that compared shoulder replacement surgery to placebo (i.e. sham surgery), other surgical modalities (e.g. arthroscopic debridement), non‐surgical modalities (e.g. intra‐articular corticosteroid injections, physiotherapy, acupuncture), or no treatment. In addition, we included studies that compared one type of shoulder replacement to another type of shoulder replacement (e.g. TSR versus RTSR), or one type of shoulder replacement surgical technique to another (e.g. cemented TSR versus uncemented TSR).
Types of outcome measures
Based on the preliminary core domain set described by the OMERACT (Outcome Measures in Rheumatology) Special Interest Group (Buchbinder 2017), we measured the following major outcomes.
Major outcomes
-
Pain measured via a visual analogue scale (VAS), a numerical rating scale (NRS), semi‐quantitative descriptive scales (e.g. short‐form McGill scale (Melzack 1987)), or another instrument
-
Function measured with shoulder‐specific instruments and analysed according to the following hierarchy:
-
Western Ontario Osteoarthritis of the Shoulder Index (WOOS)
-
American Shoulder and Elbow Surgeons Scale (ASES)
-
Oxford Shoulder Score (OSS)
-
Constant Murley Score
-
Shoulder Pain and Disability Index (SPADI)
-
Disability of the Arm, Shoulder, and Hand (DASH) questionnaire
-
-
Participant‐rated global assessment of treatment success
-
Quality of life (mental) measured by a generic instrument such as Short‐Form 36 (SF‐36) and other similar instruments
-
Adverse events (total)
-
Adverse events (serious): assessed as either serious (death, or requiring hospitalisation) or specific (including shoulder stiffness, instability, infection, and nerve damage)
-
Revision or other re‐operation, including treatment failure
Several functional outcome scores (e.g. Constant Murley Score) are often reported as subdomains including pain. We report a pain subscale only when there was no other more appropriate continuous pain scale. There is no clear consensus on the most appropriate physical function score to be used to compare shoulder surgery treatments for arthritis. The hierarchy of function scores was chosen to reflect widely used and validated measures in studies of shoulder replacement surgery, prioritising those with no physician‐measured component and those with valid international translations. Although the Constant Murley Score is widely used (Page 2015), it is heavily weighted by physician‐measured components and was hence downgraded to reduce the potential for risk of bias in this domain.
Death is a rare event in shoulder surgery and therefore was measured within the domain of serious adverse events. Measured range of motion and strength are considered to be of low utility (Buchbinder 2017), and we did not analyse these outcomes separately. We did however assess these outcomes using some functional tools (major outcome 2). For major outcome 6, we defined treatment failure as a procedure for which revision or re‐operation was deemed necessary by a clinician but was not performed because the patient declined further surgery or was unfit.
Minor outcomes
Physician‐evaluated outcomes, including radiographic assessment of lucency.
Timing of outcome assessment
We collected outcome data for the following time points: short‐term (less than one year), intermediate‐term (one to three years), and long‐term (more than three years). We considered the intermediate time point to be the primary time point for comparisons.
Search methods for identification of studies
Electronic searches
We searched the following databases, from inception, with no date or language restrictions.
-
Cochrane Central Register of Controlled Trials (CENTRAL), via the Cochrane Library, Wiley InterScience (www.thecochranelibrary.com).
-
MEDLINE (1966 to 31 January 2019).
-
Embase (1988 to 31 January 2019).
-
Cumulative Index to Nursing and Allied Health Literature (CINAHL) (1937 to 31 January 2019).
-
SportDiscus (1985 to 31 January 2019).
-
Web of Science (1945 to 31 January 2019).
We conducted searches of ClinicalTrials.gov (www.ClinicalTrials.gov), along with the World Health Organization (WHO) International Clinical Trials Registry Platform (www.who.int/ictrp/en/) (31 January 2019).
See Appendix 1, Appendix 2, Appendix 3, Appendix 4, Appendix 5, Appendix 6, Appendix 7, and Appendix 8 for detailed search strategies.
Searching other resources
We checked that reference lists of all primary studies and review articles for additional references. In addition, we searched for published congress abstracts from, but not limited to, the American Academy of Orthopedic Surgeons (AAOS), the British Orthopaedic Association (BOA), the American Society of Shoulder and Elbow Surgeons, the British Elbow and Shoulder Society (BESS), the European Society of Shoulder and Elbow Surgery (SECEC), and the European Federation of National Associations of Orthopaedics and Traumatology (EFORT), using available archives on relevant society websites up to 31 January 2019. We searched relevant manufacturers' websites for trial information and contacted individuals or organisations when appropriate. We searched for errata or retractions from included studies.
Data collection and analysis
Selection of studies
Independently, two review authors (RC, HG) reviewed the titles and abstracts of studies identified by the searches according to the Criteria for considering studies for this review, and we discarded those that clearly were not relevant. We then retrieved the full text of those remaining potentially eligible studies. Independently, the same review authors (RC, HG) repeated the selection process by screening the full‐text versions of these studies to determine which studies should be included and from which data should be extracted. We resolved disagreements by consensus. When consensus was not achieved initially, a third review author (SH or JR) acted as an adjudicator.
We identified and excluded duplicates and collated multiple reports of the same study, so that each study, rather than each report, is the unit of interest in the review. We recorded the selection process in sufficient detail to complete a PRISMA flow diagram (PRISMA Group 2009), as well as the Characteristics of excluded studies tables.
Data extraction and management
We used the online review manager Covidence to create a data collection form for study characteristics and outcome data, which we piloted on one study in the review (Covidence). Independently, two review authors (RC, HG) extracted study characteristics from included studies. Review authors reached consensus for final data extraction by discussion and extracted the following study characteristics.
-
Methods: study design, total duration of study, details of any 'run‐in' period, number of study centres and locations, study setting, description of eligibility criteria for centres and surgeons, withdrawals, and date of study.
-
Participants: N, mean age, age range, sex, sociodemographics, ethnicity, disease duration, severity of condition, diagnostic criteria, important condition‐specific baseline data; inclusion criteria, and exclusion criteria.
-
Interventions: total number of intervention groups within each trial, specific details of each intervention and comparator (e.g. details of the surgery including number of surgeons in the trial, surgeon experience and duration of operation, descriptions of the procedure for tailoring interventions to individual participants), any co‐interventions, and details of rehabilitation following surgery.
-
Outcomes: relevant primary and secondary outcomes specified and collected during the trials and time points reported.
-
Characteristics of the design of the trial as outlined below in the Assessment of risk of bias in included studies section.
-
Notes: funding for trial and notable declarations of interest from trial authors.
Independently, two review authors (RC, HG) extracted outcome data from included studies using Covidence. We extracted the number of events and the number of participants per treatment group for dichotomous outcomes and means and standard deviations, and the number of participants per treatment group for continuous outcomes. We noted in the Characteristics of included studies table whether outcome data were not reported in a usable way, and when data were transformed or estimated from a graph. We resolved disagreements by reaching consensus or by involving a third person (SH). One review author (RC) transferred data into Review Manager 5 (RevMan 5) (RevMan 2014). We double‐checked that data were entered correctly by comparing data presented in the systematic review versus the study reports.
For numerical data presented only in figures or graphs, we contacted the authors of the original report and requested data. When this was not possible, we used software for extraction from graphs (e.g. PlotDigitizer) to extract data from the graphs or figures. We extracted these data in duplicate.
When both final and change from baseline values were reported for a given outcome, we extracted the final value; if both unadjusted and adjusted values for the same outcome were reported, we extracted the unadjusted value. If more than one outcome measure was reported in a trial, we prioritised outcomes based on the hierarchy of major outcomes listed above. When possible, we extracted data based on intention‐to‐treat analysis.
Main planned comparisons
Our main planned comparisons were as follows.
-
Any type of shoulder replacement surgery versus placebo (sham‐surgery).
-
Any type of shoulder replacement versus any type of non‐surgical treatment.
-
Any type of shoulder replacement surgery versus any other type of surgery.
-
Any one type of shoulder replacement surgery versus any other type of shoulder replacement surgery.
-
Any one type of shoulder replacement surgical technique versus any other type of shoulder replacement surgical technique (e.g. cemented versus uncemented implants).
We planned to pool studies of different shoulder replacement types as a single analysis versus a common comparator when techniques were sufficiently similar.
Assessment of risk of bias in included studies
Independently, two review authors (RC, HG) assessed risk of bias for each study using the criteria outlined in the Cochrane Handbook for Systematic Reviews of Interventions (Higgins 2019a). We resolved disagreements by discussion or by consultation with another review author (SH). We assessed risk of bias according to the following domains.
-
Random sequence generation.
-
Allocation concealment.
-
Blinding of participants and personnel.
-
Blinding of outcome assessment ‐ self‐reported outcomes.
-
Blinding of outcome assessment ‐ assessor‐reported outcomes.
-
Incomplete outcome data.
-
Selective outcome reporting.
-
Major baseline imbalance.
-
Differences in rehabilitation regimen.
We graded each potential source of bias as high, low, or unclear, and we provided a quote from the study report together with a justification for our judgement in the 'Risk of bias' table. We summarised the 'Risk of bias' judgements across different studies for each of the domains listed. In addition, we considered the impact of missing data by key outcomes.
When information about risk of bias related to unpublished data or correspondence with a triallist, we have noted this in the 'Risk of bias' table. When considering treatment effects, we took into account the risk of bias for studies that contributed to that outcome. We have presented the figures generated by the 'Risk of bias' tool to provide summary assessments of the risk of bias.
Assessment of bias in conducting the systematic review
We have conducted the review according to the published protocol and have reported any deviations from it in the Differences between protocol and review section of the systematic review.
Measures of treatment effect
We analysed dichotomous data as risk ratios or Peto odds ratios when the outcome is a rare event (approximately < 10%) and used 95% confidence intervals (CIs).
We analysed continuous data as mean difference (MD) or standardised mean difference (SMD), with 95% CIs, depending on whether the outcome was measured using the same scale or different scales. We entered data presented as a scale with a consistent direction of effect across studies. When different scales were used to measure the same conceptual outcome, we back‐translated SMD to a typical scale (e.g. 0 to 10 for pain), as described in Chapter 12 of the Cochrane Handbook for Systematic Reviews of Interventions (Schünemann 2019a). We used a minimal clinically important difference (MCID) of 1.5 points on a 10‐point scale for pain on the VAS (Hao 2019). For function, the MCID of the WOOS Index is reported to be 10 points on a 100‐point scale (Polk 2013), and for the ASES, it is 13.5 points on a 100‐point scale from an anchor‐based study (Werner 2016). For the SF‐12, the MCID in patients with shoulder pain is 1 point on the physical scale and 4 points on the mental scale (Hao 2019).
For dichotomous outcomes, such as serious adverse events, we calculated the number needed to treat for an additional beneficial outcome (NNTB) and the number needed to treat for an additional harmful outcome (NNTH) from the control group event rate and the risk ratio using the Visual Rx NNT calculator (Cates 2008). We planned to calculate the NNTB for continuous measures using the Wells calculator (available at the Cochrane Musculoskeletal Group (CMSG) Editorial office; musculoskeletal.cochrane.org).
For dichotomous outcomes, we calculated the absolute percent change from the difference in risks between intervention and control groups using GRADEpro and expressed it as a percentage (GRADEpro GDT 2015). The relative percent change was calculated as Risk ratio ‐ 1 and was expressed as a percentage.
For continuous outcomes, we calculated the absolute percent change by dividing the mean difference by the scale of the measure and expressed it as a percentage. The relative difference was calculated as the absolute benefit (mean difference) divided by the baseline mean of the control group, expressed as a percentage.
In the 'Comments' column of summary of findings Table for the main comparison, we have provided the absolute per cent difference and the relative per cent change from baseline, along with the NNTB or the NNTH (the NNTB or the NNTH is provided only when the outcome shows a clinically significant difference). When a clinically important difference was present, the MCID values are provided in the Effects of interventions section.
Unit of analysis issues
None of the included trials reported more than two study arms.
When multiple time points were reported, we grouped them into short‐term (less than one year), intermediate‐term (one to three years), and long‐term (more than three years) follow‐up. If a single trial reported multiple time points within one of these groups, we extracted the data that related to the latest time point.
The unit of analysis was each shoulder.
Dealing with missing data
We contacted investigators or study sponsors to verify key study characteristics and to obtain missing numerical outcome data (e.g. when a study was identified as an abstract only, when data were not available for all participants). When this was not possible, and the missing data were thought to introduce serious bias, we considered exploring the impact of including such studies in the overall assessment of results by performing a sensitivity analysis; however these studies did not contribute to outcomes suitable for meta‐analysis.
For dichotomous outcomes (e.g. number of revision operations), we calculated the event rate using the number of participants randomised in the group as the denominator, unless the number at risk was otherwise clearly stated.
For continuous outcomes (e.g. mean change in pain score), we calculated the MD or the SMD based on the number of participants analysed at that time point. If the number of participants analysed was not presented for each time point, we used the number of randomised participants in each group at baseline.
When possible, we computed missing standard deviations from other statistics such as standard errors, confidence intervals, or P values, according to the methods recommended in the Cochrane Handbook for Systematic Reviews of Interventions (Higgins 2019b).
Assessment of heterogeneity
We assessed clinical and methodological diversity in terms of participants, interventions, outcomes, and study characteristics for the included studies to determine whether a meta‐analysis was appropriate. We conducted this by observing these data from the data extraction tables. We assessed statistical heterogeneity by visually inspecting forest plots to assess for obvious differences in results between studies, and by using I² and Chi² statistical tests.
As recommended in theCochrane Handbook for Systematic Reviews of Interventions (Deeks 2019), interpretation of an I² value of 0% to 40% might 'not be important'; 30% to 60% may represent 'moderate' heterogeneity; 50% to 90% may represent 'substantial' heterogeneity; and 75% to 100% represents 'considerable' heterogeneity. As noted in the Cochrane Handbook for Systematic Reviews of Interventions, we kept in mind that the importance of I² depends on (1) the magnitude and direction of effects; and (2) the strength of evidence for heterogeneity.
We interpreted a Chi² test P value ≤ 0.10 as indicative of statistical heterogeneity.
When we identified substantial heterogeneity, we reported it and investigated possible causes by following the recommendations in Section 9.6 of the Cochrane Handbook for Systematic Reviews of Interventions (Deeks 2019).
Assessment of reporting biases
We planned to create and examine funnel plots to explore possible small study biases, as outlined in Section 10.4 of the Cochrane Handbook for Systematic Reviews of Interventions. We were not able to pool more than 10 trials for meta‐analysis; therefore we did not use funnel plots.
To assess outcome reporting bias, we checked trial protocols against their published reports. For studies published after 1 July 2005, we screened the International Clinical Trials Registry Platform of the World Health Organization for the a priori trial protocol (apps.who.int/trialssearch). We evaluated whether selective reporting of outcomes was present.
Data synthesis
We undertook meta‐analyses only when this was meaningful, that is, when treatments, participants, and the underlying clinical question were similar enough for pooling to make sense. For clinically homogeneous studies, we pooled outcomes in a meta‐analysis using the random‐effects model as a default. All included studies were small, hence sensitivity analysis to assess for small study bias was not relevant.
GRADE and 'Summary of findings' tables
We have included 'Summary of findings' (SoF) tables based on the following main comparison.
-
Any one type of shoulder replacement surgery versus any other type of shoulder replacement surgery.
This compares two fundamentally different types of shoulder replacement and is a recognised area of research uncertainty (Rangan 2016). Planned comparisons of shoulder replacement surgery to other treatments or sham treatments were not possible due to lack of studies.
We have included the following seven major outcomes in the SoF tables.
-
Pain.
-
Function.
-
Quality of life.
-
Participant‐rated global assessment of treatment success.
-
Adverse events: total.
-
Adverse events: serious.
-
Revision or re‐operation.
No studies were available to include 'Summary of findings' (SoF) tables based on the following main comparisons.
-
Any type of shoulder replacement surgery versus placebo (sham surgery).
-
Any type of shoulder replacement versus any type of non‐surgical treatment.
-
Any type of shoulder replacement surgery versus any other type of surgery.
When multiple time points were reported, the SoF reports intermediate outcomes (one to three years post surgery). When multiple time points were recorded within this range by the same study, the latest time point has been used.
Two people (RC, HG) independently assessed the quality of the evidence. We used the five GRADE considerations (study limitations, consistency of effect, imprecision, indirectness, and publication bias) to assess the quality of a body of evidence as it relates to studies that contributed data to the meta‐analyses for pre‐specified outcomes, and we reported the quality of evidence as high, moderate, low, or very low. We used methods and recommendations described in Sections 8.5 and 8.7, and in Chapters 11 and 12, of the Cochrane Handbook for Systematic Reviews of Interventions (Higgins 2019a; Schünemann 2019a; Schünemann 2019b). We used GRADEpro software to prepare the SoF tables (GRADEpro GDT 2015). We justified all decisions to downgrade the quality of studies by using footnotes, and we made comments to aid the reader's understanding of the review when necessary.
Subgroup analysis and investigation of heterogeneity
Insufficient data were available to carry out the planned subgroup analyses for the following factors thought to influence outcomes (Muh 2013; Simone 2014).
-
Age of the participant.
-
Presence or absence of significant rotator cuff tear.
Sensitivity analysis
Insufficient data were available to carry out the following sensitivity analyses to investigate the robustness of the treatment effect on pain and function.
-
Inclusion of missing data.
-
Inclusion of trials identified at risk of selection bias.
-
Inclusion of trials with unclear or inadequate blinding of the outcome assessor.
-
Selection of the statistical method for pooled data (fixed‐effect versus random‐effects model).
Results
Description of studies
We have summarised the study characteristics under Included studies and Excluded studies. Full details of each study can be found in the Characteristics of included studies,Characteristics of excluded studies, and Characteristics of ongoing studies tables.
Results of the search
Figure 1 details the studies screened and included in the review. The initial searches performed 2 August 2018 yielded 2081 records, with an additional 41 records obtained from the updated search on 31 January 2019. After exclusion of duplicates and screening of abstracts and titles for eligibility, we identified 43 studies for full‐text review. Of the eight studies included in the previous version of this review (Singh 2010), we excluded one due to concerns regarding the study design, and we noted that 13 new studies met the inclusion criteria. In summary, 20 studies were included, 11 studies were excluded, and a further 12 studies were ongoing and were not yet reported.

Study flow diagram.
Included studies
We identified 20 studies for inclusion in the review. These are described in detail in the Characteristics of included studies table and are summarised here.
Trial design
All 20 studies were parallel‐group randomised controlled trials with two arms. One study was conducted across seven independent sites, four studies recruited from two sites, and the remaining 15 studies were single‐centre trials. Length of follow‐up was six weeks in one study, one year in two studies, two years in 12 studies, three years in two studies, and five years in one study. Two studies provided additional data on selected outcomes at five years and at 10 years.
Trial setting
Seven studies were performed in the United States of America, four in Canada, two in Denmark, two in Germany, and one each in the United Kingdom, France, Sweden, New Zealand, and Australia.
Trial size
A total of 1083 participants (1105 shoulders) were randomised. The median number of shoulders analysed in each study was 42 (range 16 to 161). In 14 of 20 studies, each included participant underwent surgery on one shoulder only. In 5 of 20 studies (Boileau 2002; Edwards 2010; Gartsman 2000; Rahme 2009; Rasmussen 2015), some participants underwent two separate shoulder replacement procedures, which were randomised and analysed independently (203 participants, 224 procedures). In Gascoyne 2017, one participant underwent a bilateral procedure. It is unclear whether the shoulders were randomised independently.
Participants
Sixteen studies reported on patients with glenohumeral osteoarthritis (excluding rotator cuff tear arthropathy), seven of which explicitly stated that the diagnosis was primary osteoarthritis (Boileau 2002; Gartsman 2005; Litchfield 2011; Lo 2005; Nuttall 2007; Sandow 2013; Uschok 2017). In these 16 studies, the mean age of participants ranged from 63 to 70 years, and the median proportion of female participants was 55% (range 30% to 75%). Four studies included participants with rotator cuff tear arthropathy (Edwards 2012; Gobezie 2019; Greiner 2015; Poon 2014). In these studies, the mean age of participants ranged from 69 to 81 years, and the median proportion of female participants was 63% (range 56% to 65%).
Interventions
The 13 different comparisons are summarised below. The different study interventions are described in detail in the Characteristics of included studies tables.
-
We found no studies comparing any type of shoulder replacement surgery to placebo (sham surgery).
-
We found no studies comparing any type of shoulder replacement surgery to any type of non‐surgical treatment.
-
We found no studies comparing any type of shoulder replacement surgery to any other type of surgery.
-
We found five studies comparing one type of shoulder replacement surgery to another type of shoulder replacement surgery.
-
Three compared conventional stemmed TSR to stemmed humeral hemiarthroplasty (Gartsman 2000; Lo 2005; Sandow 2013).
-
One compared re‐surfacing humeral hemiarthroplasty to stemmed humeral hemiarthroplasty (Rasmussen 2015).
-
One compared conventional stemless TSR to conventional stemmed TSR (Uschok 2017).
-
No studies compared reverse TSR to any other type of shoulder replacement.
-
-
We found 15 studies comparing one type of shoulder replacement surgical technique versus any other type of shoulder replacement surgical technique.
-
Six compared different fixation methods/materials for glenoid component fixation for conventional stemmed TSR.
-
Metal‐backed uncemented versus all‐polyethylene keeled glenoid component (Boileau 2002).
-
Pegged versus keeled all‐polyethylene glenoid components (Edwards 2010; Gartsman 2005; Gascoyne 2017; Nuttall 2007; Rahme 2009).
-
-
One compared uncemented to cemented fixation of the humeral stem in conventional stemmed TSR (Litchfield 2011).
-
Three compared different surgical approach techniques for conventional TSR, including the following.
-
Lesser tuberosity osteotomy versus subscapularis peel or tenotomy (Lapner 2012; Levine 2019).
-
Subscapularis sparing versus standard subscapularis tenotomy (Kwon 2019).
-
-
One compared one brand of re‐surfacing humeral hemiarthroplasty to another brand (Mechlenburg 2014).
-
Three compared different glenosphere positioning methods for reverse TSR, including the following.
-
10‐degree inferior inclination versus neutral inclination (Edwards 2012).
-
Bony increased offset versus standard offset (Greiner 2015).
-
Eccentric versus concentric (Poon 2014).
-
-
One compared a 135‐degree humeral neck shaft angle to a 155‐degree angle for stemmed reverse TSR (Gobezie 2019).
-
From the questions with available data, we defined whether to undertake a TSR or a hemiarthroplasty as the main comparison for this review because it is a key uncertainty reported by research priority setting partnerships (Rangan 2016). If studies comparing reverse TSR to other treatments had been available, this would have been rated with high importance. The order of the other comparisons is not specific.
Outcomes
We report the full details of outcomes in the Characteristics of included studies tables. See the summary below.
-
Pain: reported by 12 studies.
-
Eight studies reported the VAS (Gartsman 2000; Gobezie 2019; Kwon 2019; Levine 2019; Lo 2005; Nuttall 2007; Poon 2014; Sandow 2013).
-
Five studies reported the pain subdomain of the Constant Murley Score (Boileau 2002; Greiner 2015; Rasmussen 2015; Sandow 2013; Uschok 2017).
-
-
Function: reported on various scales by 19 studies.
-
Seven studies reported the WOOS Index (Edwards 2010; Gascoyne 2017; Lapner 2012; Litchfield 2011; Lo 2005; Mechlenburg 2014; Rasmussen 2015).
-
Twelve studies reported the ASES Score (Edwards 2010; Edwards 2012; Gartsman 2000; Gascoyne 2017; Gobezie 2019; Kwon 2019; Lapner 2012; Levine 2019; Litchfield 2011; Lo 2005; Nuttall 2007; Poon 2014).
-
One study reported the OSS (Poon 2014).
-
Eleven studies reported the Constant Murley Score (Boileau 2002; Edwards 2010; Edwards 2012; Greiner 2015; Lo 2005; Mechlenburg 2014; Nuttall 2007; Rahme 2009; Rasmussen 2015; Sandow 2013; Uschok 2017).
-
One study reported the DASH Score (Greiner 2015).
-
Three studies reported the UCLA Shoulder Rating Scale (Gartsman 2000; Lo 2005; Sandow 2013).
-
Three studies reported the Single Assessment Numerical Evaluation or the Subjective Shoulder Value (Edwards 2010; Gobezie 2019; Rahme 2009).
-
Two studies reported the Simple Shoulder Test (Gascoyne 2017; Levine 2019).
-
One study reported the McMaster Toronto Arthritis patient preference questionnaire (MACTAR) Score (Litchfield 2011).
-
One study reported the Activities of Daily Living and External Rotation (ADLER) Score (Greiner 2015).
-
-
Quality of life (generic): reported by three studies.
-
Two studies reported Short Form‐36 (Levine 2019; Lo 2005).
-
One study reported Short Form‐12 (Litchfield 2011).
-
-
Participant‐rated global assessment of treatment success.
-
Adverse events (total): reported by 12 studies (Boileau 2002; Edwards 2010; Edwards 2012; Gartsman 2000; Gobezie 2019; Greiner 2015; Lapner 2012; Levine 2019; Litchfield 2011; Lo 2005; Rasmussen 2015; Sandow 2013).
-
Adverse events (serious): reported in two studies (Litchfield 2011; Lo 2005).
-
Revision/re‐operation/treatment failure: reported by 14 studies (Boileau 2002; Edwards 2012; Gartsman 2000; Gobezie 2019; Kwon 2019; Lapner 2012; Levine 2019; Litchfield 2011; Lo 2005; Mechlenburg 2014; Rahme 2009; Rasmussen 2015; Sandow 2013; Uschok 2017).
-
Minor physician‐evaluated outcomes.
-
Radiographic classifications of lucency/loosening/notching/muscle atrophy, etc: reported by 10 studies (Boileau 2002; Edwards 2010; Edwards 2012; Gartsman 2005; Gobezie 2019; Lapner 2012; Levine 2019; Poon 2014; Rahme 2009; Uschok 2017).
-
Radiostereometric analysis of component micromotion: reported by five studies (Gascoyne 2017; Mechlenburg 2014; Nuttall 2007; Rahme 2009; Uschok 2017).
-
Range of motion: reported by 15 studies.
-
Nine studies reported measured ranges in degrees (Edwards 2010; Edwards 2012; Gobezie 2019; Greiner 2015; Kwon 2019; Levine 2019; Litchfield 2011; Nuttall 2007; Poon 2014).
-
Six studies reported the subdomain of Constant Murley Score (Boileau 2002; Greiner 2015; Lo 2005; Rasmussen 2015; Sandow 2013; Uschok 2017).
-
One study reported the subdomain of UCLA Score (Gartsman 2000).
-
-
Strength: reported by nine studies.
-
Two studies reported measurements in pounds (Lapner 2012; Litchfield 2011).
-
Six studies reported the subdomain of Constant Murley Score (Boileau 2002; Greiner 2015; Lo 2005; Rasmussen 2015; Sandow 2013; Uschok 2017).
-
One study reported the subdomain of UCLA Score (Gartsman 2000).
-
-
Operating time: reported by two studies (Levine 2019; Rasmussen 2015).
-
Humeral head bone mineral density reported by one study (Mechlenburg 2014).
-
Range of motion and strength are considered to be of low utility and are not included in core outcome sets (Buchbinder 2017). Therefore these have not been explicitly reported in this review.
Excluded studies
We excluded 11 studies following full‐text review. Of these, four studies did not report on the outcomes of interest (Ding 2015; Edwards 2007; Hendel 2012; Iannotti 2015), and four studies were quasi‐randomised or non‐randomised studies (Berth 2013; Hammond 2013; Kasten 2009; Mariotti 2014). Kircher 2009 was described as a randomised study; however significant concerns regarding the allocation process were identified by the review authors, and this study has also been excluded (see Characteristics of excluded studies). Two studies identified in clinical trials registers were excluded: one had been terminated due to slow recruitment and poor follow‐up (NCT01884077), and one was listed in 2006 but no results have been published and the inclusion criteria did not match this review (ISRCTN42881741).
Ongoing studies
Twelve ongoing trials were identified in clinical trials registers with planned recruitment of 1533 participants (see Characteristics of ongoing studies). Six are listed as actively recruiting (NCT01697865; NCT02768597; NCT02966886; NCT03111147; NCT03727490; NCT03711175), two are active but not recruiting (NCT01288066; NCT01790113), two have recently been completed but no published results are available yet (NCT01404143; NCT03730597), one study is not yet recruiting (NCT02305966), and the status of one is unknown (NCT01587560). Two ongoing studies are comparing one type of shoulder replacement to another type of shoulder replacement (NCT01288066; NCT01790113). The remaining nine studies are comparing one technique to another for the same type of shoulder replacement. Five studies include participants with glenohumeral osteoarthritis with intact rotator cuff tendons, and six studies include participants with rotator cuff tear arthropathy or glenohumeral osteoarthritis with a large/massive rotator cuff tear. None of the registered ongoing studies compares shoulder replacement surgery to any other form of treatment or to placebo (sham surgery). No ongoing studies are comparing RTSRs to other types of shoulder replacement.
Risk of bias in included studies
See Figure 2 and Figure 3 for a summary of the risk of bias assessments across all included trials and for individual ratings for each trial. Full descriptions and review authors' justifications for the assigned ratings are included in the 'Risk of bias' tables within the Characteristics of included studies section.

Risk of bias summary: review authors' judgements about each risk of bias item for each included study.

Risk of bias graph: review authors' judgements about each risk of bias item presented as percentages across all included studies.
Allocation
Sequence generation
For sequence generation, 14 studies were at low risk (Boileau 2002; Edwards 2010; Edwards 2012; Gartsman 2000; Gascoyne 2017; Gobezie 2019; Greiner 2015; Kwon 2019; Lapner 2012; Levine 2019; Litchfield 2011; Mechlenburg 2014; Poon 2014; Rasmussen 2015), and six studies were at unclear risk of bias (Gartsman 2005; Lo 2005; Nuttall 2007; Rahme 2009; Sandow 2013; Uschok 2017). The most common methods of sequence generation were computer‐generated random numbers lists (10 studies) and other unspecified random numbers tables or lists (four studies). One study generated a sequence by drawing lots.
Allocation concealment
Allocation concealment was adequately described and nine studies were at low risk (Edwards 2010; Gascoyne 2017; Lapner 2012; Litchfield 2011; Lo 2005; Mechlenburg 2014; Poon 2014; Rasmussen 2015; Sandow 2013). In 10 studies, allocation concealment was not described or was described in insufficient detail; therefore the risk of bias was unclear (Boileau 2002; Edwards 2012; Gartsman 2000; Gartsman 2005; Gobezie 2019; Greiner 2015; Levine 2019; Nuttall 2007; Rahme 2009; Uschok 2017).
One study was assessed to be at high risk for selection bias (Kwon 2019).
Blinding
Performance bias
All included studies involved surgical interventions for which the surgeon could not be blinded to treatment allocation. The possible effect of this on performance bias (and subsequent outcomes) is unclear, and these studies have all been assessed to be at unclear risk of performance bias. Two studies were rated at high risk of performance bias (Gascoyne 2017; Sandow 2013). In Gascoyne 2017, all procedures were performed by a single surgeon, who terminated the trial early in response to published studies in the literature. In Sandow 2013, study follow‐up was performed open‐label; therefore the results cannot be assumed to be unbiased.
Outcome assessment (self‐reported outcomes)
Follow‐up for two studies was performed open‐label (Levine 2019; Sandow 2013); these were rated at high risk of bias in this domain. In eight studies, robust blinding of participants throughout follow‐up was reported, and these studies were rated at low risk for bias for self‐reported outcomes reporting (Edwards 2010; Gartsman 2005; Gascoyne 2017; Lapner 2012; Litchfield 2011; Lo 2005; Poon 2014; Rahme 2009). In the remaining 10 studies, it is unclear how well and how long participants were blinded (Boileau 2002; Edwards 2012; Gartsman 2000; Gobezie 2019; Greiner 2015; Kwon 2019; Mechlenburg 2014; Nuttall 2007; Rahme 2009; Uschok 2017).
Outcome assessment (physician‐evaluated outcomes)
Only four studies were rated at low risk of bias for physician‐evaluated outcomes (Kwon 2019; Litchfield 2011; Lo 2005; Rasmussen 2015).
Sixteen studies were judged to be at high risk of bias for physician‐evaluated outcomes (Boileau 2002; Edwards 2010; Edwards 2012; Gartsman 2000; Gartsman 2005; Gascoyne 2017; Gobezie 2019; Greiner 2015; Lapner 2012; Levine 2019; Mechlenburg 2014; Nuttall 2007; Poon 2014; Rahme 2009; Sandow 2013; Uschok 2017). This most often pertained to radiographic and/or radiostereometric outcomes, for which risk of bias is high because it is not possible to blind assessors to the radiological appearance of different types of shoulder replacement implants. In addition, although some of the scoring systems used for different types of implants were typically the same conceptually, they were not directly comparable nor validated as such.
In Sandow 2013, one participant undergoing revision surgery was excluded from analysis of failures because the surgeon attributed this failure to his own technical error. It is not possible to appreciate whether technical deficiencies contributed to failures in the other arm of the study, nor whether the procedure method was more likely to result in technical error and subsequent early failure. The contribution of surgical technique to failure was not discussed in any other papers. Therefore, for consistency, this technical failure was included in the analysis of revisions for this review.
Incomplete outcome data
We assessed risk of bias due to attrition to be low in 10 studies (Edwards 2012; Gartsman 2005; Greiner 2015; Levine 2019; Litchfield 2011; Lo 2005; Poon 2014; Rahme 2009; Rasmussen 2015; Sandow 2013), unclear in five studies (Boileau 2002; Gartsman 2000; Mechlenburg 2014; Nuttall 2007; Uschok 2017), and high in the remaining five (Edwards 2010; Gascoyne 2017; Gobezie 2019; Kwon 2019; Lapner 2012). Edwards 2010 reported results in two separate papers. The second report included additional procedures but the flow of participants was very unclear between the two, and it is clear how many patients were at risk for different outcomes at different times. Gascoyne 2017 stopped recruiting early and analysed only 9 of 15 randomised participants. Gobezie 2019 did not analyse 32% of patients at the two‐year endpoint and showed imbalance between groups. Kwon 2019 reported on only 70 of 107 randomised participants and showed imbalance between groups. Lapner 2012 applied post‐randomisation exclusion criteria. Participant flow and loss of follow‐up through studies were often poorly reported within the text of study reports.
Selective reporting
We assessed risk of bias due to selective reporting to be low in 12 studies (Gartsman 2005; Gobezie 2019; Kwon 2019; Lapner 2012; Levine 2019; Litchfield 2011; Lo 2005; Mechlenburg 2014; Poon 2014; Rahme 2009; Rasmussen 2015; Uschok 2017), unclear in five studies (Boileau 2002; Edwards 2012; Gartsman 2000; Nuttall 2007; Sandow 2013), and high in the remaining three studies (Edwards 2010; Gascoyne 2017; Greiner 2015). In Edwards 2010, outcomes were inconsistently reported between two papers for the same study. Patient‐reported outcomes were included only in the second paper, and the primary study endpoints were not clearly defined. Gascoyne 2017 reported findings without numbers at risk and with no measures of central tendency. Greiner 2015 reported on a subgroup analysis that was not pre‐determined using a non‐validated measure. This was the only statistically significant study finding. No trials described or referenced a study protocol, and entries for only five studies were identified on clinical trials registers (Kwon 2019; Lapner 2012; Levine 2019; Litchfield 2011; Mechlenburg 2014).
Other potential sources of bias
Major baseline imbalance
Five studies were at high risk of bias from baseline imbalance (Gascoyne 2017; Litchfield 2011; Mechlenburg 2014; Rasmussen 2015; Uschok 2017). These imbalances were seen in participant sex or baseline function scores. In one large multi‐centre study (Litchfield 2011), trial authors performed a sensitivity analysis and found that a significant effect on the primary study outcome was highly likely to be attributable to sex imbalance.
In five studies, risk of bias from baseline imbalance was unclear (Boileau 2002; Gobezie 2019; Greiner 2015; Kwon 2019; Rahme 2009); in the remaining 10, it was low (Edwards 2010; Edwards 2012; Gartsman 2000; Gartsman 2005; Lapner 2012; Levine 2019; Lo 2005; Nuttall 2007; Poon 2014; Sandow 2013).
Differences in rehabilitation regimen
Sixteen studies described use of a standard postoperative rehabilitation regimen in both control and comparator arms and were assessed to be at low risk of bias (Boileau 2002; Edwards 2010; Gartsman 2000; Gartsman 2005; Gascoyne 2017; Gobezie 2019; Lapner 2012; Levine 2019; Litchfield 2011; Lo 2005; Mechlenburg 2014; Nuttall 2007; Poon 2014; Rasmussen 2015; Sandow 2013; Uschok 2017). Three studies did not describe the postoperative regimen in the text; therefore the risk of bias was unclear (Edwards 2012; Greiner 2015; Rahme 2009). Kwon 2019 applied different postoperative restrictions to the two study groups, and this domain was rated at high risk for bias.
Funding and financial conflicts of interest
We found a few studies spanning a large number of heterogeneous comparisons. These studies are small and reported a high proportion of industry funding or financial conflict of interest. Eight studies reported funding from industry sources (Gobezie 2019; Greiner 2015; Litchfield 2011; Lo 2005; Mechlenburg 2014; Nuttall 2007; Rahme 2009; Sandow 2013). A further seven studies reported a financial conflict of interest for study authors related to study implants (Edwards 2010; Edwards 2012; Gascoyne 2017; Kwon 2019; Poon 2014; Lapner 2012; Uschok 2017). Only three studies reported freedom from any personal financial or research funding that could be perceived as a conflict of interest (Gartsman 2000; Levine 2019; Rasmussen 2015). Two studies provided no information on funding or conflicts of interest (Boileau 2002; Gartsman 2005).
Effects of interventions
Any type of shoulder replacement surgery compared to placebo (sham surgery)
We identified no randomised controlled trials for this comparison.
Any type of shoulder replacement surgery compared to any type of non‐surgical treatment
We identified no randomised controlled trials for this comparison.
Any type of shoulder replacement surgery compared to any other type of surgery
We identified no randomised controlled trials for this comparison.
One type of shoulder replacement surgery compared to another type of shoulder replacement surgery
Conventional stemmed total shoulder replacement (TSR) compared to stemmed humeral hemiarthroplasty
Three studies including a total of 126 participants (130 shoulders) provided the data for this comparison (Gartsman 2000; Lo 2005; Sandow 2013); the main findings are summarised in summary of findings Table for the main comparison.
-
Pain: conventional stemmed TSR may slightly reduce pain at two years (measured on a visual analogue scale (VAS), 0 to 10 scale) compared with stemmed hemiarthroplasty, and the effect may be clinically uncertain (mean difference (MD) ‐1.49, 95% confidence interval (CI) ‐2.88 to ‐0.10; minimum clinically important difference (MCID) 1.5; absolute difference 15% lower (1% lower to 29% lower); relative difference 23% lower (2% lower to 44% lower); 92 shoulders; 2 studies; I² = 55%; Figure 4; low‐quality evidence (downgraded for risk of bias and imprecision)). Sandow 2013 also reported a clinically unimportant benefit in favour of conventional stemmed TSR at two years on a VAS (Table 1); however the results were available only as a median with range and were not suitable for inclusion in the meta‐analysis.
-
Function: conventional stemmed TSR may result in a small, clinically uncertain improvement in shoulder function at two years (measured by different scales represented on WOOS Index, 0 to 100 scale) compared with stemmed hemiarthroplasty (MD 10.57, 95% CI 2.11 to 19.02; MCID 10; absolute difference 11% higher (2% higher to 19% higher); relative difference 32% higher (6% higher to 57% higher); 92 shoulders; 2 studies; I² = 0%; Figure 5; low‐quality evidence (downgraded for risk of bias and imprecision)). This translates to a number needed to treat for an additional beneficial outcome (NNTB) of 6 (95% CI 4 to 30). Sandow 2013 also reported a clinically unimportant benefit in favour of conventional stemmed TSR at two years on the Constant Murley Score and the UCLS Shoulder Score (Table 1); however the results were available only as a median with range and were not suitable for inclusion in the meta‐analysis.
-
Participant‐rated global assessment of treatment success: this outcome was not reported.
-
Quality of life: TSR probably results in little to no difference in quality of life at two years over hemiarthroplasty, but we are uncertain (MD 1.00, 95% CI ‐5.11 to 7.14 (mental); MD ‐0.80, 95% CI ‐8.2 to 6.6 (physical); 41 shoulders; 1 study; Short Form‐12, 0 to 100 scales; Analysis 1.3 and Analysis 1.4; low‐quality evidence (downgraded for risk of bias and imprecision)).
-
Adverse events (total): we are uncertain whether there is any difference in the rate of specific adverse events occurring within three years of surgery (RR 0.50, 95% CI 0.14 to 1.74; 42 shoulders; 1 study; Analysis 1.5; very low‐quality evidence (downgraded for risk of bias and serious imprecision)).
-
Adverse events (serious): we are uncertain whether there is any difference in the rate of serious adverse events within the first year (single event reported in one study arm; 42 shoulders; 1 study; Analysis 1.6; very low‐quality evidence (downgraded for risk of bias and serious imprecision)). This is based on one reported fatal pulmonary embolism.
-
Revision, re‐operation, or treatment failure: we are uncertain whether there is any difference in the rate of revision, re‐operation, or treatment failure within three years (RR 1.29, 95% CI 0.30 to 5.53; 92 shoulders; 2 studies; Figure 6; very low‐quality evidence (downgraded for risk of bias and serious imprecision)). Sandow 2013 noted a trend towards higher revision rates at two years and up to 10 years (RR 0.33, 95% CI 0.07 to 1.53), but we had serious concerns regarding risk of bias for this physician‐determined outcome in this study, and we excluded these results from the meta‐analysis. Overall, the individual and pooled sample sizes were too small to justify reliable conclusions for this outcome in the absence of a large effect size.
-
Physician evaluated: no physician‐evaluated outcomes meeting our eligibility criteria were reported.

Forest plot of comparison: 1 Conventional stemmed TSR vs stemmed humeral hemiarthroplasty, outcome: 1.1 Pain: visual analogue scale (0 to 10, lower = better).
| Comparison | Study ID | Outcome | Measure | Timepoint | Arm 1 | Arm 2 | Notes | ||||
| Description | n | Outcome | Description | n | Outcome | ||||||
| Conventional TSR vs stemmed hemiarthroplasty | Function | UCLA Shoulder Rating Scale (0 to 35 scale, higher = better, reported as mean ± SD) | Intermediate | TSR | 27 | 27.4 ± 4.9 | Stemmed hemiarthroplasty | 24 | 23.2 ± 5.9 | P = 0.008 | |
| Pain | McGill Pain Questionnaire (lower = better, reported as mean ± SD) | Intermediate | TSR | 20 | 0.9 ± 1.4 | Stemmed hemiarthroplasty | 21 | 2.7 ± 6.8 | Scale used is unclear. Original questionnaire reference uses 0 to 78. This is incompatible with the values in this study | ||
| Function | ASES Shoulder Score (0 to 100 scale, higher = better, reported as mean ± SD) | Intermediate | TSR | 20 | 91.1 ± 14.3 | Stemmed hemiarthroplasty | 21 | 83.1 ± 25.6 | P = 0.25 | ||
| UCLA Shoulder Rating Scale (0 to 35 scale, higher = better, reported as mean ± SD) | Intermediate | TSR | 20 | 26.7 ± 3.8 | Stemmed hemiarthroplasty | 21 | 24.2 ± 5.0 | P = 0.10 | |||
| Constant Murley Score (0 to 100 scale, higher = better, reported as mean ± SD) | Intermediate | TSR | 20 | 70.8 ± 17.2 | Stemmed hemiarthroplasty | 21 | 67.1 ± 19.6 | P = 0.55 | |||
| Pain | Visual analogue scale (0 to 10 scale, higher = worse, reported as median and range) | Short‐term | TSR | 16 | 1 (0 to 2.8) | Stemmed hemiarthroplasty | 13 | 2 (0 to 8.8) | P < 0.05 | ||
| Intermediate | TSR | 11 | 0.2 (0 to 4) | Stemmed hemiarthroplasty | 7 | 4.6 (0.4 to 8.5) | P < 0.05 | ||||
| Function | UCLA Shoulder Rating Scale (0 to 35 scale, higher = better, reported as median and range) | Short‐term | TSR | 18 | 30 (21 to 35) | Stemmed hemiarthroplasty | 13 | 29 (12 to 33) | P < 0.05 | ||
| Intermediate | TSR | 11 | 33 (24 to 34) | Stemmed hemiarthroplasty | 6 | 18.5 (10 to 25) | P < 0.05 | ||||
| Constant Murley Score (0 to 100 scale, higher = better, reported as median and range) | Short‐term | TSR | 15 | 68 (48 to 89) | Stemmed hemiarthroplasty | 10 | 59.5 (30 to 85) | ||||
| Intermediate | TSR | 6 | 77 (67 to 95) | Stemmed hemiarthroplasty | 4 | 54.5 (43 to 59) | P < 0.05 | ||||
| Humeral head resurfacing vs stemmed hemiarthroplasty | Pain | Subdomain of Constant Murley Score (0, 5, 10, 15 scale, higher = better, reported as mean and range) | Intermediate | Humeral head resurfacing | 19 | 11.1 (0 to 15) | Stemmed hemiarthroplasty | 19 | 8.0 (0 to 15) | MD 3.2 (95% CI 0.1 to 6.2), P = 0.04 | |
| Function | Constant Murley Score (0 to 100 scale, higher = better, reported as mean and range) | Short‐term | Humeral head resurfacing | 19 | 48.9 (6 to 80) | Stemmed hemiarthroplasty | 19 | 59.1 (0 to 88) | P = 0.14 | ||
| Physician evaluated: operating time | In minutes (continuous scale, lower presumed better, reported as mean and range) | Short‐term | Humeral head resurfacing | 20 | 52 (34 to 80) | Stemmed hemiarthroplasty | 20 | 80 (56 to 103) | P < 0.001 | ||
| Conventional stemless TSR vs conventional stemmed TSR | Pain | Subdomain of Constant Murley Score (0, 5, 10, 15 scale, higher = better, reported as mean ± SD) | Intermediate | Stemless TSR | 15 | 10.9 ± 4.4 | Stemmed TSR | 18 | 13.6 ± 2.9 | P = 0.136 | |
| Long‐term | Stemless TSR | 14 | 12.7 ± 2.4 | Stemmed TSR | 15 | 12.4 ± 2.1 | P = 0.590 | ||||
| Conventional TSR with cemented polyethylene glenoid component vs uncemented metal‐backed glenoid component | Pain | Subdomain of Constant Murley Score (0, 5, 10, 15 scale, higher = better, reported as "average" and range) | Intermediate | Cemented glenoid | 20 | 12.5 (4 to 15) | Uncemented glenoid | 20 | 12 (5 to 15) | ||
| Long‐term | Cemented glenoid | 17 | 12 (0 to 15) | Uncemented glenoid | 18 | 13 (3 to 15) | |||||
| Function | Constant Murley Score (0 to 100, higher = better, reported as average and range) | Intermediate | Cemented glenoid | 20 | 67 (6 to 89) | Uncemented glenoid | 20 | 75 (17 to 89) | |||
| Long‐term | Cemented glenoid | 17 | 68 (6 to 92 | Uncemented glenoid | 18 | 73 (42 to 89) | |||||
| Physician evaluated: Glenoid lucency | Novel 4‐level grading system described but reported only as dichotomous outcome | Long‐term | Cemented glenoid | 20 | 17 | Uncemented glenoid | 20 | 5 | Progression over time observed in only 4 cases in the uncemented group. None in the cemented group | ||
| Conventional TSR with pegged glenoid component vs keeled glenoid component | Pain | Visual analogue scale (0 to 10, lower = better, reported as mean only) | Intermediated | Pegged | 10 | 0.6 | Keeled | 10 | 0.6 | ||
| Function | ASES Shoulder Score (0 to 100 scale, higher = better, reported as mean only) | Intermediate | Pegged | 10 | 78 | Keeled | 10 | 84 | |||
| Constant Murley Score (0 to 100 scale, higher = better, reported as mean only) | Intermediate | Pegged | 10 | 65 | Keeled | 10 | 62 | ||||
| Function | ASES Shoulder Score (0 to 100 scale, higher = better, reported as mean with exact P value) | Long‐term | Pegged | 16 | 68 | Keeled | 22 | 67 | P = 0.635 WOOS Index reported in main analyses | ||
| Constant Murley Score (0 to 100 scale, higher = better, reported as mean with exact P value) | Long‐term | Pegged | 16 | 59.7 | Keeled | 22 | 58.9 | P = 0.728 WOOS Index reported in main analyses | |||
| Single‐assessment numerical evaluation (0 to 100%, higher = better, reported as mean only) | Long‐term | Pegged | 16 | 58.7 | Keeled | 22 | 66.6 | P = 0.247 WOOS Index already included in function analysis | |||
| Function | Constant Murley Score (0 to 100 scale, higher = better, reported as mean only) | Intermediate | Pegged | 14 | 70 | Keeled | 12 | 70 | |||
| Subjective shoulder value (0 to 100%, higher = better, reported as mean only) | Intermediate | Pegged | 14 | 80 | Keeled | 12 | 80 | ||||
| Function | WOOS Index (0 to 100 scale, reversed from normal here ‐ higher = worse, reported as median only) | Short‐term | Pegged | 5 | 7.15 | Keeled | 6 | 34.7 | Authors have used WOOS Index in opposite direction to the usual convention | ||
| Intermediate | Pegged | 4 | 22.3 | Keeled | 5 | 18.5 | |||||
| ASES Shoulder Score (0 to 100 scale, higher = better, reported as median only) | Short‐term | Pegged | 5 | 97.1 | Keeled | 6 | 72.5 | ||||
| Intermediate | Pegged | 4 | 96.4 | Keeled | 5 | 73.5 | |||||
| Simple Shoulder Test Score (0 to 12, higher = better, reported as median only) | Short‐term | Pegged | 5 | 11.0 | Keeled | 6 | 7.0 | ||||
| Intermediate | Pegged | 4 | 10.5 | Keeled | 5 | 6.0 | |||||
| Physician evaluated: radiostereometric analysis (RSA) | Coronal plane translation (mm, lower = better, reported as median only) | Short‐term | Pegged | 5 | 0.267 | Keeled | 6 | 1.518 | P < 0.05 | ||
| Intermediate | Pegged | 4 | 0.235 | Keeled | 5 | 0.990 | P < 0.05 | ||||
| Coronal plane rotation (degrees, lower = better, reported as median only) | Short‐term | Pegged | 5 | 0.601 | Keeled | 6 | 0.307 | ||||
| Intermediate | Pegged | 4 | 1.074 | Keeled | 5 | ‐0.624 | |||||
| Conventional TSR with cemented stemmed humeral component vs uncemented stemmed humeral component | Function | ASES Shoulder Score (0 to 100 scale, higher = better, reported as mean ± SD) | Short‐term | Cemented | 78 | 70.2 ± 10.3 | Uncemented | 74 | 66.2 ± 13.9 | P = 0.09 | |
| Intermediate | Cemented | 78 | 69.2 ± 13.3 | Uncemented | 74 | 64.74 ± 15.7 | P = 0.2 | ||||
| MACTAR Score (0 to 500, lower = better) | Short‐term | Cemented | 78 | 50.6 ± 59.1 | Uncemented | 74 | 70.1 ± 74.1 | P = 0.19 | |||
| Intermediate | Cemented | 78 | 56.1 ± 76.6 | Uncemented | 74 | 69.2 ± 77.7 | P = 0.49 | ||||
| Conventional stemmed TSR via lesser tuberosity osteotomy approach vs subscapularis tenotomy/peel | Function | ASES Shoulder Score (0 to 100 scale, higher = better, reported as mean ± SD) | Short‐term | Osteotomy | 36 | 77.1 ± 23.7 | Peel | 37 | 81.3 ± 18.7 | ||
| Intermediate | Osteotomy | 36 | 79.4 ± 24.6 | Peel | 37 | 83.3 ± 19.0 | |||||
| Physician evaluated: fatty infiltration of rotator cuff muscles | Goutallier grade (0 to 4 grades, higher = worse, reported as mean ± SD) | Short‐term | Osteotomy | 41 | 0.90 ± 0.89 | Peel | 41 | 0.95 ± 0.85 | |||
| Pain | Visual analogue scale (0 to 10 scale, higher = worse, reported as mean) | Short‐term | Osteotomy | 29 | 1.8 | Tenotomy | 30 | 1.9 | Inconsistencies between text and figures. Numbers reported here are from the text | ||
| Function | ASES Shoulder Score (0 to 100 scale, higher = better, reported as mean) | Short‐term | Osteotomy | 29 | 75.6 | Tenotomy | 30 | 74.6 | |||
| Simple Shoulder Test Score (0 to 10 scale, higher = better, reported as mean) | Short‐term | Osteotomy | 29 | 9.1 | Tenotomy | 30 | 7.6 | ||||
| Quality of life | Short Form‐36 (0 to 100 scale, higher = better, reported as mean) | Short‐term | Osteotomy | 29 | 71.1 | Tenotomy | 30 | 64.9 | |||
| Operative time | Minutes (mean, lower better) | Short‐term | Osteotomy | 29 | 152.7 | Tenotomy | 30 | 129.3 | |||
| Humeral head resurfacing with Copeland implant vs Global C.A.P. implant | Function | WOOS Index (raw scale 0 to 1900, lower = better, reported in box plots as median plus 10th/25th/75th/90th centiles) ‐ presented here as median (IQR) | Short‐term | Copeland | 10 | 298 (81 to 788) | Global C.A.P. | 15 | 383 (115 to 822) | ||
| Intermediate | Copeland | 10 | 128 (53 to 550) | Global C.A.P. | 15 | 294 (111 to 477) | |||||
| Constant Murley Score (0 to 100 scale, higher = better, reported in box plots as median plus 10th/25th/75th/90th centiles) ‐ presented here as median (IQR) | Short‐term | Copeland | 10 | 71.6 (59.6 to 87.7) | Global C.A.P. | 15 | 72.7 (58.8 to 88.2) | ||||
| Intermediate | Copeland | 10 | 76.9 (61.1 to 81.2) | Global C.A.P. | 15 | 72.6 (64.6 to 85.7) | |||||
| Physician evaluated: bone mineral density of humeral head | Measured in g/cm³ (continuous scale, higher = better, reported in box plots as median plus 10th/25th/75th/90th centiles) ‐ presented here as median (IQR) | Short‐term | Copeland | 9 | 0.81 (0.62 to 0.97) | Global C.A.P. | 15 | 0.83 (0.60 to 1.04) | |||
| Intermediate | Copeland | 9 | 0.59 (0.50 to 0.65) | Global C.A.P. | 15 | 0.57 (0.47 to 0.73) | |||||
| Reverse polarity TSR with neutral glenosphere vs inferior tilted glenosphere | Function | Constant Murley Score (0 to 100 scale, higher = better, reported as mean ± SD) | Intermediate | Neutral | 22 | 71.4 ± 14.9 | Tilted | 20 | 63.6 ± 12.3 | P = 0.136 ASES Shoulder Score reported in main analyses | |
| Age‐ and gender‐adjusted Constant Murley Score (0 to 100 scale, higher = better, reported as mean ± SD) | Intermediate | Neutral | 22 | 92.6 ± 18.9 | Tilted | 20 | 87.7 ± 23.6 | P = 0.129 ASES Shoulder Score reported in main analyses | |||
| Reverse polarity TSR with eccentric glenosphere position vs concentric position | Function | Oxford Shoulder Score (0 to 48 scale, higher = better, reported as mean with range and P value ‐ back‐translated to SD) | Intermediate | Eccentric | 23 | 35 ± 10.5 | Concentric | 27 | 38 ± 10.5 | P = 0.32 | |
| Reverse polarity TSR with bony increased offset vs standard offset for glenoid component | Pain | Subdomain of Constant Murley Score (0, 5, 10, 15 scale, higher = better, reported as mean ± SD) | Intermediate | BIO | 16 | 12.7 ± 2.8 | STD | 15 | 12.7 ± 3.2 | Not included in meta‐analysis: categorical scale may not behave in same manner as a VAS or NPS | |
| Function | Age‐ and gender‐adjusted Constant Murley Score (0 to 100 scale, higher = better, reported as mean ± SD) | Intermediate | BIO | 16 | 83.3 ± 23.4 | STD | 15 | 89.4 ± 20.8 | Study also reports unadjusted score | ||
| ADLER Score (0 to 30 scale, higher = better, reported as mean ± SD) | Intermediate | BIO | 16 | 25.7 ± 6.9 | STD | 15 | 26.1 ± 5.0 | "Activities of Daily Living requiring External Rotation" | |||
| DASH Score (0 to 100 scale, higher = worse, reported as mean ± SD) | Intermediate | BIO | 16 | 40.9 ± 23.7 | STD | 15 | 34.2 ± 20.2 | ||||
| Reverse polarity TSR with 135° humeral neck‐shaft angle vs 155° humeral neck‐shaft angle | Function | SANE Score (0 to 100 scale, higher = better, reported as mean ± SD) | Intermediate | 135° neck‐shaft angle | 37 | 74 ± 24.4 | 155° neck‐shaft angle | 31 | 76 ± 16.8 | ||
| Simple Shoulder Test Score (0 to 10 scale, higher = better, reported as mean ± SD) | Intermediate | 135° neck‐shaft angle | 37 | 8 ± 3.0 | 155° neck‐shaft angle | 31 | 7 ± 2.2 | ||||
ADLER: Activities of Daily Living and External Rotation.
ASES: American Shoulder and Elbow Surgeons Scale.
DASH: Disability of the Arm, Shoulder, and Hand questionnaire.
IQR: interquartile range.
MACTAR: McMaster Toronto Arthritis patient preference questionnaire.
RSA: radiostereometric analysis.
SANE: single‐assessment numerical evaluation.
SD: standard deviation.
TSR: total shoulder replacement.
WOOS: Western Ontario Osteoarthritis of the Shoulder Index.

Forest plot of comparison: 1 Conventional stemmed TSR vs stemmed humeral hemiarthroplasty, outcome: 1.2 Disability/Function: WOOS Index (0 to 100, higher = better). Gartsmann 2000 raw data reported as ASES Shoulder Score.
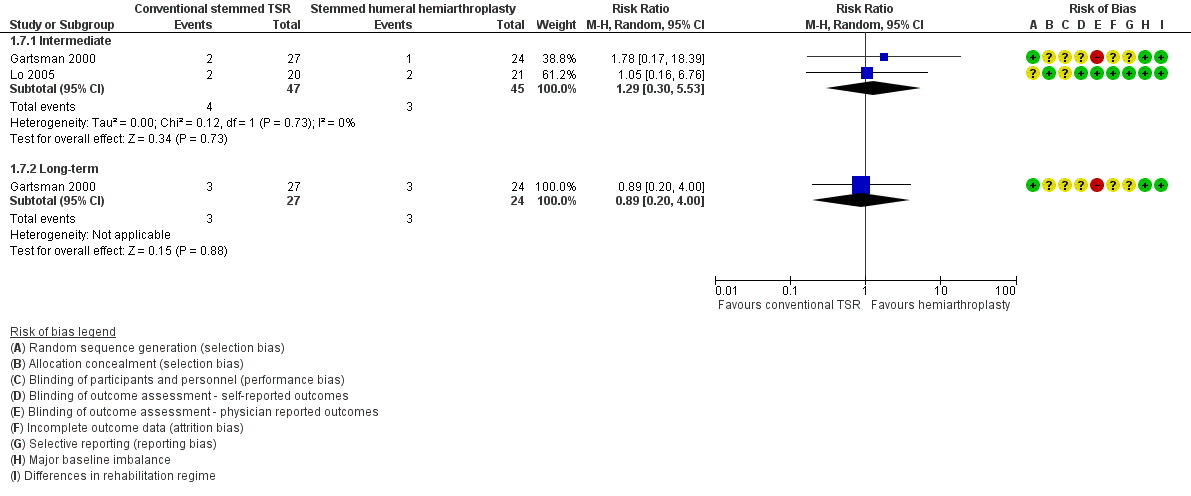
Forest plot of comparison: 1 Conventional stemmed TSR vs stemmed humeral hemiarthroplasty, outcome: 1.7 Revision, re‐operation, or treatment failure (cumulative counts). Sandow 2013 excluded from the meta‐analysis due to multiple potential sources of bias.
Resurfacing humeral hemiarthroplasty compared to stemmed humeral hemiarthroplasty
One study of 35 participants (40 shoulders) provided the data for this comparison (Rasmussen 2015).
-
Pain: we are uncertain whether there is a difference in patient‐reported pain between the two treatment groups. This was reported only as a subdomain of the Constant Murley Score. Trial authors reported a small 3.2‐point difference in favour of stemmed hemiarthroplasty (Table 1). Interpretation of these subscores is not validated, and the evidence is of very low quality (downgraded for risk of bias and serious imprecision).
-
Function: we are uncertain whether there is any effect of resurfacing humeral hemiarthroplasty compared to stemmed humeral hemiarthroplasty on function (WOOS Index, 0 to 100 scale) at one year because the included study reported a large baseline imbalance in this domain, and the confidence interval for the estimated difference was very wide (MD ‐20.2, 95% CI ‐36.99 to ‐3.41; MCID 10; 38 shoulders; Analysis 4.1; very low‐quality evidence (downgraded for risk of bias and serious imprecision)).
-
Participant‐rated global assessment of treatment success: this outcome was not reported.
-
Quality of life: this outcome was not reported.
-
Adverse events (total): we are uncertain whether there is any difference in the rate of adverse events within one year between the two study arms (RR 1.00, 95% CI 0.16 to 6.42; 40 shoulders; Analysis 4.2; very low‐quality evidence (downgraded for risk of bias and serious imprecision)).
-
Adverse events (serious): no serious events were reported.
-
Revision, re‐operation, or treatment failure: we are uncertain whether there is any difference in the rate of revision, re‐operation, or treatment failure (very low‐quality evidence (downgraded for risk of bias and serious imprecision)). Trial authors stated that were no events in either arm, but the study was very underpowered for rare events.
-
Physician evaluated: resurfacing humeral hemiarthroplasty may reduce operating time compared to stemmed humeral hemiarthroplasty (28 minutes shorter, 95% CI 18.7 to 36.7; 40 shoulders). This is an indirect outcome measure with possible relevance to cost‐analyses but no direct relevance to efficacy or effectiveness.
Conventional stemless TSR compared to conventional stemmed TSR
One study of 40 participants (40 shoulders) provided data for this comparison (Uschok 2017).
-
Pain: we are uncertain whether there is a difference in patient‐reported pain between the two treatment groups. This was reported only as a subdomain of the Constant Murley Score. Trial authors report a non‐significant difference (MD 2.7 points, 0 to 15 scale, higher = better; Table 1) in favour of stemmed TSR at two years. Interpretation of these subscores is not validated, and the evidence is of very low quality (downgraded for imprecision and two levels for risk of bias).
-
Function: we are uncertain of the effects of stemless humeral components compared to stemmed humeral components for conventional TSR on function (Constant Murley Score, 0 to 100 scale; Analysis 3.1; very low‐quality evidence (downgraded for imprecision and two levels for risk of bias)). No difference was found at two years (MD ‐0.2, 95% CI ‐9.68 to 9.28; 33 shoulders) nor at five years (MD 2.9, 95% CI ‐7.01 to 12.81; 29 shoulders).
-
Participant‐rated global assessment of treatment success: this outcome was not reported.
-
Quality of life: this outcome was not reported.
-
Adverse events (total): we are uncertain whether there is any difference in the rate of adverse events when stemless compared to stemmed humeral components are used for TSR (very low‐quality evidence (downgraded for serious imprecision and two levels for risk of bias)). The included study was underpowered for rare events, suffered from significant attrition bias, and reported conflicting percentages and counts.
-
Adverse events (serious): no serious events were reported. The comparison is underpowered for rare events.
-
Revision, re‐operation, or treatment failure: we are uncertain whether there is any difference in the rate of revision, re‐operation, or treatment failure when stemless compared to stemmed humeral components are used for TSR (very low‐quality evidence (downgraded for serious imprecision and two levels for risk of bias)). The included study was underpowered for rare events, suffered from significant attrition bias, and reported conflicting percentages and counts.
-
Physician evaluated: the included study reported on several physician‐evaluated radiographic measures, none of which were suitable for inclusion in this review. Lucencies around the humeral components were reported on scales that do not appear to be directly comparable between study arms. The type of glenoid component used changed during the study period (metal‐backed uncemented to all‐polyethylene cemented), and numbers were not balanced between groups. This has significant potential as a confounder and is the topic of one of the other review comparisons. Several humeral component positioning measurements are reported; these are of unclear/indirect relevance to clinically important outcomes and are beyond the scope of this review.
One type of surgical technique compared to any other type of surgical technique
Conventional stemmed TSR with a metal‐backed uncemented component compared to an all‐polyethylene keeled cemented glenoid component
One study of 39 participants (40 shoulders) provided the data for this comparison (Boileau 2002).
-
Pain: we are uncertain whether there is a difference in patient‐reported pain between the two treatment groups. This was reported only as a subdomain of the Constant Murley Score. Trial authors reported no difference between the two groups (Table 1). Interpretation of these subscores is not validated, and the evidence is of very low quality (downgraded for risk of bias and serious imprecision).
-
Function: we are uncertain whether there is a difference in function between the two arms (very low‐quality evidence (downgraded for risk of bias and serious imprecision)). No clinically important or significant difference was identified between groups for the domain of function measured via the Constant Murley Score at 1, 2, and 3 years, reported as an "average" and a range: cemented 67 (6 to 89), uncemented 75 (17 to 89), 0 to 100 scale.
-
Participant‐rated global assessment of treatment success: this outcome was not reported.
-
Quality of life: this outcome was not reported.
-
Adverse events (total): we are uncertain whether there is a difference in the rate of any adverse events between pegged and keeled components (very low‐quality evidence (downgraded for risk of bias and serious imprecision)). Trial authors did not report any adverse events occurring over and above those cases undergoing revision surgery.
-
Adverse events (serious): no serious events were reported.
-
Revision, re‐operation, or treatment failure: there may be a clinically important increased risk of revision at a mean follow‐up of 38 months for metal‐backed uncemented glenoid implants compared to all‐polyethylene keeled cemented components; however we are very uncertain of this effect due to a very wide confidence interval (risk ratio (RR) 11.00, 95% CI 0.65 to 186.62; 40 shoulders; Analysis 2.1; very low‐quality evidence (downgraded for risk of bias and serious imprecision)). This is based for 5 of 20 events in the metal‐backed uncemented group versus 0 of 20 events in the cemented group.
-
Physician evaluated: we are uncertain of the effect or importance of periprosthetic glenoid lucency between the two study arms (very low‐quality evidence (downgraded for risk of bias and serious imprecision)). The presence of radiolucent lines was reported narratively. There was a difference in the presence of any radiolucency for cemented versus uncemented components (17/20 versus 5/20); however none of these radiolucencies progressed in the cemented group, and four of five progressed with associated clinical deterioration in the uncemented group.
Conventional stemmed TSR with pegged compared to keeled all‐polyethylene cemented glenoid components
Five studies comprising a total of 160 participants (172 shoulders) provided data for this comparison (Edwards 2010; Gartsman 2005; Gascoyne 2017; Nuttall 2007; Rahme 2009).
-
Pain: we are uncertain whether there is any difference in self‐reported pain at two years. This outcome was reported by only one study, and as mean values only (MD 0, 95% CI not estimable; 20 participants; VAS 0 to 10 scale; very low‐quality evidence (downgraded for risk of bias and serious imprecision)) (Nuttall 2007).
-
Function: there may be no difference in function between pegged and keeled glenoid components, but we are uncertain (very low‐quality evidence (downgraded for risk of bias and serious imprecision)). Four studies reported on this outcome using different outcome scores, different measures of central tendency (means/medians, exact P values/range/no measure of spread), and different time points. No meta‐analysis was possible. No clinically important or significant difference was reported by any of these studies at one year, two years, or five years follow‐up. The results are summarised in Analysis 5.1 and Table 1.
-
Participant‐rated global assessment of treatment success: this outcome was not reported.
-
Quality of life: this outcome was not reported.
-
Adverse events (total): we are uncertain whether there is a difference in the rate of any adverse events between pegged and keeled components (very low‐quality evidence). No studies reported any adverse events occurring over and above those cases undergoing revision surgery, which are reported below.
-
Adverse events (serious): no serious events were reported.
-
Revision, re‐operation, or treatment failure: the effect of using pegged versus keeled glenoid components in conventional stemmed TSR is uncertain at both two‐year follow‐up (Peto odds ratio (OR) 0.35, 95% CI 0.05 to 2.56; 80 shoulders; 2 studies; I² = 0%) and five‐year follow‐up (Peto OR 0.33, 95% CI 0.08 to 1.46; 59 shoulders; 1 study). Available evidence is of very low quality (downgraded for risk of bias and serious imprecision).
-
Physician evaluated: perioprosthetic glenoid lucency on radiographs and radiostereometric evidence of excessive component micromotion are proposed precursors of subsequent component failure by loosening. We are uncertain if there is any difference in rates of periprosthetic glenoid lucency or micromotion. Using a score of 4 or greater (on a 1 to 5 scale) as a cut‐off for the scales described by Franklin 1988 and Lazarus 2002, there may be little to no difference in the rate of substantial radiolucency when pegged components are compared to keeled components at two‐year follow‐up (RR 0.38, 95% CI 0.02 to 8.83; 71 participants; 2 studies; very low‐quality evidence (downgraded for risk of bias and serious imprecision)) (Edwards 2010; Rahme 2009), or at five‐year follow‐up (RR 1.20, 95% CI 0.55 to 2.63; 38 participants; 1 study; very low‐quality evidence (downgraded for risk of bias and serious imprecision) (Edwards 2010). Gartsman 2005 reported only on immediate postoperative radiographs. Radiostereometric analysis of glenoid component micromotion was performed in three studies. Results are summarised in Table 1. Two studies of 47 shoulders demonstrated no important difference in component translation and rotation between the two groups (very low‐quality evidence (downgraded for risk of bias and serious imprecision)) (Nuttall 2007; Rahme 2009). Gascoyne 2017 found a possible difference in favour of pegged implants; however the study was at high risk of bias across several domains, and the measurement method was changed partway through the study.
Conventional stemmed TSR with uncemented compared to cemented fixation of the humeral stem
One study of 161 participants (161 shoulders) provided the data for this comparison (Litchfield 2011).
-
Pain: this outcome was not reported.
-
Function: we are uncertain if there is a clinically important improvement in function (WOOS Index, 0 to 100 scale) for cemented fixation versus uncemented fixation of the humeral stem in conventional TSR (MD 8.6, 95% CI 2.4 to 14.8; 152 shoulders; MCID 10 points; Analysis 6.1; very low‐quality evidence (downgraded for imprecision and two levels for risk of bias)).
-
Participant‐rated global assessment of treatment success: this outcome was not reported.
-
Quality of life: we are uncertain whether there is a difference in quality of life between cemented and uncemented humeral stem fixation at two years measured via the Short Form‐12 mental component (MD 2.59, 95% CI ‐0.44 to 5.62; MCID 4, scale 0 to 100; Analysis 6.2) and physical component (MD 3.77, 95% CI 0.05 to 7.49; MCID 1, scale 0 to 100; 152 shoulders; Analysis 6.3; very low‐quality evidence (downgraded for imprecision and two levels for risk of bias)).
-
Adverse events (total): we are uncertain if there is any difference in adverse events between cemented and uncemented humeral stem fixation at two years (Peto OR 1.55, 95% CI 0.43 to 5.55; 161 shoulders; Analysis 6.4; very low‐quality evidence (downgraded for serious imprecision and two levels for risk of bias)).
-
Adverse events (serious): we are uncertain whether there is any difference in serious adverse events between cemented and uncemented humeral stem fixation (Peto OR 1.01, 95% CI 0.06 to 16.33; 161 shoulders; Analysis 6.5; very low‐quality evidence (downgraded for serious imprecision and two levels for risk of bias)).
-
Revision, re‐operation, or treatment failure: we are uncertain whether there is any difference between cemented and uncemented humeral stem fixation at two years (Peto OR 1.27, 95% CI 0.28 to 5.79; 152 shoulders; Analysis 6.6; very low‐quality evidence (downgraded for serious imprecision and two levels for risk of bias)).
-
Physician evaluated: no physician‐evaluated outcomes meeting our eligibility criteria were reported.
Conventional stemmed TSR via a subscapularis‐sparing approach compared to standard subscapularis tenotomy
One study of 107 participants (107 shoulders) provided the data for this comparison (Kwon 2019).
-
Pain: there may be little to no difference in self‐reported pain for a subscapularis‐sparing versus a standard approach to conventional TSR, but we are uncertain (MD 0.60, 95% CI ‐0.33 to 1.53; VAS; 70 shoulders; Analysis 7.1; low‐quality evidence (downgraded two levels for risk of bias)).
-
Function: we are uncertain if there is any difference in levels of function (MD ‐5.40, 95% CI ‐14.70 to 3.90; ASES Shoulder Scale; 70 shoulders; Analysis 7.2; very low‐quality evidence (downgraded two levels for risk of bias and serious imprecision)).
-
Participant‐rated global assessment of treatment success: this outcome was not reported.
-
Quality of life: this outcome was not reported.
-
Adverse events (total and serious): these outcomes were not reported.
-
Revision, re‐operation, or treatment failure: we are uncertain whether there is any difference in rates of revision, re‐operation, or treatment failure (Peto OR 3.43, 95% CI 0.46 to 25.67; 70 shoulders; Analysis 7.3; very low‐quality evidence (downgraded two levels for risk of bias and imprecision)).
-
Physician evaluated: no physician‐evaluated outcomes meeting our eligibility criteria were reported.
Conventional stemmed TSR via a lesser tuberosity osteotomy approach compared to subscapularis tenotomy/peel
Two studies of 147 participants (147 shoulders) provided the data for this comparison (Lapner 2012; Levine 2019).
-
Pain: we are uncertain whether there is any difference in patient‐reported pain at one year (MD ‐0.1, 95% CI not estimable; 59 shoulders; 1 study; Levine 2019; Table 1; very low‐quality evidence (downgraded for risk of bias and serious imprecision)).
-
Function: at two years follow‐up, there may be little to no difference in function measured by the WOOS Index, but we are uncertain (MD ‐1.70, 95% CI ‐9.16 to 5.76; 87 shoulders; 1 study; Analysis 8.1; low‐quality evidence (downgraded for risk of bias and imprecision)) (Lapner 2012). Levine 2019 also reported in this domain; however values reported in the text and in the figures showed inconsistencies that we were unable to reconcile.
-
Participant‐rated global assessment of treatment success: this outcome was not reported.
-
Quality of life: this outcome was not reported.
-
Revision, re‐operation, or treatment failure: we are uncertain whether there is any difference in the number of events within two years (Peto OR 0.14, 95% CI 0.01 to 2.21; 87 shoulders; 1 study; Analysis 8.3; very low‐quality evidence (downgraded for risk of bias and serious imprecision)) (Lapner 2012). Only two failures were reported in the tenotomy/peel group, and none in the osteotomy group. Levine 2019 also reported on this outcome but only up to one year post surgery and revealed no differences (one event in each study arm).
-
Adverse events (total): we are uncertain whether there is any difference in the rate of serious adverse events within the first year (Peto OR 3.50, 95% CI 0.57 to 21.54; 59 shoulders; 1 study; Analysis 8.2; very low‐quality evidence (downgraded for risk of bias and serious imprecision)) (Levine 2019).
-
Adverse events (serious): none were reported.
-
Physician evaluated: there may be little to no difference in the likelihood of achieving satisfactory radiological evidence of healing of the repair at one year (RR 0.99, 95% CI 0.87 to 1.13; 140 shoulders; 2 studies; Analysis 8.4; low‐quality evidence (downgraded for risk of bias and imprecision)).
Lapner 2012 also reported the degree of fatty infiltration of the rotator cuff tendons (as described by Goutallier 1994; see Table 1) and strength of the subscapularis at one year and described no difference in either outcome. Levine 2019 reported on range of motion and strength and described no difference in either at one year post surgery. Levine 2019 also reported on operative time and described significantly shorter operative time for subscapularis tenotomy (129.3 minutes versus 152.7 minutes) (very low‐quality evidence (downgraded for imprecision and two levels for risk of bias)).
Resurfacing humeral hemiarthroplasty with one brand compared to another brand
One study of 32 participants (32 shoulders) provided the data for this comparison and compared the Global C.A.P. shoulder implant with the Copeland shoulder implant (Mechlenburg 2014).
-
Pain: this outcome was not reported.
-
Function: we are uncertain whether there is any difference in function between study arms at any time point (very low‐quality evidence (downgraded for risk of bias and serious imprecision)) measured via the WOOS Index (Global C.A.P. 294 (range 111 to 477); Copeland 128 (range 53 to 550); median/interquartile range (IQR), 0 to 1900 (raw) scale; data at 24 months).
-
Participant‐rated global assessment of treatment success: this outcome was not reported.
-
Quality of life: this outcome was not reported.
-
Adverse events (total and serious): no events were reported.
-
Revision, re‐operation, or treatment failure: we are uncertain whether there is any difference between the two types of implants (RR 2.08, 95% CI 0.40 to 10.72; Analysis 9.1; very low‐quality evidence (downgraded for risk of bias and serious imprecision)).
-
Physician evaluated: we are uncertain whether there is any difference between the two types of implants in terms of component micromotion at two years (total translation measured by radiostereometry) (MD ‐0.16 mm, 95% CI ‐0.60 to 0.28; Analysis 9.2; very low‐quality evidence). This study reported micromotion of the humeral components measured via radiostereometric analysis in three planes of translation, one plane of rotation, and aggregate total translation. No differences among the individual components of the analysis were reported. Bone mineral density of the humeral head at two years may be similar between the two groups (Table 1; very low‐quality evidence (downgraded for risk of bias and serious imprecision)).
Reverse stemmed TSR with a 10‐degree inferior inclination of the glenosphere compared to neutral inclination
One study of 52 participants (52 shoulders) provided the data for this comparison and compared use of a 10‐degree inferior tilted glenosphere with a neutral position for reverse TSR (Edwards 2012).
-
Pain: this outcome was not reported.
-
Function: there may be no clinically important improvement in function at one year (measured via the ASES Shoulder Score) (MD 7.60, 95% CI 0.83 to 14.37; MCID 13.5; 42 shoulders; Analysis 10.1; low‐quality evidence (downgraded for risk of bias and imprecision)).
-
Participant‐rated global assessment of treatment success: this outcome was not reported.
-
Quality of life: this outcome was not reported.
-
Adverse events (total): we are uncertain whether there is a difference in adverse events between groups (Peto OR 6.75, 95% CI 0.13 to 341.54; 42 shoulders; Analysis 10.2; very low‐quality evidence (downgraded for risk of bias and serious imprecision)). Only one event (prosthesis dislocation) was reported in the neutral inclination group at short‐term follow‐up.
-
Adverse events (serious): no serious events were reported.
-
Revision, re‐operation, or treatment failure: no events were reported in either group.
-
Physician evaluated: we are uncertain whether there may be any effect of inferior inclination compared to neutral inclination on the rate of any scapular notching (Nerot grade ≥ 1, as per Valenti 2001) at one year (RR 1.15, 95% CI 0.85 to 1.56; 42 shoulders; Analysis 10.3; very low‐quality evidence (downgraded for imprecision and two levels for risk of bias)).
Reverse stemmed TSR with bony increased offset (BIO) of the glenosphere compared to standard offset
One study of 34 participants (34 patients) provided the data for this comparison and compared BIO with standard offset technique (Greiner 2015).
-
Pain: we are uncertain whether there is a difference in pain between BIO and the standard offset technique (very low‐quality evidence). The included study reported on the subdomain of pain from the Constant Murley Score (MD 0 points, 95% CI not estimated; 31 shoulders; Table 1). The subscale is not validated for independent use and analysis as a continuous variable; therefore any interpretation should be done cautiously.
-
Function: we are uncertain whether there is any difference in levels of function at two years for BIO compared to the standard technique when measured by the Constant Murley Score (MD 2.60, 95% CI ‐9.52 to 14.72; 31 shoulders; Analysis 11.1; very low‐quality evidence (downgraded for imprecision and two levels for risk of bias)).
-
Participant‐rated global assessment of treatment success: this outcome was not reported.
-
Adverse events (total): we are uncertain whether there is any difference in the rate of adverse events (RR 0.94, 95% CI 0.15 to 5.84; 31 shoulders; Analysis 11.2; very low‐quality evidence (downgraded for serious imprecision and two levels for risk of bias)). Reported complications were acromial stress fractures (two in each arm) seen on a planned computed tomography (CT) scan at one‐year follow‐up. No other complications were reported.
-
Adverse events (serious): no serious adverse events were reported.
This study did not report on the following outcomes quality of life, physician evaluated.
Reverse stemmed TSR via eccentric placement of the glenoid compared to concentric placement
One study of 50 participants (50 shoulders) provided the data for this comparison and compared eccentric with concentric placement of the glenosphere (Poon 2014).
-
Pain: there is no clinically important difference between eccentric versus concentric placement of the glenosphere in pain at two years measured on a VAS (MD 0.20, 95% CI ‐0.63 to 1.03; 50 shoulders; Analysis 12.1; moderate‐quality evidence (downgraded for risk of bias)).
-
Function: there is no clinically important difference in function at two years measured by the ASES Shoulder Score (MD ‐2.00, 95% CI ‐5.17 to 1.17; 50 shoulders; Analysis 12.2; moderate‐quality evidence (downgraded for risk of bias)).
-
Participant‐rated global assessment of treatment success: this outcome was not reported.
-
Quality of life: this outcome was not reported.
-
Adverse events (total): we are uncertain whether using eccentric versus concentric placement of the glenosphere has any effect on rates of specific adverse events within two years (Peto OR 1.18, 95% CI 0.07 to 19.57; 50 shoulders; Analysis 12.3; very low‐quality evidence (downgraded for risk of bias and serious imprecision)).
-
Adverse events (serious): no serious adverse events were reported.
-
Revision, re‐operation, or treatment failure: we are uncertain whether using eccentric versus concentric placement of the glenosphere has any effect on rates of revision, re‐operation, or treatment failure within two years (Peto OR 0.16, 95% CI 0.00 to 8.01; 50 shoulders; Analysis 12.4; very low‐quality evidence (downgraded for risk of bias and serious imprecision)).
-
Physician evaluated: we are uncertain whether using eccentric versus concentric placement of the glenosphere has any effect on the rate of glenoid notching (defined as a Nerot grade ≥ 1, as per Valenti 2001) (RR 0.29, 95% CI 0.04 to 2.44; 50 shoulders; Analysis 12.5; very low‐quality evidence (downgraded for risk of bias and serious imprecision)).
Reverse stemmed TSR via a 135‐degree humeral neck‐shaft angle compared to a 155‐degree neck‐shaft angle
One study of 100 participants (100 shoulders) provided the data for this comparison (Gobezie 2019).
-
Pain: we are uncertain whether there is any difference in patient‐reported pain up to two years between a 135‐degree and a 155‐degree neck‐shaft angle for RTSR, measured on a VAS (MD 1.00, 95% CI ‐0.13 to 2.13; 68 shoulders; Analysis 13.1; very low‐quality evidence (downgraded for imprecision and two levels for risk of bias)).
-
Function: we are uncertain whether there is any difference in patient‐reported pain up to two years between a 135‐degree and a 155‐degree neck‐shaft angle for reverse TSR, measured on the ASES Shoulder Score (MD ‐4.00, 95% CI ‐13.54 to 5.54; 68 shoulders; Analysis 13.2; very low‐quality evidence (downgraded for imprecision and two levels for risk of bias)).
-
Participant‐rated global assessment of treatment success: this outcome was not reported.
-
Quality of life: this outcome was not reported.
-
Adverse events (total): we are uncertain whether using a 135‐degree and a 155‐degree neck‐shaft angle for RTSR has any effect on rates of specific adverse events within two years (RR 1.05, 95% CI 0.31 to 3.57; 68 shoulders; Analysis 13.3; very low‐quality evidence (downgraded for serious imprecision and two levels for risk of bias)).
-
Adverse events (serious): no serious adverse events were reported.
-
Revision, re‐operation, or treatment failure: we are uncertain whether using a 135‐degree and a 155‐degree neck‐shaft angle for RTSR has any effect on rates of revision, re‐operation, or treatment failure (RR 0.42, 95% CI 0.08 to 2.14; 67 shoulders; Analysis 13.4; very low‐quality evidence (downgraded for serious imprecision and two levels for risk of bias)).
-
Physician evaluated (scapular notching): use of a 135‐degree neck‐shaft angle humeral component for reverse TSR may be associated with lower rates of scapular notching compared with a 155‐degree neck‐shaft angle humeral component for reverse TSR (RR 0.37, 95% CI 0.37 to 0.74; 68 shoulders; low‐quality evidence (downgraded two levels for risk of bias)).
Discussion
Summary of main results
No randomised trials have compared shoulder replacement surgery versus placebo, non‐operative management, or any other type of surgical treatment. No ongoing studies are addressing these comparisons based on the registered descriptions of 12 ongoing trials. Therefore the potential benefits and adverse effects of shoulder replacement surgery for osteoarthritis or rotator cuff tear arthropathy compared to any other treatment modalities are unknown and will not be clarified by current ongoing trials.
A total of 20 trials looked at 13 different comparisons of different types of shoulder replacement and different technical aspects of shoulder replacement surgery. Thus trials on this review topic remain small and diverse ‐ not large or focused on ongoing research uncertainties. Of the 20 identified trials, five addressed pegged versus keeled glenoid components for conventional total shoulder replacement (TSR), three compared conventional TSR to stemmed humeral hemiarthroplasty, two compared lesser tuberosity osteotomy to subscapularis tenotomy, and the remaining 10 comparisons were based on a single trial each. Pooling of data for meta‐analysis was possible for only four outcomes in the main comparison of conventional stemmed TSR versus humeral hemiarthroplasty, two outcomes for the comparison of pegged versus keeled glenoid components, and one outcome for the comparison of lesser tuberosity osteotomy versus subscapularis tenotomy. The overall quality of evidence for most comparisons was low or very low; therefore few useful conclusions can be drawn. In particular, for dichotomous outcomes (adverse events and risks of revision, re‐operation, or treatment failure), studies were universally too small to be powered for detection and comparison of rare events. The largest study included only 161 participants and was limited to two‐year follow‐up. Across all comparisons, we are very uncertain whether there is any difference in adverse events between any one comparator group and another.
For the main comparison of conventional stemmed TSR versus stemmed humeral hemiarthroplasty for osteoarthritis, low‐quality evidence suggests there may be a clinically unimportant improvement in pain (mean difference (MD) ‐1.49, 95% confidence interval (CI) ‐2.88 to ‐0.10; mean clinically important difference (MCID) 1.5; absolute difference 15% lower (1% lower to 29% lower); relative difference 23% lower (2% lower to 44% lower)) and there may be a clinically unimportant improvement in function (MD 10.57, 95% CI 2.11 to 19.02; MCID 10; absolute difference 11% higher (2% higher to 19% higher); relative difference 32% higher (6% higher to 57% higher)) in favour of TSR. There may be no clinically important difference in overall quality of life measures (MD 1.00, 95% CI ‐5.11 to 7.14; MCID 4; absolute difference 1% higher (5% lower to 7% higher); relative difference 2% higher (9% lower to 13% higher)). We are uncertain whether there is any difference in rates of adverse events, revision, re‐operation, or treatment failure because the evidence is of very low quality. Participant‐rated global assessment of treatment success and physician‐evaluated outcomes of interest were not reported.
The one study comparing metal‐backed uncemented glenoid components to cemented all‐polyethylene components for TSR noted that there may be a higher risk of revision or re‐operation surgery at a mean of 38 months post surgery (Peto OR 9.29, 95% CI 1.46 to 59.09); however confidence in this estimate is very low based on serious imprecision in the estimate.
For the comparison of a subscapularis‐sparing versus a standard approach for TSR, low‐quality evidence suggests there may be little or no difference in participant‐reported pain at two years (MD 0.6 points, 95% CI ‐0.33 to 1.53; 0 to 10 scale; MCID 1.5 points).
For the comparison of lesser tuberosity osteotomy versus subscapularis tenotomy/peel for the approach to TSR, low‐quality evidence suggests there may be little or no difference in patient‐reported function (MD ‐1.7 points, 95% CI ‐9.2 to 5.7; 0 to 100 scale).
For reverse shoulder replacement, low‐quality evidence from one study comparing a 10‐degree inferior inclination position to a neutral glenosphere position suggests there may be a clinically unimportant improvement in participant‐reported function at one year (MD 7.60 points, 95% CI 0.83 to 14.37; 0 to 100 scale).
For eccentric versus concentric position of the glenosphere in reverse TSR for cuff tear arthropathy, one RCT provided moderate‐quality evidence to show there is little to no difference between the two in terms of pain and function.
Overall completeness and applicability of evidence
Evidence from available studies is inadequate to address the main review objective ‐ to determine the benefits and harms of shoulder replacement surgery in adults with osteoarthritis (OA) of the shoulder, including rotator cuff tear arthropathy (RCTA).
No randomised studies in this field have adequately addressed the fundamental question of the effectiveness and risks of one type of shoulder replacement over another, or the effectiveness and risks of shoulder replacement surgery compared to no treatment, placebo, or any other form of treatment for OA or RCTA. Only three comparisons (five studies) between one class of shoulder replacement and another have been made (stemmed humeral hemiarthroplasty versus TSR, stemmed humeral hemiarthroplasty versus resurfacing humeral hemiarthroplasty, stemless humeral hemiarthroplasty versus stemmed humeral hemiarthroplasty). Important uncertainties regarding the major classes of shoulder replacement remain unanswered by this review, specifically the choice between humeral hemiarthroplasty, conventional TSR, and reverse TSR, which presents far more fundamental questions than those addressed in more specific narrow‐subtype studies. Most included studies compared one technique versus another. The importance and generalisability of some of these comparisons are not apparent. Many comparisons were supported by only one study, and most of the outcomes for comparisons with more than one study were inadequately reported to allow meta‐analysis. Therefore, results were for the most part inconclusive.
With regard to serious adverse events and risks of revision surgery, none of the included studies were of sufficient size and length of follow‐up to be powered to identify these events reliably. Although three studies reported on revision risk for the main comparison of conventional stemmed TSR versus stemmed hemiarthroplasty, the quality of the evidence is very low. No firm conclusions on these outcomes can be made.
Quality of the evidence
The quality of the review is inherently limited by the low or very low quality of the included studies. Studies were small and covered short periods of follow‐up. The quality of evidence for the main comparison is summarised according to GRADE criteria in summary of findings Table for the main comparison and is stated for each comparison and outcome in the main results section, together with reasons for downgrading the evidence level.
Evidence was downgraded by at least one level due to bias for all comparisons for patient‐reported outcomes including pain, function, and quality of life. Serious concerns for bias were common for reporting of radiological outcome measures (physician evaluated), and risk of performance bias was unclear or high in all studies. The nature of the intervention implies an inherent risk of (physician) performance bias; however, the implications of this are not clear. Imbalances between comparator arms were common at baseline. These imbalances have the potential to significantly distort the results and conclusions of individual studies.
Twenty studies contributed to 13 different comparisons, and few pooled analyses were possible. For the main comparison of conventional stemmed TSR versus stemmed humeral hemiarthroplasty, the direction of treatment effects was consistent for all outcomes.
No studies were identified that directly or indirectly addressed the efficacy of shoulder replacement surgery compared to any other surgical or non‐surgical treatments. Populations included in these studies were representative of patients with primary osteoarthritis and rotator cuff tear arthropathy. The evidence may not be applicable to patients with secondary arthritis (e.g. due to sequelae of trauma). Reported physician‐evaluated outcomes included radiological and radiostereometric measures of implant loosening. These may have a relationship with future implant failure and performance but are not directly relevant to the patient‐experienced outcome.
For the comparison of eccentric versus concentric positioning of the glenoid in reverse stemmed TSR, a precise estimate was made to determine that there was no difference in pain or function. However, for all other outcomes and comparisons, the quality of evidence was downgraded by at least one level for imprecision. For dichotomous outcomes including adverse events and revision/re‐operation/treatment failure, the evidence was downgraded by two levels for serious imprecision. The included studies were all too small to be powered to reliably identify these low‐frequency events.
We did not identify any systematic evidence of publication bias due to unreported studies. Only one registered study was unpublished due to poor recruitment. However, only five of the included studies were recorded on trials registers, none were referenced in a study protocol, and a large proportion of small studies were industry‐funded. We cannot be certain that there have been no unpublished trials.
Potential biases in the review process
This review was conducted according to the previously published protocol. Although this is an update of a previous review on the topic (Singh 2010), the scope was significantly changed to explicitly include trials of participants with rotator cuff tear arthropathy and to restrict the included studies to only those with any type of shoulder replacement as one of the study arms. To reflect this change, all searches were redesigned and run without date limits, and all studies were screened for this review by two independent review authors. These review authors made the decision to include studies and assessments of risk of bias independently of the previous review process with reference to updated Methodological Expectations for Cochrane Intervention Reviews (MECIR). Risk of bias from the review method process is therefore low. However, analysis of revision risk and adverse events is a major limitation of this review, largely due to the inclusion criteria requiring only randomised controlled trials. Much larger studies are needed to identify events that occur at a frequency of between 1 in 1000 and 1 in 100. This information may be better provided by well‐designed studies from large registry‐based or routinely collected datasets, or by future designed trials that become nested in national registries to monitor this longer‐term follow‐up.
Agreements and disagreements with other studies or reviews
The overall outcomes reported here are somewhat similar to those described in the reviews of Bryant 2005 and Duan 2013, both of which compared conventional TSR to humeral hemiarthroplasty and performed a meta‐analysis using the same four studies (two unpublished and one including rheumatoid arthritis). Both of these reviews concluded that function was superior following TSR compared to humeral hemiarthroplasty.
The previous version of this review included the two published papers focused purely on osteoarthritis (Singh 2010). That version also found that TSR may offer superior function to humeral hemiarthroplasty but, like this updated version of the review, identified that the supporting evidence is of low quality. Singh 2010 included seven randomised controlled trials (RCTs) overall for participants with OA (not RCTA). One of those seven studies was excluded from this version of the review (Kircher 2009; see Excluded studies). Although this updated version of the review has identified an additional 13 studies for inclusion, including nine studies in patients with OA, the new studies are heterogeneous and of low quality. Thus we were unable to draw any new firm conclusions based on these studies.
The remaining published systematic reviews are largely based on low‐quality evidence from non‐randomised studies and pooled estimates from single‐arm studies. Radnay 2007 analysed 1952 patients from 23 studies (only one randomised) and was able to make stronger conclusions in favour of TSR compared to humeral hemiarthroplasty for the outcomes of pain, function, satisfaction, range of motion, and revision surgery. van den Bekerom 2013 performed a systematic review comparing long‐term outcomes of TSR to humeral hemiarthroplasty based on 1958 participants from 19 non‐randomised studies. These researchers found that revision rates were higher after humeral hemiarthroplasty, but that complication rates may be higher after TSR.
A systematic review of 14 studies (both randomised and non‐randomised) failed to determine that any one method of subscapularis management in shoulder replacement surgery was superior to another (Choate 2018). Papadonikolakis 2014 reviewed 43 studies (only one comparative) and found a higher revision rate following TSR using metal‐backed glenoid components versus all‐polyethylene components. Vavken 2013 analysed 1460 participants from eight comparative studies of pegged versus keeled glenoid components for TSR (including four RCTs) and reported no difference in rates of glenoid lucency. The main conclusion was a slightly lower revision rate in favour of pegged components, weighted by the results of one large non‐randomised study.
Erickson 2016 included 3302 participants from 65 studies to determine the effects of humeral inclination on range of movement achieved after reverse total shoulder replacement (RTSR). These researchers found greater external rotation if a 135‐degree inclination was used compared to a 155‐degree inclination, but no other differences. The same group used an overlapping set of 2222 shoulders in 38 studies to conclude that there is a higher rate of scapular notching with the 155‐degree prosthesis (Erickson 2015), which is supported by the RCT included in this review (Gobezie 2019).

Study flow diagram.

Risk of bias summary: review authors' judgements about each risk of bias item for each included study.

Risk of bias graph: review authors' judgements about each risk of bias item presented as percentages across all included studies.

Forest plot of comparison: 1 Conventional stemmed TSR vs stemmed humeral hemiarthroplasty, outcome: 1.1 Pain: visual analogue scale (0 to 10, lower = better).

Forest plot of comparison: 1 Conventional stemmed TSR vs stemmed humeral hemiarthroplasty, outcome: 1.2 Disability/Function: WOOS Index (0 to 100, higher = better). Gartsmann 2000 raw data reported as ASES Shoulder Score.

Forest plot of comparison: 1 Conventional stemmed TSR vs stemmed humeral hemiarthroplasty, outcome: 1.7 Revision, re‐operation, or treatment failure (cumulative counts). Sandow 2013 excluded from the meta‐analysis due to multiple potential sources of bias.

Comparison 1 Conventional stemmed TSR vs stemmed humeral hemiarthroplasty, Outcome 1 Pain: Visual Analogue Scale (0 to 10, lower = better).

Comparison 1 Conventional stemmed TSR vs stemmed humeral hemiarthroplasty, Outcome 2 Disability/Function: WOOS Index (0 to 100, higher = better).
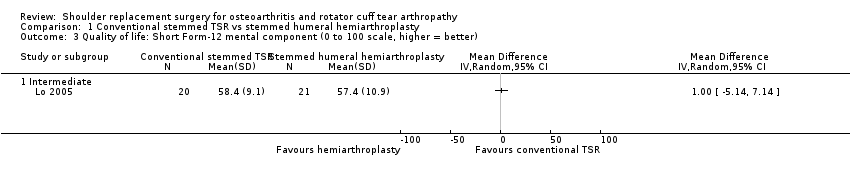
Comparison 1 Conventional stemmed TSR vs stemmed humeral hemiarthroplasty, Outcome 3 Quality of life: Short Form‐12 mental component (0 to 100 scale, higher = better).

Comparison 1 Conventional stemmed TSR vs stemmed humeral hemiarthroplasty, Outcome 4 Quality of life: Short Form‐12 physical component (0 to 100 scale, higher = better).

Comparison 1 Conventional stemmed TSR vs stemmed humeral hemiarthroplasty, Outcome 5 Adverse events: total (cumulative counts).

Comparison 1 Conventional stemmed TSR vs stemmed humeral hemiarthroplasty, Outcome 6 Adverse events: serious (counts).

Comparison 1 Conventional stemmed TSR vs stemmed humeral hemiarthroplasty, Outcome 7 Revision, re‐operation, or treatment failure (cumulative counts).

Comparison 2 Conventional stemmed TSR with cemented polyethylene glenoid component vs uncemented metal‐backed glenoid component, Outcome 1 Revision, re‐operation, or treatment failure (cumulative counts).

Comparison 3 Conventional stemless TSR vs conventional stemmed TSR, Outcome 1 Disability/Function: Constant Murley Score (0 to 100 scale, higher = better).
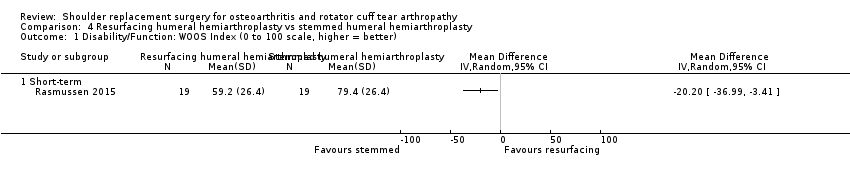
Comparison 4 Resurfacing humeral hemiarthroplasty vs stemmed humeral hemiarthroplasty, Outcome 1 Disability/Function: WOOS Index (0 to 100 scale, higher = better).

Comparison 4 Resurfacing humeral hemiarthroplasty vs stemmed humeral hemiarthroplasty, Outcome 2 Adverse events: total (cumulative counts).

Comparison 5 Conventional stemmed TSR with pegged glenoid component vs keeled glenoid component, Outcome 1 Disability/Function: WOOS Index (0 to 100 scale, higher = better).

Comparison 5 Conventional stemmed TSR with pegged glenoid component vs keeled glenoid component, Outcome 2 Revision, re‐operation, or treatment failure (cumulative counts).

Comparison 5 Conventional stemmed TSR with pegged glenoid component vs keeled glenoid component, Outcome 3 Physician‐evaluated: glenoid lucency grade (0 to 5 grade, higher = worse, reported as count graded ≥ 4).

Comparison 6 Conventional stemmed TSR with cemented humeral component vs uncemented humeral component, Outcome 1 Disability/Function: WOOS Index (0 to 100 scale, higher = better).

Comparison 6 Conventional stemmed TSR with cemented humeral component vs uncemented humeral component, Outcome 2 Quality of life: Short Form‐12 mental component (0 to 100 scale, higher = better).

Comparison 6 Conventional stemmed TSR with cemented humeral component vs uncemented humeral component, Outcome 3 Quality of life: Short Form‐12 physical component (0 to 100 scale, higher = better).
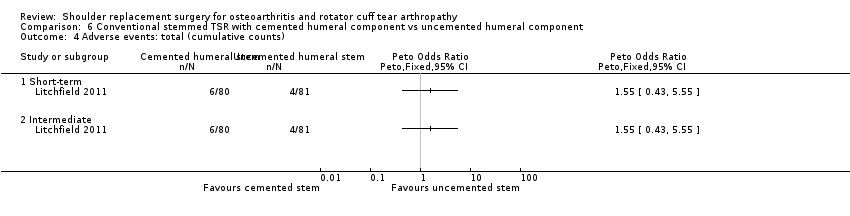
Comparison 6 Conventional stemmed TSR with cemented humeral component vs uncemented humeral component, Outcome 4 Adverse events: total (cumulative counts).

Comparison 6 Conventional stemmed TSR with cemented humeral component vs uncemented humeral component, Outcome 5 Adverse events: serious (counts).
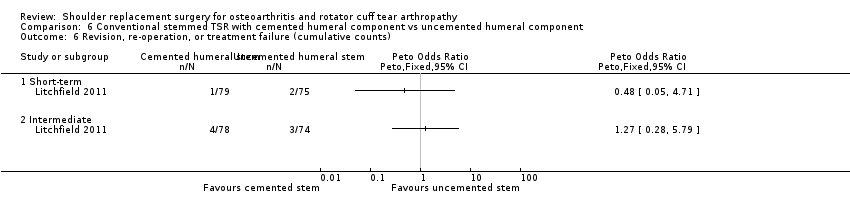
Comparison 6 Conventional stemmed TSR with cemented humeral component vs uncemented humeral component, Outcome 6 Revision, re‐operation, or treatment failure (cumulative counts).

Comparison 7 Conventional stemmed TSR via subscapularis‐sparing approach ("sparing") vs standard approach ("standard"), Outcome 1 Pain: visual analogue scale (0 to 10 scale, lower = better).

Comparison 7 Conventional stemmed TSR via subscapularis‐sparing approach ("sparing") vs standard approach ("standard"), Outcome 2 Disability/Function: ASES Shoulder Score (0 to 100 scale, higher = better).

Comparison 7 Conventional stemmed TSR via subscapularis‐sparing approach ("sparing") vs standard approach ("standard"), Outcome 3 Revision, re‐operation, or treatment failure (cumulative counts).

Comparison 8 Conventional stemmed TSR via a lesser tuberosity osteotomy approach compared to subscapularis tenotomy/peel, Outcome 1 Disability/Function: WOOS Index (0 to 100 scale, higher = better).

Comparison 8 Conventional stemmed TSR via a lesser tuberosity osteotomy approach compared to subscapularis tenotomy/peel, Outcome 2 Adverse events: total (cumulative counts).

Comparison 8 Conventional stemmed TSR via a lesser tuberosity osteotomy approach compared to subscapularis tenotomy/peel, Outcome 3 Revision, re‐operation, or treatment failure (cumulative counts).
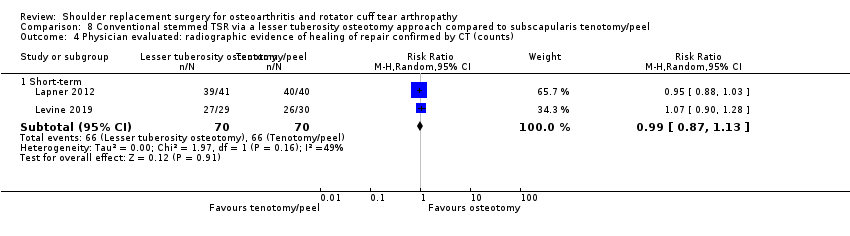
Comparison 8 Conventional stemmed TSR via a lesser tuberosity osteotomy approach compared to subscapularis tenotomy/peel, Outcome 4 Physician evaluated: radiographic evidence of healing of repair confirmed by CT (counts).

Comparison 9 Resurfacing humeral hemiarthroplasty with Copeland implant vs Global C.A.P. implant, Outcome 1 Revision, re‐operation, or treatment failure (cumulative counts).

Comparison 9 Resurfacing humeral hemiarthroplasty with Copeland implant vs Global C.A.P. implant, Outcome 2 Physician‐evaluated: radiostereometric analysis total translation (mm).
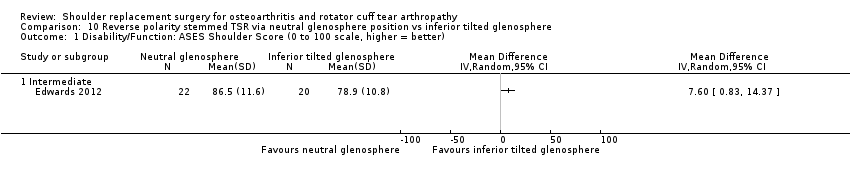
Comparison 10 Reverse polarity stemmed TSR via neutral glenosphere position vs inferior tilted glenosphere, Outcome 1 Disability/Function: ASES Shoulder Score (0 to 100 scale, higher = better).

Comparison 10 Reverse polarity stemmed TSR via neutral glenosphere position vs inferior tilted glenosphere, Outcome 2 Adverse events: total (cumulative counts).

Comparison 10 Reverse polarity stemmed TSR via neutral glenosphere position vs inferior tilted glenosphere, Outcome 3 Physician evaluated: radiographic evidence of glenoid notching (Nerot grade ≥ 1 count).

Comparison 11 Reverse polarity stemmed TSR via bony increased offset vs standard offset for glenoid component, Outcome 1 Disability/Function: Constant Murley Score (0 to 100 scale, higher = better).

Comparison 11 Reverse polarity stemmed TSR via bony increased offset vs standard offset for glenoid component, Outcome 2 Adverse events: total (cumulative counts).

Comparison 12 Reverse polarity stemmed TSR via eccentric glenosphere position vs concentric position, Outcome 1 Pain: visual analogue scale (0 to 10, lower = better).
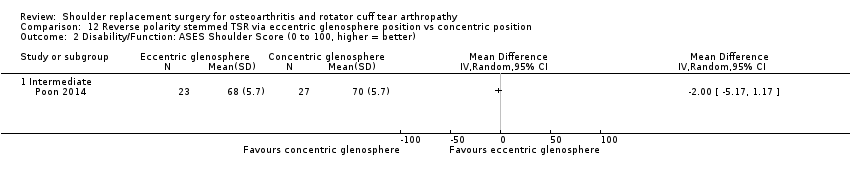
Comparison 12 Reverse polarity stemmed TSR via eccentric glenosphere position vs concentric position, Outcome 2 Disability/Function: ASES Shoulder Score (0 to 100, higher = better).

Comparison 12 Reverse polarity stemmed TSR via eccentric glenosphere position vs concentric position, Outcome 3 Adverse events: total (cumulative counts).

Comparison 12 Reverse polarity stemmed TSR via eccentric glenosphere position vs concentric position, Outcome 4 Revision, re‐operation, or treatment failure (cumulative counts).

Comparison 12 Reverse polarity stemmed TSR via eccentric glenosphere position vs concentric position, Outcome 5 Physician evaluated: radiographic evidence of glenoid notching (Nerot grade ≥ 1 count).

Comparison 13 Reverse polarity stemmed TSR via 135‐degree vs 155‐degree neck‐shaft angle humeral component, Outcome 1 Pain: visual analogue scale (0 to 10, lower = better).
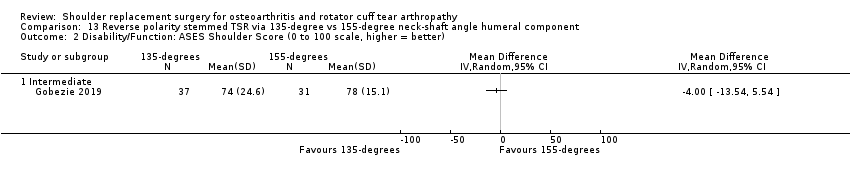
Comparison 13 Reverse polarity stemmed TSR via 135‐degree vs 155‐degree neck‐shaft angle humeral component, Outcome 2 Disability/Function: ASES Shoulder Score (0 to 100 scale, higher = better).

Comparison 13 Reverse polarity stemmed TSR via 135‐degree vs 155‐degree neck‐shaft angle humeral component, Outcome 3 Adverse events: total (cumulative counts).

Comparison 13 Reverse polarity stemmed TSR via 135‐degree vs 155‐degree neck‐shaft angle humeral component, Outcome 4 Revision, re‐operation, or treatment failure (cumulative counts).
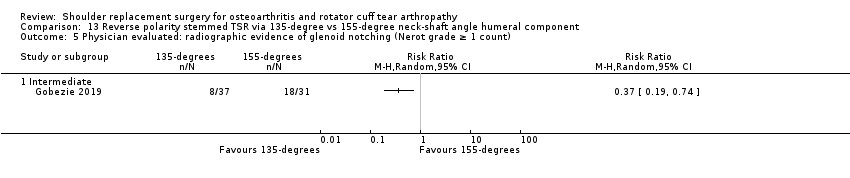
Comparison 13 Reverse polarity stemmed TSR via 135‐degree vs 155‐degree neck‐shaft angle humeral component, Outcome 5 Physician evaluated: radiographic evidence of glenoid notching (Nerot grade ≥ 1 count).
| Conventional stemmed total shoulder replacement compared to stemmed humeral hemiarthroplasty for primary glenohumeral osteoarthritis | ||||||
| Patient or population: adults aged ≥ 18 years with a diagnosis of glenohumeral osteoarthritis who have not responded to non‐operative treatments | ||||||
| Outcomes | Anticipated absolute effects* (95% CI) | Relative effect | № of participants | Quality of the evidence | Comments | |
| Risk with stemmed humeral hemiarthroplasty | Risk with conventional stemmed TSR | |||||
| Pain | Mean pain was 2.78 points | MD 1.49 cm lower | ‐ | 92 | ⊕⊕⊝⊝ | Conventional stemmed TSR may reduce pain slightly compared with stemmed hemiarthroplasty and includes both clinically important and unimportant effectsc Absolute difference 15% lower (1% lower to 29% lower); relative difference 23% lower (2% lower to 44% lower)d |
| Function | Mean function was 72.8 points | MD 10.57 points higher | ‐ | 92 | ⊕⊕⊝⊝ | Conventional stemmed TSR may result in improved function compared with stemmed hemiarthroplasty and includes both clinically important and unimportant effects Absolute difference 11% higher (2% higher to 19% higher); relative difference 32% higher (6% higher to 57% higher).d Number needed to achieve 1 additional beneficial outcome (NNTB) = 6 (95% CI 4 to 30) |
| Participant‐rated global assessment of treatment success | See comment | None of the studies measured or reported this outcome | ||||
| Quality of life assessed with Short Form‐12e | Mean quality of life was 57.4 points | MD 1 higher | ‐ | 41 | ⊕⊕⊝⊝ | Conventional stemmed TSR probably results in little to no difference in quality of life over stemmed hemiarthroplasty but we are uncertain.c Absolute difference 1% higher (5% lower to 7% higher), relative difference 2% higher (9% lower to 13% higher) |
| Adverse events (total): | 286 per 1000 | 143 per 1000 | RR 0.50 | 42 | ⊕⊝⊝⊝ | We are uncertain whether there is any difference in the rate of specific adverse events Absolute difference of 14% fewer events with TSR (25% fewer to 21% more); relative difference 50% fewer (86% fewer to 74% more).c Includes 1 fatal pulmonary embolus in the TSR group |
| Adverse events (serious ‐ resulting in hospitalisation or death) | Only 1 serious adverse event was reported in either arm. Included studies are grossly underpowered for identification of infrequent events | 42 | ⊕⊝⊝⊝ | We are uncertain whether there is any difference in the rate of serious adverse eventsg | ||
| Revision, re‐operation, or treatment failure | 103 per 1000 | 77 per 1000 | RR 0.74 | 125 | ⊕⊝⊝⊝ | We are uncertain whether there is any difference in the rate of revision, re‐operation, or treatment failurec Absolute difference of 2.6% fewer events with TSR (8% fewer to 15% more); relative difference 26% fewer (78% fewer to 146% more) |
| *The risk in the intervention group (and its 95% confidence interval) is based on the assumed risk in the comparison group and the relative effect of the intervention (and its 95% CI). | ||||||
| GRADE Working Group grades of evidence. | ||||||
| aDowngraded one level for risk of bias (at least one trial at high or unclear risk of bias). bDowngraded one level for imprecision: wide confidence intervals due to small sample size from few studies. Confidence intervals include both an important and an unimportant effect. cDowngraded two levels for serious imprecision: very wide confidence intervals. Sample size from few studies grossly underpowered for analysis of infrequent events. dTotal adverse events; includes both serious adverse events and local/specific adverse events not requiring further surgery (i.e. further operations are counted in the revision/re‐operation section only). Specific adverse events included infections, dislocations, fractures, and rotator cuff failures. eMental component score. fNumbers needed to achieve on additional beneficial or harmful outcome (NNTB/NNTH) were not calculated in the absence of a clinically important difference. gRelative changes calculated relative to baseline in control group (i.e. absolute change (mean difference) divided by mean at baseline in the placebo group from Lo 2005 (values were 6.52 points on 0 to 10‐point VAS Pain Scale; 33.5 points on 0 to 100‐point WOOS Score; 55.5 points on 100‐point SF‐36 mental component score; and 29.5 points on 100‐point SF‐36 physical component score). Absolute change calculated as mean difference divided by scale of the instrument, expressed as percentage. | ||||||
| Comparison | Study ID | Outcome | Measure | Timepoint | Arm 1 | Arm 2 | Notes | ||||
| Description | n | Outcome | Description | n | Outcome | ||||||
| Conventional TSR vs stemmed hemiarthroplasty | Function | UCLA Shoulder Rating Scale (0 to 35 scale, higher = better, reported as mean ± SD) | Intermediate | TSR | 27 | 27.4 ± 4.9 | Stemmed hemiarthroplasty | 24 | 23.2 ± 5.9 | P = 0.008 | |
| Pain | McGill Pain Questionnaire (lower = better, reported as mean ± SD) | Intermediate | TSR | 20 | 0.9 ± 1.4 | Stemmed hemiarthroplasty | 21 | 2.7 ± 6.8 | Scale used is unclear. Original questionnaire reference uses 0 to 78. This is incompatible with the values in this study | ||
| Function | ASES Shoulder Score (0 to 100 scale, higher = better, reported as mean ± SD) | Intermediate | TSR | 20 | 91.1 ± 14.3 | Stemmed hemiarthroplasty | 21 | 83.1 ± 25.6 | P = 0.25 | ||
| UCLA Shoulder Rating Scale (0 to 35 scale, higher = better, reported as mean ± SD) | Intermediate | TSR | 20 | 26.7 ± 3.8 | Stemmed hemiarthroplasty | 21 | 24.2 ± 5.0 | P = 0.10 | |||
| Constant Murley Score (0 to 100 scale, higher = better, reported as mean ± SD) | Intermediate | TSR | 20 | 70.8 ± 17.2 | Stemmed hemiarthroplasty | 21 | 67.1 ± 19.6 | P = 0.55 | |||
| Pain | Visual analogue scale (0 to 10 scale, higher = worse, reported as median and range) | Short‐term | TSR | 16 | 1 (0 to 2.8) | Stemmed hemiarthroplasty | 13 | 2 (0 to 8.8) | P < 0.05 | ||
| Intermediate | TSR | 11 | 0.2 (0 to 4) | Stemmed hemiarthroplasty | 7 | 4.6 (0.4 to 8.5) | P < 0.05 | ||||
| Function | UCLA Shoulder Rating Scale (0 to 35 scale, higher = better, reported as median and range) | Short‐term | TSR | 18 | 30 (21 to 35) | Stemmed hemiarthroplasty | 13 | 29 (12 to 33) | P < 0.05 | ||
| Intermediate | TSR | 11 | 33 (24 to 34) | Stemmed hemiarthroplasty | 6 | 18.5 (10 to 25) | P < 0.05 | ||||
| Constant Murley Score (0 to 100 scale, higher = better, reported as median and range) | Short‐term | TSR | 15 | 68 (48 to 89) | Stemmed hemiarthroplasty | 10 | 59.5 (30 to 85) | ||||
| Intermediate | TSR | 6 | 77 (67 to 95) | Stemmed hemiarthroplasty | 4 | 54.5 (43 to 59) | P < 0.05 | ||||
| Humeral head resurfacing vs stemmed hemiarthroplasty | Pain | Subdomain of Constant Murley Score (0, 5, 10, 15 scale, higher = better, reported as mean and range) | Intermediate | Humeral head resurfacing | 19 | 11.1 (0 to 15) | Stemmed hemiarthroplasty | 19 | 8.0 (0 to 15) | MD 3.2 (95% CI 0.1 to 6.2), P = 0.04 | |
| Function | Constant Murley Score (0 to 100 scale, higher = better, reported as mean and range) | Short‐term | Humeral head resurfacing | 19 | 48.9 (6 to 80) | Stemmed hemiarthroplasty | 19 | 59.1 (0 to 88) | P = 0.14 | ||
| Physician evaluated: operating time | In minutes (continuous scale, lower presumed better, reported as mean and range) | Short‐term | Humeral head resurfacing | 20 | 52 (34 to 80) | Stemmed hemiarthroplasty | 20 | 80 (56 to 103) | P < 0.001 | ||
| Conventional stemless TSR vs conventional stemmed TSR | Pain | Subdomain of Constant Murley Score (0, 5, 10, 15 scale, higher = better, reported as mean ± SD) | Intermediate | Stemless TSR | 15 | 10.9 ± 4.4 | Stemmed TSR | 18 | 13.6 ± 2.9 | P = 0.136 | |
| Long‐term | Stemless TSR | 14 | 12.7 ± 2.4 | Stemmed TSR | 15 | 12.4 ± 2.1 | P = 0.590 | ||||
| Conventional TSR with cemented polyethylene glenoid component vs uncemented metal‐backed glenoid component | Pain | Subdomain of Constant Murley Score (0, 5, 10, 15 scale, higher = better, reported as "average" and range) | Intermediate | Cemented glenoid | 20 | 12.5 (4 to 15) | Uncemented glenoid | 20 | 12 (5 to 15) | ||
| Long‐term | Cemented glenoid | 17 | 12 (0 to 15) | Uncemented glenoid | 18 | 13 (3 to 15) | |||||
| Function | Constant Murley Score (0 to 100, higher = better, reported as average and range) | Intermediate | Cemented glenoid | 20 | 67 (6 to 89) | Uncemented glenoid | 20 | 75 (17 to 89) | |||
| Long‐term | Cemented glenoid | 17 | 68 (6 to 92 | Uncemented glenoid | 18 | 73 (42 to 89) | |||||
| Physician evaluated: Glenoid lucency | Novel 4‐level grading system described but reported only as dichotomous outcome | Long‐term | Cemented glenoid | 20 | 17 | Uncemented glenoid | 20 | 5 | Progression over time observed in only 4 cases in the uncemented group. None in the cemented group | ||
| Conventional TSR with pegged glenoid component vs keeled glenoid component | Pain | Visual analogue scale (0 to 10, lower = better, reported as mean only) | Intermediated | Pegged | 10 | 0.6 | Keeled | 10 | 0.6 | ||
| Function | ASES Shoulder Score (0 to 100 scale, higher = better, reported as mean only) | Intermediate | Pegged | 10 | 78 | Keeled | 10 | 84 | |||
| Constant Murley Score (0 to 100 scale, higher = better, reported as mean only) | Intermediate | Pegged | 10 | 65 | Keeled | 10 | 62 | ||||
| Function | ASES Shoulder Score (0 to 100 scale, higher = better, reported as mean with exact P value) | Long‐term | Pegged | 16 | 68 | Keeled | 22 | 67 | P = 0.635 WOOS Index reported in main analyses | ||
| Constant Murley Score (0 to 100 scale, higher = better, reported as mean with exact P value) | Long‐term | Pegged | 16 | 59.7 | Keeled | 22 | 58.9 | P = 0.728 WOOS Index reported in main analyses | |||
| Single‐assessment numerical evaluation (0 to 100%, higher = better, reported as mean only) | Long‐term | Pegged | 16 | 58.7 | Keeled | 22 | 66.6 | P = 0.247 WOOS Index already included in function analysis | |||
| Function | Constant Murley Score (0 to 100 scale, higher = better, reported as mean only) | Intermediate | Pegged | 14 | 70 | Keeled | 12 | 70 | |||
| Subjective shoulder value (0 to 100%, higher = better, reported as mean only) | Intermediate | Pegged | 14 | 80 | Keeled | 12 | 80 | ||||
| Function | WOOS Index (0 to 100 scale, reversed from normal here ‐ higher = worse, reported as median only) | Short‐term | Pegged | 5 | 7.15 | Keeled | 6 | 34.7 | Authors have used WOOS Index in opposite direction to the usual convention | ||
| Intermediate | Pegged | 4 | 22.3 | Keeled | 5 | 18.5 | |||||
| ASES Shoulder Score (0 to 100 scale, higher = better, reported as median only) | Short‐term | Pegged | 5 | 97.1 | Keeled | 6 | 72.5 | ||||
| Intermediate | Pegged | 4 | 96.4 | Keeled | 5 | 73.5 | |||||
| Simple Shoulder Test Score (0 to 12, higher = better, reported as median only) | Short‐term | Pegged | 5 | 11.0 | Keeled | 6 | 7.0 | ||||
| Intermediate | Pegged | 4 | 10.5 | Keeled | 5 | 6.0 | |||||
| Physician evaluated: radiostereometric analysis (RSA) | Coronal plane translation (mm, lower = better, reported as median only) | Short‐term | Pegged | 5 | 0.267 | Keeled | 6 | 1.518 | P < 0.05 | ||
| Intermediate | Pegged | 4 | 0.235 | Keeled | 5 | 0.990 | P < 0.05 | ||||
| Coronal plane rotation (degrees, lower = better, reported as median only) | Short‐term | Pegged | 5 | 0.601 | Keeled | 6 | 0.307 | ||||
| Intermediate | Pegged | 4 | 1.074 | Keeled | 5 | ‐0.624 | |||||
| Conventional TSR with cemented stemmed humeral component vs uncemented stemmed humeral component | Function | ASES Shoulder Score (0 to 100 scale, higher = better, reported as mean ± SD) | Short‐term | Cemented | 78 | 70.2 ± 10.3 | Uncemented | 74 | 66.2 ± 13.9 | P = 0.09 | |
| Intermediate | Cemented | 78 | 69.2 ± 13.3 | Uncemented | 74 | 64.74 ± 15.7 | P = 0.2 | ||||
| MACTAR Score (0 to 500, lower = better) | Short‐term | Cemented | 78 | 50.6 ± 59.1 | Uncemented | 74 | 70.1 ± 74.1 | P = 0.19 | |||
| Intermediate | Cemented | 78 | 56.1 ± 76.6 | Uncemented | 74 | 69.2 ± 77.7 | P = 0.49 | ||||
| Conventional stemmed TSR via lesser tuberosity osteotomy approach vs subscapularis tenotomy/peel | Function | ASES Shoulder Score (0 to 100 scale, higher = better, reported as mean ± SD) | Short‐term | Osteotomy | 36 | 77.1 ± 23.7 | Peel | 37 | 81.3 ± 18.7 | ||
| Intermediate | Osteotomy | 36 | 79.4 ± 24.6 | Peel | 37 | 83.3 ± 19.0 | |||||
| Physician evaluated: fatty infiltration of rotator cuff muscles | Goutallier grade (0 to 4 grades, higher = worse, reported as mean ± SD) | Short‐term | Osteotomy | 41 | 0.90 ± 0.89 | Peel | 41 | 0.95 ± 0.85 | |||
| Pain | Visual analogue scale (0 to 10 scale, higher = worse, reported as mean) | Short‐term | Osteotomy | 29 | 1.8 | Tenotomy | 30 | 1.9 | Inconsistencies between text and figures. Numbers reported here are from the text | ||
| Function | ASES Shoulder Score (0 to 100 scale, higher = better, reported as mean) | Short‐term | Osteotomy | 29 | 75.6 | Tenotomy | 30 | 74.6 | |||
| Simple Shoulder Test Score (0 to 10 scale, higher = better, reported as mean) | Short‐term | Osteotomy | 29 | 9.1 | Tenotomy | 30 | 7.6 | ||||
| Quality of life | Short Form‐36 (0 to 100 scale, higher = better, reported as mean) | Short‐term | Osteotomy | 29 | 71.1 | Tenotomy | 30 | 64.9 | |||
| Operative time | Minutes (mean, lower better) | Short‐term | Osteotomy | 29 | 152.7 | Tenotomy | 30 | 129.3 | |||
| Humeral head resurfacing with Copeland implant vs Global C.A.P. implant | Function | WOOS Index (raw scale 0 to 1900, lower = better, reported in box plots as median plus 10th/25th/75th/90th centiles) ‐ presented here as median (IQR) | Short‐term | Copeland | 10 | 298 (81 to 788) | Global C.A.P. | 15 | 383 (115 to 822) | ||
| Intermediate | Copeland | 10 | 128 (53 to 550) | Global C.A.P. | 15 | 294 (111 to 477) | |||||
| Constant Murley Score (0 to 100 scale, higher = better, reported in box plots as median plus 10th/25th/75th/90th centiles) ‐ presented here as median (IQR) | Short‐term | Copeland | 10 | 71.6 (59.6 to 87.7) | Global C.A.P. | 15 | 72.7 (58.8 to 88.2) | ||||
| Intermediate | Copeland | 10 | 76.9 (61.1 to 81.2) | Global C.A.P. | 15 | 72.6 (64.6 to 85.7) | |||||
| Physician evaluated: bone mineral density of humeral head | Measured in g/cm³ (continuous scale, higher = better, reported in box plots as median plus 10th/25th/75th/90th centiles) ‐ presented here as median (IQR) | Short‐term | Copeland | 9 | 0.81 (0.62 to 0.97) | Global C.A.P. | 15 | 0.83 (0.60 to 1.04) | |||
| Intermediate | Copeland | 9 | 0.59 (0.50 to 0.65) | Global C.A.P. | 15 | 0.57 (0.47 to 0.73) | |||||
| Reverse polarity TSR with neutral glenosphere vs inferior tilted glenosphere | Function | Constant Murley Score (0 to 100 scale, higher = better, reported as mean ± SD) | Intermediate | Neutral | 22 | 71.4 ± 14.9 | Tilted | 20 | 63.6 ± 12.3 | P = 0.136 ASES Shoulder Score reported in main analyses | |
| Age‐ and gender‐adjusted Constant Murley Score (0 to 100 scale, higher = better, reported as mean ± SD) | Intermediate | Neutral | 22 | 92.6 ± 18.9 | Tilted | 20 | 87.7 ± 23.6 | P = 0.129 ASES Shoulder Score reported in main analyses | |||
| Reverse polarity TSR with eccentric glenosphere position vs concentric position | Function | Oxford Shoulder Score (0 to 48 scale, higher = better, reported as mean with range and P value ‐ back‐translated to SD) | Intermediate | Eccentric | 23 | 35 ± 10.5 | Concentric | 27 | 38 ± 10.5 | P = 0.32 | |
| Reverse polarity TSR with bony increased offset vs standard offset for glenoid component | Pain | Subdomain of Constant Murley Score (0, 5, 10, 15 scale, higher = better, reported as mean ± SD) | Intermediate | BIO | 16 | 12.7 ± 2.8 | STD | 15 | 12.7 ± 3.2 | Not included in meta‐analysis: categorical scale may not behave in same manner as a VAS or NPS | |
| Function | Age‐ and gender‐adjusted Constant Murley Score (0 to 100 scale, higher = better, reported as mean ± SD) | Intermediate | BIO | 16 | 83.3 ± 23.4 | STD | 15 | 89.4 ± 20.8 | Study also reports unadjusted score | ||
| ADLER Score (0 to 30 scale, higher = better, reported as mean ± SD) | Intermediate | BIO | 16 | 25.7 ± 6.9 | STD | 15 | 26.1 ± 5.0 | "Activities of Daily Living requiring External Rotation" | |||
| DASH Score (0 to 100 scale, higher = worse, reported as mean ± SD) | Intermediate | BIO | 16 | 40.9 ± 23.7 | STD | 15 | 34.2 ± 20.2 | ||||
| Reverse polarity TSR with 135° humeral neck‐shaft angle vs 155° humeral neck‐shaft angle | Function | SANE Score (0 to 100 scale, higher = better, reported as mean ± SD) | Intermediate | 135° neck‐shaft angle | 37 | 74 ± 24.4 | 155° neck‐shaft angle | 31 | 76 ± 16.8 | ||
| Simple Shoulder Test Score (0 to 10 scale, higher = better, reported as mean ± SD) | Intermediate | 135° neck‐shaft angle | 37 | 8 ± 3.0 | 155° neck‐shaft angle | 31 | 7 ± 2.2 | ||||
| ADLER: Activities of Daily Living and External Rotation. ASES: American Shoulder and Elbow Surgeons Scale. DASH: Disability of the Arm, Shoulder, and Hand questionnaire. IQR: interquartile range. MACTAR: McMaster Toronto Arthritis patient preference questionnaire. RSA: radiostereometric analysis. SANE: single‐assessment numerical evaluation. SD: standard deviation. TSR: total shoulder replacement. WOOS: Western Ontario Osteoarthritis of the Shoulder Index. | |||||||||||
| Outcome or subgroup title | No. of studies | No. of participants | Statistical method | Effect size |
| 1 Pain: Visual Analogue Scale (0 to 10, lower = better) Show forest plot | 2 | Mean Difference (IV, Random, 95% CI) | Subtotals only | |
| 1.1 Intermediate | 2 | 92 | Mean Difference (IV, Random, 95% CI) | ‐1.49 [‐2.88, ‐0.10] |
| 2 Disability/Function: WOOS Index (0 to 100, higher = better) Show forest plot | 2 | Mean Difference (IV, Random, 95% CI) | Subtotals only | |
| 2.1 Intermediate | 2 | 92 | Mean Difference (IV, Random, 95% CI) | 10.57 [2.11, 19.02] |
| 3 Quality of life: Short Form‐12 mental component (0 to 100 scale, higher = better) Show forest plot | 1 | Mean Difference (IV, Random, 95% CI) | Totals not selected | |
| 3.1 Intermediate | 1 | Mean Difference (IV, Random, 95% CI) | 0.0 [0.0, 0.0] | |
| 4 Quality of life: Short Form‐12 physical component (0 to 100 scale, higher = better) Show forest plot | 1 | Mean Difference (IV, Random, 95% CI) | Totals not selected | |
| 4.1 Intermediate | 1 | Mean Difference (IV, Random, 95% CI) | 0.0 [0.0, 0.0] | |
| 5 Adverse events: total (cumulative counts) Show forest plot | 2 | Risk Ratio (M‐H, Random, 95% CI) | Subtotals only | |
| 5.1 Short‐term | 2 | 75 | Risk Ratio (M‐H, Random, 95% CI) | 1.60 [0.36, 7.05] |
| 5.2 Intermediate | 1 | 42 | Risk Ratio (M‐H, Random, 95% CI) | 0.5 [0.14, 1.74] |
| 6 Adverse events: serious (counts) Show forest plot | 1 | Peto Odds Ratio (Peto, Fixed, 95% CI) | Totals not selected | |
| 6.1 Short‐term | 1 | Peto Odds Ratio (Peto, Fixed, 95% CI) | 0.0 [0.0, 0.0] | |
| 7 Revision, re‐operation, or treatment failure (cumulative counts) Show forest plot | 2 | Risk Ratio (M‐H, Random, 95% CI) | Subtotals only | |
| 7.1 Intermediate | 2 | 92 | Risk Ratio (M‐H, Random, 95% CI) | 1.29 [0.30, 5.53] |
| 7.2 Long‐term | 1 | 51 | Risk Ratio (M‐H, Random, 95% CI) | 0.89 [0.20, 4.00] |
| Outcome or subgroup title | No. of studies | No. of participants | Statistical method | Effect size |
| 1 Revision, re‐operation, or treatment failure (cumulative counts) Show forest plot | 1 | Peto Odds Ratio (Peto, Fixed, 95% CI) | Totals not selected | |
| 1.1 Intermediate | 1 | Peto Odds Ratio (Peto, Fixed, 95% CI) | 0.0 [0.0, 0.0] | |
| 1.2 Long‐term | 1 | Peto Odds Ratio (Peto, Fixed, 95% CI) | 0.0 [0.0, 0.0] | |
| Outcome or subgroup title | No. of studies | No. of participants | Statistical method | Effect size |
| 1 Disability/Function: Constant Murley Score (0 to 100 scale, higher = better) Show forest plot | 1 | Mean Difference (IV, Random, 95% CI) | Totals not selected | |
| 1.1 Intermediate | 1 | Mean Difference (IV, Random, 95% CI) | 0.0 [0.0, 0.0] | |
| 1.2 Long‐term | 1 | Mean Difference (IV, Random, 95% CI) | 0.0 [0.0, 0.0] | |
| Outcome or subgroup title | No. of studies | No. of participants | Statistical method | Effect size |
| 1 Disability/Function: WOOS Index (0 to 100 scale, higher = better) Show forest plot | 1 | Mean Difference (IV, Random, 95% CI) | Totals not selected | |
| 1.1 Short‐term | 1 | Mean Difference (IV, Random, 95% CI) | 0.0 [0.0, 0.0] | |
| 2 Adverse events: total (cumulative counts) Show forest plot | 1 | Risk Ratio (M‐H, Random, 95% CI) | Totals not selected | |
| 2.1 Short‐term | 1 | Risk Ratio (M‐H, Random, 95% CI) | 0.0 [0.0, 0.0] | |
| Outcome or subgroup title | No. of studies | No. of participants | Statistical method | Effect size |
| 1 Disability/Function: WOOS Index (0 to 100 scale, higher = better) Show forest plot | 1 | Mean Difference (IV, Random, 95% CI) | Totals not selected | |
| 1.1 Long‐term | 1 | Mean Difference (IV, Random, 95% CI) | 0.0 [0.0, 0.0] | |
| 2 Revision, re‐operation, or treatment failure (cumulative counts) Show forest plot | 2 | Peto Odds Ratio (Peto, Fixed, 95% CI) | Subtotals only | |
| 2.1 Intermediate | 2 | 80 | Peto Odds Ratio (Peto, Fixed, 95% CI) | 0.35 [0.05, 2.56] |
| 2.2 Long‐term | 1 | 59 | Peto Odds Ratio (Peto, Fixed, 95% CI) | 0.33 [0.08, 1.46] |
| 3 Physician‐evaluated: glenoid lucency grade (0 to 5 grade, higher = worse, reported as count graded ≥ 4) Show forest plot | 2 | Risk Ratio (M‐H, Random, 95% CI) | Subtotals only | |
| 3.1 Intermediate | 2 | 71 | Risk Ratio (M‐H, Random, 95% CI) | 0.38 [0.02, 8.83] |
| 3.2 Long‐term | 1 | 38 | Risk Ratio (M‐H, Random, 95% CI) | 1.20 [0.55, 2.63] |
| Outcome or subgroup title | No. of studies | No. of participants | Statistical method | Effect size |
| 1 Disability/Function: WOOS Index (0 to 100 scale, higher = better) Show forest plot | 1 | Mean Difference (IV, Random, 95% CI) | Totals not selected | |
| 1.1 Short‐term | 1 | Mean Difference (IV, Random, 95% CI) | 0.0 [0.0, 0.0] | |
| 1.2 Intermediate | 1 | Mean Difference (IV, Random, 95% CI) | 0.0 [0.0, 0.0] | |
| 2 Quality of life: Short Form‐12 mental component (0 to 100 scale, higher = better) Show forest plot | 1 | Mean Difference (IV, Random, 95% CI) | Totals not selected | |
| 2.1 Short‐term | 1 | Mean Difference (IV, Random, 95% CI) | 0.0 [0.0, 0.0] | |
| 2.2 Intermediate | 1 | Mean Difference (IV, Random, 95% CI) | 0.0 [0.0, 0.0] | |
| 3 Quality of life: Short Form‐12 physical component (0 to 100 scale, higher = better) Show forest plot | 1 | Mean Difference (IV, Random, 95% CI) | Totals not selected | |
| 3.1 Short‐term | 1 | Mean Difference (IV, Random, 95% CI) | 0.0 [0.0, 0.0] | |
| 3.2 Intermediate | 1 | Mean Difference (IV, Random, 95% CI) | 0.0 [0.0, 0.0] | |
| 4 Adverse events: total (cumulative counts) Show forest plot | 1 | Peto Odds Ratio (Peto, Fixed, 95% CI) | Totals not selected | |
| 4.1 Short‐term | 1 | Peto Odds Ratio (Peto, Fixed, 95% CI) | 0.0 [0.0, 0.0] | |
| 4.2 Intermediate | 1 | Peto Odds Ratio (Peto, Fixed, 95% CI) | 0.0 [0.0, 0.0] | |
| 5 Adverse events: serious (counts) Show forest plot | 1 | Peto Odds Ratio (Peto, Fixed, 95% CI) | Totals not selected | |
| 5.1 Short‐term | 1 | Peto Odds Ratio (Peto, Fixed, 95% CI) | 0.0 [0.0, 0.0] | |
| 6 Revision, re‐operation, or treatment failure (cumulative counts) Show forest plot | 1 | Peto Odds Ratio (Peto, Fixed, 95% CI) | Totals not selected | |
| 6.1 Short‐term | 1 | Peto Odds Ratio (Peto, Fixed, 95% CI) | 0.0 [0.0, 0.0] | |
| 6.2 Intermediate | 1 | Peto Odds Ratio (Peto, Fixed, 95% CI) | 0.0 [0.0, 0.0] | |
| Outcome or subgroup title | No. of studies | No. of participants | Statistical method | Effect size |
| 1 Pain: visual analogue scale (0 to 10 scale, lower = better) Show forest plot | 1 | Mean Difference (IV, Random, 95% CI) | Totals not selected | |
| 1.1 Intermediate | 1 | Mean Difference (IV, Random, 95% CI) | 0.0 [0.0, 0.0] | |
| 2 Disability/Function: ASES Shoulder Score (0 to 100 scale, higher = better) Show forest plot | 1 | Mean Difference (IV, Random, 95% CI) | Totals not selected | |
| 2.1 Intermediate | 1 | Mean Difference (IV, Random, 95% CI) | 0.0 [0.0, 0.0] | |
| 3 Revision, re‐operation, or treatment failure (cumulative counts) Show forest plot | 1 | Peto Odds Ratio (Peto, Fixed, 95% CI) | Totals not selected | |
| 3.1 Short‐term | 1 | Peto Odds Ratio (Peto, Fixed, 95% CI) | 0.0 [0.0, 0.0] | |
| Outcome or subgroup title | No. of studies | No. of participants | Statistical method | Effect size |
| 1 Disability/Function: WOOS Index (0 to 100 scale, higher = better) Show forest plot | 1 | Mean Difference (IV, Random, 95% CI) | Totals not selected | |
| 1.1 Short‐term | 1 | Mean Difference (IV, Random, 95% CI) | 0.0 [0.0, 0.0] | |
| 1.2 Intermediate | 1 | Mean Difference (IV, Random, 95% CI) | 0.0 [0.0, 0.0] | |
| 2 Adverse events: total (cumulative counts) Show forest plot | 1 | Peto Odds Ratio (Peto, Fixed, 95% CI) | Subtotals only | |
| 2.1 Short‐term | 1 | 59 | Peto Odds Ratio (Peto, Fixed, 95% CI) | 3.50 [0.57, 21.54] |
| 3 Revision, re‐operation, or treatment failure (cumulative counts) Show forest plot | 2 | Peto Odds Ratio (Peto, Fixed, 95% CI) | Totals not selected | |
| 3.1 Short‐term | 1 | Peto Odds Ratio (Peto, Fixed, 95% CI) | 0.0 [0.0, 0.0] | |
| 3.2 Intermediate | 1 | Peto Odds Ratio (Peto, Fixed, 95% CI) | 0.0 [0.0, 0.0] | |
| 4 Physician evaluated: radiographic evidence of healing of repair confirmed by CT (counts) Show forest plot | 2 | Risk Ratio (M‐H, Random, 95% CI) | Subtotals only | |
| 4.1 Short‐term | 2 | 140 | Risk Ratio (M‐H, Random, 95% CI) | 0.99 [0.87, 1.13] |
| Outcome or subgroup title | No. of studies | No. of participants | Statistical method | Effect size |
| 1 Revision, re‐operation, or treatment failure (cumulative counts) Show forest plot | 1 | Risk Ratio (M‐H, Random, 95% CI) | Totals not selected | |
| 1.1 Intermediate | 1 | Risk Ratio (M‐H, Random, 95% CI) | 0.0 [0.0, 0.0] | |
| 2 Physician‐evaluated: radiostereometric analysis total translation (mm) Show forest plot | 1 | Mean Difference (IV, Random, 95% CI) | Totals not selected | |
| 2.1 Intermediate | 1 | Mean Difference (IV, Random, 95% CI) | 0.0 [0.0, 0.0] | |
| Outcome or subgroup title | No. of studies | No. of participants | Statistical method | Effect size |
| 1 Disability/Function: ASES Shoulder Score (0 to 100 scale, higher = better) Show forest plot | 1 | Mean Difference (IV, Random, 95% CI) | Totals not selected | |
| 1.1 Intermediate | 1 | Mean Difference (IV, Random, 95% CI) | 0.0 [0.0, 0.0] | |
| 2 Adverse events: total (cumulative counts) Show forest plot | 1 | Peto Odds Ratio (Peto, Fixed, 95% CI) | Totals not selected | |
| 2.1 Short‐term | 1 | Peto Odds Ratio (Peto, Fixed, 95% CI) | 0.0 [0.0, 0.0] | |
| 3 Physician evaluated: radiographic evidence of glenoid notching (Nerot grade ≥ 1 count) Show forest plot | 1 | Risk Ratio (M‐H, Random, 95% CI) | Totals not selected | |
| 3.1 Intermediate | 1 | Risk Ratio (M‐H, Random, 95% CI) | 0.0 [0.0, 0.0] | |
| Outcome or subgroup title | No. of studies | No. of participants | Statistical method | Effect size |
| 1 Disability/Function: Constant Murley Score (0 to 100 scale, higher = better) Show forest plot | 1 | Mean Difference (IV, Random, 95% CI) | Totals not selected | |
| 1.1 Intermediate | 1 | Mean Difference (IV, Random, 95% CI) | 0.0 [0.0, 0.0] | |
| 2 Adverse events: total (cumulative counts) Show forest plot | 1 | Risk Ratio (M‐H, Random, 95% CI) | Totals not selected | |
| 2.1 Intermediate | 1 | Risk Ratio (M‐H, Random, 95% CI) | 0.0 [0.0, 0.0] | |
| Outcome or subgroup title | No. of studies | No. of participants | Statistical method | Effect size |
| 1 Pain: visual analogue scale (0 to 10, lower = better) Show forest plot | 1 | Mean Difference (IV, Random, 95% CI) | Totals not selected | |
| 1.1 Intermediate | 1 | Mean Difference (IV, Random, 95% CI) | 0.0 [0.0, 0.0] | |
| 2 Disability/Function: ASES Shoulder Score (0 to 100, higher = better) Show forest plot | 1 | Mean Difference (IV, Random, 95% CI) | Totals not selected | |
| 2.1 Intermediate | 1 | Mean Difference (IV, Random, 95% CI) | 0.0 [0.0, 0.0] | |
| 3 Adverse events: total (cumulative counts) Show forest plot | 1 | Peto Odds Ratio (Peto, Fixed, 95% CI) | Totals not selected | |
| 3.1 Intermediate | 1 | Peto Odds Ratio (Peto, Fixed, 95% CI) | 0.0 [0.0, 0.0] | |
| 4 Revision, re‐operation, or treatment failure (cumulative counts) Show forest plot | 1 | Peto Odds Ratio (Peto, Fixed, 95% CI) | Totals not selected | |
| 4.1 Intermediate | 1 | Peto Odds Ratio (Peto, Fixed, 95% CI) | 0.0 [0.0, 0.0] | |
| 5 Physician evaluated: radiographic evidence of glenoid notching (Nerot grade ≥ 1 count) Show forest plot | 1 | Risk Ratio (M‐H, Random, 95% CI) | Totals not selected | |
| 5.1 Intermediate | 1 | Risk Ratio (M‐H, Random, 95% CI) | 0.0 [0.0, 0.0] | |
| Outcome or subgroup title | No. of studies | No. of participants | Statistical method | Effect size |
| 1 Pain: visual analogue scale (0 to 10, lower = better) Show forest plot | 1 | Mean Difference (IV, Random, 95% CI) | Totals not selected | |
| 1.1 Intermediate | 1 | Mean Difference (IV, Random, 95% CI) | 0.0 [0.0, 0.0] | |
| 2 Disability/Function: ASES Shoulder Score (0 to 100 scale, higher = better) Show forest plot | 1 | Mean Difference (IV, Random, 95% CI) | Totals not selected | |
| 2.1 Intermediate | 1 | Mean Difference (IV, Random, 95% CI) | 0.0 [0.0, 0.0] | |
| 3 Adverse events: total (cumulative counts) Show forest plot | 1 | Risk Ratio (M‐H, Random, 95% CI) | Totals not selected | |
| 3.1 Intermediate | 1 | Risk Ratio (M‐H, Random, 95% CI) | 0.0 [0.0, 0.0] | |
| 4 Revision, re‐operation, or treatment failure (cumulative counts) Show forest plot | 1 | Risk Ratio (M‐H, Random, 95% CI) | Totals not selected | |
| 4.1 Intermediate | 1 | Risk Ratio (M‐H, Random, 95% CI) | 0.0 [0.0, 0.0] | |
| 5 Physician evaluated: radiographic evidence of glenoid notching (Nerot grade ≥ 1 count) Show forest plot | 1 | Risk Ratio (M‐H, Random, 95% CI) | Totals not selected | |
| 5.1 Intermediate | 1 | Risk Ratio (M‐H, Random, 95% CI) | 0.0 [0.0, 0.0] | |