Efectos de la administración oral de suplementos de vitamina D en el crecimiento lineal y otros desenlaces de salud en niños menores de cinco años
Resumen
Antecedentes
La vitamina D es una hormona secosteroidea que es importante por su papel en la homeostasis del calcio para mantener la salud del esqueleto. El retraso en el crecimiento lineal y el retraso en el crecimiento siguen siendo indicadores generalizados de un estado de nutrición deficiente en los lactantes y los niños menores de cinco años en todo el mundo, y el bajo nivel de vitamina D se ha vinculado a un crecimiento deficiente. No obstante, no se ha revisado de manera sistemática la evidencia existente sobre los efectos de la administración de suplementos de vitamina D en el crecimiento lineal y otros desenlaces de salud en lactantes y niños menores de cinco años.
Objetivos
Evaluar los efectos de la administración oral de suplementos de vitamina D en el crecimiento lineal y otros desenlaces de salud en lactantes y niños menores de cinco años.
Métodos de búsqueda
En diciembre de 2019, se hicieron búsquedas en CENTRAL, PubMed, Embase, en otras 14 bases de datos electrónicas y en dos registros de ensayos. También se buscaron ensayos pertinentes en las listas de referencias de publicaciones relevantes y se estableció contacto con organizaciones y autores clave para obtener información sobre ensayos pertinentes en curso o no publicados.
Criterios de selección
Se incluyeron los ensayos controlados aleatorizados (ECA) y cuasialeatorizados que evaluaron los efectos de la administración oral de suplementos de vitamina D, con o sin otros micronutrientes, en comparación con ninguna intervención, placebo, una dosis menor de vitamina D o los mismos micronutrientes solos (sin vitamina D) en lactantes y niños menores de cinco años que vivían en cualquier país.
Obtención y análisis de los datos
Se utilizaron los procedimientos metodológicos Cochrane estándar.
Resultados principales
De los 75 estudios (187 publicaciones; 12 122 participantes) incluidos en el análisis cualitativo, 64 estudios (169 publicaciones; 10 854 participantes) aportaron datos sobre los desenlaces de interés de esta revisión para el metanálisis. La mayoría de los estudios incluidos se realizaron en India, EE. UU. y Canadá. Dos estudios informaron de financiación con fines de lucro, dos se clasificaron como financiación mixta (con y sin fines de lucro), cinco informaron de que no recibieron financiación, 26 no revelaron sus fuentes de financiación y los estudios restantes se patrocinaron con financiación sin fines de lucro. La certeza de la evidencia varió entre alta y muy baja en todos los desenlaces (todos medidos al final del estudio) para cada comparación.
Administración de suplementos de vitamina D versus placebo o ninguna intervención (31 estudios)
En comparación con el placebo o ninguna intervención, la administración de suplementos de vitamina D (en dosis de 200 a 2000 UI diarias; o hasta 300 000 UI en embolada en el momento de la inclusión) podría suponer poca o ninguna diferencia en el crecimiento lineal (talla/estatura medida en cm) entre los niños menores de cinco años (diferencia de medias [DM] 0,66; intervalo de confianza [IC] del 95%: ‐0,37 a 1,68; tres estudios, 240 participantes; evidencia de certeza baja); probablemente mejora la puntuación z de la talla/estatura para la edad (ZT/EE) (DM 0,11; IC del 95%: 0,001 a 0,22; un estudio, 1258 participantes; evidencia de certeza moderada); y probablemente supone poca o ninguna diferencia en el retraso del crecimiento (razón de riesgos [RR] 0,90; IC del 95%: 0,80 a 1,01; un estudio, 1247 participantes; evidencia de certeza moderada).
En cuanto a los eventos adversos, la administración de suplementos de vitamina D probablemente supone poca o ninguna diferencia en la aparición de hipercalciuria en comparación con el placebo (RR 2,03; IC del 95%: 0,28 a 14,67; dos estudios; 68 participantes; evidencia de certeza moderada). No se sabe si la administración de suplementos de vitamina D afecta la aparición de hipercalcemia, ya que la certeza de la evidencia fue muy baja (RR 0,82; IC del 95%: 0,35 a 1,90; dos estudios, 367 participantes).
Administración de suplementos de vitamina D (dosis alta) versus vitamina D (dosis baja) (34 estudios)
En comparación con una dosis menor de vitamina D (100 a 1000 UI diarias; o hasta 300 000 UI en embolada en el momento de la inclusión), la suplementación con una dosis mayor de vitamina D (200 a 6000 UI diarias; o hasta 600 000 UI en embolada en el momento de la inclusión) podría tener poco o ningún efecto sobre el crecimiento lineal, pero no se tiene seguridad con respecto a este resultado (DM 1,00; IC del 95%: ‐2,22 a 0,21; cinco estudios, 283 participantes), y podría suponer poca o ninguna diferencia en la ZT/EE (DM 0,40; IC del 95%: ‐0,06 a 0,86; dos estudios, 105 participantes; evidencia de certeza baja). Ningún estudio evaluó el retraso en el crecimiento.
Con respecto a los eventos adversos, la administración de suplementos de vitamina D con dosis más altas podría suponer poca o ninguna diferencia en la aparición de hipercalciuria (RR 1,16; IC del 95%: 1,00 a 1,35; seis estudios; 554 participantes; evidencia de certeza baja) o de hipercalcemia (RR 1,39; IC del 95%: 0,89 a 2,18; cinco estudios, 986 participantes; evidencia de certeza baja) en comparación con la administración de suplementos de vitamina D con dosis más bajas.
Administración de suplementos de vitamina D (dosis alta) + micronutriente/s versus vitamina D (dosis baja) + micronutriente/s (nueve estudios)
La administración de suplementos de vitamina D con dosis más altas (400 a 2000 UI diarias; o hasta 300 000 UI en embolada en el momento de la inclusión) más micronutrientes, en comparación con la administración de suplementos de vitamina D con una dosis más baja (200 a 2000 UI diarias; o hasta 90 000 UI en embolada en el momento de la inclusión) con los mismos micronutrientes, podría suponer poca o ninguna diferencia en el crecimiento lineal (DM 0,60; IC del 95%: ‐3,33 a 4,53; un estudio, 25 participantes; evidencia de certeza baja). Ningún estudio evaluó el retraso en el crecimiento o la ZT/EE.
En cuanto a los eventos adversos, la administración de suplementos de vitamina D en dosis más altas con micronutrientes, en comparación con vitamina D en dosis más bajas con los mismos micronutrientes, podrían suponer poca o ninguna diferencia en la aparición de hipercalciuria (RR 1,00; IC del 95%: 0,06 a 15,48; un estudio; 86 participantes; evidencia de certeza baja) y es probable que suponga poca o ninguna diferencia en la aparición de hipercalcemia (RR 1,00; IC del 95%: 0,90 a 1,11; dos estudios, 126 participantes; evidencia de certeza moderada).
Cuatro estudios midieron la hiperfosfatemia y tres midieron los cálculos renales, pero no informaron de ningún caso y, por lo tanto, no se incluyeron en la comparación de estos desenlaces.
Conclusiones de los autores
La evidencia indica que la administración de suplementos de vitamina D por vía oral podría dar lugar a una diferencia escasa o nula en el crecimiento lineal, el retraso en el crecimiento, la hipercalciuria o la hipercalcemia, en comparación con el placebo o ninguna intervención, pero puede dar lugar a un ligero aumento de la puntuación z de la talla/estatura para la edad (ZT/EE). Además, la evidencia sugiere que, en comparación con dosis más bajas de vitamina D, con o sin micronutrientes, la administración de suplementos de vitamina D podría dar lugar a una diferencia escasa o nula en el crecimiento lineal, la ZT/EE, el retraso en el crecimiento, la hipercalciuria o la hipercalcemia. El tamaño muestral pequeño, la considerable heterogeneidad en cuanto a los parámetros de población e intervención y el alto riesgo de sesgo en muchos de los estudios incluidos limitan la capacidad de confirmar con alguna certeza los efectos de la vitamina D en estos desenlaces. Se recomienda realizar estudios más grandes y bien diseñados de larga duración (varios meses a años) para confirmar si la administración de suplementos de vitamina D por vía oral puede afectar al crecimiento lineal de los niños menores de cinco años, tanto en los que están sanos como en los que presentan enfermedades infecciosas o no transmisibles subyacentes.
PICO
Resumen en términos sencillos
Efectos de la vitamina D en el crecimiento lineal y otros desenlaces de salud en niños menores de cinco años
Antecedentes
La vitamina D es un nutriente esencial que desempeña una función importante en la salud esquelética. La deficiencia de vitamina D también se ha relacionado con desenlaces de salud no esquelética como el crecimiento. El retraso en el crecimiento y el crecimiento deficiente de los niños menores de cinco años siguen siendo un problema mundial importante. La literatura anterior ha demostrado que el nivel de vitamina D en la sangre está asociado con el retraso en el crecimiento y la falta de crecimiento. Se examinó la evidencia acerca de los suplementos de vitamina D y sus posibles efectos en el crecimiento lineal. También se exploraron otros desenlaces relacionados con la vitamina D, incluidos los efectos adversos.
Características de los estudios
Se incluyeron 187 informes que representaban 75 estudios (12 122 participantes), realizados con mayor frecuencia en la India, Estados Unidos y Canadá, con niños menores de cinco años. Además, 33 estudios se clasificaron como actualmente en proceso de realización (en curso) y 21 estudios como "en espera de clasificación" porque no proporcionaron suficiente información para ser clasificados como incluidos, en curso o excluidos. Las comparaciones incluyeron la administración oral de suplementos con vitamina D versus placebo (comprimido falso) o ninguna intervención; dosis más alta de vitamina D versus dosis más baja de vitamina D; vitamina D más micronutrientes (vitaminas o minerales o ambos) en comparación con los mismos micronutrientes solos; y dosis más alta de vitamina D más micronutrientes (vitaminas o minerales o ambos) en comparación con dosis más baja de vitamina D más los mismos micronutrientes. Dos estudios informaron de financiación con fines de lucro, dos se clasificaron como financiación mixta (con y sin fines de lucro), cinco informaron de que no habían recibido financiación, 26 no revelaron sus fuentes de financiación y los estudios restantes se patrocinaron con financiación sin fines de lucro.
Hallazgos clave
La administración de suplementos con vitamina D en comparación con placebo o ninguna intervención probablemente suponga poca o ninguna diferencia en el desarrollo de la hipercalciuria, probablemente mejora la talla o la estatura en comparación con la edad del niño, probablemente supone poca o ninguna diferencia en el retraso del crecimiento, y podría suponer poca o ninguna diferencia en la talla o la estatura del niño. No se sabe con certeza si la vitamina D, en comparación con un placebo o ninguna intervención, influye en el desarrollo de hipercalcemia.
La administración de suplementos con una dosis mayor de vitamina D en comparación con una dosis menor de vitamina D puede suponer poca o ninguna diferencia en la talla o la estatura en comparación con la edad del niño y con el desarrollo de hipercalciuria, o hipercalcemia; y no existe certeza de los efectos de una dosis mayor de vitamina D en el crecimiento lineal.
La administración de suplementos con una dosis mayor de vitamina D junto con micronutrientes (vitaminas, minerales o ambos) en comparación con una dosis menor de vitamina D y los mismos micronutrientes podría suponer poca o ninguna diferencia en el crecimiento lineal de los menores de cinco años y en la aparición de la hipercalciuria, y probablemente supone poca o ninguna diferencia en la aparición de hipercalcemia.
Conclusiones
La evidencia actual sugiere que es probable que la vitamina D mejore ligeramente la puntuación z de la talla/estatura para la edad en comparación con el placebo; sin embargo, debido a la calidad de la evidencia, no se sabe con certeza cuáles son los verdaderos efectos de la vitamina D en el crecimiento lineal o los efectos adversos en los niños menores de cinco años en comparación con el placebo, ninguna intervención o dosis más bajas de vitamina D, con o sin micronutrientes.
Authors' conclusions
Summary of findings
| Vitamin D versus placebo or no intervention | ||||||
| Patient or population: children under 5 years of age | ||||||
| Outcomes | Anticipated absolute effects* (95% CI) | Relative effect | №. of participants (studies) | Certainty of evidence | Comments | |
|---|---|---|---|---|---|---|
| Risk with placebo or no intervention | Risk with vitamin D | |||||
| Linear growth (length/height) Unit: cm | Mean length in control group was 62.7 cm | Mean length in intervention group was 0.66 cm longer | ‐ | 240 (3 RCTs) | ⊕⊕⊝⊝ | Two studies showed an increase in linear growth, and 1 study found a decrease in linear growth. However, no difference was found overall |
| Length/height‐for‐age z‐score (L/HAZ) Time frame: 6 months | Mean height‐for‐age z‐score in control group was ‐1.95 | Mean height‐for‐age z‐score in intervention group was 0.11 units higher | ‐ | 1258 (1 RCT) | ⊕⊕⊕⊝ | HAZ was higher among those receiving vitamin D |
| Stunting Definition: L/HAZ < ‐2 | Study population | RR 0.90 | 1247 (1 RCT) | ⊕⊕⊕⊝ | ||
| 490 per 1000 | 441 per 1000 | |||||
| Adverse effect: hypercalciuria As defined by trialists | Study population | RR 2.03 | 68 (2 RCTs) | ⊕⊕⊕⊝ | There was no greater risk of increased calcium secretion in urine in groups receiving vitamin D | |
| 29 per 1000 | 60 per 1000 | |||||
| Adverse effect: hypercalcaemia As defined by trialists | Study population | RR 0.82 | 367 (2 RCTs) | ⊕⊝⊝⊝ | There was no greater risk of increased calcium concentration in blood in groups receiving vitamin D | |
| 124 per 1000 | 101 per 1000 | |||||
| Adverse effect: hyperphosphataemiae | ‐ | ‐ | ‐ | ‐ | ‐ | Not measured |
| Adverse effect: kidney stonese | ‐ | ‐ | ‐ | ‐ | ‐ | Not measured |
| *The risk in the intervention group (and its 95% confidence interval) is based on assumed risk in the comparison group and the relative effect of the intervention (and its 95% CI). | ||||||
| GRADE Working Group grades of evidence. | ||||||
| aDowngraded one level due to serious risk of bias. Evidence was downgraded an additional level due to inconsistency (as indicated by an I² value of 49%; P = 0.14), suggesting moderate heterogeneity. eNo data were available for this outcome. | ||||||
| Vitamin D (higher dose) versus vitamin D (lower dose) | ||||||
| Patient or population: children under 5 years of age | ||||||
| Outcomes | Anticipated absolute effects* (95% CI) | Relative effect | №. of participants (studies) | Certainty of evidence | Comments | |
|---|---|---|---|---|---|---|
| Risk with lower‐dose vitamin D | Risk with higher‐dose vitamin D | |||||
| Linear growth (length/height) Unit: cm Time frame: 4.2 months (mean) | Mean length in control group was 57.8 cm. | Mean length in intervention group was 1.00 cm shorter | ‐ | 283 (5 RCTs) | ⊕⊝⊝⊝ | Two studies showed an increase in linear growth, and 3 studies found a decrease in linear growth. However, no difference was found overall |
| Length/height‐for‐age z‐score (L/HAZ) Unitless Time frame: 7 months (mean) | Mean height‐for‐age z‐score in control group was ‐0.35. | Mean height‐for‐age z‐score in intervention group was0.40 units higher | ‐ | 105 (2 RCTs) | ⊕⊕⊝⊝ | No difference in HAZ was found between groups |
| Stuntingc | ‐ | ‐ | ‐ | ‐ | ‐ | Not measured |
| Adverse effect: hypercalciuria As defined by trialists Time frame: 3.9 months (mean) | Study population | RR 1.16 | 554 (6 RCTs) | ⊕⊕⊝⊝ | There was no greater risk of increased calcium secretion in urine in groups receiving vitamin D | |
| 276 per 1000 | 320 per 1000 | |||||
| Adverse effect: hypercalcaemia As defined by trialists Time frame: 8.6 months (mean) | Study population | RR 1.39 | 986 (5 RCTs) | ⊕⊕⊝⊝ | There was no greater risk of increased calcium concentrations in blood in groups receiving vitamin D | |
| 64 per 1000 | 88 per 1000 | |||||
| Adverse effect: hyperphosphataemiac | ‐ | ‐ | ‐ | ‐ | ‐ | Not measured |
| Adverse effect: kidney stonesc | ‐ | ‐ | ‐ | ‐ | ‐ | Not measured |
| *The risk in the intervention group (and its 95% confidence interval) is based on the assumed risk in the comparison group and the relative effect of the intervention (and its 95% CI). | ||||||
| GRADE Working Group grades of evidence. | ||||||
| aDowngraded one level due to serious risk of bias. Evidence was downgraded an additional level due to imprecision, as the confidence interval around the effect size included 0, the null value. Evidence was downgraded an additional level due to inconsistency between studies, indicated by an I² value of 71%, suggesting substantial heterogeneity. | ||||||
| Vitamin D (higher dose) + micronutrient(s) versus vitamin D (lower dose) + micronutrient(s) | ||||||
| Patient or population: children under 5 years of age | ||||||
| Outcomes | Anticipated absolute effects* (95% CI) | Relative effect (95% CI) | №. of participants (studies) | Certainty of evidence (GRADE) | Comments | |
|---|---|---|---|---|---|---|
| Risk with lower‐dose vitamin D + micronutrient(s) | Risk with higher‐dose vitamin D + micronutrient(s) | |||||
| Linear growth (length/height) Unit: cm Time frame: 3 months | Mean length in control group was 49.2 cm | Mean length in intervention group was 0.6 cm longer (3.33 shorter to 4.53 longer) | ‐ | 25 (1 RCT) | ⊕⊕⊝⊝ | No difference in linear growth was found between groups |
| Length/height‐for‐age z‐score (L/HAZ)b | ‐ | ‐ | ‐ | ‐ | ‐ | Not measured |
| Stuntingb | ‐ | ‐ | ‐ | ‐ | ‐ | Not measured |
| Adverse effect: hypercalciuria As defined by trialists Time frame: 3 months | Study population | RR 1.00 (0.06 to 15.48) | 86 (1 RCT) | ⊕⊕⊝⊝ | There was no greater risk of increased calcium secretion in urine in groups receiving vitamin D | |
| 23 per 1000 | 23 per 1000 | |||||
| Adverse effect: hypercalcaemia As defined by trialists Time frame: 2.2 months (mean) | Study population | RR 1.00 (0.90 to 1.11) | 126 (2 RCTs) | ⊕⊕⊕⊝ | There was no greater risk of increased calcium concentrations in blood in groups receiving vitamin D | |
| 145 per 1000 | 298 per 1000 | |||||
| Adverse effect: hyperphosphataemiab | ‐ | ‐ | ‐ | ‐ | ‐ | Not measured |
| Adverse effect: kidney stonesb | ‐ | ‐ | ‐ | ‐ | ‐ | Not measured |
| *The risk in the intervention group (and its 95% CI) is based on the assumed risk in the comparison group and the relative effect of the intervention (and its 95% CI). | ||||||
| GRADE Working Group grades of evidence. | ||||||
| aDowngraded one level due to risk of bias and imprecision, as the 95% CI for the effect measure included the null value of 0. Evidence was downgraded an additional level due to indirectness as only one study conducted in Finland was included, restricting the population analysed. | ||||||
Background
Description of the condition
Linear growth faltering and stunting
Suboptimal health among children under five years of age remains a major global challenge (UNICEF, WHO, World Bank 2020; WHO 2016). Most of the 5.9 million deaths among children under five years of age in 2015 could be attributed to preventable causes with available treatment options, such as malnutrition (UNICEF, WHO, World Bank 2020).
Linear growth faltering, or failure to reach one’s linear growth potential compared to normative standards (Leroy 2019; Perumal 2018), is associated with negative short‐ and long‐term outcomes among children under five years of age. Linear growth faltering is a marker for poor health, reduced earnings, and lower cognitive capacity, as well as a direct factor in the causal pathway to biological states such as foetal growth restriction and shorter maternal height (Leroy 2019; Perumal 2018). A subset of children suffering from linear growth faltering may become stunted, which is defined as more than two standard deviations (SDs) below the World Health Organization (WHO) reference standard (length‐ or height‐for‐age z‐score) (WHO 2006). The prevalence of stunting in a community offers a useful marker of well‐being at the population level (Perumal 2018); however, it is not without limitations. Recent studies have suggested that the classical definition of stunting is based on an arbitrary cutoff and may fail to accurately represent the true proportion of children facing inadequate growth (Leroy 2019). Therefore, this review will use both linear growth faltering and stunting to better evaluate interventions.
Linear growth faltering and stunting have multiple causes, including cumulative poor nutrition in utero and postnatally (Dewey 2011). In addition, repeated infections, environmental enteropathy, and inadequate care have all been suggested as contributory to inadequate growth (Leroy 2019; Perumal 2018). A recent review of child stunting pinpointed growth faltering during childhood as both a causal mechanism for some poor outcomes and a non‐causal indicator of other consequences (Leroy 2019). Linear growth faltering can lead to (1) cephalopelvic distortion leading to difficult birth, morbidity, and mortality; and (2) maternal short stature leading to smaller infants, who are more likely to die or not grow to optimal height (Ramakrishnan 1999). Linear growth faltering has additionally been shown to be associated with reduced earnings, lower school achievement and work capacity, reduced physical strength, chronic diseases, or poor cognition in adulthood (Black 2008; Dewey 2011; Haas 1996; Leroy 2019). Women stunted in childhood tend to bear stunted offspring, creating an intergenerational cycle of adverse physical, mental, and economic outcomes (Martorell 2012). A seminal study by Hoddinott et al followed a cohort of Guatemalan adults and, using instrumental variables, found that stunting played a causal role in adult economic productivity independent of childhood malnutrition and socioeconomic status. The mechanism behind this remains unknown, but it may be attributable to discrimination in schooling or when seeking employment. Although it is not generalisable to other populations, the analysis performed in this study remains important to support interventions to directly address inadequate childhood growth to improve economic disparities.
One risk factor for linear growth faltering of infants is maternal undernutrition; the intergenerational cycle of malnutrition is perpetuated by intrauterine growth restriction and restricted blood flow to the uterus, placenta, and foetus (Dewey 2011). Intrauterine growth restriction may lead to the infant being born premature (gestational age less than 32 weeks) and/or with low birth weight (birth weight less than 2.5 kg), both of which are risk factors for stunting (Danaei 2016). Another risk factor is recurrent infection (Caulfield 2006); as children age, their exposure to the environment increases, along with their risk of infection (Caulfield 2006). Stunting remains the most prevalent form of undernutrition among children under five years of age; 149 million suffer from stunting globally (WHO 2019). Global stunting decreased from 32.5% in 2000 to 21.9% in 2018 among children under five years of age (WHO 2019), but it remains a critical challenge in numerous geographical regions (De Onis 2012; De Onis 2013; Prendergast 2014). In India, for instance, 46 million children (nearly 40%) under five years of age are stunted, accounting for more than a third of the stunted children in the developing world (MoHFW 2019). The World Health Assembly aims to reduce stunting in children under five years of age by 40% between 2010 and 2025 (WHO 2012; WHO 2014a). Therefore, it is crucial to delineate modifiable causes of, and effective interventions against, stunting and linear growth faltering, including micronutrient supplementation.
Given the widely recognised burden of disease associated with childhood stunting in diverse populations (Black 2008; Black 2013; De Onis 2012; Prendergast 2014), many global research and policy efforts have sought to reduce growth faltering (Victora 2010; WHO 2014a). It has been estimated that improved understanding and scaling up of effective, evidence‐informed, safe, and effective interventions can prevent stunting among 33.5 million children (Bhutta 2013; Huey 2016; WHO 2014a). In particular, investigators have explored vitamin D supplementation as an intervention to prevent and mitigate childhood stunting (Kumar 2011). Optimal vitamin D status, which is often assessed by measuring serum concentrations of calcifediol (i.e. 25(OH)D), allows calcium absorption and growth to support active vitamin D (i.e. calcitriol (1,25{OH}₂D₃)) (Holick 2010). Prolonged inadequate vitamin D status impairs transcriptional regulation of skeletal homeostasis and linear growth, which could result in stunting (Holick 2010).
Prior observational studies have provided evidence that stunting is associated with suboptimal vitamin D status among children (Walli 2017). Therefore, vitamin D supplementation as a potentially modifiable risk factor that can have an effect on linear growth requires further evaluation.
Description of the intervention
Vitamin D status
One billion people have suboptimal vitamin D status, according to global estimates (Holick 2010). Even in countries with sun exposure all year round, low vitamin D status is a global problem among all age groups (Palacios 2014). Consequences of low vitamin D include poor skeletal and extraskeletal health outcomes (Holick 2008a; Holick 2008b; Holick 2010).
Low circulating 25(OH)D serum concentration is widely regarded as the biomarker for vitamin D status (Heaney 2009), although cut‐off values indicating deficiency and insufficiency are debated (Holick 2011; Ross 2011). Between 30% and 50% of children in numerous countries in Africa, Asia, Europe, and North America (Holick 2010), including geographical areas with ample sunlight and heterogeneous economic resources, have 25(OH)D less than 50 nmol/L. In the context of vitamin D deficiency, infants and young children are considered a high‐risk population, given that vitamin D intake is low during exclusive breastfeeding (Leroy 2014; Shrimpton 2001), and early life represents a critical period for linear growth and development of the immune system (Adkins 2004; Levy 2007). As further detailed in the next section, pleiotropic actions of vitamin D can impact skeletal, muscular, and immunological functions, all of which are related to optimal growth.
Vitamin D sources
Vitamin D can be acquired through consumption of a diet containing naturally vitamin D‐rich and fortified foods, or vitamin D supplements, or through endogenous production via skin exposure to ultraviolet irradiation (Holick 2010). In this review, we focus on vitamin D supplementation, given that it overcomes the challenges of inadequate sunlight at some geographical latitudes, as well as minimal sun exposure based on individual lifestyle decisions and limited consumption of naturally vitamin D‐rich or fortified foods (Holick 2010). Vitamin D supplements are available in two chemical forms (ergocalciferol (D2) and cholecalciferol (D3)), which differ in their side‐chain structure (Holick 2010). Vitamins D2 and D3 have been observed to increase serum 25‐hydroxyvitamin D (serum 25(OH)D), although at higher doses (50,000 IU), vitamin D2 appears less potent than equivalent doses of D3 in maintaining serum 25(OH)D levels (Holick 2010).
Vitamin D requirements
According to the WHO and the Food and Agriculture Organization (FAO), 200 international units (IU) of vitamin D is the daily recommended nutrient intake (RNI) among children under five years of age (WHO, FAO 2004). In the USA, the Institute of Medicine recommends that children between one and five years of age should consume a recommended dietary allowance of 600 IU per day, and have an estimated average requirement (EAR) of 400 IU per day (Institute of Medicine 2011). From birth to 12 months, it is recommended that children in the USA consume adequate intake (AI) of 400 IU per day (Institute of Medicine 2011).
No adverse effects occur at vitamin D intakes recommended by WHO and by FAO (WHO, FAO 2004). In the USA, the recommended upper limits of vitamin D consumption are based on age: 1000 IU from birth to six months, 1500 IU from six to 12 months, 2500 IU from one to three years, and 3000 IU from four to five years (Institute of Medicine 2011). Vitamin D toxicity has been observed in a few rare cases with long‐term consumption of extreme pharmaceutical dosages (Barrueto 2005; Blank 1995; Holick 2011; Klontz 2007; Vieth 1999); it is caused primarily by excessive intestinal calcium or phosphate absorption and bone resorption (Holick 2010). Excess vitamin D may contribute to hypercalciuria, hypercalcaemia, hyperphosphataemia, and kidney stones (nephrolithiasis) (Holick 2010). Hypercalciuria, or high levels of calcium in the urine, is linked to the role of vitamin D in increasing intestinal calcium reabsorption and is defined differently across different age groups (Leslie 2020). In children over two years of age, hypercalciuria is defined as daily urinary excretion of more than 4 mg calcium per kg of body weight, or a 24‐hour urinary calcium concentration less than 200 mg calcium per litre of urine (Leslie 2020). For children under two years, a random or spot urinary calcium‐to‐creatine ratio less than 0.2 mg calcium per mg creatine is considered normal (Leslie 2020). Hypercalcaemia is mainly caused by excess parathyroid hormone (PTH), which can be induced by high vitamin D intake, and is defined as high levels of calcium in blood; it can be classified as mild (10.5 to 11.9 mg/dL), moderate (12.0 to 13.9 mg/dL), or a hypercalcaemic crisis (14.0 to 16.0 mg/dL) (Sadiq 2020). Hyperphosphataemia indicates plasma phosphate greater than 7 mg/dL in children and can be induced by the role of vitamin D in increasing intestinal phosphate absorption (Goyal 2020). Kidney stones, detected via ultrasound, are calcium crystal concretions (composed primarily of calcium oxalate or calcium phosphate) travelling from the kidney through the genitourinary system. Kidney stones can occur in the setting of hypercalciuria (Nojaba 2020).
Metabolism of vitamin D
Evidence from mechanistic and dose‐response studies suggests that increasing intake of vitamin D (via consumption (supplementation, dietary intake) or cutaneous synthesis) improves serum 25(OH)D concentration (Holick 2010; Holick 2011). After it enters the body, vitamin D is stored in fat or is metabolised by the liver (Holick 2010; Holick 2011). A 25‐hydroxylase (CYP27B1) in the liver converts vitamin D to 25(OH)D, which is the major circulating form (Holick 2010; Holick 2011).
Available data from dose‐response studies show that vitamin D supplementation increases serum 25(OH)D concentration, regardless of age (Heaney 2003; Holick 2008b; Holick 2010; Institute of Medicine 2011). A non‐linear response of 25(OH)D to vitamin D has been observed in murine and human models (Institute of Medicine 2011). Dosages greater than or equal to 1000 IU daily have resulted in more gradual responses (e.g. 0.95 nmol/L to 1.4 nmol/L for every 100 IU; Smith 2009), and dosages below 1000 IU daily have achieved steeper responses (e.g. approximately 2.0 nmol/L for every 40 IU; Cashman 2008; Cashman 2009; Institute of Medicine 2011). Moreover, studies including young children with stunting have confirmed that vitamin D supplementation increases 25(OH)D (Kumar 2011). Widely ranging vitamin D supplementation dosages across studies have included daily physiological doses (200 IU to 400 IU; Alizadeh Taheri 2014; Fort 2016), as well as pharmacological doses (50,000 IU at birth; Moodley 2015), and even a single dose of 100,000 IU (Gupta 2016). In summary, preliminary data highlight the need for assessment of potential beneficial effects of vitamin D supplementation on stunting among children.
How the intervention might work
Cells of kidney, immune system, bone, and epithelium, and of other tissues in the body, use 1‐OHase (CYP27R1) to metabolise 25(OH)D to the biologically active steroid hormone 1,25(OH)₂D (Bikle 2014; Christakos 2016; Holick 2010). In its hormonally active form, vitamin D plays pleiotropic roles in the human body, promoting skeletal health, muscle development and growth, and immune function.
1,25(OH)₂D functions through genomic and non‐genomic mechanisms (Bikle 2014; Christakos 2016; Holick 2010). First, genomic effects occur through binding of 1,25(OH)₂D to vitamin D receptor and retinoid X receptor, which results in a heterodimer complex that regulates gene activity (Bikle 2014; Christakos 2016; Holick 2010). At least 100 to 1250 target genes of vitamin D are known (Adams 2010; Holick 2007; Hossein‐Nezhad 2013; Ramagopalan 2010; Tarroni 2012). These are directly targeted by vitamin D (via a vitamin D response element; e.g. 1,25(OH)₂D has been shown to bind to vitamin D response element in the calcium‐sensing receptor gene and subsequently to modulate calcium‐sensing receptor expression (Bikle 2014; Canaff 2002; Christakos 2016; Holick 2010)). Second, 'rapid' or non‐genomic responses occur extracellularly via interaction with plasma membrane vitamin D receptor (VDR) (Bikle 2014; Christakos 2016; Holick 2010). Examples of these include stimulation of intestinal calcium absorption and inhibition of apoptosis in osteoblasts (Bikle 2014; Christakos 2016; Holick 2010). This nuclear receptor has been identified in nearly all human tissues and cells assessed (Bikle 2014; Christakos 2016; Holick 2010).
Skeletal homeostasis and linear growth
Vitamin D has well‐established effects on skeletal health, including bone mineralization and maintenance (Holick 2010). Active vitamin D (1,25(OH)₂D) functions in conjunction with two other hormones (parathyroid hormone and calcitonin) to maintain endocrine control of calcium and phosphorus concentrations (Holick 2010). This tight regulation of calcium and phosphorus flux (extracellular (bones, blood), intracellular) is critical for development and maintenance of bones (Holick 2010), which impacts linear growth. Specific roles of active vitamin D include increasing intestinal calcium absorption (Christakos 2012), renal calcium reabsorption, and skeletal calcium resorption (in conjunction with parathyroid hormone) (Holick 2010).
Previous studies have demonstrated that vitamin D deficiency is associated with stunting (Holick 2010), including stunting among children (Holick 2006; Wacker 2013). Maternal vitamin D deficiency has been associated with greater risk of stunting among neonates and children (Finkelstein 2012; Toko 2016).
Possible negative effects on linear growth in children have been noted with higher‐dose vitamin D supplementation. An early case series of nine infants consuming over 1500 units of vitamin D daily from cod liver oil sources were found to have lowered growth rates after six months of age compared to infants consuming 300 to 600 units of vitamin D daily (Jeans 1938). These findings have been raised as a matter to concern by the Dietary Reference Intakes Committees in their review of vitamin D in both 1997 and 2010 (Institute of Medicine 1997; Institute of Medicine 2011). However, a population‐based cohort study conducted in 2011 (n = 10,060 singletons) found that supplementation with 2000 IU vitamin D per day during infancy was not associated with height at age 14 or 31 years, and was not associated with reduced height at any age studied (Hyppönen 2011).
Muscle development and growth
Vitamin D may influence muscle mass and function, as well as related indicators (weight‐for‐height (WFH) and ‐age (WFA)). Observational studies have corroborated the link between severe vitamin D deficiency (≤ 8 ng/mL) and poor muscle health among individuals age 10 to 65 years (Plotnikoff 2003). As an example, among infants with HIV exposure and no infection, low 25(OH)D concentration (< 10 ng/mL or ~ 25 nmol/L) was associated with a higher incidence of wasting (hazard ratio 1.71, 95% confidence interval (CI) 1.20 to 2.43; Sudfeld 2015).
Previous studies have identified mechanisms that link vitamin D with myopathy (Bischoff‐Ferrari 2012). In vitro studies have assessed human muscle tissues and isolated VDR (Bischoff‐Ferrari 2004; Bischoff‐Ferrari 2012; Ceglia 2010; Simpson 1985), which facilitate genomic and non‐genomic effects (Haussler 1998; McDonnell 1987; Norman 2004; Vazquez 1998). Furthermore, murine models have demonstrated that deletion of VDR (via gene knockout) resulted in impaired skeletal muscle growth and muscle‐related gene expression (Bouillon 2008; Endo 2003). Mice without VDR had smaller muscle fibres in all striated muscles (Endo 2003).
Why it is important to do this review
Linear growth retardation (including stunting) continues to affect many children worldwide (WHO 2018), and global stunting remains a critical and complex challenge in numerous geographical regions (De Onis 2013; Prendergast 2014; UNICEF, WHO, World Bank 2020). This is reflected in the World Health Assembly nutrition target to reduce stunting by 40% among children under five years of age by 2025, and Sustainable Development Goal 2.2 to reduce the prevalence of stunting and wasting in children under five years of age by 2025, highlighting the global importance of addressing this issue (United Nations 2015; WHO 2012; WHO 2014a). Although stunting among children under five years of age has decreased from 39.7% (in 1990) to 21.3% (in 2019) (De Onis 2012; Dewey 2020), the World Health Assembly nutrition target will not be achieved at this current trajectory (De Onis 2013).
Linear growth is considered an important overall indicator of child development (De Onis 2016). Critically, children with stunting often show minimal (if any) catch‐up growth in later life (Martorell 1994). However, nutritional interventions have been seen to allow catch‐up growth among children (Martorell 1994), especially during key developmental windows (including between birth and five years) (Prentice 2013). Vitamin D is already a known beneficial intervention for prevention of rickets in the same early, crucial childhood years, and despite conclusive evidence, the drive to reduce growth retardation is an important one with a plethora of potential beneficial effects.
The systematic method of our review is intended to achieve comprehensive assessment of current evidence on effects of vitamin D supplementation on growth faltering and other health outcomes among children. This approach facilitates consideration of other modulating factors, particularly in subgroup analyses. Given the multi‐factorial origin of stunting, which needs further elucidation (Stewart 2013), accounting for other factors is important. Aside from nutritional factors that affect stunting, potential influences include repeated infections, poor sanitation, household environmental contamination, mycotoxin exposure, the gut, and associated enteropathy (Casanovas 2013; Owino 2016; Semba 2016; Stewart 2013; Waterlow 1994).
Separately, an estimated one billion people have suboptimal vitamin D status (Holick 2007), which is linked to numerous skeletal and extraskeletal outcomes (Holick 2010). Given the relative ease of administration, widespread availability, and ongoing acceptability, the benefits of supplementation for growth in the first five years of life should be explored. Despite the multitude of studies that have focused on vitamin D supplementation and clinical health indicators (Ferguson 2014; Jagannath 2010), particularly among adults (Avenell 2014; Bjelakovic 2014a; Palacios 2019; Straube 2015), evidence regarding growth and stunting among children under five years of age remains unclear. Thus, it is necessary to draw overall conclusions from currently available evidence regarding how vitamin D supplementation impacts the growth of children under five years of age.
Objectives
To assess effects of oral vitamin D supplementation on linear growth and other health outcomes among infants and children under five years of age.
Methods
Criteria for considering studies for this review
Types of studies
Randomised controlled trials (RCTs) and quasi‐RCTs. Quasi‐RCTs included studies that did not involve a treatment regimen assignment with simple randomisation but systematically utilised another aspect of the study design (e.g. alternating assignments based on sequential study enrolment, medical record number). Cluster‐randomised and cross‐over trials were also eligible for inclusion.
Types of participants
Infants and children under five years of age who lived in any country, healthy and apparently non‐vitamin D‐deficient, as well as with diagnosed vitamin D deficiency, rickets, or other underlying health conditions (as defined by trialists). We included studies of children under five years of age and study participants who were both under and over five years of age (e.g. birth to 10 years) if study authors reported stratified outcomes; this review reports extracted results among children under five years of age. We included studies of vitamin D supplementation directly among infants and children under five years of age only. We excluded studies that provided vitamin D supplementation to mothers only and not to their offspring.
Types of interventions
Studies assessing effects of oral vitamin D supplementation, with or without micronutrients, compared to no intervention, placebo, a lower dose of vitamin D, or micronutrients alone in children under five years of age. Comparisons between intervention and comparator groups are described below (and in Table 1).
| Comparison | ||
|---|---|---|
| Name of comparison | Intervention group | Comparator group |
| 1. Vitamin D supplementation vs placebo or no intervention | Oral vitamin D (cholecalciferol D₃, ergocalciferol D₂, calcitriol) supplementationa | No intervention |
| Placebo | ||
| 2. Vitamin D supplementation (high dose) vs vitamin D (low dose) | Oral vitamin D (cholecalciferol D₃, ergocalciferol D₂, calcitriol) supplementation,a at a higher dose | Oral vitamin D (cholecalciferol D₃, ergocalciferol D₂, calcitriol) supplementation,a at a lower dose |
| 3. Vitamin D supplementation + micronutrient(s) vs micronutrient(s) alone | Other micronutrient(s),b including oral vitamin D (cholecalciferol D₃, ergocalciferol D₂, calcitriol) supplementationa | Other micronutrient(s),b not including vitamin D |
| 4. Vitamin D supplementation (high dose) + micronutrient(s) vs vitamin D (low dose) + micronutrient(s) | Other micronutrient(s),b including oral vitamin D (cholecalciferol D₃, ergocalciferol D₂, calcitriol) supplementation at a higher dosea | Other micronutrient(s),b including vitamin D at a lower dose |
aAny formulation, including capsules, tablets, soft gels, liquids, sprays/mists, or powders.
bComparisons will include intervention and comparator groups with the same combination and content of vitamin(s) and/or mineral(s) to isolate the effects of vitamin D.
Interventions
Oral vitamin D (cholecalciferol D₃, ergocalciferol D₂, calcitriol) supplementation (Table 1). We included any form of oral consumption of vitamin D (such as capsules, tablets, soft gels, liquids, sprays/mists, and powders) and excluded alternative administration of vitamin D (e.g. intravenous injection, food fortification, dietary intake of vitamin D‐rich foods). We documented key differences across interventions (including treatment dosage, duration, and frequency) during data extraction. For studies assessing effects of higher versus lower doses of vitamin D, we considered the higher dose as the intervention arm (see Differences between protocol and review). Studies with micronutrient supplementation plus vitamin D as the intervention were included if the comparator arm involved the same micronutrients without vitamin D, or provided a lower dose of vitamin D as the reference group.
Comparators
Study participants who received placebo, no intervention, or a lower dose of vitamin D (Table 1). Additionally, for studies with micronutrient supplementation plus vitamin D as the intervention, we included comparisons that involved the same micronutrients without vitamin D or with a lower dose of vitamin D as the reference group.
Types of outcome measures
Primary outcomes
-
Linear growth (reported continuously in centimetres)
-
Length/height‐for‐age (L/HAZ; reported continuously as WHO z‐score; WHO 2006)
-
Stunting (reported as a categorical outcome; defined as L/HAZ more than 2 SDs below the reference WHO standard; WHO 2006)
-
Adverse effects relevant to excessive vitamin D (reported as categorical outcomes)
-
Hypercalciuria (high urinary calcium levels, defined by trialists)
-
Hypercalcaemia (high serum calcium levels, defined by trialists)
-
Hyperphosphataemia (high plasma phosphate levels, defined by trialists)
-
Kidney stones (nephrolithiasis, defined by trialists)
-
Secondary outcomes
-
Gain in linear growth (reported continuously in centimetres)
-
Weight‐for‐age (WAZ; reported continuously as WHO z‐score; WHO 2006)
-
Underweight (reported as a categorical outcome; defined as WAZ more than 2 SDs below the reference WHO standard; WHO 2006)
-
Weight‐for‐length/height (WL/HZ; reported continuously as WHO z‐score; WHO 2006)
-
Wasting (reported as a categorical outcome; defined as WHZ (or WLZ) more than 2 SDs below the reference WHO standard; WHO 2006)
-
Vitamin D status (based on serum 25(OH)D concentration (nmol/L); reported as continuous outcomes, including change in vitamin D status, and categorical outcomes, according to current recommended cut‐offs from the Institute of Medicine and the Endocrine Society (in the USA) (Holick 2011)). Usage of a wide spectrum of vitamin D assay instruments, including immunoassays (e.g. radioimmunoassays) and chromatographic methods (e.g. liquid chromatography‐tandem mass spectrometry)
-
Rickets (defined by trialists)
Search methods for identification of studies
Electronic searches
In March 2018, we searched the international and regional electronic databases and trial registers listed below. We updated the search in December 2019. We made some adjustments to our electronic search strategy post publication of our protocol (Yu 2017). Please see Differences between protocol and review.
-
Cochrane Central Register of Controlled Trials (CENTRAL; 2019, Issue 12), in the Cochrane Library, which includes the Cochrane Developmental, Psychosocial and Learning Problems Specialised Register (searched 11 December 2019).
-
PubMed National Library of Medicine (www.ncbi.nlm.nih.gov/pubmed; searched 11 December 2019).
-
Embase Ovid (1980 to 11 December 2019).
-
CINAHL EBSCOhost (Cumulative Index to Nursing and Allied Health Literature; 1982 to 11 December 2019).
-
CABI (Centre for Agriculture and Biosciences International): CAB Abstracts and Global Health Web of Science (1973 to 11 December 2019).
-
Web of Science Core Collection Clarivate (searched 11 December 2019).
-
Cochrane Database of Systematic Reviews (CDSR; 2019, Issue 12), part of the Cochrane Library (searched 11 December 2019).
-
DARE (Database of Abstracts of Reviews of Effects, Centre for Reviews and Dissemination; www.crd.york.ac.uk/CRDWeb; searched 11 December 2019).
-
IBECS (ibecs.isciii.es; searched 11 December 2019).
-
LILACS (Latin American and Caribbean Health Sciences Literature; lilacs.bvsalud.org/en; searched 11 December 2019).
-
PAHO (Pan American Health Library; iris.paho.org; searched 11 December 2019).
-
WHOLIS (WHO Library; dosei.who.int; searched 11 December 2019).
-
SciELO (Scientific Electronic Library Online; www.scielo.br; searched 11 December 2019).
-
WPRIM (Western Pacific Region Index Medicus; www.wprim.org; searched 11 December 2019).
-
IndMED (Indian Medical Journals; indmed.nic.in; searched 14 March 2018; IndMED was not available at this URL after 2018, and the database could not be located).
-
WHO ICTRP (World Health Organization International Clinical Trials Registry Platform; apps.who.int/trialsearch; searched 14 March 2018).
-
Epistemonikos (www.epistemonikos.org; searched 11 December 2019).
-
Scopus Elsevier (searched 11 December 2019).
-
EUCTR (European Union Clinical Trials registry; www.clinicaltrialsregister.eu/ctr-search/search; searched 11 December 2019).
The search strategies for each database are provided in Appendix 1. We did not limit the searches by publication year, language, country, or region.
Searching other resources
We searched the reference lists of relevant publications (including trials, reviews, meta‐analyses, reports) identified through our electronic searches, and we considered any potentially eligible trials included in these reference lists. Additionally, we attempted to obtain information on relevant ongoing and unpublished trials by contacting other entities such as the WHO Nutrition Section (www.who.int/nutrition/en), the United Nations Children’s Fund (UNICEF; www.unicef.org), Nutrition International (formerly Micronutrient Initiative; www.nutritionintl.org), the International Micronutrient Malnutrition Prevention and Control Programme (IMMPaCt; www.immpact.org) from the US Centers for Disease Control and Prevention (CDC), and the Vitamin D Workshop Group (vitamindworkshop.org).
Data collection and analysis
We performed this review in accordance with the recommendations provided in the Cochrane Handbook for Systematic Reviews of Interventions (Higgins 2020a). When possible, we used the methods described in our published protocol (Yu 2017). Unused methods may be found in Table 2.
| Data analysis | Unused method | Reason for non‐use |
|---|---|---|
| Unit of analysis issues | Cluster‐randomised trials Had we included cluster‐randomised trials, we would have accounted for randomisation of study participant groups by conducting analyses at the cluster level. We would have calculated effect estimates (with respective standard errors (SEs)) by using the generic inverse variance method presented in Review Manager 5 (RevMan 5) (Higgins 2020b; Review Manager 2014). Depending on analyses of included studies, we would have conducted approximately correct analyses, when possible (Higgins 2020b) | No cluster‐randomised trials included in review |
| Cross‐over trials We planned to assess data from a 2‐period, 2‐intervention cross‐over trial by using a paired t‐test to evaluate the difference between 2 measurements (subtracting the control measurement from the experimental measurement) for each study participant (Higgins 2020b). For studies with potential carry‐over effects, we planned to consider only the first period of trial intervention follow‐up (Higgins 2020b) | No cross‐over trials included in quantitative analysis | |
| Subgroup analysis and investigation of heterogeneity | If at least 4 studies measuring a primary outcome had reported on age at time of intervention (birth to 6 months of age vs 7 to 12 months of age, 13 to 36 months of age, 37 to 59 months of age), frequency of supplementation (daily vs intermittent vs other), serum 25(OH)D at baseline (current cutoff levels recommended by the Institute of Medicine and the Endocrine Society (Holick 2011; Institute of Medicine 2011)), geographical latitude (between Tropics of Cancer and Capricorn, compared with north of Tropic of Cancer and south of Tropic of Capricorn), season at start of study (spring, summer, fall, winter), or baseline height/length‐for‐age z‐score, we would have performed subgroup analyses (see the protocol Yu 2017 for details). Subgroup analyses would have been undertaken in RevMan 5 (Review Manager 2014), using methods described in the Cochrane Handbook for Systematic Reviews of Interventions (Deeks 2020) | Not enough studies available (≤ 3) |
| Sensitivity analysis | If at least 10 studies measuring a primary outcome had been available to compare in terms of being published or unpublished, high risk of bias, longer intervention durations or greater sample sizes, influence of methods, and use of filters such as imputation, language of publication, source of funding, and country, we would have performed statistical tests, including Egger's test to assess asymmetry of funnel plots and as indicators of bias (Egger 1997) (see the protocol Yu 2017 for details). Sensitivity analyses would have been undertaken in RevMan 5 (Review Manager 2014), using methods described in the Cochrane Handbook for Systematic Reviews of Interventions (Deeks 2020) | Not enough studies available (≤ 10) |
| Publication bias | We searched 17 electronic databases and 2 trial registries to be as comprehensive as possible in examining all available evidence. However, we were not able to assess for publication bias using funnel plots due to lack of studies for comparison, thereby preventing us from drawing conclusions on publication bias of the included studies | Not enough studies available (≤ 10) |
Selection of studies
We modified the data extraction form on Covidence for use during screening of studies for this review. Using Covidence systematic review software (Covidence 2020), five review authors (SLH, AS, NA, RA, EAY) independently screened studies identified by the searches. Initially, they considered the title and abstract of each record to decide whether they met inclusion and exclusion criteria of this review (Criteria for considering studies for this review), and they selected 'No' for those that were irrelevant. For records that were not excluded, SLH, AS, and NA reviewed the full‐text reports for eligibility. We contacted study authors if clarifications were necessary, or if full‐text reports were not available (Dealing with missing data). SLH, AS, NA, EAY, and RA resolved discrepancies through discussion and, if necessary, through consultation with a sixth review author (SM).
We present the selection process in a PRISMA diagram (Moher 2009).
Data extraction and management
Three review authors (SLH, NA, AS) independently extracted data from eligible full‐text studies using customised forms in Covidence that were piloted on a sample of studies and modified accordingly before full data extraction was undertaken (Covidence 2020). If any data were unclear, or if data included children over five years of age, we attempted to contact the study authors to ask them to provide further details or to share age‐stratified data. SLH and NA extracted the data and entered them into Covidence; they then imported the data into Review Manager 5 (RevMan 5) (Review Manager 2014). SLH checked the data for accuracy.
SLH, NA, and AS resolved disagreements through discussion or through consultation with a fourth review author (SM). For this review, we aggregated study design details and findings from any duplicate or companion documents, as well as from multiple publications on a single study.
During data extraction, we recorded information regarding study design, setting, objectives and primary outcomes of the study, years the study was conducted, participants (inclusion and exclusion criteria), study methods (method of ascertaining vitamin D concentration and trial design), assessment of risk of bias, intervention information, and outcomes (see list in 'Study information' below). We recorded additional details beyond what we previously specified in our protocol (Yu 2017) (see Differences between protocol and review).
Study information
-
Identification
-
Sponsorship
-
Country
-
Setting
-
Study authors’ contact details
-
Study objectives
-
Primary outcomes measured
-
Year(s) of trial
-
-
Trial methods
-
Trial design (RCT or quasi‐RCT)
-
Vitamin D concentration quantification method
-
-
Participants
-
Inclusion criteria
-
Exclusion criteria
-
Group differences
-
Baseline characteristics
-
-
Intervention
-
Vitamin D content in IU
-
Formulation
-
Vitamin D type
-
Frequency of dosage
-
Duration of administration
-
Other micronutrient content
-
N (number) per group (in analysis)
-
Vitamin D brand/company
-
-
Comparator
-
None, placebo, other micronutrients, dosage of vitamin D
-
-
Outcomes
-
Primary and secondary outcomes (as outlined under Types of outcome measures)
-
Assessment of risk of bias in included studies
SLH, AS, and NA independently assessed the risk of bias in each included study using the certainty assessment form in Covidence (Covidence 2020), which follows Cochrane's domain‐based evaluation as described in the Cochrane Handbook for Systematic Reviews of Interventions (Higgins 2011). These domains are sequence generation; allocation concealment; blinding of participants and personnel; blinding of outcome assessors; incomplete outcome data; selective reporting bias; and other sources of bias, which we measured as whether or not the sample size was calculated, and if calculated, met at randomisation and at endpoint of the study. We categorised each domain as low, high, or unclear risk of bias, depending on the sufficiency of information to characterise the risk of bias. Disagreements were resolved by discussion. Specific assessments by domain can be found in Appendix 2.
We detail our findings in the 'Risk of bias' tables and present a narrative summary of our findings in the Risk of bias in included studies section. We also present the findings graphically.
Measures of treatment effect
Continuous outcomes
When possible, we extracted means and standard deviations (SDs) for outcome data. When studies reported means and standard errors (SEs) or means and 95% confidence intervals (CIs), we extracted these values and used the calculator in RevMan 5 (Review Manager 2014) to back‐calculate the SD using methods from the Cochrane Handbook for Sytematic Reviews of Interventions (Li 2020). This step was not included in our original protocol (Yu 2017) (see Differences between protocol and review). Some studies reported medians and interquartile ranges (IQRs) or medians and ranges, or means without variance estimates such as SDs, SEs, or 95% CIs for specific outcomes. When studies reported medians and IQRs, and the sample size per group was large (n ≥ 30), we entered the reported median as the mean in RevMan 5 (Review Manager 2014), and we treated the IQR as approximately 1.35 × SD. If the sample size was < 30, we omitted these data from the analysis. When studies reported ranges as a measure of variance, we omitted these data from the analysis per guidelines provided in the Cochrane Handbook for Systematic Reviews of Intervention (Li 2020). When a study reported only the means and no variance estimates, we omitted these data from the analysis.
We reported continuous outcomes as mean differences (MDs) with corresponding 95% CIs (Deeks 2020). Specifically, these included primary (linear growth, HAZ, or LAZ) and secondary (WAZ, WHZ, serum 25(OH)D concentration) outcomes. If trials used different scales to measure the same continuous outcome across studies, we used standardised mean differences (SMDs) with 95% CIs, when possible (Deeks 2020).
Categorical outcomes
For categorical outcomes, when possible, we presented data as measures of association (risk, rate, odds ratio with corresponding 95% CI; Deeks 2020). These included primary (stunting, adverse effects (hypercalciuria, hypercalcaemia, hyperphosphataemia)) and secondary (vitamin D status, rickets) outcomes. For dichotomous outcomes, we calculated risk ratios (RRs) for the probability of an event happening. In studies where each arm had zero events for a particular outcome that was rare (e.g. rickets), we used risk differences (RDs) to perform the meta‐analysis (Higgins 2020b). To analyse dichotomous rickets outcomes, we summarised each study’s number of participants who experienced at least one event (i.e. signs of rickets, which may have included multiple signs per participant; participants were not counted twice) as events, as a proportion of the total number of participants per group (Li 2020) (see Differences between protocol and review). For categorical vitamin D outcomes (severe serum vitamin D deficiency defined by trialists as <25 to <30 nmol/L, serum vitamin D deficiency defined as <50 nmol/L (Holick 2011), and serum vitamin D insufficiency defined as <75 nmol/L (Holick 2011), we present these outcomes as the proportion of participants achieving above these cut‐offs, specifically ≥25 to ≥30 nmol/L, ≥50 nmol/L, or ≥75 nmol/L. For these outcomes, we combined both studies which presented participants developing severe deficiency, deficiency, or insufficiency, and those achieving vitamin D status above these cut‐offs, by converting these outcomes in the former to the proportion of participants above the cut‐offs to include them in analysis.
Unit of analysis issues
For each study included in this review, we documented the unit of randomisation during data extraction. The unit of randomisation included individual participants. We also considered whether individuals had undergone more than one intervention, as in a cross‐over trial, and whether a trial reported multiple observations for the same outcome(s), including repeated measurements or recurring events.
We included two cross‐over trials, Rodd 2011 and Lava 2011, neither of which assessed any outcomes within the scope of this review. We did not identify any cluster‐randomised trials. For methods to deal with cluster‐randomised trials should we find any in future updates of this review, please see Table 2.
Studies with more than two treatment groups
For multi‐arm studies, we included only the directly relevant arms (e.g. for one particular study, we excluded arms with only intramuscular injection of vitamin D but included arms administering oral vitamin D and oral placebo or control).
When studies included more than two intervention groups, we combined groups to perform a single pair‐wise comparison. Specifically, we combined all relevant experimental groups into one group, and all relevant control intervention groups into a second group. Thus, for studies that compared dichotomous outcomes among multiple vitamin D arms and one placebo or no intervention arm, we combined the vitamin D arms into one vitamin D group by summing each arm’s number of participants and number of events into one vitamin D group, which we then compared against the original placebo group. For studies that compared dichotomous outcomes among at least three varying dosages of vitamin D, we compared the lowest dose (control) of vitamin D to the combined higher‐dosage arms of vitamin D, again by summing each arm’s number of participants and number of events into one 'higher‐dosage vitamin D' group (Higgins 2020b). For studies that compared continuous outcomes among multiple vitamin D arms and one placebo or no intervention arm, we combined the vitamin D arms into one group using formulae for combining groups available in RevMan 5 (Higgins 2020b; Review Manager 2014). For studies that compared continuous outcomes among at least three varying dosages of vitamin D, we compared the lowest dose (control) of vitamin D arm to the combined higher‐dosage arms of vitamin D. We based our approach to meta‐analysis on information provided in the Cochrane Handbook for Systematic Reviews of Interventions (Higgins 2020b).
These methods were not described in our protocol (Yu 2017), but we have added them based on the studies identified and examined; see Differences between protocol and review for more details.
Dealing with missing data
As necessary, we contacted study authors via email to ask them to share further information. If no response was received after one week, we emailed again; if again no response was received, we did not contact the authors again.
We did not impute any missing data, except we calculated SDs from IQRs when the sample size was greater than 30 per group (see Measures of treatment effect > Continuous data), and we used the calculator in RevMan 5 to convert means with 95% CIs and means with SEs into means with SDs (Review Manager 2014).
From each included study, we documented the missingness of key data and study participant information (including loss to follow‐up) in 'Risk of bias' tables. Examples of unreported data include means and SDs of study participant subgroups. We recorded attrition as part of the 'Risk of bias' assessment. Loss to follow‐up data included additional information regarding attrition and treatment adherence, or data on study participants who did not complete the trial or follow the protocol.
We considered all outcomes based on the intention‐to‐treat approach, when possible. In summarising across studies, for every outcome, the denominator represented the total number of study participants randomised to a treatment regimen (minus any participants with missing outcomes).
Assessment of heterogeneity
We quantified statistical heterogeneity across studies by using forest plots, Chi² (significance of α (alpha) = 0.10) testing, I² (≥ 75%) statistics, and Tau² values (Deeks 2020). We also considered critical differences between study designs (including study population characteristics) and risk of bias. In the event that we observed substantial heterogeneity, we considered performing prespecified subgroup analyses to gain a better understanding of the differences (Subgroup analysis and investigation of heterogeneity). For outcomes with substantial heterogeneity (according to our assessments), we did not report a pooled estimate.
Assessment of reporting biases
For each study, we checked for existence of study protocols or trial registrations published before or after reports of the study were published. We also checked that outcomes described in the methods or protocols, when available, were reported in published studies. In addition, we visually examined funnel plots for our primary outcomes to assess for bias due to missing results. We summarised these findings per each study in the Risk of bias in included studies section.
Data synthesis
Among comparable studies in this review (including similar outcomes and populations), we conducted a meta‐analysis to estimate summary measures across studies. Specifically, these included studies with outcomes reported on the same scale (or as values that could be converted or standardised). For each outcome of interest, we considered reporting both continuous and categorical values across studies; we converted data to either continuous or categorical values to facilitate comparability, as recommended by the Cochrane Handbook for Systematic Reviews of Interventions (Deeks 2020).
We conducted meta‐analysis via RevMan 5 (Review Manager 2014), and we utilised the inverse variance method. Per our protocol (Yu 2017), we conducted random‐effects meta‐analyses for outcomes with two or more studies to account for differences across study designs (including intervention dosages, durations, and frequencies, as well as study populations) (Deeks 2020). We also anticipated heterogeneity of reported time points (by reporting endpoint data, change from baseline data, etc.). For analyses including only one study, we used a fixed‐effect model, as there is no inter‐study heterogeneity (see Differences between protocol and review). In the event that we identified too few studies or study data could not be pooled, we provided a narrative description of trial results.
Summary of findings
For each primary outcome, two review authors (SLH and NA) used the GRADE approach to rate the certainty of evidence as high, moderate, low, or very low, according to the presence of the following factors: within‐study risk of bias and limitations due to study design; directness of evidence; assessment of heterogeneity between studies; precision of effect estimates; and risk of publication bias (GRADEpro GDT 2020; Guyatt 2011). We assigned a grade of high certainty to evidence from RCTs and decreased this grade by one level for each factor present, up to a maximum of three levels. In the event of disagreement, we consulted an additional review author (SM or JPP, or both), who facilitated consensus through discussion. We present the grades of evidence for primary outcomes in a GRADE 'Summary of findings' table per each comparison.
We created 'Summary of findings' tables using GRADEpro GDT 2020 and Review Manager 2014 for our main comparisons when data were available: vitamin D versus placebo or no intervention (summary of findings Table 1); vitamin D (higher dose) versus vitamin D (lower dose) (summary of findings Table 2); and higher‐dose vitamin D plus micronutrient(s) versus micronutrient(s) with lower‐dose vitamin D (summary of findings Table 3). We reported the following outcomes in each table, assessed at the end of the supplementation period, irrespective of whether or not there were data: linear growth; height‐for‐age z‐score; stunting; hypercalciuria; hypercalcaemia; hyperphosphataemia; and kidney stones. For each primary outcome, we provide the anticipated absolute or relative effect and an evidence certainty rating assessed through the GRADE approach (Guyatt 2011); a rationale for the GRADE certainty rating is provided in the table footnotes. The tables also provide information on study population, setting, outcome measurements, and timing of measurement, as well as the numbers of studies and participants included.
Subgroup analysis and investigation of heterogeneity
We did not conduct our preplanned subgroup analyses because we did not find enough studies meeting the required number (more than three) for comparison by outcome (Yu 2017).
Sensitivity analysis
We did not conduct our preplanned sensitivity analyses because we did not find enough studies meeting the required number (more than 10) for comparison by outcome (Yu 2017).
Results
Description of studies
Please see Characteristics of included studies, Characteristics of excluded studies, Characteristics of ongoing studies, and Characteristics of studies awaiting classification tables.
Results of the search
We found a total of 17,044 records (16,986 from electronic searches and 58 from other sources). After removing 5790 duplicates, we screened the remaining 11,254 unique records by title and abstract. We deemed 10,910 records to be irrelevant during screening and retrieved the full texts of the remaining 344 records for assessing eligibility.
We categorised 37 studies (80 reports) as 'Excluded'.
We identified 40 studies that included children within our age range but grouped their results with the results of children who were older than we had specified. We contacted the authors of each of these studies to request that they share age‐stratified data. The authors of five studies shared age‐stratified data; therefore we included these studies in the review (Rianthavorn 2013Sánchez‐Armendáriz 2018; Tang 2019; Thacher 2014; Trilok‐Kumar 2011).
In total, 75 studies (187 total reports) met our inclusion criteria (Criteria for considering studies for this review). Of these, 64 studies (169 reports) reported on our prespecified outcomes and were included in meta‐analyses. The remaining 11 studies did not report on any of our prespecified outcomes and therefore were not included in quantitative meta‐analysis (Alam 2011; Aly 2019; Choudhary 2012; Kislal 2008; Lava 2011; Manaseki Holland 2010; Pehlivan 2003; Rodd 2011; Saad 2015; Sarhan 2019; Singh 2019).
We categorised 33 additional studies (55 reports) as 'Ongoing' because their trial registration status indicated that recruitment was currently ongoing, or because trial recruitment was complete and study author(s) indicated that a manuscript(s) from the trial would be published in the coming months.
We categorised an additional 21 studies (22 reports) as 'Awaiting classification' because the trial registration indicated that the trial recruitment status was complete but no current or upcoming manuscript or meeting abstract could be found, or because the status of the trial was unknown. We also categorised studies that did not provide enough information to assess eligibility as 'Awaiting classification', specifically if the age group was not specified (Bantz 2015; Behnamfar 2011), or if the study design was unclear and the full‐text report could not be obtained (Hagag 2020; Özkan 2000). When we could identify contact information, we contacted the authors of all studies awaiting classification to request more information, and we kept the study categorised as 'Awaiting classification' if these attempts were unsuccessful.
We present the study selection procedure in a PRISMA diagram (Figure 1).
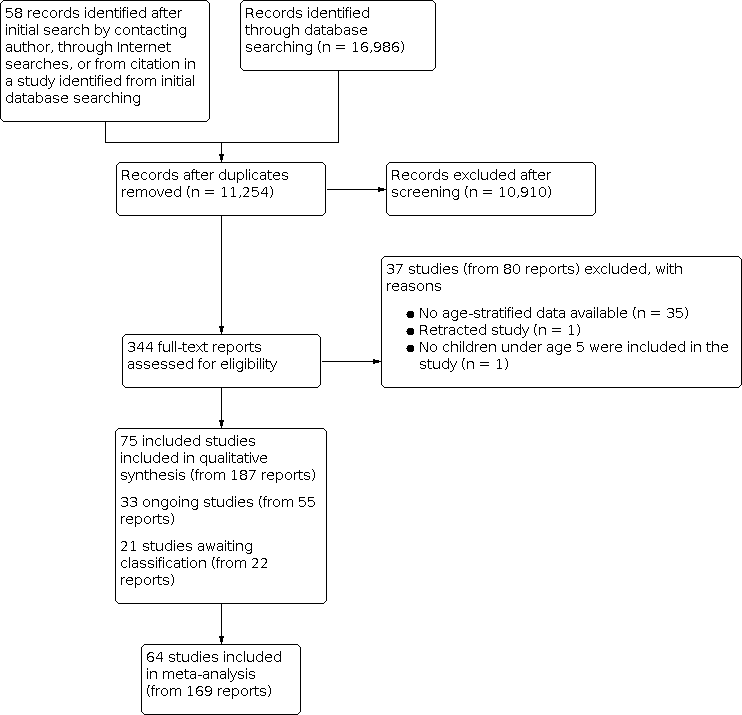
Study flow diagram.
Included studies
In total, we included in this review 75 studies (from 187 reports) with 12,122 participants. We summarise the key characteristics of these studies below. The Characteristics of included studies tables provide detailed information about the included trials in relation to the criteria prespecified in our protocol (Yu 2017). The earliest study was published in 1959 (Willi 1959), and the latest study was published in 2019 (Sarhan 2019).
Study design
Most included studies (70 studies) were parallel‐group, randomised controlled trials (RCTs). Four additional studies were quasi‐randomised controlled trials (Ala‐Houhala 1985; Holst‐Gemeiner 1978; Lagomarsino 1996; Willi 1959).
Two studies used a cross‐over design (Lava 2011; Rodd 2011), neither of which assessed any outcomes within the scope of this review. We did not find any cluster‐randomised trials.
Location/Setting
Most studies were conducted in India (14 studies), followed by the USA (10 studies), Canada (seven studies), and Finland (five studies). Four studies each took place in Egypt, Iran, and Turkey; three studies each were included from China and Germany; and two studies each were included from Afghanistan, Australia, Italy, Mexico, and Switzerland. The remaining studies reported on populations in Algeria, Austria, Bangladesh, Chile, Japan, Libya, London, Nigeria, Pakistan, Spain, and Thailand. Only six studies reported on children living at latitudes between the Tropics of Cancer (Northern Tropic) and Capricorn (Southern Tropic), and 67 studies reported on children living in latitudes outside the Tropic of Cancer or Capricorn. Two studies had multiple study sites falling both between and outside of the Northern and Southern Tropics.
A majority of studies (65 studies) were conducted in hospitals, primary care practices, or clinics, or had a point of contact in a hospital; four were run out of institutional settings (Ducharme 2019; Jensen 2016; Rao 2016; Ziegler 2014), and three reported catchment areas in cities or in areas around a hospital (Feliciano 1994; Manaseki‐Holland 2012; Specker 1992). Three studies did not report the exact setting (Rianthavorn 2013; Shajari 2009; Tomimoto 2018).
Participants
Collectively, participants at birth and up to five years of age were included. Eleven studies were conducted among both infants and children under five years of age, and nine additional studies were conducted among children older than one year. A majority of studies (55 studies) were conducted in infants younger than one year old. Four of the 55 infant studies followed up on the same participants after an extended follow‐up period without vitamin D supplementation in a subsequent report.
Baseline health status included being healthy; being preterm or (very) low birth weight, or both; having rickets; having severe acute malnutrition; having infectious diseases such as acute or recurrent otitis media, acute diarrhoea, bronchiolitis, pneumonia, or upper or lower respiratory tract infection; having non‐communicable diseases or disorders including asthma, chronic kidney disease, or chronic heart failure; or having autoimmune diseases such as juvenile idiopathic arthritis or atopic dermatitis.
Participant characteristics organised across the included studies are found in Table 3.
Interventions
Study interventions involved oral vitamin D supplementation in the form of vitamin D₃ (53 studies) or vitamin D₂ (seven studies), or did not specify the type of vitamin D involved (12 studies). Two studies involved both vitamin D₃ and vitamin D₂ (Gallo 2013a; Gordon 2008), and one study involved D₂ and calcitriol (1,25(OH)₂D₃) (Chan 1978). We grouped studies by intervention into four comparisons: (1) those that compared vitamin D to placebo or no intervention; (2) those that compared a higher dose of vitamin D to a lower dose of vitamin D; (3) those that compared a micronutrient intervention plus vitamin D to the same micronutrient intervention without vitamin D; and (4) those that compared a micronutrient intervention plus a higher dose of vitamin D to the same micronutrient intervention with a lower dose of vitamin D) (Table 1). Please see Differences between protocol and review regarding our rationale for grouping the analysis by each of the following four comparisons.
Comparison 1: vitamin D versus placebo or no intervention
Thirty‐one studies compared vitamin D to placebo or no intervention, with a total of 7327 participants. Daily dosages of vitamin D ranged from 200 IU in Ponnapakkam 2010 to 2000 IU in Tang 2019. Bolus or pharmacological doses ranged from 40,000 IU in Rianthavorn 2013 to 300,000 IU in Singh 2019, which was usually given once, at enrolment ‐ Jensen 2016; Manaseki Holland 2010; Moodley 2015; Somnath 2017 ‐ or every few weeks ‐ Rianthavorn 2013; Saleem 2018 ‐ or months ‐ Manaseki‐Holland 2012; Singh 2019. The duration of follow‐up ranged from 60 hours in Chan 1978 to 20 months in Singh 2019.
Comparison 2: vitamin D (higher dose) versus vitamin D (lower dose)
Thirty‐four studies compared regimens of higher versus lower doses of vitamin D, with a total of 4027 participants. Daily dosages of the higher dose of vitamin D ranged from 200 IU in Specker 1992 to 6000 IU in Willi 1959, compared to lower doses of vitamin D of 100 IU in Specker 1992 up to 1000 IU in Morawa 1963. Nine studies investigated the effects of administering bolus or pharmacological doses, ranging from 50,000 IU in Huynh 2017; Shajari 2009; and Shakiba 2010 to 600,000 IU in Harnot 2017; Lagomarsino 1996; and Mittal 2014, compared to a daily lower‐dose vitamin D supplementation in Holst‐Gemeiner 1978; Huynh 2017; Mittal 2014; and Zeghoud 1994 or smaller bolus doses in Harnot 2017; Mittal 2014; and Zeghoud 1994. One study administered two bolus doses of 600,000 IU at months 1 and 5 of follow‐up (Lagomarsino 1996). Duration of administration ranged from 5 to 10 minutes in an acceptability study ‐ Lava 2011 ‐ to 24 months in Rosendahl 2018. One study did not report the duration of follow‐up (Pehlivan 2003). Finally, one study examining four vitamin D intervention groups with higher or lower doses of vitamin D included micronutrient supplementation (minerals, calcium, and phosphorus) in two of the four groups; therefore data from the two arms not containing calcium and phosphorus were included in this comparison (Backström 1999b).
Comparison 3: vitamin D + micronutrient(s) versus micronutrient(s) alone
One study was included in this comparison (Thacher 2014). This study investigated effects of 50,000 IU vitamin D₂ plus calcium against a placebo and calcium, given every month, for six months, among 53 participants.
Comparison 4: vitamin D (higher dose) + micronutrient(s) versus vitamin D (lower dose) + micronutrient(s)
Nine studies, with a total of 649 participants, investigated micronutrient(s) content plus vitamin D versus the same micronutrient(s) content with or without a lower dose of vitamin D (Alizadeh 2006; Alizadeh Taheri 2014; Backström 1999b; Evans 1989; Gordon 2008; Mathur 2016; Mittal 2018; Rao 2016; Tergestina 2016). Six studies compared daily vitamin D supplementation, ranging between 400 IU in Alizadeh Taheri 2014 and 2000 IU in Evans 1989 to a daily lower dose of vitamin D, ranging between 200 IU in Alizadeh Taheri 2014 and 2000 IU in Gordon 2008. Daily supplementation of 4000 IU in Rao 2016 or 2000 IU in Gordon 2008 was compared to weekly supplementation of 30,000 IU in Rao 2016 or 50,00 IU in Gordon 2008, respectively. A bolus dose (300,000 IU) was compared to 90,000 IU, both given once, at enrolment (Mittal 2018). Duration of follow‐up ranged from 51 days in Tergestina 2016 to 9 months in Rao 2016. Finally, one study examining four vitamin D groups with higher or lower doses of vitamin D included calcium and phosphorus supplementation in two of the four arms; therefore data from the two groups containing calcium and phosphorus supplementation were included in this comparison (Backström 1999b). Micronutrients administered in these studies mainly included minerals such as calcium (all studies), phosphorus (Alizadeh 2006; Alizadeh Taheri 2014; Backström 1999b; Mathur 2016; Tergestina 2016), and/or a multi‐vitamin (Mathur 2016; Tergestina 2016).
Outcomes
Primary outcomes
Thirty‐one studies included a primary outcome. Of these, 14 evaluated linear growth (Anderson‐Berry 2017; Backström 1999a; Backström 1999b; Chandy 2016; Gallo 2013b; Greer 1981; Greer 1989; Holmlund‐Suila 2012; Huynh 2017; Lagomarsino 1996; Natarajan 2014; Siafarikas 2011; Singh 2018a; Trilok‐Kumar 2011). Three reported on height‐for‐age z‐scores (HAZ) (Gallo 2013a; Gallo 2013b; Trilok‐Kumar 2011), and one reported on stunting (Trilok‐Kumar 2011). We found 29 studies reporting adverse effects (hypercalciuria, hypercalcaemia, hyperphosphataemia, and/or kidney stones).
Linear growth
Linear growth (length) was measured using infantometers or infant length boards (Greer 1981; Greer 1989; Chandy 2016; Singh 2018a), wall‐mounted stadiometer (Thacher 2014), clinical charts (Backström 1999a; Backström 1999b), or standardised calibrated equipment (Siafarikas 2011), in centimetres; several studies did not specify what type of equipment was used to measure length (Anderson‐Berry 2017; Holmlund‐Suila 2012; Huynh 2017; Lagomarsino 1996; Natarajan 2014).
Length/height‐for‐age and stunting
Height‐for‐age was measured using the WHO Child Growth Standards, with stunting defined as HAZ less than 2 standard deviations (SDs) below the WHO reference standard (WHO 2006). Linear growth for calculation of HAZ was measured using infantometers or infant length boards (Gallo 2013b; Trilok‐Kumar 2011), or it was not described (Gallo 2013a).
Adverse effects
Hypercalciuria
Hypercalciuria was measured using the urinary calcium‐to‐creatinine ratio. Urinary calcium was assayed by Beckman Coulter assay (Bozkurt 2017; Gallo 2013b; Natarajan 2014), photometric assay (Holmlund‐Suila 2012), or DiasSorin Auto Analyzer (Mittal 2018); colorimetrically using o‐cresol phthalein complexone (Pointe Scientific) (Shajari 2009), chemiluminescence (VitrosEci) (Singh 2018a), complexometric method with ethylenediaminetetraacetic acid (calcium), and the kinetic Jaffé reaction (creatinine) (Evans 1989); or by clinical chemistry analyser (Harnot 2017), urine spot (Tergestina 2016), or standard assays without further detail (Siafarikas 2011; Zeghoud 1994). Two studies did not specify which assay was used (Ducharme 2019; Gallo 2013a). Studies defined hypercalciuria as urinary calcium‐to‐creatinine ratio greater than 2.2 mmol/mmol (Holmlund‐Suila 2012); greater than 1.25 mmol/mmol (for one‐to‐two‐year‐olds) or > 1 mmol/mmol (for two‐to‐five‐year‐olds) (Ducharme 2019; Jensen 2016; Mittal 2018); > 0.8 mg/mg (Natarajan 2014); > 1.35 mg/mg (Tergestina 2016); > 0.21 mmol/mmol (Shajari 2009); or > 0.86, 0.6, and 0.4 for children < 7 months old, 7 to 18 months old, and 19 months to 6 years old, respectively (Harnot 2017); or did not define hypercalciuria (Bozkurt 2017; Gallo 2013a; Gallo 2013b; Siafarikas 2011; Singh 2018a).
Hypercalcaemia
Hypercalcaemia was measured using total serum calcium. Total serum calcium was assayed by the Beckman Coulter assay (Anderson‐Berry 2017; Hanson 2011; Huynh 2017; Natarajan 2014), randox (Chandy 2016), atomic absorption spectroscopy (Chan 1978), a multi‐channel analyser (Roche Diagnostics) (Gordon 2008), Dimension RxL Max clinical chemistry analyser (Harnot 2017), photometric assays (Holmlund‐Suila 2012), DiasSorin Auto Analyzer (Mittal 2018), flex gas analysers (Rosendahl 2018), spectrophotometric methods (Tergestina 2016), 'standard methods' without further detail (Siafarikas 2011; Zeghoud 1994), or ethylene glycol tetra‐acetic acid titration (Robinson 1981), or colorimetrically using o‐cresol phthalein complexone (Pointe Scientific) (Ziegler 2014). Six studies did not report the assay or method used (Aglipay 2017; Ducharme 2019; Gallo 2013a; Hibbs 2018; Mittal 2014; Shakiba 2010). Studies defined hypercalcaemia as total serum calcium > 10.5 mg/dL (Chan 1978; Chandy 2016), > 10.7 mg/dL (Hibbs 2018), > 10.8 mg/dL (Gupta 2016; Mittal 2014; Mittal 2018; Tergestina 2016), or > 11.2 mg/dL (Zeghoud 1994), or did not define hypercalcaemia (Aglipay 2017; Anderson‐Berry 2017; Gallo 2013b; Gordon 2008; Hanson 2011; Holmlund‐Suila 2012; Huynh 2017; Natarajan 2014; Robinson 1981; Rosendahl 2018; Siafarikas 2011; Shakiba 2010; Ziegler 2014).
Hyperphosphataemia
Hyperphosphataemia was measured using serum phosphorus. Methods for hyperphosphataemia were done using "standard assays" (Siafarikas 2011), or it was indicated that they were carried out at the study's clinical chemistry laboratory and otherwise not detailed (Aglipay 2017; Hibbs 2018). Only one study defined hyperphosphataemia as serum phosphorus > 9.5 mg/dL (3.07 mmol/L) (Hibbs 2018).
Kidney stones
Kidney stones were assessed using renal ultrasonography (Abdel‐Hady 2019; Singh 2018a), or methods were not reported (Natarajan 2014).
Secondary outcomes
Gain in length
Gain in length was reported by three studies (Feliciano 1994; Mathur 2016; Ziegler 2014). Length was assessed using an infantometer (Mathur 2016), or standardised methods were used (Ziegler 2014). In one study, the method of measurement was not described (Feliciano 1994).
Weight‐for‐age and weight‐for‐height/length
Four studies reported on weight‐for‐age and weight‐for‐height/length (Gallo 2013a; Gallo 2013b; Saleem 2018; Trilok‐Kumar 2011). Weight‐for‐age z‐score (WAZ) and weight‐for‐height/length z‐scores (WHZs) were measured using the WHO Child Growth standards (WHO 2006). Weight was measured using infant weighing scales (Gallo 2013b; Saleem 2018; Trilok‐Kumar 2011); in one study, the method of measurement was not reported (Gallo 2013a). Height/length was measured using a wall‐mounted stadiometer or infant length board (Gallo 2013b; Saleem 2018; Trilok‐Kumar 2011). Recumbent length was measured among participants under two years of age, and standing height was measured when the child was over two years of age. One study reported on both underweight and wasting (Trilok‐Kumar 2011).
Serum 25(OH)D concentration
Fifty‐nine studies reported on vitamin D status (continuously or categorically in terms of deficiency or insufficiency versus sufficiency). Vitamin D status was measured using chemiluminescence protein‐binding assay via the Cobase analyser kit with Elecsys Vitamin D Total Assay (Roche Diagnostics Ltd.) or automated immunoassay (IDS‐iSYS, Immunodiagnostic System Ltd.) (CLPBA) (Gallo 2013a; Holmlund‐Suila 2012; Manaseki‐Holland 2012; Mittal 2018; Natarajan 2014; Ponnapakkam 2010; Rosendahl 2018; Rueter 2019); competitive protein‐binding assay (CPBA) (Aglipay 2017; Ala‐Houhala 1985; Greer 1981; Mathur 2016; Robinson 1981; Specker 1992; Stögmann 1985; Zeghoud 1994); electro‐chemiluminescent assay (EIA) (Alizadeh Taheri 2014; Fort 2016; Gallo 2013b; Harnot 2017; Sánchez‐Armendáriz 2018; Somnath 2017); liquid chromatography with tandem mass spectrometry (LC‐MS/MS) (Anderson‐Berry 2017; Bozkurt 2017; Ducharme 2019; Gallo 2013a; Gallo 2013b; Huynh 2017; Jensen 2016; Moodley 2015; Saleem 2018; Thacher 2014); high‐performance liquid chromatography (HPLC) (Atas 2013; Backström 1999a; Backström 1999b; Greer 1989; Tang 2019); enzyme‐linked immunoabsorbent assay (ELISA) (Abdel‐Hady 2019); immunoassay (Hibbs 2018); radioimmunoassay (RIA) (Chan 1978; Chandy 2016; Evans 1989; Gallo 2013b; Gupta 2016; Hanson 2011; Holst‐Gemeiner 1978; Mittal 2014; Shedeed 2012; Siafarikas 2011; Trilok‐Kumar 2011; Ziegler 2014); and chemiluminescent assay (CLIA) (Gordon 2008; Marchisio 2013; Principi 2013; Rao 2016; Rianthavorn 2013; Shakiba 2010; Singh 2018a; Tergestina 2016). As shown, Gallo 2013a evaluated vitamin D concentration using two assays (CLPBA and LC‐MS/MS), and Gallo 2013b evaluated vitamin D concentration using three different assays (EIA, RIA, and LC‐MS/MS). One study did not report the vitamin D assay method used (Tomimoto 2018).
Rickets
Fourteen studies reported on rickets (Ala‐Houhala 1985; Alizadeh 2006; Chandy 2016; Greer 1981; Huynh 2017; Mittal 2014; Mittal 2018; Morawa 1963; Ponnapakkam 2010; Robinson 1981; Siafarikas 2011; Specker 1992; Thacher 2014; Willi 1959).
We observed variation across 15 studies in the trial definitions of 'rickets', which was one of our secondary outcomes. Definitions of rickets as a dichotomous outcome across these studies included biochemical concentrations (measured by serum calcium, phosphorus, magnesium, and alkaline phosphatase; thresholds unspecified) (Ala‐Houhala 1985); wide fontanelles, not defined (Huynh 2017), or defined as > 3 × 3 cm (Alizadeh 2006); craniotabes score, using a size‐based scale (Morawa 1963), or the rate of craniotabes, undefined (Huynh 2017); X‐ray changes, defined as fractures in the left‐hand radiograph (Alizadeh 2006), or presentation of florid changes (Morawa 1963); clinical signs, defined as a combination of rachitic rosary, craniotabes, or widened wrists (Greer 1981); radiological scores > 0 (Mittal 2014; Mittal 2018); widened epiphyses or limb deformities, undefined (Huynh 2017); combinations of signs, such as elevated alkaline phosphatase and evidence of X‐ray changes (Ponnapakkam 2010), or concavity and fraying of bone, widening of epiphyses (Specker 1992); radiological evidence, not defined (Robinson 1981); and clinical signs, including appearing translucent, pale, flushed, or showing failure (translated from German; Willi 1959). Two studies also reported symptoms of rickets as a continuous outcome, including mean radiographic score (Thacher 2014), median radiographic score (Evans 1989), and median anterior fontanelle size (Chandy 2016); these studies did not share the same control group (Chandy 2016 used placebo, and Evans 1989 and Thacher 2014 used a lower dose of vitamin D).
Missing data
We contacted study authors for additional information on included studies, as needed; most requests involved author sharing of age‐stratified data to include only children under five years of age in the results. We also asked study authors to send us a full‐text publication citation, if existing, of any meeting abstracts that we found, or to share unpublished data that could be incorporated into our analysis, if relevant.
In summary, we obtained a positive response (i.e. study authors shared specific information, published or unpublished data, or results) for nine studies (Aglipay 2017; Ponnapakkam 2010; Rianthavorn 2013; Rueter 2019; Sánchez‐Armendáriz 2018; Tang 2019; Thacher 2014; Trilok‐Kumar 2011; Ziegler 2014).
Funding sources
Studies were funded by a variety of sources, namely, non‐profit funding. Two studies reported provision of the drug by the manufacturer, along with non‐profit funding (Gallo 2013a; Huynh 2017). Two studies reported for‐profit funding (Rodd 2011; Tomimoto 2018). Two studies were categorised as mixed funding (non‐profit and for‐profit funding) (Chan 1978; Greer 1981). Five studies specifically reported no funding (Bozkurt 2017; Choudhary 2012; Lava 2011; Mittal 2018; Sarhan 2019), and 26 studies did not disclose funding sources. The remaining studies were funded by non‐profit sources. Information on specific funding sources may be found in the Characteristics of included studies tables.
Excluded studies
We excluded 37 studies (80 reports) for the following reasons: for 35 studies, no stratified data were available for population age group (which included children over five years of age), after contact with the study author; one study was retracted (Saad 2018); and one study's author indicated that no children under age five years were included in the study (Swangtrakul 2020). We considered conducting a sensitivity analysis including the studies from which we were unable to obtain age‐stratified data using a threshold of children under the age of five years constituting ≥ 80% of the study population, based on descriptive statistics presented for the whole population; however, no study appeared to meet this criterion, or studies did not present variance estimates, limiting our inference. As such, these studies have not been included in the review meta‐analyses. Further details may be found in the Characteristics of excluded studies tables.
Reasons for negative responses from study authors included not enough time to re‐analyse the data; most children were ineligible (over five years of age); data were unavailable; or no response was received to our follow‐up email after an initial positive response (see Characteristics of excluded studies).
Ongoing studies
We identified 33 ongoing studies (from 55 reports). These studies were registrations for trials for which no full‐text publication was identified, recruitment was currently ongoing, or trial recruitment was complete and study author(s) indicated that a manuscript(s) from a trial would be published in the coming months. We present a brief overview of these studies below. Further details may be found in the Characteristics of ongoing studies.
Study design
Ongoing studies included 32 parallel‐group RCTs and one cross‐over RCT (RBR‐4r6p5v).
Location/Setting
The studies are being conducted in India (nine studies), Canada (six studies), USA (three studies), Chile (two studies), and Poland (two studies), and one study a piece is being conducted in Australia, Brazil, China, France, Indonesia, Iran, Israel, Japan, Saudi Arabia, and Spain. An additional study is being conducted across three countries: Austria, Canada, and Chile.
Settings include hospitals (10 studies), intensive care units (two studies), clinics (one study), and a university medical centre (one study), or the setting has not been reported (19 studies).
Participants
Studies included or aimed to include infants and children. Studies among infants (12 studies) included healthy (5 studies), small‐for‐gestational‐age (1 study), preterm (5 studies), and low birth weight (2 studies) populations (with some overlap present). Studies among children (12 studies) included populations that were healthy (5 studies), or had asthma (1 study), atopic dermatitis (1 study), epilepsy (1 study), chronic kidney disease (1 study), Crohn's disease (1 study), or vitamin D deficiency plus low energy fracture (1 study). Several studies among children included only children over five age years of age (seven studies). Studies among both infants and children (nine studies) included populations that were healthy (two studies), or had rickets (two studies), cyanotic congenital heart disease (one study), vitamin D deficiency (two studies), lower respiratory tract infection (one study), or chronic heart disease requiring surgery (one study). Of these, five studies included children over the age of five years.
Interventions
Please see Differences between protocol and review regarding our rationale for grouping the analysis by each of the following four comparisons.
Comparison 1: vitamin D versus placebo or no intervention
Sixteen studies examined vitamin D versus placebo or no intervention. Doses ranged from 400 IU in ACTRN12614000334606/NCT02112734; CTRI/2013/04/003566; CTRI/2015/08/006132; UMIN000034864; and NCT01363167 to 100,000 IU in NCT03365687. Duration ranged from six weeks in NCT01996423 to one year in ACTRN12616000659404; and Galdo 2018, with one study not reporting the duration of follow‐up (CTRI/2017/12/010827).
Comparison 2: vitamin D (high dose) versus vitamin D (low dose)
An additional 16 studies examined a high dose of vitamin D versus a lower dose of vitamin D. As a note, one study examined two different dosages of vitamin D versus placebo; therefore it is applicable to both comparison 1 and comparison 2 (NCT02046577). Doses ranged from 400 IU in NCT02563015 to 150,000 IU in CTRI/2018/12/016760 in the higher‐dose group, and from 400 IU in NCT02563015 to 4000 IU in CTRI/2018/12/016760 in the lower‐dose group. Duration ranged from three weeks in CTRI/2018/04/013300 to three years in NCT02563015.
As a note, one additional study examined two interventions: 5600 IU vitamin D₃ versus 11,200 IU vitamin D₃, compared to placebo; as such, in a future version of this review, we may include this study in both comparison 1 and comparison 2 and analyse the study arms accordingly (comparison 1: 5600 IU D₃ versus placebo and 11,200 IU D₃ versus placebo; comparison 2: 5600 IU D₃ versus 11,200 IU D₃) (NCT02046577).
Comparison 3: vitamin D + micronutrient(s) versus micronutrient(s) alone
No studies are assessing this comparison.
Comparison 4: vitamin D (high dose) + micronutrient(s) versus vitamin D (low dose) + micronutrient(s)
One study was included in this comparison (IRCT20171030037093N4). This study investigated the effects of 300 IU vitamin D and an additional 400 IU vitamin D plus vitamin A, against 300 IU vitamin D and vitamin A, until 40 weeks' postmenstrual age.
Outcomes
Primary outcomes
Five studies listed "growth" (linear growth) in their protocol as an outcome (CTRI/2013/04/003566; CTRI/2015/08/006132; Galdo 2018; NCT03742310; NCT01363167). Eleven studies listed adverse effects (hypercalcaemia, hypercalciuria, and/or kidney stones) as outcomes of interest (CTRI/2017/11/010385; CTRI/2017/12/010827; CTRI/2018/12/016760; Galdo 2018; NCT03365687; NCT03536845; NCT03087149; NCT02452762; NCT01838447; NCT03742505; NCT01363167).
Secondary outcomes
Twenty‐five studies listed examining mean 25(OH)D concentrations, or changes in and/or achieving sufficiency. Although nine ongoing studies included serum calcium, urinary calcium, serum phosphorus, the urinary calcium‐to‐creatinine ratio, or adverse events/effects, they did not specifically list measuring hypercalciuria, hypercalcaemia, hyperphosphataemia, or kidney stones specifically as adverse effects.
Missing data
We contacted the authors of the trial registrations for additional information, including asking the authors to confirm a full‐text publication of any meeting abstracts found, or to share unpublished data that we could cite (see Characteristics of ongoing studies tables for details).
Funding sources
Fourteen studies were funded by non‐profit entities; one study was funded by a non‐profit organisation plus the company provided the drug; one study received no funding; and one study was funded by a for‐profit entity. The remaining 16 studies did not disclose funding sources.
Studies awaiting classification
We categorised an additional 21 studies (22 reports) as 'Awaiting classification' if the trial registration indicated that the trial recruitment status was complete but no current or upcoming manuscript or meeting abstract could be found, or if the status of the trial was unknown. We also categorised studies that did not provide enough information to assess eligibility as 'Awaiting classification', specifically, if the age group was not specified (Bantz 2015; Behnamfar 2011), or if the study design was unclear and the full‐text report could not be obtained (Hagag 2020; Özkan 2000). When we could identify contact information, we contacted the authors of all studies awaiting classification to ask for more information, and we kept the study categorised as 'Awaiting classification' if these attempts were unsuccessful. See Characteristics of studies awaiting classification for more information.
Risk of bias in included studies
Below, we summarise the results of our 'Risk of bias' assessment. Further details can be found in the 'Risk of bias' tables, beneath the Characteristics of included studies tables. Figure 2 and Figure 3 provide graphical summaries of the 'Risk of bias' assessment.

Risk of bias graph: review authors' judgements about each risk of bias item presented as percentages across all included studies.

Risk of bias summary: review authors' judgements about each risk of bias item for each included study.
Allocation
Included studies were individually randomised or block‐randomised controlled trials.
Sequence generation
We determined that 37 studies had adequate sequence generation and subsequently rated them at low risk of bias. Methods included computer‐based random number generators, such as random number tables, or Statiscal Analysis Software (SAS) procedures (31 studies); websites such as www.randomization.com and www.randomizer.org (four studies: Gallo 2013a; Moodley 2015; Rodd 2011; Rueter 2019); and the low‐tech technique of coin flips (two studies: Evans 1989; Thacher 2014). Seven studies reported inadequate methods of sequence generation due to employing alternating randomisation and therefore were rated at high risk of bias (Holst‐Gemeiner 1978; Lagomarsino 1996; Morawa 1963; Pehlivan 2003; Siafarikas 2011; Singh 2019; Willi 1959). The remaining 31 studies reported that groups were randomly allocated but did not provide details on how the randomisation sequence was generated and therefore were rated at unclear risk of bias.
Allocation concealment
We judged 37 studies to have adequate allocation concealment and thus low risk of bias, 14 studies to have inadequate methods of allocation concealment and therefore high risk of bias, and 24 studies to have unclear methods of allocation concealment and unclear risk of bias. The 14 studies with inadequate allocation concealment included studies in which allocation concealment was not described and the varying dosages/frequencies would indicate the allocation given (Atas 2013; Feliciano 1994; Gordon 2008; Holst‐Gemeiner 1978; Lagomarsino 1996; Ponnapakkam 2010; Rianthavorn 2013; Rodd 2011; Singh 2019; Tang 2019; Willi 1959); one study in which the types of interventions would indicate allocation, which included two study arms that were administered intramuscular vitamin D (Morawa 1963); one study in which parents were directly told the allocation (Chan 1978); and one study that used odd‐ and even‐numbered envelopes to allocate the intervention (Siafarikas 2011). The 24 studies with unclear risk of bias generally did not describe their allocation concealment procedures in enough detail to allow a judgement on their risk of selection bias.
Blinding
Twenty‐four studies were described as 'double‐blind' or appeared so, three studies were described as 'single‐blind' (Lava 2011; Principi 2013; Rao 2016), and 12 studies were specifically not blinded (i.e. 'open label') (Alonso 2011; Huynh 2017; Mittal 2014; Singh 2018a; Singh 2019; Somnath 2017; Stögmann 1985; Tang 2019; Thacher 2014; Tomimoto 2018; Willi 1959; Zeghoud 1994). Thirty‐seven studies had partial or non‐described blinding. One study was triple‐blind (Ducharme 2019).
Blinding of participants and staff (performance bias)
Many studies did not describe blinding, or were blinded only to staff and not parents, leading us to judge 39 studies as having high risk of performance bias. We judged 35 studies to be at low risk of bias as they either were double‐blind or were blinded to staff with likely blinding to parents of participants (even if not stated explicitly). We considered one study, Gallo 2013a, to have unclear risk of performance bias due to lack of description of blinding, but because of adequate allocation concealment, participants and staff were likely blinded.
Blinding of outcome assessors (detection bias)
We judged 33 studies to be at high risk of detection bias due to lack of description and the subjective nature of outcomes. We rated 37 studies at low risk of detection bias due to explicit mention of blinding to outcome assessors or mention of double‐blinding. We judged five studies to be at unclear risk of detection bias due to lack of a specific description but likely blinded due to the mention of a "double‐blind" study design (Evans 1989; Greer 1981; Rosendahl 2018; Saad 2015; Sarhan 2019).
Incomplete outcome data
We judged 16 studies to be at high risk of attrition bias, 34 at low risk of attrition bias, and 25 at unclear risk of attrition bias. Reasons for high risk of attrition bias included lack of reporting on the number of participants at randomisation compared to endpoint (Alizadeh 2006); high loss to follow‐up (Chandy 2016; Greer 1989; Mittal 2014); participants lost to follow‐up not examined for differences from those who were included (Alonso 2011; Feliciano 1994; Ponnapakkam 2010); reasons for loss to follow‐up not given, not compared by arm, or both (Alizadeh 2006; Atas 2013; Feliciano 1994; Greer 1989; Kislal 2008; Mittal 2018; Moodley 2015; Ponnapakkam 2010); outcomes reported at an intermediate study time point but not at the end of full follow‐up (Abdel‐Hady 2019); or use of complete case or per‐protocol analysis instead of intent‐to‐treat analysis (Backström 1999a; Chandy 2016; Greer 1989; Kislal 2008; Mittal 2018; Moodley 2015; Ponnapakkam 2010; Rao 2016; Shakiba 2010; Specker 1992). Reasons for low risk of bias included indistinguishable interventions/comparators; all randomised participants completing follow‐up or no missing data; reasons for missing data not related to the outcome (e.g. moving away); missing data balanced across groups and similar reasons; small proportion of missing data; and intention‐to‐treat analysis conducted, including all participants randomised. We assigned a judgement of unclear risk of bias when insufficient information was available to reach a judgement of high or low risk of bias.
Selective reporting
We considered most studies (50 studies) to be at unclear risk of reporting bias, as no study protocols or trial registration identifiers were reported (see Risk of bias in included studies), or a trial registration was found online but appeared to have been published after the study was completed. We judged two studies to be at high risk of bias because the methods sections mentioned measuring growth (Alonso 2011), or referred to specific biochemical parameters (Backström 1999a), but these measures were not reported in the results section; in addition, neither study had a published protocol or trial registration.
We judged 23 studies to be at low risk of bias because they had a protocol pre‐registered on a trial registry, or because they cited a published study protocol that proposed measuring the outcomes presented in the published study (Aglipay 2017; Rosendahl 2018).
Also, for each comparison, we visually inspected funnel plots to assess for bias due to missing results in our primary outcomes; we did not observe bias due to missing results.
Other potential sources of bias
We did not observe any other potential sources of bias in these studies and therefore rated all studies at low risk of bias on this domain.
Effects of interventions
See: Summary of findings 1 Vitamin D versus placebo or no intervention; Summary of findings 2 Vitamin D (higher dose) versus vitamin D (lower dose); Summary of findings 3 Vitamin D (higher dose) + micronutrient(s) versus vitamin D (lower dose) + micronutrient(s)
Please see Differences between protocol and review regarding our rationale for grouping the analysis by each of the following four comparisons.
Please see Table 4 for the results of sensitivity analyses conducted with fixed‐effect models for outcomes including at least two studies in the comparison.
| Results of sensitivity analysis with fixed‐effect model | |||||
|---|---|---|---|---|---|
| Comparison 1: vitamin D vs placebo or no intervention | Number of studies | Mean difference (95% CI) | Chi² | P value for overall effect | I²(%) |
| Linear growth (Analysis 1.1) | 3 | 0.73 (0.01 to 1.45) | 3.96 | 0.05 | 49 |
| Adverse effect: hypercalciuria (Analysis 1.4) | 2 | 2.03 (0.28 to 14.67) | 0.63 | 0.48 | 0 |
| Adverse effect: hypercalcaemia (Analysis 1.5) | 2 | 0.79 (0.43 to 1.44) | 1.93 | 0.44 | 48 |
| Weight‐for‐height (z‐score) (Analysis 1.8) | 2 | 0.06 (‐0.06 to 0.19) | 13.61 | 0.33 | 93 |
| Serum 25(OH)D (Analysis 1.10) | 21 | 25.04 (23.10 to 26.98) | 369.62 | < 0.001 | 95 |
| Change in 25(OH)D (Analysis 1.11) | 3 | 34.09 (28.90 to 39.28) | 17.35 | < 0.001 | 88 |
| Vitamin D sufficiency (≥ 50 nmol/L) (Analysis 1.12) | 6 | 1.88 (1.66 to 2.14) | 6.25 | < 0.001 | 20 |
| Vitamin D sufficiency (≥ 75 nmol/L) (Analysis 1.13) | 2 | 2.47 (1.50 to 4.06) | 11.30 | 0.0004 | 91 |
| Vitamin D severe deficiency (Analysis 1.14) | 3 | 0.26 (0.19 to 0.36) | 1.68 | < 0.001 | 0 |
| Comparison 2: vitamin D (higher dose) vs vitamin D (lower dose) | Number of studies | Mean difference (95% CI) | Chi² | P value for overall effect | I²(%) |
| Linear growth (Analysis 2.1) | 5 | ‐0.75 (‐1.33 to ‐0.17) | 13.64 | 0.01 | 71 |
| Length/height‐for‐age (z‐score) (Analysis 2.2) | 2 | 0.40 (‐0.06 to 0.86) | 0.04 | 0.09 | 0 |
| Adverse effect: hypercalciuria (Analysis 2.3) | 6 | 1.16 (1.00 to 1.35) | 1.88 | 0.06 | 0 |
| Adverse effect: hypercalcaemia (Analysis 2.4) | 5 | 1.39 (0.89 to 2.18) | 2.16 | 0.15 | 0 |
| Linear growth: gain in length (Analysis 2.5) | 3 | ‐0.01 (‐0.02 to 0.00) | 0.68 | 0.06 | 0 |
| Weight‐for‐age (z‐score) (Analysis 2.6) | 2 | 0.07 (‐0.44 to 0.58) | 0.01 | 0.78 | 0 |
| Serum 25(OH)D (Analysis 2.8) | 20 | 14.73 (13.24 to 16.22) | 493.04 | < 0.001 | 96 |
| Change in 25(OH)D (Analysis 2.9) | 3 | 1.68 (‐1.08 to 4.43) | 3.67 | 0.23 | 46 |
| Vitamin D sufficiency (≥ 50 nmol/L) (Analysis 2.10) | 12 | 1.02 (1.00 to 1.03) | 17.24 | 0.008 | 42 |
| Vitamin D sufficiency (≥ 75 nmol/L) (Analysis 2.11) | 6 | 1.25 (1.18 to 1.31) | 8.05 | < 0.001 | 38 |
| Rickets (Analysis 2.13) | 4 | 0.64 (0.46 to 0.90) | 1.24 | 0.009 | 0 |
| Comparison 4: vitamin D (higher dose) + micronutrient(s) vs vitamin D (lower dose) + micronutrient(s) | Number of studies | Mean difference (95% CI) | Chi² | P value for overall effect | I²(%) |
| Adverse effect: hypercalcaemia (Analysis 4.3) | 2 | 1.00 (0.90 to 1.11) | 0 | 1.00 | 0 |
| Serum 25(OH)D (Analysis 4.5) | 5 | 25.91 (20.50 to 31.32) | 112.69 | < 0.001 | 96 |
| Vitamin D sufficiency (≥ 75 nmol/L) (Analysis 4.7) | 3 | 1.13 (0.97 to 1.31) | 25.65 | 0.12 | 92 |
| Rickets (Analysis 4.8) | 2 | 1.23 (0.24 to 6.30) | 0.43 | 0.80 | 0 |
CI: confidence interval.
Serum 25(OH)D: serum 25‐hydroxyvitamin D.
Comparison 1: vitamin D versus placebo or no intervention
Primary outcomes
Please see summary of findings Table 1. All outcomes were measured at the end of the intervention, with average time frames ranging from 6 to 7.5 months.
Linear growth
There is little to no difference between vitamin D and placebo or no intervention in linear growth (mean difference (MD) 0.66 cm, 95% confidence interval (CI) ‐0.37 to 1.68; 3 studies, 240 participants; I² = 49%; tau² = 0.41; random‐effects model; Analysis 1.1; low‐certainty evidence). The results were similar with a fixed‐effect model (Table 4).
Length/height‐for‐age (L/HAZ)
Compared to placebo or no intervention, vitamin D may improve length/height‐for‐age z‐score (L/HAZ) scores (MD 0.11, 95% CI 0.001 to 0.22; 1 study, 1258 participants; fixed‐effect model; Analysis 1.2; moderate‐certainty evidence).
Stunting
Some evidence suggests that, compared to placebo or no intervention, vitamin D has little to no effect on stunting (risk ratio (RR) 0.90, 95% CI 0.80 to 1.01; 1 study, 1247 participants; fixed‐effect model; Analysis 1.3; moderate‐certainty evidence).
Adverse effects
Hypercalciuria
Insufficient evidence suggests that, compared to placebo or no intervention, vitamin D has an effect on the incidence of hypercalciuria (RR 2.03, 95% CI 0.28 to 14.67; 2 studies, 68 participants; I² = 0%; tau² = 0.0; random‐effects model; Analysis 1.4; moderate‐certainty evidence). The results were similar with a fixed‐effect model (Table 4).
Hypercalcaemia
Compared to placebo or no intervention, we are uncertain whether vitamin D supplementation has an effect on the incidence of hypercalcaemia, as the certainty of the evidence was very low (RR 0.82, 95% CI 0.35 to 1.90; 2 studies, 367 participants; I² = 48%; tau² = 0.18; random‐effects model; Analysis 1.5). The results were similar with a fixed‐effect model (Table 4).
No study included in this comparison measured the following primary outcomes: hyperphosphataemia and kidney stones.
Secondary outcomes
Weight‐for‐age (WAZ)
Insufficient evidence suggests that, compared to placebo or no intervention, vitamin D has an effect on mean WAZ scores (MD 0.09, 95% CI −0.02 to 0.20; 1 study, 1273 participants; fixed‐effect model; Analysis 1.6).
Underweight
Insufficient evidence suggests that, compared to placebo or no intervention, vitamin D has an effect on differences in the proportion of underweight children between groups (RR 0.94, 95% CI 0.80 to 1.11; 1 study, 1282 participants; fixed‐effect model; Analysis 1.7).
Weight‐for‐length/height (WL/HZ)
Insufficient evidence suggests that, compared to placebo or no intervention, vitamin D has an effect on WL/HZ score between intervention arms (MD 0.65, 95% CI −0.67 to 1.97; 2 studies, 1442 participants; I² = 93%; tau² = 0.84; random‐effects model; Analysis 1.8). The results were similar with a fixed‐effect model (Table 4).
Wasting
Insufficient evidence suggests that, compared to placebo or no intervention, vitamin D has an effect on differences in the proportion of wasted children between groups (RR 1.25, 95% CI 0.82 to 1.91; 1 study, 1282 participants; fixed‐effect model; Analysis 1.9)
Vitamin D status
Continuous 25(OH)D concentration (nmol/L)
Across 21 studies, children receiving vitamin D had higher serum 25(OH)D concentrations than children receiving placebo or no intervention (MD 30.91 nmol/L, 95% CI 21.82 to 40.00; 21 studies, 2202 participants; I² = 95%; tau² = 385.1; random‐effects model; Analysis 1.10). The results were similar with a fixed‐effect model (Table 4). We explored possible reasons for the high heterogeneity observed across studies, including analysis of studies examining physiological doses of vitamin D only; infants only; and children only (Table 5). We found that limiting the included studies to physiological doses of vitamin D and studies done in infants did not decrease inter‐study heterogeneity (I² = 95% for both analyses), but analysing only children over one year of age decreased inter‐study heterogeneity to I² = 87%.
| Serum 25(OH)D (nmol/L) (Analysis 1.10 ) | ||||||
|---|---|---|---|---|---|---|
| Category | Number of studies | Mean difference (95% CI) | Tau² | Chi² | P value | I²(%) |
| All studies | 20 | 30.91 (21.82 to 40.00) | 385.01 | 369.62 | < 0.001 | 95 |
| Physiological doses only | 15 | 31.00 (20.31 to 41.68) | 388.92 | 306.64 | < 0.001 | 95 |
| Infants only | 14 | 27.95 (17.36 to 38.54) | 357.03 | 240.76 | < 0.001 | 95 |
| Children only (> 1 year) | 5 | 42.50 (20.85 to 64.15) | 460.98 | 31.74 | < 0.001 | 87 |
CI: confidence interval.
Change in 25(OH)D concentration
Compared to placebo or no intervention, vitamin D resulted in a larger change in vitamin D concentration (MD 28.36 nmol/L, 95% CI 10.41 to 46.32; 3 studies, 495 participants; I² = 88%; tau² = 0.01; random‐effects model; Analysis 1.11). The results were similar with a fixed‐effect model (Table 4).
25(OH)D ≥ 50 nmol/L
Groups receiving vitamin D were 88% more likely to have vitamin D status ≥ 50 nmol/L (RR 1.88, 95% CI 1.63 to 2.17; 6 studies, 982 participants; I² = 20%; tau² = 0.01; random‐effects model; Analysis 1.12) than groups receiving placebo or no intervention. The results were similar with a fixed‐effect model (Table 4).
25(OH)D ≥ 75 nmol/L
Insufficient evidence suggests that, compared to placebo or no intervention, vitamin D has an effect on achieving vitamin D status above 75 nmol/L (RR 5.75, 95% CI 0.49 to 67.59; 2 studies, 138 participants; I² = 91%; tau² = 2.90; random‐effects model; Analysis 1.13). With a fixed‐effect model, vitamin D had an effect on achieving vitamin D status above 75 nmol/L (Table 4).
25(OH)D < 25 to 30 nmol/L
In three studies, children in the vitamin D groups had 74% lower risk of severe vitamin D deficiency than those given placebo or no intervention (RR 0.26, 95% CI 0.19 to 0.36; 3 studies, 836 participants; I² = 0%; tau² = 0; random‐effects model; Analysis 1.14). The results were similar with a fixed‐effect model (Table 4).
Rickets
Insufficient evidence suggests that, compared to placebo or no intervention, vitamin D has an effect on anterior fontanelle maximum diameter (MD ‐0.20 cm, 95% CI ‐0.61 to 0.21; 1 study, 101 participants; fixed‐effect model; Analysis 1.15).
No study included in this comparison assessed the secondary outcome of gain in linear growth.
Comparison 2: vitamin D (higher dose) versus vitamin D (lower dose)
Primary outcomes
Please see summary of findings Table 2. All outcomes were measured at completion of the intervention, with average time frames ranging from 3.9 to 8.6 months.
Linear growth
Data show little to no difference between higher doses of vitamin D and lower doses of vitamin D on linear growth, although we are uncertain about the result (MD ‐1.00 cm, 95% CI ‐2.22 to 0.21; 5 studies, 283 participants; I² = 71%; tau² = 1.22; random‐effects model; Analysis 2.1). With a fixed‐effect model, higher doses of vitamin D resulted in less linear growth than lower doses of vitamin D, although we are uncertain about the result (Table 4).
Length/height‐for‐age (L/HAZ)
Insufficient evidence suggests that, compared to a lower dose of vitamin D, a higher dose of vitamin D has an effect on L/HAZ (MD 0.40 z‐score, 95% CI ‐0.06 to 0.86; 2 studies, 105 participants; I² = 0%; tau² = 0; random‐effects model; Analysis 2.2; low‐certainty evidence). The results were similar with a fixed‐effect model (Table 4).
Adverse effects
Hypercalciuria
Insufficient evidence suggests that, compared to a lower dose of vitamin D, a higher dose of vitamin D has an effect on the incidence of hypercalciuria (RR 1.16, 95% CI 1.00 to 1.35; 6 studies, 554 participants; I² = 0%; tau² = 0; random‐effects model; Analysis 2.3; low‐certainty evidence). The results were similar with a fixed‐effect model (Table 4).
Hypercalcaemia
Insufficient evidence suggests that, compared to a lower dose of vitamin D, a higher dose of vitamin D has an effect on the incidence of hypercalcaemia (RR 1.39, 95% CI 0.89 to 2.18; 5 studies, 986 participants; I² = 0%; tau² = 0; random‐effects model; Analysis 2.4; low‐certainty evidence). The results were similar with a fixed‐effect model (Table 4).
No studies included in this comparison evaluated the primary outcome of stunting or had quantifiable data for the primary outcome of kidney stones or phosphataemia.
Secondary outcomes
Gain in linear growth
Insufficient evidence suggests that, compared to a lower dose of vitamin D, a higher dose of vitamin D has an effect on change in linear growth (MD ‐0.01 cm, 95% CI ‐0.02 to 0.00; 3 studies, 378 participants; I² = 0%; tau² = 0; random‐effects model; Analysis 2.5). The results were similar with a fixed‐effect model (Table 4).
Weight‐for‐age (WAZ)
Insufficient evidence suggests that, compared to a lower dose of vitamin D, a higher dose of vitamin D has an effect on WAZ scores (MD 0.07, 95% CI ‐0.44 to 0.58; 2 studies, 103 participants; I² = 0%; tau² = 0; random‐effects model; Analysis 2.6). The results were similar with a fixed‐effect model (Table 4).
Weight‐for‐length/height (WL/HZ)
Insufficient evidence suggests that, compared to a lower dose of vitamin D, a higher dose of vitamin D has an effect on WL/HZ scores (MD ‐0.18, 95% CI ‐0.74 to 0.37; 1 study, 53 participants; fixed‐effect model; Analysis 2.7).
Vitamin D status
Continuous 25(OH)D concentration (nmol/L)
Overall, compared to a lower dose of vitamin D, a higher dose of vitamin D increased vitamin D status (MD 16.13 nmol/L, 95% CI 7.11 to 25.15; 20 studies, 2765 participants; I² = 96%; tau² = 333.1; random‐effects model; Analysis 2.8). The results were similar with a fixed‐effect model (Table 4). We explored possible reasons for the high heterogeneity observed across studies, including analysis of studies examining physiological doses of vitamin D only; infants only; and preterm infants only (Table 6). We found that only the sensitivity analysis including preterm infants only decreased inter‐study heterogeneity to I² = 89%.
| Serum 25(OH)D (nmol/L) (Analysis 2.8 ) | ||||||
|---|---|---|---|---|---|---|
| Category | Number of studies | Mean difference (95% CI) | Tau² | Chi² | P value | I²(%) |
| All studies | 20 | 16.13 (7.11 to 25.15) | 333.01 | 493.04 | < 0.001 | 96 |
| Physiological doses only | 14 | 18.62 (8.86 to 28.39) | 268.61 | 243.46 | < 0.001 | 95 |
| Infants only | 18 | 16.02 (6.16 to 25.87) | 352.80 | 461.94 | < 0.001 | 96 |
| Preterm only | 9 | 12.96 (2.23 to 23.68) | 183.61 | 72.17 | < 0.001 | 89 |
CI: confidence interval.
Change in 25(OH)D concentration
Insufficient evidence suggests that, compared to a lower dose of vitamin D, a higher dose of vitamin D has an effect on change in vitamin D status (MD 4.12 nmol/L, 95% CI ‐5.82 to 14.07; 3 studies, 142 participants; I² = 46%; tau² = 37.3; random‐effects model; Analysis 2.9). The results were similar with a fixed‐effect model (Table 4).
25(OH)D ≥ 50 nmol/L
Twelve studies comparing higher‐dose vitamin D to lower‐dose vitamin D found no association between higher‐dose vitamin D and attaining serum 25(OH)D concentrations ≥ 50 nmol/L (RR 1.04, 95% CI 1.00 to 1.08; 12 studies, 1735 participants; I² = 42%; tau² = 0; random‐effects model; Analysis 2.10). The results were similar with a fixed‐effect model (Table 4).
25(OH)D ≥ 75 nmol/L
Compared to the lower‐dose vitamin D group, those in the higher‐dose vitamin D group had 31% increased probability of reaching vitamin D sufficiency (RR 1.31, 95% CI 1.19 to 1.45; 6 studies, 1172 participants; I² = 38%; tau² = 0.01; random‐effects model; Analysis 2.11). The results were similar with a fixed‐effect model (Table 4).
25(OH)D < 25 to 30 nmol/L
Insufficient evidence suggests that, compared to a lower dose of vitamin D, a higher dose of vitamin D has an effect on the risk of severe vitamin D deficiency (RR 0.14, 95% CI 0.02 to 1.35; 1 study, 142 participants; fixed‐effect model; Analysis 2.12).
Rickets
Compared to the lower‐dose vitamin D group, those in the higher‐dose vitamin D group had 36% lower risk of signs of rickets (RR 0.64, 95% CI 0.46 to 0.90; 4 studies, 212 participants; I² = 0%; tau² = 0; random‐effects model; Analysis 2.13). The results were similar with a fixed‐effect model (Table 4).
Comparison 3: vitamin D + micronutrient(s) versus micronutrient(s) alone
Primary outcomes
The study included in this comparison, Thacher 2014, did not assess any primary outcomes (linear growth, length/height‐for‐age, stunting, adverse effects (hypercalciuria, hypercalcaemia, hyperphosphataemia, kidney stones)).
Secondary outcomes
Vitamin D status
Continuous 25(OH)D concentration (nmol/L)
Some evidence suggests that, compared to micronutrients alone, vitamin D + micronutrients increase vitamin D concentrations (MD 18.90 nmol/L, 95% CI 8.53 to 29.27; 1 study, 50 participants; fixed‐effect model; Analysis 3.1).
Rickets
Insufficient evidence suggests that, compared to micronutrients alone, vitamin D + micronutrients has an effect on mean radiographic scores (MD ‐0.94 radiographic score, 95% CI ‐2.10 to 0.22; 1 study, 53 participants; fixed‐effect model; Analysis 3.2).
Thacher 2014 did not assess any other secondary outcomes in this comparison (gain in linear growth, weight‐for‐age, underweight, weight‐for‐length/height, wasting).
Comparison 4: vitamin D (higher dose) + micronutrient(s) versus vitamin D (lower dose) + micronutrient(s)
Primary outcomes
Please see summary of findings Table 3. All outcomes were measured at completion of the intervention, with average time frames ranging from 2.2 to 3 months.
Linear growth
Insufficient evidence suggests that compared to lower‐dose vitamin D + micronutrients, higher‐dose vitamin D + micronutrients may result in little to no difference on linear growth (MD 0.60 cm, 95% CI ‐3.33 to 4.53; 1 study, 25 participants; fixed‐effect model; Analysis 4.1; low‐certainty evidence).
Adverse effects
Hypercalciuria
Insufficient evidence suggests that compared to lower‐dose vitamin D + micronutrients, higher‐dose vitamin D + micronutrients may result in little to no difference in the incidence of hypercalciuria (RR 1.00, 95% CI 0.06 to 15.48; 1 study, 86 participants; fixed‐effect model; Analysis 4.2; low‐certainty evidence).
Hypercalcaemia
Compared to lower‐dose vitamin D + micronutrients, higher‐dose vitamin D + micronutrients probably results in little to no effect on the incidence of hypercalcaemia (RR 1.00, 95% CI 0.90 to 1.11; 2 studies, 126 participants; I² = 0%; tau² = 0; random‐effects model; Analysis 4.3; moderate‐certainty evidence). The results were similar with a fixed‐effect model (Table 4).
No study included in this comparison assessed the following primary outcomes: length/height‐for‐age; stunting; hyperphosphataemia; kidney stones.
Secondary outcomes
Gain in linear growth
Some evidence suggests that, compared to lower‐dose vitamin D + micronutrients, higher‐dose vitamin D + micronutrients is associated with greater gain in linear growth (MD 0.73 cm, 95% CI 0.12 to 1.34; 1 study, 50 participants; fixed‐effect model; Analysis 4.4).
Vitamin D status
Continuous 25(OH)D concentration (nmol/L)
Insufficient evidence suggests that, compared to lower‐dose vitamin D + micronutrients, higher‐dose vitamin D + micronutrients has an effect on vitamin D status (MD 27.94 nmol/L, 95% CI ‐2.75 to 58.63; 5 studies, 325 participants; I² = 96%; tau² = 1163.79; random‐effects model; Analysis 4.5. However, with a fixed‐effect model, children receiving higher‐dose vitamin D + micronutrients had higher serum 25(OH)D concentrations than children receiving lower‐dose vitamin D + micronutrients (Table 4).
Change in 25(OH)D concentration
Some evidence suggests that, compared to lower‐dose vitamin D + micronutrients, higher‐dose vitamin D + micronutrients is associated with greater change in vitamin D concentration (MD 7.19 nmol/L, 95% CI 2.97 to 11.41; 1 study, 30 participants; fixed‐effect model; Analysis 4.6).
25(OH)D ≥ 50 nmol/L
Insufficient evidence suggests that, compared to lower‐dose vitamin D + micronutrients, higher‐dose vitamin D + micronutrients has an effect on achieving vitamin D sufficiency (RR 1.34, 95% CI 0.76 to 2.35; 3 studies, 225 participants; I² = 92%; tau² = 0.23; random‐effects model; Analysis 4.7). The results were similar with a fixed‐effect model.
Rickets
Insufficient evidence suggests that, compared to lower‐dose vitamin D + micronutrients, higher‐dose vitamin D + micronutrients has an effect on signs of rickets (RR 1.23, 95% CI 0.24 to 6.30; 2 studies, 153 participants; I² = 0%; tau² = 0; random‐effects model; Analysis 4.8). The results were similar with a fixed‐effect model (Table 4).
No study included in this comparison assessed the following secondary outcomes: weight‐for‐age, underweight, weight‐for‐length/height, wasting.
Discussion
This systematic review evaluated the effects of oral vitamin D supplementation on linear growth, anthropometric z‐scores, stunting, adverse effects, vitamin D status, and rickets.
Summary of main results
In total, we included 75 studies (from 187 reports), 31 of which discussed at least one of our primary outcomes in this review.
For linear growth, vitamin D compared to placebo (3 randomised controlled trials (RCTs), 240 participants; low‐certainty evidence); higher‐dose vitamin D compared to lower‐dose vitamin D (5 RCTs, 283 participants; very low‐certainty evidence); and vitamin D (higher dose) plus micronutrients compared to vitamin D (lower dose) plus micronutrients (1 RCT, 25 participants; moderate‐certainty evidence) were not associated with any differences in mean length/height (cm) between groups.
Mean length/height‐for‐age z‐scores were slightly higher in groups receiving vitamin D compared to those given placebo (1 RCT, 1258 participants; moderate‐certainty evidence) but were not different between groups in the higher‐dose versus lower‐dose vitamin D comparison (2 RCTs, 105 participants; low‐certainty evidence).
Prevalence of stunting was not different in the vitamin D versus placebo groups (1 RCT, 1247 participants; moderate‐certainty evidence). However, in the original study, Trilok‐Kumar 2011 reported an adjusted risk ratio (RR), which showed that children in the vitamin D group had a 27% lower risk of stunting (95% confidence interval (CI) 5% to 43%) compared to children in the placebo group. The adjusted RR accounted for all characteristics associated with missing data, including sex, quintiles of socioeconomic status, quintiles of exposure to sunlight, season, socioeconomic status, housing materials, material possessions, and breastfeeding. Stunting was not reported by studies included in the other comparisons.
Adverse effects of oral vitamin D reported by studies included hypercalciuria, hypercalcaemia, hyperphosphataemia, and kidney stones. We found no evidence of differences in the risk of hypercalciuria or hypercalcaemia across the four comparisons. All trials measuring hyperphosphataemia or kidney stones, or both, reported no occurrences.
Overall completeness and applicability of evidence
In this review, we sought to determine the effects of oral vitamin D supplementation on our primary outcomes of linear growth, length/height‐for‐age, stunting, and adverse effects in children from birth to five years of age, as determined by randomised and quasi‐randomised controlled trials. We aimed to systematically review the evidence that already exists for oral vitamin D supplementation and linear growth, and to compare oral vitamin D supplementation against placebo, no intervention, and a lower dose of vitamin D intervention, with or without micronutrients.
A major limitation that we encountered while conducting this review is that we were able to synthesise very few studies for the primary outcomes of interest per each comparison. For example, in total, we identified 14 studies that evaluated linear growth, three that evaluated length/height‐for‐age (L/HAZ), and one that evaluated stunting. Studies measuring linear growth were analysed across Comparison 1 (three studies), Comparison 2 (five studies), and Comparison 4 (one study), showing the limited number of studies available for inclusion in a meta‐analysis. In contrast, Comparison 1 and Comparison 2 each included more than 20 studies that analysed vitamin D status. These findings highlight the need to study in future trials the primary outcomes of interest ‐ linear growth, L/HAZ, and stunting.
All of these studies measured linear growth at the end of the supplementation period in infants (either preterm or term). The only studies (three studies) evaluating linear growth, L/HAZ, or stunting in children between one and five years of age were performed after a longer follow‐up period among infants who were previously supplemented but did not receive vitamin D supplementation during that time (Gallo 2013b; Greer 1981; Trilok‐Kumar 2011). This represents a major gap in evidence for the effects of oral vitamin D supplementation on linear growth at the end of the supplementation period in children specifically between one and five years of age. In comparisons including more than one study, evidence was rated as low or very low certainty. No comparisons were judged to have high‐certainty evidence, demonstrating the need for further research. Measurable effects on linear growth, L/HAZ, and stunting may be observed only after a long period of supplementation and follow‐up and among large cohorts. Twenty‐eight studies reported on adverse effects of vitamin D supplementation, including hypercalciuria, hypercalcaemia, hyperphosphataemia, and kidney stones, and overall found no greater risk of incidence in the vitamin D groups. Studies in these comparisons involved mainly infants, with two studies reporting on children only, and three studies reporting on both infants and children, with a range of health issues at baseline (preterm, very low birth weight, asthma or upper respiratory tract infection, rickets).
Heterogeneity of studies across outcomes was an issue in the current evidence base. Across the 75 studies included in this review, participants ranged in baseline health status, which included being healthy; being vitamin D deficient; being preterm or of low birth weight, or both; having rickets; having infectious diseases such as acute or recurrent otitis media, acute diarrhoea, bronchiolitis, pneumonia, or upper or lower respiratory tract infection; or having non‐communicable diseases or disorders, including asthma, dermatitis, chronic kidney disease, juvenile idiopathic arthritis, or chronic heart failure. The included studies were conducted as early as 1959, which presented challenges in 'Risk of bias' assessments and data extraction due to reporting standards changing over time, such as lack of study design or randomisation sequence generation details or reasons for loss‐to‐follow‐up. Oral vitamin D supplementation doses were variable in range, quantity, frequency, and duration across studies. Often studies did not meet their target sample size, if calculated, raising the likelihood of low power to detect an effect in individual studies. There were not enough studies per any one comparison or primary outcome to investigate potential subgroup differences in terms of participant characteristics or intervention administration. The heterogeneity in intervention doses and durations as well as population characteristics, coupled with small sample sizes that were often underpowered at the analysis stage, and lack of reporting of full measurements of outcomes (i.e. not including variance estimates) for estimates of effect in many studies limited our ability to conduct a full meta‐analysis of all available evidence identified by the literature search. Further, trials that may have been included but were not eligible due to lack of age‐stratified data represent a gap in the evidence that could not be analysed in this review (see Characteristics of excluded studies tables).
A majority of studies were performed outside of the Tropic of Cancer and the Tropic of Capricorn, where populations are considered to be at higher susceptibility to vitamin D deficiency. However, among the studies conducted completely or partially between these latitudes (i.e. thought to be at lower risk for vitamin D deficiency due to more abundant sunshine), most studies reported baseline deficiency in vitamin D, either < 50 nmol/L (Rianthavorn 2013; Somnath 2017; Singh 2019; Thacher 2014), or < 75 nmol/L (Tergestina 2016), or they did not report baseline vitamin D status (Feliciano 1994; Specker 1992), showing the need for further investigation in these areas.
Quality of the evidence
In this review, we included 75 studies, 64 of which reported quantifiable data on our primary or secondary outcomes, or both. Our primary outcomes were measured by studies in three of our four comparisons, and secondary outcomes were measured by all studies across all four comparisons. We made efforts to contact study authors to request additional data. The certainty of evidence varied between high and very low across outcomes in each comparison.
Our primary outcomes included linear growth, length/height‐for‐age z‐score (L/HAZ), stunting, and adverse effects (hypercalciuria, hypercalcaemia, hyperphosphataemia, and kidney stones). Among all studies measuring at least one primary outcome across all comparisons (31 studies), 53% lacked caregiver or investigator blinding, and 35% lacked (or lacked a description of) blinding of outcome assessors, and 29% were open‐label or included no description of blinding. In studies with no intervention as the comparator (one study), blinding was not possible. Lack of blinding is unlikely to have impacted the results, all of which were measured objectively by study personnel; however, lack of blinding of caregivers could potentially have raised the risk for differential attrition. Over 50% of studies were considered to have unclear or high risk of attrition bias due to high loss to follow‐up, differential by study arm, or overall, in particular when reasons for loss to follow‐up were not detailed and intention‐to‐treat analysis was not carried out. Most studies had low risk of selection bias regarding sequence generation and allocation concealment.
We evaluated the certainty of evidence using the GRADE method (GRADEpro GDT 2020); our findings are shown in the 'Summary of findings' tables (summary of findings Table 1; summary of findings Table 2; summary of findings Table 3) for our primary outcomes linear growth, L/HAZ, stunting, hypercalciuria, and hypercalcaemia. We planned to conduct a GRADE assessment for hyperphosphataemia and kidney stones, but no data were available for analysis of those outcomes; in three studies reporting on hyperphosphataemia, and in one study reporting on kidney stones, the outcome did not occur.
The certainty of evidence across Comparisons 1, 2, and 4, respectively, as assessed by GRADE, was low, very low, and low for linear growth; moderate and low for L/HAZ (Comparisons 1 and 2 only); moderate for stunting (Comparison 1 only); moderate, low, and low for hypercalciuria; and very low, low, and moderate for hypercalcaemia. Overall, the majority of reasons for downgrading the evidence included moderate to high heterogeneity, imprecision about the estimate, and serious risk of bias.
Potential biases in the review process
We believe that potential biases were minimal in the creation of this review. We conducted a systematic assessment of studies by having at least two reviewers evaluate each potential study at every stage (literature searches, screening of titles and abstracts, screening of full‐text reports, extraction of data, and performance of 'Risk of bias' assessments, and GRADE assessments). We searched 17 electronic databases and two trial registries to be as comprehensive as possible in examining all available evidence. However, we were not able to assess for publication bias using funnel plots due to lack of studies for comparison, thereby preventing us from drawing conclusions on publication bias of the included studies (Table 2; Differences between protocol and review).
Agreements and disagreements with other studies or reviews
Below, we compare the results of previous reviews assessing effects of oral vitamin D supplementation on health outcomes in children.
A previous umbrella (i.e. overview) review of systematic reviews and meta‐analyses examined observational associations between circulating vitamin D concentrations and clinical outcomes, and randomised controlled trials (RCTs) assessing vitamin D supplementation and health outcomes. This umbrella review analysed some outcomes similar to those discussed in this review among neonates, infants, and children, including (birth) length and bone mineral density (Theodoratou 2014). No conclusion was reached regarding effects of vitamin D on neonatal and infant growth (i.e. birth length) and bone mineral density (in lumbar spine) in children, and a substantial effect was unlikely for bone mineral density in general, specifically in the forearm, or in the hip in children. However, it seems that these results are pooled from both reviews of observational studies and RCTs, limiting comparability with our study, which analysed only RCTs.
A previous Cochrane Review assessed effects of vitamin D supplementation for improving bone mineral density in children and adolescents age 1 month up to 20 years (Winzenberg 2011). This review graded available evidence between moderate and high certainty and reported no improvements in total body, hip bone, lumbar spine, and forearm bone mineral density from baseline after one to two years of follow‐up. This is similar to the findings of our review, which analysed six studies reporting on bone mineral density (total, forearm shaft, tibia, distal forearm, lumbar spine) as a secondary outcome and found no differences between any comparisons at the end of the supplementation period or at long‐term follow‐up. As a note, this review found an effect of vitamin D supplementation on bone mineral density among children who were deficient in vitamin D, but not among children with replete vitamin D levels; however, given that there are no deficiency cutoff recommendations for vitamin D for linear growth, we did not examine effects by deficiency status.
Another Cochrane Review analysed effects of vitamin D supplementation on asthma among both children and adults (Martineau 2016). This review found that vitamin D supplementation had a positive effect on asthma outcomes, such as reduced risk of asthma exacerbation (high‐certainty evidence), but we did not find any effect of vitamin D supplementation on asthma. However, it is difficult to compare our findings, as only three studies in our review analysed asthma in association with vitamin D, one of which was terminated early and included only children. Another non‐Cochrane review assessing higher‐dose vitamin D supplementation among children and adolescents age 5 to 18 years for asthma found a reduction in asthma exacerbation with vitamin D ≥ 500 IU per day compared to control (Pojsupap 2015).
A previous Cochrane Review analysed effects of vitamin D supplementation for prevention of nutritional rickets in children born at full term (Lerch 2007). Based on data from four studies, specifically among term‐born children, review authors concluded that it was reasonable to offer vitamin D as a preventive measure to groups at high risk, such as infants and toddlers, and those from settings such as Africa, Asia, or the Middle East. In our review, vitamin D compared to placebo or no intervention did not result in any differences in signs of rickets at endpoint, but higher‐dose vitamin D compared to lower‐dose vitamin D showed reduced risk of rickets signs at endpoint; these studies were conducted in Finland, Germany, India, Australia, London, and Switzerland, and most participants were infants. Our results are consistent with the findings of the 2007 review and provide some support for potentially updating this review with trials published since 2007.
Finally, a systematic review analysed the response of serum 25[OH]D concentration to vitamin D supplementation among children and adolescents (age 3 to 17 years) and adults and found that, overall, vitamin D intervention groups obtained a higher serum vitamin D concentration than controls, with an obvious dose‐response effect among low‐, moderate‐, and higher‐dose groups (Mo 2019). These findings are consistent with our results, which showed higher vitamin D in intervention groups across all three comparisons (vitamin D versus placebo or no intervention, higher‐dose vitamin D versus lower‐dose vitamin D, and vitamin D plus multiple micronutrients versus micronutrients only), although the populations studied were slightly non‐overlapping in terms of age group.
A previous Cochrane Review analysed effects of vitamin D among children under five years of age but on outcomes not covered in this review. That review examined the effects of oral vitamin D on preventing infection and, overall, found no evidence of effects of vitamin D supplementation on death, incidence of pneumonia, or diarrhoea, among a limited number of studies with low‐certainty evidence (Yakoob 2016).

Study flow diagram.

Risk of bias graph: review authors' judgements about each risk of bias item presented as percentages across all included studies.

Risk of bias summary: review authors' judgements about each risk of bias item for each included study.

Comparison 1: Vitamin D versus placebo or no intervention, Outcome 1: Linear growth

Comparison 1: Vitamin D versus placebo or no intervention, Outcome 2: Length/height‐for‐age

Comparison 1: Vitamin D versus placebo or no intervention, Outcome 3: Stunting

Comparison 1: Vitamin D versus placebo or no intervention, Outcome 4: Adverse effect: hypercalciuria

Comparison 1: Vitamin D versus placebo or no intervention, Outcome 5: Adverse effect: hypercalcaemia

Comparison 1: Vitamin D versus placebo or no intervention, Outcome 6: Weight‐for‐age

Comparison 1: Vitamin D versus placebo or no intervention, Outcome 7: Underweight

Comparison 1: Vitamin D versus placebo or no intervention, Outcome 8: Weight‐for‐length/height

Comparison 1: Vitamin D versus placebo or no intervention, Outcome 9: Wasting

Comparison 1: Vitamin D versus placebo or no intervention, Outcome 10: Serum 25‐hydroxyvitamin D

Comparison 1: Vitamin D versus placebo or no intervention, Outcome 11: Change in 25(OH)D levels (nmol/L)

Comparison 1: Vitamin D versus placebo or no intervention, Outcome 12: Vitamin D sufficiency (≥ 50 nmol/L)

Comparison 1: Vitamin D versus placebo or no intervention, Outcome 13: Vitamin D sufficiency (≥ 75 nmol/L)

Comparison 1: Vitamin D versus placebo or no intervention, Outcome 14: Vitamin D severe deficiency (< 25 to 30 nmol/L)

Comparison 1: Vitamin D versus placebo or no intervention, Outcome 15: Rickets (continuous)

Comparison 2: Vitamin D (higher dose) versus vitamin D (lower dose), Outcome 1: Linear growth

Comparison 2: Vitamin D (higher dose) versus vitamin D (lower dose), Outcome 2: Length/height‐for‐age

Comparison 2: Vitamin D (higher dose) versus vitamin D (lower dose), Outcome 3: Adverse effect: hypercalciuria

Comparison 2: Vitamin D (higher dose) versus vitamin D (lower dose), Outcome 4: Adverse effect: hypercalcaemia

Comparison 2: Vitamin D (higher dose) versus vitamin D (lower dose), Outcome 5: Linear growth: gain in length

Comparison 2: Vitamin D (higher dose) versus vitamin D (lower dose), Outcome 6: Weight‐for‐age

Comparison 2: Vitamin D (higher dose) versus vitamin D (lower dose), Outcome 7: Weight‐for‐length/height

Comparison 2: Vitamin D (higher dose) versus vitamin D (lower dose), Outcome 8: Serum 25‐hydroxyvitamin D

Comparison 2: Vitamin D (higher dose) versus vitamin D (lower dose), Outcome 9: Change in 25(OH)D (nmol/L)

Comparison 2: Vitamin D (higher dose) versus vitamin D (lower dose), Outcome 10: Vitamin D sufficiency (≥ 50 nmol/L)

Comparison 2: Vitamin D (higher dose) versus vitamin D (lower dose), Outcome 11: Vitamin D sufficiency (≥ 75 nmol/L)

Comparison 2: Vitamin D (higher dose) versus vitamin D (lower dose), Outcome 12: Vitamin D severe deficiency (< 25 to 30 nmol/L)

Comparison 2: Vitamin D (higher dose) versus vitamin D (lower dose), Outcome 13: Rickets (dichotomous)

Comparison 3: Vitamin D + micronutrient(s) versus micronutrient(s) alone, Outcome 1: Serum 25‐hydroxyvitamin D

Comparison 3: Vitamin D + micronutrient(s) versus micronutrient(s) alone, Outcome 2: Rickets (continuous)

Comparison 4: Vitamin D (higher dose) + micronutrient(s) versus vitamin D (lower dose) + micronutrient(s), Outcome 1: Linear growth

Comparison 4: Vitamin D (higher dose) + micronutrient(s) versus vitamin D (lower dose) + micronutrient(s), Outcome 2: Adverse effect: hypercalciuria

Comparison 4: Vitamin D (higher dose) + micronutrient(s) versus vitamin D (lower dose) + micronutrient(s), Outcome 3: Adverse effect: hypercalcaemia

Comparison 4: Vitamin D (higher dose) + micronutrient(s) versus vitamin D (lower dose) + micronutrient(s), Outcome 4: Linear growth: gain in length

Comparison 4: Vitamin D (higher dose) + micronutrient(s) versus vitamin D (lower dose) + micronutrient(s), Outcome 5: Serum 25‐hydroxyvitamin D

Comparison 4: Vitamin D (higher dose) + micronutrient(s) versus vitamin D (lower dose) + micronutrient(s), Outcome 6: Change in 25(OH)D (nmol/L)

Comparison 4: Vitamin D (higher dose) + micronutrient(s) versus vitamin D (lower dose) + micronutrient(s), Outcome 7: Vitamin D sufficiency (≥ 50 nmol/L)

Comparison 4: Vitamin D (higher dose) + micronutrient(s) versus vitamin D (lower dose) + micronutrient(s), Outcome 8: Rickets (dichotomous)
| Vitamin D versus placebo or no intervention | ||||||
| Patient or population: children under 5 years of age | ||||||
| Outcomes | Anticipated absolute effects* (95% CI) | Relative effect | №. of participants (studies) | Certainty of evidence | Comments | |
|---|---|---|---|---|---|---|
| Risk with placebo or no intervention | Risk with vitamin D | |||||
| Linear growth (length/height) Unit: cm | Mean length in control group was 62.7 cm | Mean length in intervention group was 0.66 cm longer | ‐ | 240 (3 RCTs) | ⊕⊕⊝⊝ | Two studies showed an increase in linear growth, and 1 study found a decrease in linear growth. However, no difference was found overall |
| Length/height‐for‐age z‐score (L/HAZ) Time frame: 6 months | Mean height‐for‐age z‐score in control group was ‐1.95 | Mean height‐for‐age z‐score in intervention group was 0.11 units higher | ‐ | 1258 (1 RCT) | ⊕⊕⊕⊝ | HAZ was higher among those receiving vitamin D |
| Stunting Definition: L/HAZ < ‐2 | Study population | RR 0.90 | 1247 (1 RCT) | ⊕⊕⊕⊝ | ||
| 490 per 1000 | 441 per 1000 | |||||
| Adverse effect: hypercalciuria As defined by trialists | Study population | RR 2.03 | 68 (2 RCTs) | ⊕⊕⊕⊝ | There was no greater risk of increased calcium secretion in urine in groups receiving vitamin D | |
| 29 per 1000 | 60 per 1000 | |||||
| Adverse effect: hypercalcaemia As defined by trialists | Study population | RR 0.82 | 367 (2 RCTs) | ⊕⊝⊝⊝ | There was no greater risk of increased calcium concentration in blood in groups receiving vitamin D | |
| 124 per 1000 | 101 per 1000 | |||||
| Adverse effect: hyperphosphataemiae | ‐ | ‐ | ‐ | ‐ | ‐ | Not measured |
| Adverse effect: kidney stonese | ‐ | ‐ | ‐ | ‐ | ‐ | Not measured |
| *The risk in the intervention group (and its 95% confidence interval) is based on assumed risk in the comparison group and the relative effect of the intervention (and its 95% CI). | ||||||
| GRADE Working Group grades of evidence. | ||||||
| aDowngraded one level due to serious risk of bias. Evidence was downgraded an additional level due to inconsistency (as indicated by an I² value of 49%; P = 0.14), suggesting moderate heterogeneity. eNo data were available for this outcome. | ||||||
| Vitamin D (higher dose) versus vitamin D (lower dose) | ||||||
| Patient or population: children under 5 years of age | ||||||
| Outcomes | Anticipated absolute effects* (95% CI) | Relative effect | №. of participants (studies) | Certainty of evidence | Comments | |
|---|---|---|---|---|---|---|
| Risk with lower‐dose vitamin D | Risk with higher‐dose vitamin D | |||||
| Linear growth (length/height) Unit: cm Time frame: 4.2 months (mean) | Mean length in control group was 57.8 cm. | Mean length in intervention group was 1.00 cm shorter | ‐ | 283 (5 RCTs) | ⊕⊝⊝⊝ | Two studies showed an increase in linear growth, and 3 studies found a decrease in linear growth. However, no difference was found overall |
| Length/height‐for‐age z‐score (L/HAZ) Unitless Time frame: 7 months (mean) | Mean height‐for‐age z‐score in control group was ‐0.35. | Mean height‐for‐age z‐score in intervention group was0.40 units higher | ‐ | 105 (2 RCTs) | ⊕⊕⊝⊝ | No difference in HAZ was found between groups |
| Stuntingc | ‐ | ‐ | ‐ | ‐ | ‐ | Not measured |
| Adverse effect: hypercalciuria As defined by trialists Time frame: 3.9 months (mean) | Study population | RR 1.16 | 554 (6 RCTs) | ⊕⊕⊝⊝ | There was no greater risk of increased calcium secretion in urine in groups receiving vitamin D | |
| 276 per 1000 | 320 per 1000 | |||||
| Adverse effect: hypercalcaemia As defined by trialists Time frame: 8.6 months (mean) | Study population | RR 1.39 | 986 (5 RCTs) | ⊕⊕⊝⊝ | There was no greater risk of increased calcium concentrations in blood in groups receiving vitamin D | |
| 64 per 1000 | 88 per 1000 | |||||
| Adverse effect: hyperphosphataemiac | ‐ | ‐ | ‐ | ‐ | ‐ | Not measured |
| Adverse effect: kidney stonesc | ‐ | ‐ | ‐ | ‐ | ‐ | Not measured |
| *The risk in the intervention group (and its 95% confidence interval) is based on the assumed risk in the comparison group and the relative effect of the intervention (and its 95% CI). | ||||||
| GRADE Working Group grades of evidence. | ||||||
| aDowngraded one level due to serious risk of bias. Evidence was downgraded an additional level due to imprecision, as the confidence interval around the effect size included 0, the null value. Evidence was downgraded an additional level due to inconsistency between studies, indicated by an I² value of 71%, suggesting substantial heterogeneity. | ||||||
| Vitamin D (higher dose) + micronutrient(s) versus vitamin D (lower dose) + micronutrient(s) | ||||||
| Patient or population: children under 5 years of age | ||||||
| Outcomes | Anticipated absolute effects* (95% CI) | Relative effect (95% CI) | №. of participants (studies) | Certainty of evidence (GRADE) | Comments | |
|---|---|---|---|---|---|---|
| Risk with lower‐dose vitamin D + micronutrient(s) | Risk with higher‐dose vitamin D + micronutrient(s) | |||||
| Linear growth (length/height) Unit: cm Time frame: 3 months | Mean length in control group was 49.2 cm | Mean length in intervention group was 0.6 cm longer (3.33 shorter to 4.53 longer) | ‐ | 25 (1 RCT) | ⊕⊕⊝⊝ | No difference in linear growth was found between groups |
| Length/height‐for‐age z‐score (L/HAZ)b | ‐ | ‐ | ‐ | ‐ | ‐ | Not measured |
| Stuntingb | ‐ | ‐ | ‐ | ‐ | ‐ | Not measured |
| Adverse effect: hypercalciuria As defined by trialists Time frame: 3 months | Study population | RR 1.00 (0.06 to 15.48) | 86 (1 RCT) | ⊕⊕⊝⊝ | There was no greater risk of increased calcium secretion in urine in groups receiving vitamin D | |
| 23 per 1000 | 23 per 1000 | |||||
| Adverse effect: hypercalcaemia As defined by trialists Time frame: 2.2 months (mean) | Study population | RR 1.00 (0.90 to 1.11) | 126 (2 RCTs) | ⊕⊕⊕⊝ | There was no greater risk of increased calcium concentrations in blood in groups receiving vitamin D | |
| 145 per 1000 | 298 per 1000 | |||||
| Adverse effect: hyperphosphataemiab | ‐ | ‐ | ‐ | ‐ | ‐ | Not measured |
| Adverse effect: kidney stonesb | ‐ | ‐ | ‐ | ‐ | ‐ | Not measured |
| *The risk in the intervention group (and its 95% CI) is based on the assumed risk in the comparison group and the relative effect of the intervention (and its 95% CI). | ||||||
| GRADE Working Group grades of evidence. | ||||||
| aDowngraded one level due to risk of bias and imprecision, as the 95% CI for the effect measure included the null value of 0. Evidence was downgraded an additional level due to indirectness as only one study conducted in Finland was included, restricting the population analysed. | ||||||
| Comparison | ||
|---|---|---|
| Name of comparison | Intervention group | Comparator group |
| 1. Vitamin D supplementation vs placebo or no intervention | Oral vitamin D (cholecalciferol D₃, ergocalciferol D₂, calcitriol) supplementationa | No intervention |
| Placebo | ||
| 2. Vitamin D supplementation (high dose) vs vitamin D (low dose) | Oral vitamin D (cholecalciferol D₃, ergocalciferol D₂, calcitriol) supplementation,a at a higher dose | Oral vitamin D (cholecalciferol D₃, ergocalciferol D₂, calcitriol) supplementation,a at a lower dose |
| 3. Vitamin D supplementation + micronutrient(s) vs micronutrient(s) alone | Other micronutrient(s),b including oral vitamin D (cholecalciferol D₃, ergocalciferol D₂, calcitriol) supplementationa | Other micronutrient(s),b not including vitamin D |
| 4. Vitamin D supplementation (high dose) + micronutrient(s) vs vitamin D (low dose) + micronutrient(s) | Other micronutrient(s),b including oral vitamin D (cholecalciferol D₃, ergocalciferol D₂, calcitriol) supplementation at a higher dosea | Other micronutrient(s),b including vitamin D at a lower dose |
| aAny formulation, including capsules, tablets, soft gels, liquids, sprays/mists, or powders. | ||
| Data analysis | Unused method | Reason for non‐use |
|---|---|---|
| Unit of analysis issues | Cluster‐randomised trials Had we included cluster‐randomised trials, we would have accounted for randomisation of study participant groups by conducting analyses at the cluster level. We would have calculated effect estimates (with respective standard errors (SEs)) by using the generic inverse variance method presented in Review Manager 5 (RevMan 5) (Higgins 2020b; Review Manager 2014). Depending on analyses of included studies, we would have conducted approximately correct analyses, when possible (Higgins 2020b) | No cluster‐randomised trials included in review |
| Cross‐over trials We planned to assess data from a 2‐period, 2‐intervention cross‐over trial by using a paired t‐test to evaluate the difference between 2 measurements (subtracting the control measurement from the experimental measurement) for each study participant (Higgins 2020b). For studies with potential carry‐over effects, we planned to consider only the first period of trial intervention follow‐up (Higgins 2020b) | No cross‐over trials included in quantitative analysis | |
| Subgroup analysis and investigation of heterogeneity | If at least 4 studies measuring a primary outcome had reported on age at time of intervention (birth to 6 months of age vs 7 to 12 months of age, 13 to 36 months of age, 37 to 59 months of age), frequency of supplementation (daily vs intermittent vs other), serum 25(OH)D at baseline (current cutoff levels recommended by the Institute of Medicine and the Endocrine Society (Holick 2011; Institute of Medicine 2011)), geographical latitude (between Tropics of Cancer and Capricorn, compared with north of Tropic of Cancer and south of Tropic of Capricorn), season at start of study (spring, summer, fall, winter), or baseline height/length‐for‐age z‐score, we would have performed subgroup analyses (see the protocol Yu 2017 for details). Subgroup analyses would have been undertaken in RevMan 5 (Review Manager 2014), using methods described in the Cochrane Handbook for Systematic Reviews of Interventions (Deeks 2020) | Not enough studies available (≤ 3) |
| Sensitivity analysis | If at least 10 studies measuring a primary outcome had been available to compare in terms of being published or unpublished, high risk of bias, longer intervention durations or greater sample sizes, influence of methods, and use of filters such as imputation, language of publication, source of funding, and country, we would have performed statistical tests, including Egger's test to assess asymmetry of funnel plots and as indicators of bias (Egger 1997) (see the protocol Yu 2017 for details). Sensitivity analyses would have been undertaken in RevMan 5 (Review Manager 2014), using methods described in the Cochrane Handbook for Systematic Reviews of Interventions (Deeks 2020) | Not enough studies available (≤ 10) |
| Publication bias | We searched 17 electronic databases and 2 trial registries to be as comprehensive as possible in examining all available evidence. However, we were not able to assess for publication bias using funnel plots due to lack of studies for comparison, thereby preventing us from drawing conclusions on publication bias of the included studies | Not enough studies available (≤ 10) |
| Results of sensitivity analysis with fixed‐effect model | |||||
|---|---|---|---|---|---|
| Comparison 1: vitamin D vs placebo or no intervention | Number of studies | Mean difference (95% CI) | Chi² | P value for overall effect | I²(%) |
| Linear growth (Analysis 1.1) | 3 | 0.73 (0.01 to 1.45) | 3.96 | 0.05 | 49 |
| Adverse effect: hypercalciuria (Analysis 1.4) | 2 | 2.03 (0.28 to 14.67) | 0.63 | 0.48 | 0 |
| Adverse effect: hypercalcaemia (Analysis 1.5) | 2 | 0.79 (0.43 to 1.44) | 1.93 | 0.44 | 48 |
| Weight‐for‐height (z‐score) (Analysis 1.8) | 2 | 0.06 (‐0.06 to 0.19) | 13.61 | 0.33 | 93 |
| Serum 25(OH)D (Analysis 1.10) | 21 | 25.04 (23.10 to 26.98) | 369.62 | < 0.001 | 95 |
| Change in 25(OH)D (Analysis 1.11) | 3 | 34.09 (28.90 to 39.28) | 17.35 | < 0.001 | 88 |
| Vitamin D sufficiency (≥ 50 nmol/L) (Analysis 1.12) | 6 | 1.88 (1.66 to 2.14) | 6.25 | < 0.001 | 20 |
| Vitamin D sufficiency (≥ 75 nmol/L) (Analysis 1.13) | 2 | 2.47 (1.50 to 4.06) | 11.30 | 0.0004 | 91 |
| Vitamin D severe deficiency (Analysis 1.14) | 3 | 0.26 (0.19 to 0.36) | 1.68 | < 0.001 | 0 |
| Comparison 2: vitamin D (higher dose) vs vitamin D (lower dose) | Number of studies | Mean difference (95% CI) | Chi² | P value for overall effect | I²(%) |
| Linear growth (Analysis 2.1) | 5 | ‐0.75 (‐1.33 to ‐0.17) | 13.64 | 0.01 | 71 |
| Length/height‐for‐age (z‐score) (Analysis 2.2) | 2 | 0.40 (‐0.06 to 0.86) | 0.04 | 0.09 | 0 |
| Adverse effect: hypercalciuria (Analysis 2.3) | 6 | 1.16 (1.00 to 1.35) | 1.88 | 0.06 | 0 |
| Adverse effect: hypercalcaemia (Analysis 2.4) | 5 | 1.39 (0.89 to 2.18) | 2.16 | 0.15 | 0 |
| Linear growth: gain in length (Analysis 2.5) | 3 | ‐0.01 (‐0.02 to 0.00) | 0.68 | 0.06 | 0 |
| Weight‐for‐age (z‐score) (Analysis 2.6) | 2 | 0.07 (‐0.44 to 0.58) | 0.01 | 0.78 | 0 |
| Serum 25(OH)D (Analysis 2.8) | 20 | 14.73 (13.24 to 16.22) | 493.04 | < 0.001 | 96 |
| Change in 25(OH)D (Analysis 2.9) | 3 | 1.68 (‐1.08 to 4.43) | 3.67 | 0.23 | 46 |
| Vitamin D sufficiency (≥ 50 nmol/L) (Analysis 2.10) | 12 | 1.02 (1.00 to 1.03) | 17.24 | 0.008 | 42 |
| Vitamin D sufficiency (≥ 75 nmol/L) (Analysis 2.11) | 6 | 1.25 (1.18 to 1.31) | 8.05 | < 0.001 | 38 |
| Rickets (Analysis 2.13) | 4 | 0.64 (0.46 to 0.90) | 1.24 | 0.009 | 0 |
| Comparison 4: vitamin D (higher dose) + micronutrient(s) vs vitamin D (lower dose) + micronutrient(s) | Number of studies | Mean difference (95% CI) | Chi² | P value for overall effect | I²(%) |
| Adverse effect: hypercalcaemia (Analysis 4.3) | 2 | 1.00 (0.90 to 1.11) | 0 | 1.00 | 0 |
| Serum 25(OH)D (Analysis 4.5) | 5 | 25.91 (20.50 to 31.32) | 112.69 | < 0.001 | 96 |
| Vitamin D sufficiency (≥ 75 nmol/L) (Analysis 4.7) | 3 | 1.13 (0.97 to 1.31) | 25.65 | 0.12 | 92 |
| Rickets (Analysis 4.8) | 2 | 1.23 (0.24 to 6.30) | 0.43 | 0.80 | 0 |
| CI: confidence interval. | |||||
| Serum 25(OH)D (nmol/L) (Analysis 1.10 ) | ||||||
|---|---|---|---|---|---|---|
| Category | Number of studies | Mean difference (95% CI) | Tau² | Chi² | P value | I²(%) |
| All studies | 20 | 30.91 (21.82 to 40.00) | 385.01 | 369.62 | < 0.001 | 95 |
| Physiological doses only | 15 | 31.00 (20.31 to 41.68) | 388.92 | 306.64 | < 0.001 | 95 |
| Infants only | 14 | 27.95 (17.36 to 38.54) | 357.03 | 240.76 | < 0.001 | 95 |
| Children only (> 1 year) | 5 | 42.50 (20.85 to 64.15) | 460.98 | 31.74 | < 0.001 | 87 |
| CI: confidence interval. | ||||||
| Serum 25(OH)D (nmol/L) (Analysis 2.8 ) | ||||||
|---|---|---|---|---|---|---|
| Category | Number of studies | Mean difference (95% CI) | Tau² | Chi² | P value | I²(%) |
| All studies | 20 | 16.13 (7.11 to 25.15) | 333.01 | 493.04 | < 0.001 | 96 |
| Physiological doses only | 14 | 18.62 (8.86 to 28.39) | 268.61 | 243.46 | < 0.001 | 95 |
| Infants only | 18 | 16.02 (6.16 to 25.87) | 352.80 | 461.94 | < 0.001 | 96 |
| Preterm only | 9 | 12.96 (2.23 to 23.68) | 183.61 | 72.17 | < 0.001 | 89 |
| CI: confidence interval. | ||||||
| Outcome or subgroup title | No. of studies | No. of participants | Statistical method | Effect size |
| 1.1 Linear growth Show forest plot | 3 | 240 | Mean Difference (IV, Random, 95% CI) | 0.66 [‐0.37, 1.68] |
| 1.2 Length/height‐for‐age Show forest plot | 1 | 1258 | Mean Difference (IV, Fixed, 95% CI) | 0.11 [0.00, 0.22] |
| 1.3 Stunting Show forest plot | 1 | 1247 | Risk Ratio (IV, Fixed, 95% CI) | 0.90 [0.80, 1.01] |
| 1.4 Adverse effect: hypercalciuria Show forest plot | 2 | 68 | Risk Ratio (IV, Random, 95% CI) | 2.03 [0.28, 14.67] |
| 1.5 Adverse effect: hypercalcaemia Show forest plot | 2 | 367 | Risk Ratio (IV, Random, 95% CI) | 0.82 [0.35, 1.90] |
| 1.6 Weight‐for‐age Show forest plot | 1 | 1273 | Mean Difference (IV, Fixed, 95% CI) | 0.09 [‐0.02, 0.20] |
| 1.7 Underweight Show forest plot | 1 | 1282 | Risk Ratio (IV, Fixed, 95% CI) | 0.94 [0.80, 1.11] |
| 1.8 Weight‐for‐length/height Show forest plot | 2 | 1442 | Mean Difference (IV, Random, 95% CI) | 0.65 [‐0.67, 1.97] |
| 1.9 Wasting Show forest plot | 1 | 1282 | Risk Ratio (IV, Fixed, 95% CI) | 1.25 [0.82, 1.91] |
| 1.10 Serum 25‐hydroxyvitamin D Show forest plot | 21 | 2202 | Mean Difference (IV, Random, 95% CI) | 30.91 [21.82, 40.00] |
| 1.11 Change in 25(OH)D levels (nmol/L) Show forest plot | 3 | 495 | Mean Difference (IV, Random, 95% CI) | 28.36 [10.41, 46.32] |
| 1.12 Vitamin D sufficiency (≥ 50 nmol/L) Show forest plot | 6 | 982 | Risk Ratio (IV, Random, 95% CI) | 1.88 [1.63, 2.17] |
| 1.13 Vitamin D sufficiency (≥ 75 nmol/L) Show forest plot | 2 | 138 | Risk Ratio (IV, Random, 95% CI) | 5.75 [0.49, 67.59] |
| 1.14 Vitamin D severe deficiency (< 25 to 30 nmol/L) Show forest plot | 3 | 836 | Risk Ratio (IV, Random, 95% CI) | 0.26 [0.19, 0.36] |
| 1.15 Rickets (continuous) Show forest plot | 1 | Mean Difference (IV, Fixed, 95% CI) | Totals not selected | |
| Outcome or subgroup title | No. of studies | No. of participants | Statistical method | Effect size |
| 2.1 Linear growth Show forest plot | 5 | 283 | Mean Difference (IV, Random, 95% CI) | ‐1.00 [‐2.22, 0.21] |
| 2.2 Length/height‐for‐age Show forest plot | 2 | 105 | Mean Difference (IV, Random, 95% CI) | 0.40 [‐0.06, 0.86] |
| 2.3 Adverse effect: hypercalciuria Show forest plot | 6 | 554 | Risk Ratio (IV, Random, 95% CI) | 1.16 [1.00, 1.35] |
| 2.4 Adverse effect: hypercalcaemia Show forest plot | 5 | 986 | Risk Ratio (IV, Random, 95% CI) | 1.39 [0.89, 2.18] |
| 2.5 Linear growth: gain in length Show forest plot | 3 | 378 | Mean Difference (IV, Random, 95% CI) | ‐0.01 [‐0.02, 0.00] |
| 2.6 Weight‐for‐age Show forest plot | 2 | 103 | Mean Difference (IV, Random, 95% CI) | 0.07 [‐0.44, 0.58] |
| 2.7 Weight‐for‐length/height Show forest plot | 1 | 53 | Mean Difference (IV, Fixed, 95% CI) | ‐0.18 [‐0.74, 0.37] |
| 2.8 Serum 25‐hydroxyvitamin D Show forest plot | 20 | 2765 | Mean Difference (IV, Random, 95% CI) | 16.13 [7.11, 25.15] |
| 2.9 Change in 25(OH)D (nmol/L) Show forest plot | 3 | 142 | Mean Difference (IV, Random, 95% CI) | 4.12 [‐5.82, 14.07] |
| 2.10 Vitamin D sufficiency (≥ 50 nmol/L) Show forest plot | 12 | 1735 | Risk Ratio (IV, Random, 95% CI) | 1.04 [1.00, 1.08] |
| 2.11 Vitamin D sufficiency (≥ 75 nmol/L) Show forest plot | 6 | 1172 | Risk Ratio (IV, Random, 95% CI) | 1.31 [1.19, 1.45] |
| 2.12 Vitamin D severe deficiency (< 25 to 30 nmol/L) Show forest plot | 1 | 142 | Risk Ratio (IV, Fixed, 95% CI) | 0.14 [0.02, 1.35] |
| 2.13 Rickets (dichotomous) Show forest plot | 4 | 212 | Risk Ratio (IV, Random, 95% CI) | 0.64 [0.46, 0.90] |
| Outcome or subgroup title | No. of studies | No. of participants | Statistical method | Effect size |
| 3.1 Serum 25‐hydroxyvitamin D Show forest plot | 1 | 50 | Mean Difference (IV, Fixed, 95% CI) | 18.90 [8.53, 29.27] |
| 3.2 Rickets (continuous) Show forest plot | 1 | 53 | Mean Difference (IV, Fixed, 95% CI) | ‐0.94 [‐2.10, 0.22] |
| Outcome or subgroup title | No. of studies | No. of participants | Statistical method | Effect size |
| 4.1 Linear growth Show forest plot | 1 | 25 | Mean Difference (IV, Fixed, 95% CI) | 0.60 [‐3.33, 4.53] |
| 4.2 Adverse effect: hypercalciuria Show forest plot | 1 | 86 | Risk Ratio (IV, Fixed, 95% CI) | 1.00 [0.06, 15.48] |
| 4.3 Adverse effect: hypercalcaemia Show forest plot | 2 | 126 | Risk Ratio (IV, Random, 95% CI) | 1.00 [0.90, 1.11] |
| 4.4 Linear growth: gain in length Show forest plot | 1 | 50 | Mean Difference (IV, Fixed, 95% CI) | 0.73 [0.12, 1.34] |
| 4.5 Serum 25‐hydroxyvitamin D Show forest plot | 5 | 325 | Mean Difference (IV, Random, 95% CI) | 27.94 [‐2.75, 58.63] |
| 4.6 Change in 25(OH)D (nmol/L) Show forest plot | 1 | 30 | Mean Difference (IV, Fixed, 95% CI) | 7.19 [2.97, 11.41] |
| 4.7 Vitamin D sufficiency (≥ 50 nmol/L) Show forest plot | 3 | 225 | Risk Ratio (IV, Random, 95% CI) | 1.34 [0.76, 2.35] |
| 4.8 Rickets (dichotomous) Show forest plot | 2 | 153 | Risk Ratio (IV, Random, 95% CI) | 1.23 [0.24, 6.30] |