Ecocardiografía transtorácica Doppler para la detección de la hipertensión pulmonar en adultos
Resumen
Antecedentes
La hipertensión pulmonar (HP) es una causa importante de morbilidad y mortalidad, que conlleva una pérdida considerable de la capacidad de ejercicio. La HP acaba provocando una sobrecarga del ventrículo derecho y la consiguiente insuficiencia cardíaca y muerte prematura. Aunque se recomienda la detección y el tratamiento tempranos de la HP, debido a la escasa capacidad de respuesta al tratamiento en los estadios tardíos de la enfermedad, muchos pacientes son diagnosticados en un estadio posterior de la enfermedad porque los síntomas y signos de la HP son inespecíficos en los estadios más tempranos. Aunque la medición directa de la presión con un cateterismo cardíaco derecho es la prueba clínica de referencia para la HP, no se utiliza de forma sistemática debido a su carácter invasivo y a sus complicaciones. La ecocardiografía Doppler transtorácica es menos invasiva, más económica y está muy disponible en comparación con el cateterismo cardíaco derecho; por lo tanto, en las guías se recomienda utilizar la ecocardiografía como método de diagnóstico inicial. Sin embargo, varios estudios han cuestionado la exactitud de la presión arterial pulmonar medida de forma no invasiva. Existe una gran incertidumbre sobre la exactitud diagnóstica de la ecocardiografía para el diagnóstico de la HP.
Objetivos
Determinar la exactitud diagnóstica de la ecocardiografía Doppler transtorácica para detectar la HP.
Métodos de búsqueda
Se realizaron búsquedas en MEDLINE, Embase, Web of Science Core Collection, ClinicalTrials.gov, la Plataforma de registros internacionales de ensayos clínicos de la Organización Mundial de la Salud desde el inicio de la base de datos hasta agosto de 2021, en las listas de referencias de los artículos y se estableció contacto con los autores de los estudios. No se aplicaron restricciones en cuanto al idioma ni el tipo de publicación.
Criterios de selección
Se incluyeron los estudios que evaluaron la exactitud diagnóstica de la ecocardiografía Doppler transtorácica para detectar la HP, donde el cateterismo cardíaco derecho fue la prueba de referencia. Se excluyeron los estudios diagnósticos de casos y controles (diseño de dos puertas), los estudios en los que el cateterismo cardíaco derecho no fue la prueba de referencia y aquellos en los que el umbral de la prueba de referencia difería de 25 mmHg. También se excluyeron los estudios que no proporcionaron suficientes datos sobre la exactitud diagnóstica de la prueba (valores verdaderos positivos [VP], falsos positivos [FP], verdaderos negativos [VN] y falsos negativos [FN], según la prueba de referencia). Se incluyeron los estudios que proporcionaron datos de los que se pudieron extraer los valores VP, FP, VN y FN, según la prueba de referencia. Dos autores, de forma independiente, revisaron y evaluaron la elegibilidad a partir de los títulos y resúmenes de los registros identificados por la búsqueda. Tras la revisión del título y el resumen, se obtuvo el texto completo de todos los estudios potencialmente elegibles, y dos autores evaluaron de forma independiente la elegibilidad de estos artículos completos.
Obtención y análisis de los datos
Dos autores de la revisión evaluaron de forma independiente el riesgo de sesgo y extrajeron los datos de cada uno de los estudios incluidos. Se estableció contacto con los autores de los estudios incluidos para obtener los datos faltantes. La calidad metodológica de los estudios se evaluó mediante la herramienta Quality Assessment of Diagnostic Accuracy Studies (QUADAS‐2). Se calculó una curva de resumen de rendimiento diagnóstico (SROC por sus siglas en inglés) mediante el ajuste de un modelo mixto no lineal de resumen jerárquico (HSROC por sus siglas en inglés). Se exploraron las fuentes de heterogeneidad con respecto a los tipos de HP, los métodos para determinar la presión de la aurícula derecha y el umbral de la prueba índice para diagnosticar la HP. Todos los análisis se realizaron con los programas estadísticos Review Manager 5, SAS y STATA.
Resultados principales
Se incluyeron 17 estudios (con 3656 pacientes adultos) que evaluaron la exactitud diagnóstica de la ecocardiografía Doppler transtorácica para el diagnóstico de la HP. Los estudios incluidos fueron heterogéneos en cuanto a la distribución de los pacientes por edad, sexo, clasificación de la OMS, contexto, país, umbral de positividad y año de publicación. Además, la prevalencia de la HP informada en los estudios incluidos varió ampliamente (del 6% al 88%). El umbral de la prueba índice para el diagnóstico de la HP varió ampliamente (de 30 mmHg a 47 mmHg) y no siempre se predefinió. A ningún estudio se le asignó bajo riesgo de sesgo ni se consideró que hubo pocas dudas con respecto a los dominios de QUADAS‐2 evaluados. La escasa información, especialmente en los dominios de la prueba índice y la prueba de referencia, dificultó hacer una evaluación concluyente sobre el riesgo de sesgo. Hubo poca consistencia en los umbrales utilizados en los estudios incluidos; por lo tanto, los umbrales comunes contenían datos muy escasos, lo que impidió calcular puntos de resumen de las estimaciones de exactitud. Con una especificidad fija del 86% (la mediana de la especificidad), la sensibilidad estimada derivada del valor mediano de la especificidad mediante el modelo HSROC fue del 87% (intervalo de confianza [IC] del 95%: 78% a 96%). Utilizando una prevalencia de HP del 68%, que fue la mediana entre los estudios incluidos realizados principalmente en hospitales terciarios, el diagnóstico de una cohorte de 1000 pacientes adultos bajo sospecha de HP daría lugar a que 88 pacientes no fueran diagnosticados de HP (falsos negativos) y 275 pacientes evitarían la derivación innecesaria para un cateterismo cardíaco derecho (verdaderos negativos). Además, 592 de cada 1000 pacientes recibirían una derivación adecuada y oportuna para un cateterismo cardíaco derecho (verdaderos positivos), mientras que 45 pacientes serían considerados erróneamente con HP (falsos positivos). Por el contrario, cuando se asumió una baja prevalencia de HP (10%), como en el caso de las exploraciones preoperatorias para el trasplante de hígado, el número de falsos negativos y falsos positivos sería de 13 y 126, respectivamente.
Conclusiones de los autores
La evaluación de esta revisión de la evidencia de la ecocardiografía para el diagnóstico de la HP en pacientes adultos reveló varias limitaciones. No fue posible determinar la sensibilidad ni la especificidad medias en ningún umbral concreto de la prueba índice ni explicar la variabilidad observada en los resultados. La elevada heterogeneidad de los datos recopilados y la escasa calidad metodológica limitarían la aplicación de este resultado a la práctica clínica. Se necesitan más estudios sobre la exactitud de la ecocardiografía Doppler transtorácica para el diagnóstico de la HP en adultos, que apliquen una metodología rigurosa para realizar estudios de exactitud de pruebas diagnósticas.
Resumen en términos sencillos
Ecocardiografía transtorácica Doppler para la detección de la hipertensión pulmonar en adultos
¿Qué se ha estudiado en esta revisión?
La hipertensión pulmonar es la presión arterial elevada en los vasos sanguíneos que suministran sangre desde la mitad derecha del corazón a los pulmones. Es una enfermedad grave que puede dañar el lado derecho del corazón. Las paredes de los vasos sanguíneos se vuelven gruesas y rígidas, lo que dificulta la circulación de la sangre. Esto puede conducir a insuficiencia cardíaca. Los síntomas pueden incluir dificultad para respirar, cansancio, dolor en el pecho, latidos acelerados del corazón o inflamación de las extremidades inferiores y el abdomen.
Los síntomas pueden ser similares a los de otras enfermedades cardíacas y pulmonares, por lo que el diagnóstico puede llevar tiempo. El diagnóstico temprano es beneficioso porque el tratamiento puede empezar pronto. Empezar el tratamiento pronto es mejor porque las personas responden mejor al tratamiento en los estadios iniciales de la enfermedad. No ser diagnosticado a tiempo puede tener graves consecuencias, como la discapacidad en la vida diaria o la muerte.
La forma más precisa de diagnosticar la hipertensión pulmonar es mediante una medición de la presión denominada cateterismo cardíaco derecho. Sin embargo, es una prueba invasiva y puede provocar complicaciones. Otra técnica, denominada ecocardiografía Doppler, no es invasiva, es más barata y está más disponible en los hospitales. Por ello, muchas guías recomiendan el uso de la ecocardiografía como método de diagnóstico inicial. Esta revisión se ha realizado porque varios estudios han cuestionado la precisión de la ecocardiografía. Se quería averiguar la eficacia de la ecocardiografía en comparación con el cateterismo cardíaco derecho para el diagnóstico de la hipertensión pulmonar.
¿Cuál era el objetivo de esta revisión?
Evaluar la evidencia sobre la capacidad de la ecocardiografía para identificar la hipertensión pulmonar en adultos en comparación con el cateterismo cardíaco derecho.
¿Cuáles son los principales resultados de la revisión?
Se encontraron 17 estudios con 3656 personas con sospecha de hipertensión pulmonar.
Los estudios fueron muy variados. Se comprobó que las características de los participantes variaron en cuanto a la edad, el sexo, la causa de la hipertensión pulmonar, el contexto y el país. Los valores de corte de las lecturas ecocardiográficas elegidas para diagnosticar la hipertensión pulmonar también variaron. Se utilizaron los datos disponibles para determinar el rendimiento de la ecocardiografía en comparación con el cateterismo cardíaco derecho. En los hospitales de atención terciaria, donde se realizaron la mayoría de los estudios incluidos, se supone que 680 de cada 1000 pacientes presentan hipertensión pulmonar. Se encontró que 592 personas de cada 1000 serían diagnosticadas correctamente con hipertensión pulmonar con el uso de la ecocardiografía. Sin embargo, 45 de cada 1000 pacientes serían considerados erróneamente con hipertensión pulmonar (falso positivo), mientras que 88 de cada 1000 pacientes podrían ser considerados erróneamente sin hipertensión pulmonar (falso negativo) y 275 de cada 1000 pacientes evitarían una derivación innecesaria para un cateterismo cardíaco derecho. En un escenario en el que se realiza el examen preoperatorio para el trasplante de hígado, se supone que 100 de cada 1000 presentan hipertensión pulmonar. El número de falsos negativos y falsos positivos sería de 13 y 126, respectivamente.
¿Qué fiabilidad tienen los resultados de los estudios?
Se consideró que los estudios incluidos tenían importantes limitaciones en su validez, lo que significa que tenían un alto riesgo de proporcionar resultados distorsionados. Por lo tanto, no se puede estar seguro de que el número de falsos negativos sea correcto (es decir, podría ser incluso mayor).
¿Para quiénes son relevantes los resultados de esta revisión?
Estos resultados se aplican a los adultos con sospecha de hipertensión pulmonar. Sin embargo, la precisión diagnóstica de la ecocardiografía varió considerablemente entre los estudios y aún no está claro cuál es la causa de esta diversidad en la precisión de la prueba. Cabe destacar que los resultados proceden de estudios realizados en contextos de prevalencia relativamente alta. Por lo tanto, hay que tener cuidado al aplicar este resultado a situaciones concretas.
¿Cuál es el grado de actualización de esta revisión?
La revisión está actualizada hasta agosto de 2021.
Authors' conclusions
Summary of findings
| Patients/population | Adults with suspected pulmonary hypertension | ||||||
|---|---|---|---|---|---|---|---|
| Settings | High‐prevalence settings: tertiary care hospitals including university hospitals or cardiopulmonary centres Low‐prevalence settings: preoperative examinations for liver transplantation | ||||||
| Index test | Systolic pulmonary arterial pressure calculated from the maximum tricuspid regurgitation jet velocity by using the modified Bernoulli equation and adding right atrial pressure by Doppler trans‐thoracic echocardiography | ||||||
| Reference standard | Mean of pulmonary arterial pressure of 25 mmHg or greater assessed by right‐heart catheterisation | ||||||
| Study designs | Prospective or retrospective cohorts and cross‐sectional studies. We excluded case reports and studies of case‐control design. | ||||||
| .Findings | |||||||
| Evaluations (studies) | No. of participants | Comfirmed PH participants | Median sensitivity (IQR) [range] | Median specificity (IQR) [range] | |||
| 17 | 3656 | 1342 | 87% (81 to 92%) [40 to 98%] | 86% (79% to 91%) [33 to 100%] | |||
| Index test | Prevalence1 | No. of participants (studies) | Sensitivity (under fixed specificity of 86%)2 | Specificity (fixed) 3 | Numbers of false positives out of 1000 patients | Numbers of false negatives out of 1000 patients | Quality and Comments |
| Systolic pulmonary arterial pressure by echocardiography | 10% | 3656 (17) | 87% (95% CI 78% to 96%) | 86% | 126 | 13 | No study was assigned low risk of bias or low concern in all QUADAS‐2 domains. Poor reporting, especially in the WHO classification of PH, the index test and reference standard domains, hampered conclusive judgements about the risk of bias. |
| 58% | 59 | 75 | |||||
| 68% | 45 | 88 | |||||
| 77% | 32 | 100 | |||||
| 88% | 17 | 114 | |||||
| 1Minimum, 25 percentile, 50 percentile, 75 percentile, maximum of prevalence among included studies 2HSROC (hierarchical summary receiver operating characteristic) parameters were used to illustrate sensitivity for a fixed specificity of 86% (median specificity of the included studies) Abbreviations: | |||||||
Background
Target condition being diagnosed
Pulmonary hypertension (PH) is an important cause of morbidity and mortality. Although the exact prevalence of PH is not known because of various possible aetiologies, a previous study reported that PH affects up to 100 million people worldwide (Schermuly 2011). PH leads to a substantial loss of exercise capacity and can cause right ventricular overload, resulting in heart failure and early mortality. A recently published study reported that three‐year survival ranges from 58.2% to 73.3% (Ling 2012). PH is diagnosed when resting mean pulmonary arterial pressure is 25 mmHg or more at right‐heart catheterisation. It is a progressive disease that, if left untreated, can be fatal although the rate of progression is highly variable.
PH is divided into five aetiological categories according to the World Health Organization (WHO) criteria (Simonneau 2013).
Group 1 comprises patients with pulmonary arterial hypertension (PAH). This group consists of sporadic idiopathic PH (IPAH), heritable IPAH, and PAH due to diseases that localise to small pulmonary muscular arterioles. These diseases include connective tissue disease, HIV infection, portal hypertension, congenital heart disease, schistosomiasis, chronic haemolytic anaemia, persistent PH of the newborn, pulmonary veno‐occlusive disease, and pulmonary capillary hemangiomatosis. Drug‐induced PAH (including anorexigenic) and toxin‐induced PAH are also considered to belong to group 1 PAH.
Group 2 PH comprises patients with PH due to left heart disease and is the most common form of PH worldwide. PH due to systolic dysfunction, diastolic dysfunction, or valvular heart disease is included in this group.
Group 3 PH includes patients with PH due to lung disease or hypoxaemia. This includes PH caused by chronic obstructive pulmonary disease (COPD), interstitial lung disease, pulmonary disease with a mixed restrictive and obstructive pattern, sleep‐disordered breathing, and alveolar hypoventilation disorders.
Group 4 PH comprises patients with chronic thromboembolic PH due to chronic thromboembolic occlusion of the proximal or distal pulmonary vasculature.
Group 5 PH includes patients with PH with unclear, multifactorial mechanisms.
Although the epidemiology of PH varies among the five groups, most of the available evidence relates to group 1 PAH. The prevalence of group 1 PAH in the general population is estimated to be 5 to 15 cases per 1 million adults (Humbert 2006; Ling 2012). The prevalence of PH in groups 2 to 5 is unknown due to the broad classification and multiple aetiologies. One cohort study reported that the proportion of each group among individuals with PH was 0.18, 0.35, 0.17, 0.09, and 0.21 (Meredith 2014).
The prognosis of PH depends on various factors. The Registry to Evaluate Early and Long‐term PAH Disease Management (REVEAL) risk score is used to predict disease progression (Benza 2010). Poor prognostic indicators include age at initial presentation > 50 years (Peacock 2007), male sex and ≥ 60 years (Marcus 2008), persistent (WHO) functional class III or IV (Appendix 1), pericardial effusion, and elevated right atrial pressure (Paulus 2007; Torbicki 2007). The natural history and prognosis of group 1 PAH are better studied than those of groups 2 through 5. In general, in the absence of therapy, those with group 1 PAH have worse survival than groups 2 through 5. Symptomatic patients with IPAH who do not receive treatment have a median survival of approximately three years. Data from the REVEAL registry reported that, from the time of diagnostic right‐heart catheterisation, people with PAH had one‐, three‐, five‐, and seven‐year survival rates of 85%, 68%, 57%, and 49%, respectively (Benza 2010).
Early detection and treatment of PH is recommended as advanced disease may be less responsive to therapy (Galie 2013). Primary therapy of PH is directed at the underlying cause of the PH. People with persistent PH with WHO functional class II, III, or IV, despite treatment of the underlying cause of the PH, should be referred to a specialised centre to be evaluated for advanced therapy. Advanced therapy is directed at the PH itself, rather than the underlying cause of the PH. It includes treatment with prostacyclin pathway agonists, endothelin receptor antagonists, phosphodiesterase 5 inhibitors, and soluble guanylate cyclase stimulants. Although PH is divided into five aetiological categories, the first diagnosis test for PH is echocardiography. Therefore, we defined the target condition as PH regardless of the WHO classification group 1 to 5.
Index test(s)
Estimated systolic pulmonary artery pressure determination by Doppler trans‐thoracic echocardiography was the Index test. The Doppler echocardiography is a noninvasive test that can be used to estimate the blood flow through blood vessels or cardiac chamber by using high‐frequency sound waves. The tricuspid regurgitation jet velocity, which is the velocity of regurgitated blood flow through tricuspid valve from right ventricular to right atrium, is also estimated by Doppler echocardiography. The systolic pulmonary arterial pressure can be estimated from the maximum tricuspid regurgitation jet velocity by using the modified Bernoulli equation and adding the right atrial pressure (systolic pulmonary arterial pressure = 4 (v)2 + right atrial pressure, where v is the peak velocity of the tricuspid regurgitation jet) (Berger 1985). The majority of people have some degree of tricuspid regurgitation, and the utilisation of tricuspid regurgitation to estimate systolic pulmonary arterial pressure is the most common practice in echocardiography (Kaplan 2010). Right atrial pressure can be estimated by the diameter and collapse of the inferior vena cava (IVC) during spontaneous respiration(Galie 2016; Rudski 2010). An IVC diameter of < 2.1 cm that collapses > 50% with a sniff suggests a normal right atrial pressure of 3 mmHg (range 0–5 mmHg), whereas an IVC diameter of > 2.1 cm that collapses < 50% with a sniff or < 20% on quiet inspiration suggests a high right atrial pressure of 15 mmHg (range 10–20 mmHg) (Galie 2016; Rudski 2010). Several studies have demonstrated an adequate correlation between the estimated systolic pulmonary arterial pressure by Doppler trans‐thoracic echocardiography and the direct measurement of mean pulmonary artery pressure with right‐heart catheterisation (Zhang 2010). If the estimated systolic pulmonary arterial pressure is higher than 35 to 40 mmHg or if tricuspid regurgitation velocity is more than 2.8 m/s, further evaluation is recommended by guidelines to determine if PH is present (Galie 2016; Rudski 2010). Although several studies have demonstrated an adequate correlation between the estimated systolic pulmonary arterial pressure by echocardiography and by the direct measurement of right‐heart catheterisation, several studies have reported that the overinflated lung lowered the diagnostic accuracy of echocardiography (Fisher 2007). In patients with overinflated lungs such as in COPD, the heart may rotate toward the right, which makes it difficult to visualise the tricuspid valve and pulmonary artery. In patients with severe tricuspid regurgitation, pulmonary arterial pressure may also be underestimated (Galie 2016). Another problem of Doppler echocardiography is the overestimation of systolic pulmonary arterial pressure mainly due to the overestimation of right atrial pressure (Fisher 2009;Testani 2010). The size of the IVC, and its variation with respiration may affect this overestimation. Due to the risk of underestimation or overestimation, the current European Society of Cardiology guidelines reported that the estimation of pulmonary arterial pressure based solely on Doppler transthoracic echocardiography measurements could not be suitable for triage for mild and asymptomatic PH (Galie 2016).
Clinical pathway
Symptoms and signs of PH are nonspecific, which frequently result in a delay in diagnosis (Brown 2011). The initial symptoms of PH are exertional dyspnoea, fatigue, chest pain, syncope, palpitations, and peripheral oedema. Many people with PH visit hospitals complaining of these nonspecific symptoms and physicians suspect the presence of PH in the presence of these nonspecific symptoms or following initial evaluation by chest radiograph or electrocardiogram. The classic chest radiograph of an individual with PH shows enlargement of the central pulmonary arteries, right ventricular enlargement, and right atrial dilatation. An electrocardiogram of an individual with PH may show signs of right ventricular disease, which includes right axis deviation, an R wave/S wave ratio greater than one in the lead V1, incomplete or complete right bundle branch block, or increased P wave amplitude in lead II.
When PH is suspected by these signs or initial diagnosis tests, diagnostic evaluation is performed to confirm that PH exists, to determine its severity, and to identify its cause (Figure 1) (Rubin 2016).

Clinical pathway of diagnostic evaluation for pulmonary hypertension among adults, adolescents, and children
Abbreviations: PAH: pulmonary arterial hypertension; PH: pulmonary hypertension (Rubin 2016).
The first step of diagnostic testing is evaluation by echocardiogram. Pulmonary arterial pressure can be estimated by this noninvasive method. When the echocardiogram does not suggest PH, further evaluation depends on clinical suspicion. If clinical suspicion of PH is still high, right‐heart catheterisation should be considered. When the echocardiogram is suggestive of PH, clinicians should evaluate whether left heart disease exists to adequately explain the degree of estimated PH. Patients with substantial left heart disease revealed by the echocardiogram to explain the degree of estimated PH do not require further evaluation to determine the aetiology of PH.
Patients who have no left heart disease should undergo additional diagnostic testing to determine the aetiology of PH other than left heart diseases and appropriate treatment. Such additional tests may include a pulmonary function test, ventilation‐perfusion scanning, overnight oximetry, polysomnography, or laboratory testing (e.g. autoimmune serologies, HIV serology, and liver function tests) based on the history and physical examination.
Right‐heart catheterisation is indicated to confirm PH and its severity. Direct pressure measurement of pulmonary arterial pressure with right‐heart catheterisation is the clinical reference standard to confirm PH (Lewis 2016).
Alternative test(s)
Some additional tests (e.g. chest radiograph, magnetic resonance, computed tomography) may also be considered to confirm the aetiology of PH, however Doppler echocardiography plays a central role in the diagnosis and management of PH (Freed 2016).
Rationale
Many patients are diagnosed at a late stage of the disease because symptoms and signs of PH are nonspecific at the beginning of the disease (Brown 2011). Early and accurate detection of PH would therefore be of great benefit. While direct pressure measurement with right‐heart catheterisation is the clinical reference standard for PH, it is not routinely used in clinical practice due to its invasiveness and potential complications (Connors 1996).
Trans‐thoracic Doppler echocardiography is less invasive, less expensive, and widely available compared with right‐heart catheterisation. The guidelines from the European Society of Cardiology and the European Respiratory Society (Galie 2016) and the expert consensus document from the American Heart Association and the American College of Cardiology Foundation (McLaughlin 2009) suggested that echocardiography should be performed as an initial diagnosis method and as a method for monitoring disease progression for both patients suspected with PH and those diagnosed with PH. However, the guidelines also documented the insufficient test accuracy of Doppler echocardiography. Several studies have questioned the accuracy of noninvasively measured pulmonary arterial pressure (Arcasoy 2003; Fisher 2009; Rich 2011). They reported that Doppler echocardiography underestimated pulmonary arterial pressure, which could lead to missed diagnosis of PH. To avoid diagnosis in later stages of the disease, accurate triage of PH is necessary. We will therefore evaluate the diagnostic accuracy of echocardiography to diagnose patients suspected of PH.
We hypothesise that Doppler echocardiography could be a beneficial test to triage PH since ultrasound devices have become more commonly available in a variety of clinical settings.
Objectives
To determine the diagnostic accuracy of Doppler trans‐thoracic echocardiography for detecting PH in people with suspected pulmonary hypertension.
Secondary objectives
To investigate several possible sources of heterogeneity as indicated below.
-
Types of PH defined by WHO classification (Group 3, not Group 3, or classification not reported).
-
Mechanical ventilation (including noninvasive positive pressure ventilation) or not.
-
Estimation of right atrial pressure (whether estimated by using the diameter and collapse of the IVC during spontaneous respiration or by any other methods).
Methods
Criteria for considering studies for this review
Types of studies
We included studies that evaluated the diagnostic accuracy of trans‐thoracic Doppler echocardiography for detecting PH, where right‐heart catheterisation was the reference standard. We excluded diagnostic case‐control studies (two‐gate design) (Rutjes 2005). We excluded studies where right‐heart catheterisation was not the reference standard or the reference standard threshold differed from 25 mmHg. We excluded studies with an interval of more than one week between the index test and the reference standard because interventions may be implemented soon after the initial examination and medical conditions could differ due to different times (e.g. > 1 week apart) (Delcroix 2010; Lewis 2016). We excluded studies that did not provide sufficient diagnostic test accuracy data (true positive [TP], false positive [FP], true negative [TN], and false negative [FN] values, based on the reference standard) such as case series studies. We included studies that provided data from which we could extract TP, FP, TN, and FN values, based on the reference standard. We contacted study authors for missing data. We did not exclude studies based on the publication type (e.g. full articles, letters to the editor, conference abstracts, or unpublished data).
Participants
We included all adults (16 years of age or older) with suspected PH. We excluded any participant with a prior diagnosis of PH. We did not exclude participants based on sex or cause of PH.
Index tests
Measurement by Doppler trans‐thoracic echocardiography was the index test. We included all studies where systolic pulmonary arterial pressure was calculated from the maximum tricuspid regurgitation jet velocity using the modified Bernoulli equation and adding right atrial pressure (Berger 1985). We included all methods used to measure right atrial pressure (e.g. clinical estimation from jugular venous pressure, using a fixed value from 5 mmHg to 10 mmHg, using the diameter and collapse of the IVC during spontaneous respiration). The threshold of the estimated systolic pulmonary arterial pressure by echocardiography to diagnose PH was defined as the authors defined in the included studies.
Target conditions
The target condition was PH regardless of WHO classification group 1 to 5 (Simonneau 2013).
Reference standards
We included only studies in which PH was defined as a mean pulmonary arterial pressure assessed by right‐heart catheterisation of ≥ 25 mmHg (Hoeper 2013).
Search methods for identification of studies
Electronic searches
We systematically searched the following databases on 21 October 2019 and updated the search on 03 August 2021:
-
MEDLINE Ovid SP (1946 to 03 August 2021) (Appendix 2);
-
Embase Ovid SP (1974 to 03 August 2021) (Appendix 3);
-
Web of Science Core Collection (1970 to 03 August 2021) (Appendix 4).
We searched the following trials registries on 21 October 2019 and updated the search on 03 August 2021:
-
US National Institutes of Health Ongoing Trials Register ClinicalTrials.gov (clinicaltrials.gov/) (Appendix 5).
-
World Health Organization International Clinical Trials Registry Platform (apps.who.int/trialsearch/) (Appendix 5).
We combined search terms describing the target condition and the index text. We did not use search terms to describe diagnostic study designs as this is not currently recommended in the Cochrane Handbook for Systematic Reviews of Diagnostic Test Accuracy (De Vet 2008). We applied no restrictions on language or type of publication.
Searching other resources
To identify additional published, unpublished, and ongoing studies, we entered included studies identified from the above sources into the Web of Science database and used the ‘Related Articles’ feature. We checked the reference lists of all primary studies and relevant systematic reviews. Furthermore, we also searched for conference proceedings through Embase and the Web of Science.
Data collection and analysis
Selection of studies
We undertook the systematic review using the methods outlined in the Cochrane Handbook for Reviews of Diagnostic Test Accuracy (Deeks 2013). Two authors (from JK and YN, YK, YT, MK, SO, HI, TM) independently reviewed titles and abstracts identified by the search strategy. After the title and abstract screening, the full‐text reports of all potentially eligible studies were obtained and two authors independently assessed the eligibility of the full‐text reports. Differences were resolved by discussion between the review authors. We provided details of both included and excluded studies in the Characteristics of included studies and Characteristics of excluded studies tables.
Data extraction and management
Two authors (from JK and YN, YK, YT, MK, SO, HI, TM) independently extracted data on study characteristics, participant demographics, sample size, test methods, methodological quality, sensitivity, and specificity. Two review authors then extracted data to construct a 2 × 2 contingency table. Disagreements were resolved by consensus.
Assessment of methodological quality
We used the QUADAS‐2 tool to assess the quality of studies (Whiting 2011). The qualities to be assessed are described in detail in (Appendix 6). For each item in the quality assessment form, we included a description of how the study addressed the issue and entered a judgement of 'low', 'high', or 'unclear' for the overall risk of bias for each of the four domains. In addition, we added a judgement of 'low', 'high', or 'unclear' for the overall concern of applicability to the review question for domains 1, 2, and 3. The assessment of methodological quality is reported in Assessment of methodological quality table which lists all judgements made for each included study. Two authors (from JK and YN, YK, YT, MK, SO, HI, TM) independently assessed methodological quality. Disagreements were resolved by discussion among the review authors.
Statistical analysis and data synthesis
We performed data synthesis using the methods recommended by the Working Group of the Cochrane Collaboration on Systematic Reviews of Diagnostic Test Accuracy (Deeks 2013). We extracted accuracy data for all thresholds used in the primary studies. We represented individual study sensitivities and specificities in forest plots in order to inspect between‐study variability. These individual study accuracy estimates were also represented in a Receiver Operating Characteristic (ROC) plot of sensitivity versus 1‐specificity to visually assess the correlation between both indices. Given the considerable variation of cut‐off values in the collected data, we did not use the bivariate model and avoided providing the summary point of sensitivity and specificity (Deeks 2013). Instead, we estimated a summary ROC (SROC) curve by fitting a hierarchical summary ROC (HSROC) model (Rutter 2001). Using HSROC parameter estimates, we derived sensitivity at the median value of specificity along with corresponding 95% confidence intervals (CI)s. We set the fixed specificity as median specificity among the included studies and calculated the sensitivity with the corresponding 95% CIs or vice versa in a manner similar to a previous Cochrane review (Molano 2019). This is because diagnostic accuracy studies typically contain fewer patients with the target condition than without, and estimates of sensitivities are often made with less certainty than estimates of specificity. (Best 2018; Heazell 2019). Since we observed a large variability in specificity, we added a post hoc analysis to present the summary of specificity and 95% CI at median sensitivity among the included studies. The potential numerical consequences, given a positive and negative index test result using different prevalence, were calculated. We performed all analyses using Review Manager 5 (Review Manager 2014), STATA software, version 13.0 (Stata 2013), or SAS studio (SAS/STAT®, SAS Institute Inc. NC, USA).
Investigations of heterogeneity
To test whether sensitivity or specificity, or both, differed in subgroups of studies, we tabulated the median and range of sensitivity and specificity for the following subgroups:
-
Types of PH defined by WHO classification (Group 3 (PH due to lung diseases or hypoxaemia), not Group 3, or classification not reported). We expected that measuring tricuspid regurgitation would be more difficult in patients with lung disease, especially COPD, than in patients without lung disease, which could decrease the sensitivity and specificity of echocardiography to detect PH.
-
Mechanical ventilation (including non‐invasive positive pressure ventilation) or not.
-
Estimation of right atrial pressure (using the diameter of IVC, any other methods, or not reported).
Since we observed considerable heterogeneity, we performed a post hoc subgroup analysis using the bivariate model (Macaskill 2021; Reitsma 2005) stratified by the threshold of the index test that was categorised according to the guidelines (Rudski 2010) as follows: < 36 mmHg, ≥ 36 and < 40 mmHg, and ≤ 40 mmHg for clinical implementation.
Sensitivity analyses
We examined the robustness of the meta‐analysis by conducting the following sensitivity analysis where possible.
-
Repeating the analysis excluding studies at high risk of bias in domains 1 or 4 of the QUADAS‐2 assessment: We anticipated that studies at high risk of bias in domains 1 and 4 would have a great impact on meta‐analysis because these domains would cause selection bias.
-
Repeating the analysis for each quartile of prevalence: due to the invasiveness of the reference standard, less severe cases would not be verified by right‐heart catheterisation, which would lead to partial verification bias. We therefore performed additional sensitivity analysis by using prevalence as a surrogate of partial verification. We used the quartiles of prevalence among included studies and checked the robustness of the results.
-
Repeating the analysis by including uninterpretable results as both test negative and positive: although uninterpretable results would be likely to occur among patients with overinflated lung, which is associated with the severity of pulmonary hypertension and causes a difficulty of visualisation, they are not always considered test positive.
Assessment of reporting bias
We did not plan to explore reporting bias due to a lack of suitable statistical methods (Deeks 2013).
Results
Results of the search
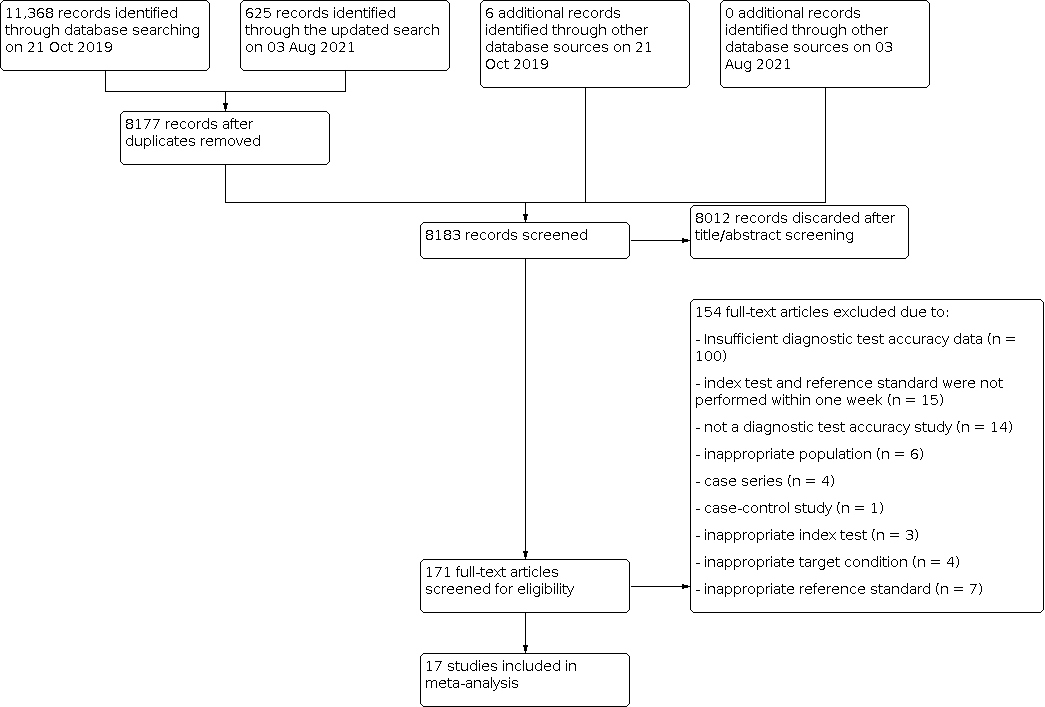
We identified 11,999 references through electronic searches of MEDLINE, Embase, Web of Science, Clinicaltrial.gov, the International Clinical Trials Registry Platform (ICTRP), and additional references through other searches (citation search of previous systematic reviews). The flow of studies through the diagnosis process is shown in Figure 2. After removing 3816 duplicates, 8183 references remained. Of these, we excluded 8012 references by analysis of the title and abstracts. We assessed the full text of the remaining 171 references. We excluded 154 references for reasons listed in the Characteristics of excluded studies table. The remaining 17 references (of 17 studies) met our inclusion criteria.
Flow diagram
Included studies
We summarised the characteristics of the 17 included studies in the Characteristics of included studies table and Table 1. The studies included 3656 participants, of which 1342 participants (37%) had PH. The prevalence of PH ranged from 10% to 88% with a median of 68% (interquartile range (IQR): 58% to 77%). The included studies were conducted in various departments from university or tertiary hospitals; three studies were from lung or liver transplantation centres (Balci 2016; Colle 2003; Wainstein 2017), nine studies were from the cardiology or pulmonary department of university or tertiary hospitals (Amsallem 2016; Er 2010; Greiner 2014; Hellenkamp 2018; Lafitte 2013; Nowak 2018; Sawada 2019; Schneider 2017; Venkateshvaran 2021), and the others were from unclear settings (Hsu 2008; Kyranis 2018; Mazhar 2011; Mo 2015; Mo 2015a).
| Study ID | Number of participants (included in analysis/included in study) | Prevalence of PH (%) | Age | Sex, male (%) | Classification of PH defined by WHO | Threshold of index test (mmHg) | RAP estimation | The interval between the index test and reference standard | How to handle the uninterpretable results of the index test | Sensitivity | Specificity |
|---|---|---|---|---|---|---|---|---|---|---|---|
| 199/307 | 77 | 50 ± (13)* | 46 | NR | 40 | using the diameter of IVC | 2 days | excluded from analysis | 92% | 89% | |
| 103/103 | 57 | 48 (18 to 70)*** | 65 | Group 3 | 35 | NR | 3 days | NA | 85% | 66% | |
| 165/165 | 10 | 48 ± (8)* | 70 | Group 1 | 30 | using the diameter of IVC | 7 days | NA | 76% | 95% | |
| 50/50 | 86 | 66.9 ± (14.5)* | 28 | NR | 38 | using the diameter of IVC | 2 hours | NA | 98% | 100% | |
| 1695/3920 | 72 | 63 ± (15)* | 67 | NR | 36 | using the diameter of IVC | 5 days | excluded from analysis | 87% | 79% | |
| 90/90 | 76 | 64.8 [55 to 79]**** | 48 | NR | 31 | using the diameter of IVC | 1 days | NA | 81% | 55% | |
| 49/55 | 33 | 55 (20 to 80)** | 18 | Group 1 | 47 | not using the diameter of IVC | 4 hours | excluded from analysis | 75% | 91% | |
| 96/100 | 68 | 58 ± (14)* | 43 | NR | 31 | using the diameter of IVC | 1 days | excluded from analysis | 92% | 87% | |
| 155/310 | 67 | 64.8 ± (15.9)* | 52 | NR | 38 | using the diameter of IVC | 5 days | excluded from analysis | 88% | 83% | |
| 99/159 | 58 | NR | NR | NR | 31 | NR | 3 days | excluded from analysis | 67% | 83% | |
| 24/30 | 88 | NR | NR | NR | 35 | NR | 7 days | excluded from analysis | 95% | 33% | |
| 87/87 | 68 | NR | NR | NR | 45 | NR | 7 days | excluded from analysis | 81% | 86% | |
| 37/65 | 70 | 53.3 ± (9.5)* | 75 | NR | 43 | NR | 5 days | excluded from analysis | 92% | 82% | |
| 189 /189 | 26 | 58 ± (17)* | 56 | NR | 41 | using the diameter of IVC | 1 days | NA | 92% | 91% | |
| 65/65 | 83 | 67.2 (19 to 89)** | 43 | mixture of Group 1, 2, 3, and 4 | 34 | not using the diameter of IVC | 1 days | NA | 87% | 91% | |
| 419/480 | 62 | NR | NR | NR | 31 | using the diameter of IVC | 3 hours | excluded from analysis | 40% | 88% | |
| 134/134 | 62 | 47 ± (14.7)* | 47 | Group 3 | 36 | NR | 3 days | NA | 89% | 60% |
* mean ± (SD), ** mean (range), *** median (range), **** mean [interquartile]
Abbreviations:
IVC: inferior vena cava
NA: not applicable
NR: not reported
PH: pulmonary hypertension
RAP, right atrial pressure
WHO: World Health Organization
Of the 17 studies, six studies were prospective (Balci 2016; Colle 2003; Er 2010; Hsu 2008; Kyranis 2018; Schneider 2017); 11 studies were retrospective (Amsallem 2016; Greiner 2014; Hellenkamp 2018; Lafitte 2013; Mazhar 2011; Mo 2015; Mo 2015a; Nowak 2018; Sawada 2019; Venkateshvaran 2021; Wainstein 2017). Four studies were published as abstracts only (Mazhar 2011; Mo 2015; Mo 2015a; Wainstein 2017), and the remaining 13 studies were full‐text publications. We considered Mo 2015 and Mo 2015a to be separate studies because they had different numbers of participants and a different prevalence of PH. However, there is still a potential overlap among the patients included in the two studies.
Four studies enrolled participants with a single WHO classification of PH, two studies enrolled participants with group 1 PH (Colle 2003; Hsu 2008); two studies enrolled participants with group 3 PH (Balci 2016; Wainstein 2017); two studies enrolled participants with group 1, 2, 3 and 4 PH (Er 2010; Schneider 2017); one study enrolled participants with group 2, 3, and 4 PH (Nowak 2018); and the remaining 10 studies did not report the WHO classification. Four studies reported the proportion of mild or asymptomatic participants (Er 2010; Greiner 2014; Hellenkamp 2018; Nowak 2018), but others did not. The reported proportion ranged from 2% to 16%.
The cut‐off value of the index test (systolic pulmonary arterial pressure) ranged from 30 to 47 mmHg with a median of 36 mmHg (IQR: 31 to 40 mmHg). In nine studies, right atrial pressure was measured using the diameter and collapse of the inferior vena cava during spontaneous respiration (Amsallem 2016; Colle 2003; Er 2010; Greiner 2014; Hellenkamp 2018; Kyranis 2018; Lafitte 2013; Sawada 2019; Venkateshvaran 2021); in another study, right atrial pressure was defined as 10 mmHg (Hsu 2008); and the remaining seven studies did not report the methods used to measure right atrial pressure.
The interval between the index test and reference standard was less than one day in seven of the 17 studies (Er 2010; Hellenkamp 2018; Hsu 2008; Kyranis 2018; Sawada 2019; Schneider 2017; Venkateshvaran 2021) and was between two and seven days in the remaining 10 studies.
We contacted trial authors for missing data, but none were provided except for one study (Amsallem 2016).
Excluded studies
We excluded 154 references (154 studies). The reason for exclusion is stated for each study in the Characteristics of excluded studies table and summarised below.
-
insufficient diagnostic test accuracy data: 100
-
index test and reference standard were not performed within one week: 15
-
not a diagnostic test accuracy study: 14
-
inappropriate population: 6
-
case series: 4
-
case‐control study: 1
-
inappropriate index test: 3
-
inappropriate target condition: 4
-
inappropriate reference standard: 7
Methodological quality of included studies
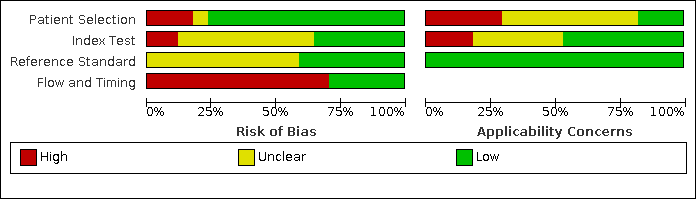
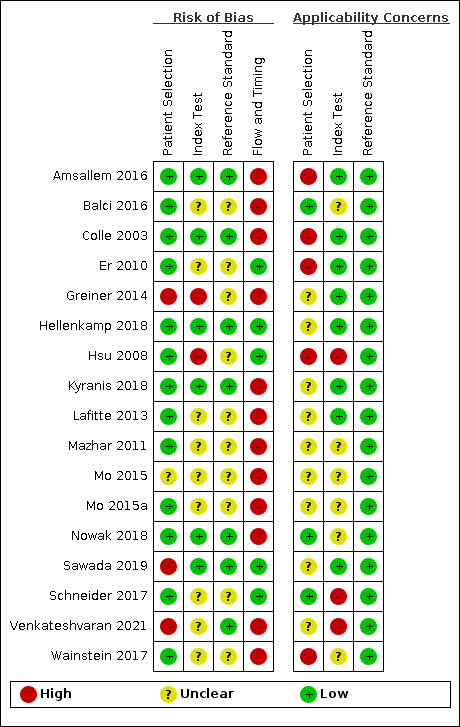
The methodological quality of the included studies is reported in the Characteristics of included studies, Figure 3 and Figure 4. Poor reporting, especially in the index test and reference standard domains, hampered conclusive judgement relative to the risk of bias. Only one study had a low risk of bias in all four domains (Hellenkamp 2018).

Risk of bias and applicability concerns graph: review authors' judgements about each domain presented as percentages across included studies

Risk of bias and applicability concerns summary: review authors' judgements about each domain for each included study
Patients selection domain
Three studies had a high risk of bias with regard to patient selection due to inappropriate exclusion (Greiner 2014; Sawada 2019; Venkateshvaran 2021). For these studies, patients whose index test results were not explicitly documented were excluded. One study had unclear risk of bias because the inclusion procedures were not reported (Mo 2015). For the remaining 13 studies, we rated patient selection as having low risk of bias. We judged applicability as being of high concern. The prevalence from the included studies was high as the included studies were often conducted in tertiary care settings. The classification of PH in the patients included in our review was mainly unclear.
Index test domain
Two studies had a high risk of bias because the threshold of index test was not prespecified ((Greiner 2014; Hsu 2008); in Greiner 2014, the threshold that had the highest accuracy was reported and in Hsu 2008, the threshold that had the highest positive likelihood ratio was reported), seven studies had a low risk of bias (Amsallem 2016; Colle 2003; Hellenkamp 2018; Kyranis 2018; Nowak 2018; Sawada 2019; Venkateshvaran 2021), and we rated the remaining eight studies as having an unclear risk of bias because it was unclear whether the index test results were interpreted without the knowledge of the results of the reference standard (Balci 2016; Er 2010; Lafitte 2013; Mazhar 2011; Mo 2015; Mo 2015a; Schneider 2017; Wainstein 2017) and/or it was unclear whether a threshold was prespecified (Balci 2016; Lafitte 2013; Mazhar 2011; Mo 2015; Mo 2015a; Venkateshvaran 2021; Wainstein 2017). Applicability was judged as of high concern in two studies because right atrial pressure was not measured using the diameter and collapse of the inferior vena cava during spontaneous respiration (Hsu 2008; Schneider 2017), of unclear concern in six studies because the methods used to measure right atrial pressure were unclear (Balci 2016; Mazhar 2011; Mo 2015; Mo 2015a; Nowak 2018; Wainstein 2017), and of low concern in the remaining nine studies.
Reference standard domain
Seven studies were at low risk of bias in the reference standard domain (Amsallem 2016; Colle 2003; Hellenkamp 2018; Kyranis 2018; Nowak 2018; Sawada 2019; Venkateshvaran 2021). For the remaining 10 studies, the risk of bias was unclear because it was not specified whether reference standard results were interpreted without knowledge of the results of the index tests (Balci 2016; Er 2010; Greiner 2014; Hsu 2008; Lafitte 2013; Mazhar 2011; Mo 2015; Mo 2015a; Schneider 2017; Wainstein 2017). It was not clear whether a threshold was prespecified in 13 studies (Balci 2016; Colle 2003; Er 2010; Greiner 2014; Hellenkamp 2018; Hsu 2008; Kyranis 2018; Lafitte 2013; Mazhar 2011; Mo 2015; Mo 2015a; Nowak 2018; Wainstein 2017). Applicability was of low concern in all the studies.
Flow and timing domain
Five studies were at low risk of bias in the flow and timing domain (Er 2010; Hellenkamp 2018; Hsu 2008; Sawada 2019; Schneider 2017). The remaining 12 studies were at high risk of bias. Eight studies excluded some participants from the analysis due to the uninterpretable results of the index test (Amsallem 2016; Greiner 2014; Kyranis 2018; Lafitte 2013; Mazhar 2011; Mo 2015; Mo 2015a; Venkateshvaran 2021) and in 10 studies the interval between the index test and reference standard was not less than one day (Amsallem 2016; Balci 2016; Colle 2003; Greiner 2014; Lafitte 2013; Mazhar 2011; Mo 2015; Mo 2015a; Nowak 2018; Wainstein 2017).
Findings
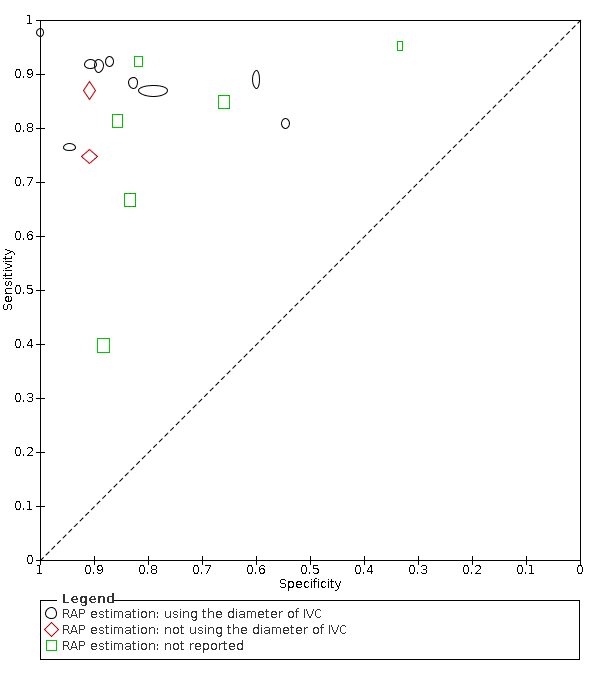
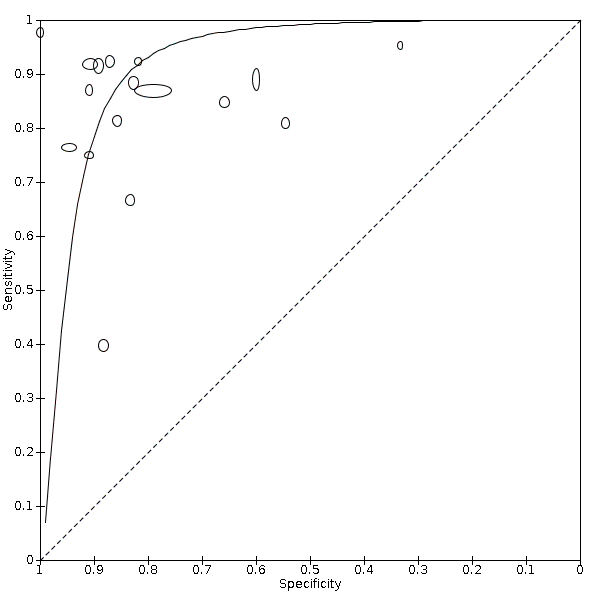
The sensitivity of the index test ranged from 40% to 98% with a median of 87% and the specificity of the index test ranged from 33% to 100% with a median of 86%. The range of sensitivity and specificity estimated by the studies, as well as the different thresholds for echocardiography positive findings, the prevalence of PH, and the methods to estimate the right atrial pressure (RAP) are shown in Figure 5. There was a large variability between the studies and uncertainty in the results. The SROC curve under the HSROC model, representing the accuracy of echocardiography thresholds used across studies, as well as individual study accuracy estimates, are shown in Figure 6. Given the considerable variation of cut‐off values in the collected data, we refrained from calculating the summary diagnostic accuracy using the bivariate model.

Forest plots: sensitivity and specificity of Doppler trans‐thoracic echocardiography for detecting PH
Abbreviations: CI: confidence interval; FN: false negative; FP: false positive; IVC: inferior vena cava; RAP: right atrial pressure; TN: true negative; TP: true positive.

Main analysis: Summary ROC plot and curve of Doppler trans‐thoracic echocardiography for PH under the HSROC model
Abbreviations: HSROC: hierarchical summary receiver operating characteristic; PH: pulmonary hypertension; ROC: receiver operating characteristic.
We used the HSROC parameters to calculate the sensitivity under fixed specificity. As shown in summary of findings Table 1, using a prevalence of PH of 68% (the median prevalence) and a fixed specificity of 86% (the median specificity) (Best 2018; Heazell 2019), the estimated sensitivity was 87% (95% CI 78% to 96%). Seven out of 17 studies in this analysis reported sensitivities inferior to this estimation. The estimated specificity at median sensitivity was 86% (95% CI 76% to 94%).
Additional estimations with a prevalence of 10%, 58%, 77% and 88% (minimum, 25 percentile, 75% percentile and maximum values from included studies) showed an increase in the number of false positives or false negatives, respectively (summary of findings Table 1).
Investigation of heterogeneity
We summarised these results in Table 2. There were many potential sources of variation and too few studies to explain the observed variabilities.
| Covariate | Subgroup | Number of studies | Number of participants | Number of cases | Sensitivity | Specificity |
|---|---|---|---|---|---|---|
| Overall | 17 | 3656 | 1342 | Median (range): 87% (40% to 98%) | Median (range): 86% (33% to 100%) | |
| WHO Classification of PH | Not Group 3 | 3 | 279 | 87 | Median (range): 76% (75% to 87%) | Median (range): 91% (91% to 95%) |
| Group 3 | 2 | 237 | 142 | Median (range): 63% (40% to 85%) | Median (range): 77% (66% to 88%) | |
| Not reported | 12 | 3141 | 1113 | Median (range): 92% (67% to 98%) | Median (range): 85% (33% to 100%) | |
| The methods used to estimating RAP | Using the diameter of IVC | 9 | 3057 | 967 | Median (range): 92% (76% to 98%) | Median (range): 89% (55% to 100%) |
| Not using the diameter of IVC | 2 | 114 | 70 | Median (range): 81% (75% to 87%) | Median (range): 91% (91% to 91%) | |
| Not reported | 6 | 485 | 305 | Median (range): 83% (40% to 95%) | Median (range): 83% (33% to 88%) | |
| Threshold groups | < 36 mmHg | 8 | 1061 | 711 | Pooled sensitivity (95% CI): 89% (79% to 94%) | Pooled specificity (95% CI): 83% (70% to 91%) |
| ≥ 36 mmHg and < 40 mmHg | 4 | 2034 | 328 | Pooled sensitivity* (95% CI): 85% (57% to 96%) | Pooled specificity* (95% CI): 80% (76% to 84%) | |
| ≥ 40 mmHg | 5 | 561 | 303 | Pooled sensitivity* (95% CI): 88% (83% to 92%) | Pooled specificity* (95% CI): 89% (85% to 93%) |
* Pooled sensitivity and specificity estimated by the bivariate random effects model
Abbreviations:
CI: confidence interval
IVC: inferior vena cava
PH: pulmonary hypertension
RAP: right atrial pressure
WHO: World Health Organization
Types of PH defined by WHO classification (Group 3, not Group 3, or classification not reported)
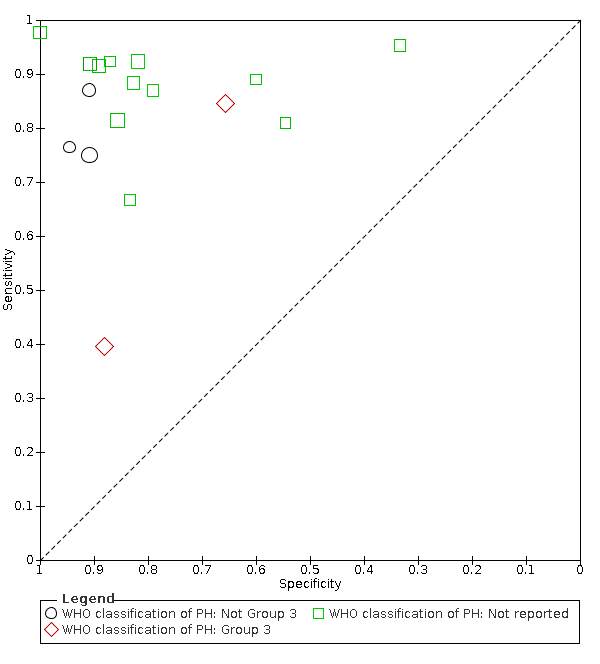
Due to the limited number of studies in each group, especially for non‐reporting of the classification, we could not apply the HSROC model. Instead, we presented the summary plots of the sensitivity and specificity in each subgroup (Figure 7).

Subgroup analysis: Summary ROC plot and curve of Doppler trans‐thoracic echocardiograph for PH by WHO classifications of pulmonary hypertension
Abbreviations: PH: pulmonary hypertension; ROC: receiver operating characteristic; WHO: World Health Organization.
Mechanical ventilation (including non‐invasive positive pressure ventilation) or not
Since all the included studies did not recruit patients undergoing mechanical ventilation, we could not perform this analysis.
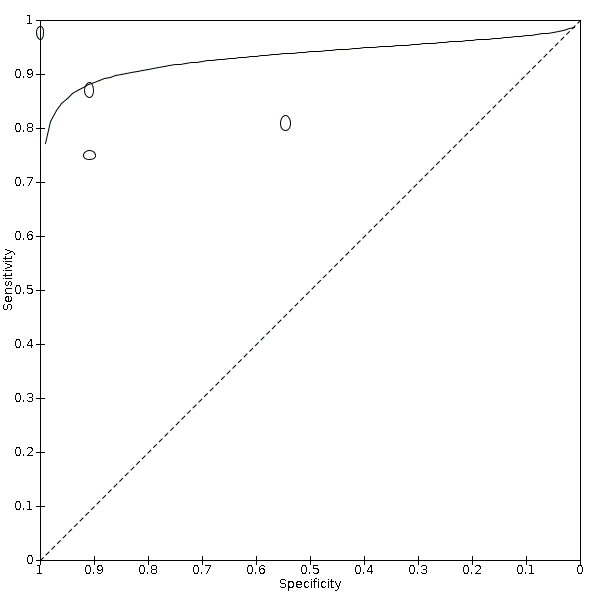
Estimation of right atrial pressure (using the diameter of IVC, any other methods, or not reported)
In 10 studies, right atrial pressure was measured using the diameter and collapse of the inferior vena cava during spontaneous respiration, in two studies, the diameter of the inferior vena cava was not used to measure right atrial pressure, and in the remaining six studies, the method of measuring right atrial pressure was not reported. Due to the limited number of studies in the group using other methods than IVC, we could not apply the HSROC model. Instead, we presented the summary plots of the sensitivity and specificity in each subgroup (Figure 8).
Subgroup analysis: Summary ROC plot and curve of Doppler trans‐thoracic echocardiograph for PH by methods used to estimate RAP
Abbreviations: RAP: right atrial pressure; ROC: receiver operating characteristic.
Threshold of index test (< 36 mmHg, ≥ 36 and < 40 mmHg, and ≤ 40 mmHg)
The pooled sensitivity and specificity of each threshold category are shown in Table 2 and Figure 9. Although we could not observe a clear threshold effect between the categories, there was a large overlap of 95% CIs.

Subgroup analysis: Summary ROC plot of Doppler trans‐thoracic echocardiograph for PH by thresholds under the bivariate model
Abbreviations: RAP: right atrial pressure; ROC: receiver operating characteristic.
Sensitivity analyses
Table 3 summarised the results from sensitivity analyses. We presented the pooled sensitivity under the fixed specificity of 86% (median of the included studies).
| Types of sensitivity analysis | Subgroup | Number of studies | Number of participants | Number of cases | Pooled sensitivity (95% CI) under fixed specificity of 86%* |
|---|---|---|---|---|---|
| Overall | 17 | 3,656 | 1,342 | 87% (81% to 92%) | |
| Excluding studies at high risk of bias in domains 1 or 4 of the QUADAS‐2 assessment | Not high risk of bias in domains 1 or 4 | 4 | 254 | 181 | 83% (11% to 100%) |
| Prevalence category | 1st quartile | 4 | 2098 | 181 | 84% (67% to 100%) |
| 2nd quartile | 4 | 491 | 302 | 70% (8% to 100%) | |
| 3rd quartile | 4 | 310 | 218 | 79% (28% to 100%) | |
| 4th quartile | 5 | 757 | 641 | 84% (6% to 100%) |
* Pooled sensitivity and its 95% confidence interval using fixed specificity of 86% (median of the included studies).
Abbreviations:
CI: confidence interval
QUADAS‐2: a revised tool for the quality assessment of diagnostic accuracy studies
The results were similar to the main results when we excluded studies at high risk of bias in domains 1 and 4 of QUADAS‐2 (Figure 10). The sensitivity varied with the prevalence, but we could not find a clear dose‐response relationship between the accuracy and prevalence (Figure 11).

Sensitivity analysis: Summary ROC plot and curve of Doppler trans‐thoracic echocardiograph for PH, excluding studies at high risk of bias in domain 1 or 4 in QUADAS‐2 assessment under the HSROC model
Abbreviations: HSROC: hierarchical summary receiver operating characteristic; PH: pulmonary hypertension; QUADAS: Quality Assessment of Diagnostic Accuracy Studies; ROC: receiver operating characteristic.

Sensitivity analysis: Summary ROC plot and curve of Doppler trans‐thoracic echocardiograph for PH, repeating the analysis for each quartile of prevalence under the HSROC model
Abbreviations: PH: pulmonary hypertension; ROC: receiver operating characteristic.
We could not perform sensitivity analysis on uninterpretable results it because such patients were excluded from the analysis and the data on whether they had PH was not available (Table 1).
Discussion
Summary of main results
We included 17 studies (3656 adult patients) assessing the diagnostic accuracy of Doppler trans‐thoracic echocardiography for the diagnosis of PH. The included studies enrolled patients suspected of PH. The samples were heterogeneous in terms of their distribution of age, sex, WHO classification, setting, country, positivity threshold, and year of publication. In addition, the prevalence of PH reported in the included studies varied widely (from 6% to 88%). Epidemiological and clinical characteristics of participants are presented in Table 1 and key results in summary of findings Table 1.
The estimated sensitivity was 87% (95% CI 78 to 96%) when we applied the median specificity of 86% among the included studies. When applying a cohort assuming a 68% prevalence of PH which was the median of the included studies, the result suggested that 275 out of 1000 patients would avoid unnecessary referral for a right‐heart catheterisation but 88 would miss PH diagnosis. The intended role of Doppler echocardiography is as a triage which is used before the reference standard to avoid unnecessary referrals and to minimise false negatives. Given the number of false negatives, the poor prognosis of PH, and the results of our review, a single echocardiography may not be acceptable as a triage test for PH in such a hypothetical cohort. The results of applying the test in other settings with the prevalence of 10%, 58%, 77%, and 88% (minimum, 25% percentile, 75% percentile, and maximum values from included studies) are summarised in the summary of findings Table 1.
Previous reviews reported that Doppler echocardiography was useful for triage to undergo right‐heart catheterisation (Janda 2011; Taleb 2013; Zhang 2010). However, as shown in summary of findings Table 1, the diagnostic accuracy of Doppler echocardiography is not likely to be sufficient for clinical use in patients suspected of having PH in settings where the prevalence of PH is high. Such settings include patients with heart failure treated in tertiary care hospitals or patients with end‐stage lung disease who need lung transplantation (Andersen 2012; Bursi 2012; Dzudie 2014). This inaccuracy is likely to partly be due to the problem of overestimation or underestimation of pulmonary arterial pressure, as reported previously (Fisher 2009; Galie 2016; Lang 2015). When the prevalence is low (10%), as is the case for preoperative examinations for liver transplantation (Colle 2003) in the present review, the number of true negatives and false negatives would be 808 and 8 of 1000, respectively. Such low prevalence scenarios can also be apparent in patients with systemic sclerosis or older patients with chronic obstructive pulmonary disease (Avouac 2010; Moreira 2015). In these settings, Doppler echocardiography might be considered as a triage test.
The consequences of applying the test to the hypothetical cohort above used the estimated sensitivity at a fixed specificity. Of note, the reporting sensitivity at a fixed specificity does not indicate how the test would likely perform in practice but represents a point on the HSROC curve that is ideally somewhere near the centre of the observed data. Overall, the methodological quality was low; no study was assigned a low risk of bias or low concern in each QUADAS‐2 domain assessed. Further, there was a high concern regarding applicability due to a variety of settings, characteristics of participants, and prevalence. Poor reporting, especially in the index test and reference standard domains, also raises unclear concerns. Due to the limited amount of data, it was not possible to estimate the cause of heterogeneity in the results of each study. Therefore, the uncertainty of the present results should be noted.
Our meta‐analysis yielded better diagnostic values of Doppler echocardiography as compared with several systematic reviews on the same topic (Janda 2011; Taleb 2013; Zhang 2010). The difference might be due to the discrepancy in reference standards between the previous and current reviews. We used a strict reference standard that is likely to diagnose the target condition with a high degree of accuracy. On the other hand, the three reviews included studies where the interval between the index test and the reference standard was more than one week. Both echocardiography and right‐heart catheterisation are subject to disagreement when performed at different times (e.g. days or weeks apart), which is a major limitation of the studies that compare their accuracy in the diagnosis of PH. For example, any treatment would be performed if the results of echocardiography suggested pulmonary hypertension (Delcroix 2010). This could lead to negative results for a reference standard performed a few weeks or months later, which means that the false positive rate increases and specificity decreases. We therefore excluded studies with an interval of more than a week to obtain unbiased estimates.
The included studies adopted a variety of thresholds to diagnose PH (30 to 47 mmHg). Therefore, we used the HSROC model to take the variation into account. We also performed the post hoc subgroup analysis by the threshold categories. The analysis did not show a clear threshold effect in the range of thresholds. However, higher thresholds ≥ 40 mmHg might be avoided based on the role as a triage test.
Strengths and weaknesses of the review
We conducted a thorough literature search and included full‐text publications and abstracts without any language restrictions. There are currently no reliable search strategies to identify diagnostic test accuracy studies (Beynon 2013). The major strengths of the review are as follows: we did not use any diagnostic filters in our search strategy, which ensured that all studies on the topic were identified. PH was defined when the mean pulmonary arterial pressure assessed by right‐heart catheterisation was ≥ 25 mmHg (Simonneau 2013). This strict reference standard was used as it likely could diagnose the target condition with a high degree of accuracy.
This review has several limitations. First, many studies were excluded due to insufficient diagnostic test accuracy data. Of the 131 studies excluded at full‐text screening, 85 studies were excluded because of lack of diagnostic accuracy data, which matched the inclusion criteria of our review. If some of these studies could have been included in our review, the results of our review might have changed. Second, we attempted to obtain detailed data by contacting the authors of included studies, but most of them were not available, especially for studies that were published as conference abstracts. The space limitations for the publication of a conference abstract would yield unclear risk of bias judgements rather than low or high judgements during the QUADAS‐2 assessment. Furthermore, due to the lack of information, there might be potential patient overlap between Mo 2015 and Mo 2015a. Third, there was a high proportion of studies that were judged at high risk of bias on the flow and timing domain and with high concern regarding applicability in the patient selection domain of the QUADAS‐2 tool.
Applicability of findings to the review question
Although our review collated all available evidence on the diagnostic accuracy of Doppler echocardiography for PH, the applicability of our findings to the review question was limited. PH was highly prevalent among the participants in the included studies. For example, the mean systolic pulmonary arterial pressure was 62.3 mmHg and the prevalence of PH was 86% in Er 2010. It is questionable if the triage test is needed in such a high‐prevalence setting. The care settings were mostly hospitals such as university hospitals, cardiovascular centres, and lung and liver transplant centres. Findings from such settings may be difficult to apply to other settings that play a triage role for assessment of PH. Our sensitivity analysis did not show a dose‐response relationship between prevalence and diagnostic accuracy of Doppler echocardiography; however, it was not conclusive as the CIs were substantially wide due to the limited data. We could not investigate the potential reason for the variety of prevalence due to the poor reporting of patient characteristics including WHO classification of PH. Additionally, there was limited information on the symptoms that the participants had. In the four studies that reported the information on symptoms, the proportion of mild or asymptomatic patients was small.

Clinical pathway of diagnostic evaluation for pulmonary hypertension among adults, adolescents, and children
Abbreviations: PAH: pulmonary arterial hypertension; PH: pulmonary hypertension (Rubin 2016).

Risk of bias and applicability concerns graph: review authors' judgements about each domain presented as percentages across included studies
Risk of bias and applicability concerns summary: review authors' judgements about each domain for each included study

Forest plots: sensitivity and specificity of Doppler trans‐thoracic echocardiography for detecting PH
Abbreviations: CI: confidence interval; FN: false negative; FP: false positive; IVC: inferior vena cava; RAP: right atrial pressure; TN: true negative; TP: true positive.
Main analysis: Summary ROC plot and curve of Doppler trans‐thoracic echocardiography for PH under the HSROC model
Abbreviations: HSROC: hierarchical summary receiver operating characteristic; PH: pulmonary hypertension; ROC: receiver operating characteristic.
Subgroup analysis: Summary ROC plot and curve of Doppler trans‐thoracic echocardiograph for PH by WHO classifications of pulmonary hypertension
Abbreviations: PH: pulmonary hypertension; ROC: receiver operating characteristic; WHO: World Health Organization.

Subgroup analysis: Summary ROC plot and curve of Doppler trans‐thoracic echocardiograph for PH by methods used to estimate RAP
Abbreviations: RAP: right atrial pressure; ROC: receiver operating characteristic.

Subgroup analysis: Summary ROC plot of Doppler trans‐thoracic echocardiograph for PH by thresholds under the bivariate model
Abbreviations: RAP: right atrial pressure; ROC: receiver operating characteristic.
Sensitivity analysis: Summary ROC plot and curve of Doppler trans‐thoracic echocardiograph for PH, excluding studies at high risk of bias in domain 1 or 4 in QUADAS‐2 assessment under the HSROC model
Abbreviations: HSROC: hierarchical summary receiver operating characteristic; PH: pulmonary hypertension; QUADAS: Quality Assessment of Diagnostic Accuracy Studies; ROC: receiver operating characteristic.

Sensitivity analysis: Summary ROC plot and curve of Doppler trans‐thoracic echocardiograph for PH, repeating the analysis for each quartile of prevalence under the HSROC model
Abbreviations: PH: pulmonary hypertension; ROC: receiver operating characteristic.

Doppler trans‐thoracic echocardiography
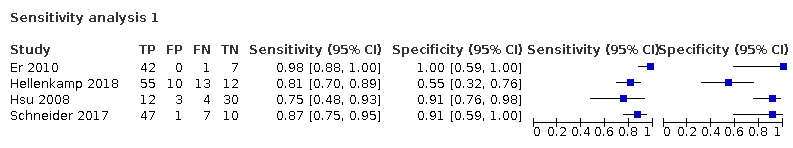
Sensitivity analysis 1
| Patients/population | Adults with suspected pulmonary hypertension | ||||||
|---|---|---|---|---|---|---|---|
| Settings | High‐prevalence settings: tertiary care hospitals including university hospitals or cardiopulmonary centres Low‐prevalence settings: preoperative examinations for liver transplantation | ||||||
| Index test | Systolic pulmonary arterial pressure calculated from the maximum tricuspid regurgitation jet velocity by using the modified Bernoulli equation and adding right atrial pressure by Doppler trans‐thoracic echocardiography | ||||||
| Reference standard | Mean of pulmonary arterial pressure of 25 mmHg or greater assessed by right‐heart catheterisation | ||||||
| Study designs | Prospective or retrospective cohorts and cross‐sectional studies. We excluded case reports and studies of case‐control design. | ||||||
| .Findings | |||||||
| Evaluations (studies) | No. of participants | Comfirmed PH participants | Median sensitivity (IQR) [range] | Median specificity (IQR) [range] | |||
| 17 | 3656 | 1342 | 87% (81 to 92%) [40 to 98%] | 86% (79% to 91%) [33 to 100%] | |||
| Index test | Prevalence1 | No. of participants (studies) | Sensitivity (under fixed specificity of 86%)2 | Specificity (fixed) 3 | Numbers of false positives out of 1000 patients | Numbers of false negatives out of 1000 patients | Quality and Comments |
| Systolic pulmonary arterial pressure by echocardiography | 10% | 3656 (17) | 87% (95% CI 78% to 96%) | 86% | 126 | 13 | No study was assigned low risk of bias or low concern in all QUADAS‐2 domains. Poor reporting, especially in the WHO classification of PH, the index test and reference standard domains, hampered conclusive judgements about the risk of bias. |
| 58% | 59 | 75 | |||||
| 68% | 45 | 88 | |||||
| 77% | 32 | 100 | |||||
| 88% | 17 | 114 | |||||
| 1Minimum, 25 percentile, 50 percentile, 75 percentile, maximum of prevalence among included studies 2HSROC (hierarchical summary receiver operating characteristic) parameters were used to illustrate sensitivity for a fixed specificity of 86% (median specificity of the included studies) Abbreviations: | |||||||
| Study ID | Number of participants (included in analysis/included in study) | Prevalence of PH (%) | Age | Sex, male (%) | Classification of PH defined by WHO | Threshold of index test (mmHg) | RAP estimation | The interval between the index test and reference standard | How to handle the uninterpretable results of the index test | Sensitivity | Specificity |
|---|---|---|---|---|---|---|---|---|---|---|---|
| 199/307 | 77 | 50 ± (13)* | 46 | NR | 40 | using the diameter of IVC | 2 days | excluded from analysis | 92% | 89% | |
| 103/103 | 57 | 48 (18 to 70)*** | 65 | Group 3 | 35 | NR | 3 days | NA | 85% | 66% | |
| 165/165 | 10 | 48 ± (8)* | 70 | Group 1 | 30 | using the diameter of IVC | 7 days | NA | 76% | 95% | |
| 50/50 | 86 | 66.9 ± (14.5)* | 28 | NR | 38 | using the diameter of IVC | 2 hours | NA | 98% | 100% | |
| 1695/3920 | 72 | 63 ± (15)* | 67 | NR | 36 | using the diameter of IVC | 5 days | excluded from analysis | 87% | 79% | |
| 90/90 | 76 | 64.8 [55 to 79]**** | 48 | NR | 31 | using the diameter of IVC | 1 days | NA | 81% | 55% | |
| 49/55 | 33 | 55 (20 to 80)** | 18 | Group 1 | 47 | not using the diameter of IVC | 4 hours | excluded from analysis | 75% | 91% | |
| 96/100 | 68 | 58 ± (14)* | 43 | NR | 31 | using the diameter of IVC | 1 days | excluded from analysis | 92% | 87% | |
| 155/310 | 67 | 64.8 ± (15.9)* | 52 | NR | 38 | using the diameter of IVC | 5 days | excluded from analysis | 88% | 83% | |
| 99/159 | 58 | NR | NR | NR | 31 | NR | 3 days | excluded from analysis | 67% | 83% | |
| 24/30 | 88 | NR | NR | NR | 35 | NR | 7 days | excluded from analysis | 95% | 33% | |
| 87/87 | 68 | NR | NR | NR | 45 | NR | 7 days | excluded from analysis | 81% | 86% | |
| 37/65 | 70 | 53.3 ± (9.5)* | 75 | NR | 43 | NR | 5 days | excluded from analysis | 92% | 82% | |
| 189 /189 | 26 | 58 ± (17)* | 56 | NR | 41 | using the diameter of IVC | 1 days | NA | 92% | 91% | |
| 65/65 | 83 | 67.2 (19 to 89)** | 43 | mixture of Group 1, 2, 3, and 4 | 34 | not using the diameter of IVC | 1 days | NA | 87% | 91% | |
| 419/480 | 62 | NR | NR | NR | 31 | using the diameter of IVC | 3 hours | excluded from analysis | 40% | 88% | |
| 134/134 | 62 | 47 ± (14.7)* | 47 | Group 3 | 36 | NR | 3 days | NA | 89% | 60% | |
| * mean ± (SD), ** mean (range), *** median (range), **** mean [interquartile] Abbreviations: | |||||||||||
| Covariate | Subgroup | Number of studies | Number of participants | Number of cases | Sensitivity | Specificity |
|---|---|---|---|---|---|---|
| Overall | 17 | 3656 | 1342 | Median (range): 87% (40% to 98%) | Median (range): 86% (33% to 100%) | |
| WHO Classification of PH | Not Group 3 | 3 | 279 | 87 | Median (range): 76% (75% to 87%) | Median (range): 91% (91% to 95%) |
| Group 3 | 2 | 237 | 142 | Median (range): 63% (40% to 85%) | Median (range): 77% (66% to 88%) | |
| Not reported | 12 | 3141 | 1113 | Median (range): 92% (67% to 98%) | Median (range): 85% (33% to 100%) | |
| The methods used to estimating RAP | Using the diameter of IVC | 9 | 3057 | 967 | Median (range): 92% (76% to 98%) | Median (range): 89% (55% to 100%) |
| Not using the diameter of IVC | 2 | 114 | 70 | Median (range): 81% (75% to 87%) | Median (range): 91% (91% to 91%) | |
| Not reported | 6 | 485 | 305 | Median (range): 83% (40% to 95%) | Median (range): 83% (33% to 88%) | |
| Threshold groups | < 36 mmHg | 8 | 1061 | 711 | Pooled sensitivity (95% CI): 89% (79% to 94%) | Pooled specificity (95% CI): 83% (70% to 91%) |
| ≥ 36 mmHg and < 40 mmHg | 4 | 2034 | 328 | Pooled sensitivity* (95% CI): 85% (57% to 96%) | Pooled specificity* (95% CI): 80% (76% to 84%) | |
| ≥ 40 mmHg | 5 | 561 | 303 | Pooled sensitivity* (95% CI): 88% (83% to 92%) | Pooled specificity* (95% CI): 89% (85% to 93%) | |
| * Pooled sensitivity and specificity estimated by the bivariate random effects model Abbreviations: | ||||||
| Types of sensitivity analysis | Subgroup | Number of studies | Number of participants | Number of cases | Pooled sensitivity (95% CI) under fixed specificity of 86%* |
|---|---|---|---|---|---|
| Overall | 17 | 3,656 | 1,342 | 87% (81% to 92%) | |
| Excluding studies at high risk of bias in domains 1 or 4 of the QUADAS‐2 assessment | Not high risk of bias in domains 1 or 4 | 4 | 254 | 181 | 83% (11% to 100%) |
| Prevalence category | 1st quartile | 4 | 2098 | 181 | 84% (67% to 100%) |
| 2nd quartile | 4 | 491 | 302 | 70% (8% to 100%) | |
| 3rd quartile | 4 | 310 | 218 | 79% (28% to 100%) | |
| 4th quartile | 5 | 757 | 641 | 84% (6% to 100%) | |
| * Pooled sensitivity and its 95% confidence interval using fixed specificity of 86% (median of the included studies). Abbreviations: | |||||
| Test | No. of studies | No. of participants |
| 1 Doppler trans‐thoracic echocardiography Show forest plot | 17 | 3656 |
| 2 Sensitivity analysis 1 Show forest plot | 4 | 254 |