Inhibidores selectivos de la recaptación de serotonina para la eyaculación precoz en hombres adultos
Resumen
Antecedentes
La eyaculación precoz (EP) es un problema común entre los hombres que se produce cuando la eyaculación se produce antes de lo que el hombre o su pareja desearían durante las relaciones sexuales; puede causar insatisfacción y problemas en la relación. Los inhibidores selectivos de la recaptación de serotonina (ISRS), que habitualmente son más utilizados como antidepresivos, se utilizan para tratar esta enfermedad.
Objetivos
Evaluar los efectos de los ISRS en el tratamiento de la EP en hombres adultos.
Métodos de búsqueda
Se realizó una búsqueda exhaustiva utilizando múltiples bases de datos (la Biblioteca Cochrane, MEDLINE, Embase, Scopus, CINAHL), registros de ensayos clínicos, actas de congresos y otras fuentes de literatura gris, hasta el 1 de mayo de 2020. No se impusieron restricciones respecto al idioma ni el estado de publicación.
Criterios de selección
Sólo se incluyeron los ensayos clínicos controlados aleatorizados (ensayos de grupos paralelos y cruzados [cross‐over]) que administraron ISRS o placebo a hombres con EP. También se consideró que "ningún tratamiento" era un comparador elegible, pero no se encontraron estudios relevantes.
Obtención y análisis de los datos
Dos autores de la revisión clasificaron y resumieron de forma independiente los datos de los estudios incluidos. Los desenlaces principales fueron el cambio percibido por el participante con el tratamiento, la satisfacción con las relaciones sexuales y el abandono del estudio debido a eventos adversos. Los desenlaces secundarios incluyeron el control autopercibido sobre la eyaculación, la angustia de los participantes acerca de la EP, los eventos adversos y el tiempo de latencia eyaculatoria intravaginal (TLEI). Se realizaron análisis estadísticos con un modelo de efectos aleatorios. La certeza de la evidencia se calificó según el método GRADE.
Resultados principales
Se identificaron 31 estudios que asignaron al azar a 8254 participantes a recibir ISRS o placebo.
Desenlaces principales: El tratamiento con ISRS probablemente mejora los síntomas autopercibidos de la EP (definidos como una calificación de "mejor" o "mucho mejor") en comparación con el placebo (razón de riesgos [RR] 1,92; intervalo de confianza [IC] del 95%: 1,66 a 2,23; evidencia de certeza moderada). Sobre la base de 220 participantes de 1000 que comunicaron una mejoría con placebo, esto se corresponde con 202 hombres más de cada 1000 (IC del 95%: 145 más a 270 más) con una mejoría en los síntomas con los ISRS.
El tratamiento con ISRS probablemente mejora la satisfacción con las relaciones sexuales en comparación con el placebo (definida como una calificación de "buena" o "muy buena"; RR 1,63; IC del 95%: 1,42 a 1,87; evidencia de certeza moderada). Sobre la base de 278 participantes de 1000 que comunicaron una mayor satisfacción con el placebo, esto se corresponde con 175 más (IC del 95%: 117 más a 242 más) de cada 1000 hombres más satisfechos con las relaciones sexuales con los ISRS.
El tratamiento con ISRS podría aumentar las interrupciones del tratamiento debido a eventos adversos en comparación con el placebo (RR 3,80; IC del 95%: 2,61 a 5,51; evidencia de certeza baja). Sobre la base de 11 retiros del estudio por cada 1000 participantes con placebo, esto se corresponde con 30 hombres más por cada 1000 (IC del 95%: 17 más a 49 más) que interrumpen el tratamiento debido a eventos adversos con los ISRS.
Desenlaces secundarios: Es probable que el tratamiento con ISRS mejore el control autopercibido de los participantes sobre la eyaculación (definido como calificación de "bueno" o "muy bueno") en comparación con el placebo (RR 2,29; IC del 95%: 1,72 a 3,05; evidencia de certeza moderada). Si se supone que 132 de 1000 participantes con placebo percibieron al menos un buen control, esto corresponde a 170 más (entre 95 más y 270 más) que notificaron al menos un buen control con los ISRS.
Los ISRS probablemente disminuyen la angustia (definida como la calificación de "un poco" o "nada") sobre la EP (RR 1,54; IC del 95%: 1,26 a 1,88; evidencia de certeza moderada). Sobre la base de 353 de 1000 participantes que comunicaron niveles bajos de angustia, esto se corresponde con 191 hombres más (92 más a 311 más) de cada 1000 que comunican niveles bajos de angustia con los ISRS.
El tratamiento con ISRS probablemente aumenta los eventos adversos en comparación con el placebo (RR 1,71; IC del 95%: 1,48 a 1,99; evidencia de certeza moderada). Sobre la base de 243 eventos adversos de 1000 en los hombres que reciben placebo, esto se corresponde con 173 más (117 más a 241 más) hombres que presentan un evento adverso con los ISRS.
El tratamiento con ISRS podría aumentar el TLEI en comparación con el placebo (diferencia de medias [DM] 3,09 minutos más; IC del 95%: 1,94 más a 4,25 más; evidencia de certeza baja).
Conclusiones de los autores
El tratamiento con ISRS para la EP parece mejorar de forma sustancial una serie de desenlaces de importancia directa para el paciente, como la mejoría de los síntomas, la satisfacción con las relaciones sexuales y el control percibido sobre la eyaculación, en comparación con el placebo. Los efectos no deseados suponen un pequeño aumento de los retiros del tratamiento debido a eventos adversos, así como un aumento sustancial de las tasas de eventos adversos. Los problemas que afectan a la certeza de la evidencia de los desenlaces fueron las limitaciones de los estudios y la imprecisión.
PICO
Resumen en términos sencillos
Inhibidores selectivos de la recaptación de serotonina para la eyaculación precoz
Pregunta de la revisión
Se quería saber si los medicamentos denominados inhibidores selectivos de la recaptación de serotonina (ISRS), que se utilizan sobre todo para tratar la depresión, pueden ayudar a los hombres que eyaculan más rápido de lo que desean a retardar la eyaculación.
Antecedentes
La eyaculación precoz es un problema común entre los hombres que ocurre cuando la eyaculación se produce antes de lo que el hombre o su pareja desearían durante las relaciones sexuales; puede causar insatisfacción y problemas en la relación. Los ISRS son medicamentos que se administran a menudo para ayudar a tratar la eyaculación precoz, pero no se sabe hasta qué punto funcionan realmente y qué efectos no deseados pueden causar.
Características de los estudios
Se analizó la evidencia hasta el 1 de mayo de 2020. Se encontraron 31 estudios con 8254 hombres. Los estudios compararon los ISRS con un placebo (una píldora con ingredientes inactivos).
Resultados clave
Los ISRS probablemente mejoran la satisfacción sexual de los hombres con eyaculación precoz en comparación con el placebo. Probablemente también mejoren la sensación de control sobre la eyaculación y disminuyan la insatisfacción y los problemas en la relación. Sin embargo, es probable que aumenten los efectos secundarios.
Calidad de la evidencia
Se consideró que la calidad de la evidencia era moderada para los ISRS, lo que ayudó a la sensación de cambio de los hombres con el tratamiento, la satisfacción con las relaciones sexuales y la sensación de control sobre la eyaculación. La calidad de la evidencia también fue moderada para los efectos secundarios de los medicamentos. Estos resultados significan que es probable que la evaluación de esta revisión se acerque a la verdad. Sin embargo, la evidencia sobre la mejoría de los problemas de relación y el tiempo hasta la eyaculación es de certeza baja. Esto significa que el verdadero efecto del tratamiento en estas dos cuestiones podría ser diferente de los resultados de esta revisión. Lo anterior se podría deber a las deficiencias y variaciones de los estudios examinados.
Authors' conclusions
Summary of findings
| SSRI compared to placebo for premature ejaculation in adult men | ||||||
| Patient or population: adult men with premature ejaculation | ||||||
| Outcomes | № of participants | Certainty of the evidence | Relative effect | Anticipated absolute effects* (95% CI) | What happens | |
|---|---|---|---|---|---|---|
| Risk with placebo | Risk difference with SSRI | |||||
| Participant perception of change with treatment | 3260 | ⊕⊕⊕⊝ | RR 1.92 | Study population | SSRI probably results in perceived improvement compared to placebo. | |
| 220 per 1000 | 202 more per 1000 | |||||
| Participant satisfaction with intercourse | 4273 | ⊕⊕⊕⊝ | RR 1.63 | Study population | SSRI probably results in improved satisfaction with intercourse compared to placebo. | |
| 278 per 1000 | 175 more per 1000 | |||||
| Study withdrawal due to adverse events | 7367 | ⊕⊕⊝⊝ | RR 3.80 | Study population | SSRI may result in more withdrawals due to adverse events compared to placebo. | |
| 11 per 1000 | 30 more per 1000 | |||||
| Perceived control over ejaculation | 4273 | ⊕⊕⊕⊝ | RR 2.29 | Study population | SSRI probably results in improved perceived control over ejaculation compared to placebo. | |
| 132 per 1000 | 170 more per 1000 | |||||
| Participant distress about PE | 652 | ⊕⊕⊕⊝ | RR 1.54 | Study population | SSRI probably results in increased numbers of men not distressed about PE compared to placebo. | |
| 353 per 1000 | 191 more per 1000 | |||||
| Adverse events | 4624 | ⊕⊕⊕⊝ | RR 1.71 | Study population | SSRI probably results in increased adverse events compared to placebo. | |
| 243 per 1000 | 173 more per 1000 | |||||
| IELT | 5872 | ⊕⊕⊝⊝ | — | The mean IELT was 1.41 minutes | MD 3.09 minutes higher | SSRI probably results in extended IELT compared to placebo. |
| *The risk in the intervention group (and its 95% confidence interval) is based on the assumed risk in the comparison group and the relative effect of the intervention (and its 95% CI). CI: confidence interval; IELT: intravaginal ejaculatory latency time; MD: mean difference; PE: premature ejaculate; RCT: randomized controlled trial; RR: risk ratio; SSRI: selective serotonin reuptake inhibitor. | ||||||
| GRADE Working Group grades of evidence | ||||||
| aDowngraded one level for study limitations: most studies had an unclear or high risk of selection, performance and detection bias. | ||||||
Background
Description of the condition
Premature ejaculation (PE) is broadly defined as a male sexual disorder in which ejaculation occurs at a time earlier than desired by the patient or his partner, or both, usually with minimal sexual stimulation before, or shortly after penetration. Other names for this condition are early ejaculation, rapid ejaculation, rapid climax, premature climax and (historically) ejaculatio praecox. The International Society of Sexual Medicine's guideline for PE provides a more specific definition: "a male sexual dysfunction characterized by ejaculation that always or nearly always occurs prior to or within one minute of vaginal penetration, either present from the first sexual experience or following a new bothersome change in ejaculatory latency, and the inability to delay ejaculation on all or nearly all vaginal penetrations, and negative personal consequences, such as distress, bother, frustration, and/or the avoidance of sexual intimacy" (Serefoglu 2014). It should be noted that other definitions of PE have been proposed but these have not been widely adopted or have not been evidence‐based (McMahon 2004). However, all these definitions were based around time to ejaculation, the inability to control ejaculation and the negative impact on an individual.
There are several classification systems for subtypes of PE, but the commonly used Diagnostic and Statistical Manual of Mental Disorders, 5th Edition (DSM‐V) and International Classification of Diseases 11th Revision (ICD‐11) define four broad subtypes: lifelong, acquired, natural variable and premature‐like ejaculatory dysfunction (Waldinger 2006; Waldinger 2007). This classification likely encompasses most types of patients encountered in clinical practice. A clinical differentiation has been made between primary or lifelong versus secondary or acquired PE. With lifelong (primary) PE, the patient has experienced PE since the beginning of sexual life and it occurs in the absence of organic illnesses. Men with acquired PE encounter ejaculatory problems later in their lifetime after normal encounters in adolescence. There is generally a somatic or psychological dysfunction that is underpinning the ejaculatory problems, such as, urogenital disease, thyroid abnormalities or relationship problems. The treatment of acquired PE is based on addressing the underlying issue.
PE has a significant negative impact on a man's quality of life. Rowlands 2007 reported that men with PE have lower satisfaction with intercourse, increased personal distress and more interpersonal difficulty. These issues are also reflected in the female partners of men with PE. There are reports that the adverse effects of PE extend into a man's overall quality of life with lower 36‐item Short Form (SF‐36) scores in the following domains: general health, vitality, social function, emotional, mental health, role‐physical and the mental health component score (Rowlands 2007). Thus, successful treatment of PE has the potential to markedly improve quality of life.
Pathophysiology of premature ejaculation
The pathophysiology of PE is not completely understood. Ejaculation represents the last phase of the sexual response cycle. It is a reflex requiring interaction of somatic, sympathetic and parasympathetic nerve functions of mostly central dopaminergic and serotonergic neurons (Buvat 2011; McMahon 2004). The somatic system with the pudendal nerve enables the expulsion phase of ejaculation. Based on experimental studies in animals, serotonin has an important regulatory role in ejaculation. Different types of serotonin receptors exist in the brain, spine and peripheral autonomic ganglia, where they either have a stimulatory or inhibitory effect on ejaculation (Waldinger 2002). One of the underlying issues in PE appears to be a diminished sensitivity of one type of receptor versus the increased sensitivity of another type of receptor to serotonin. The exact cause of this problem remains unclear. Genetic, neurobiologic, pharmacologic, psychological, urologic and endocrine factors have been implicated (Buvat 2011). Genetic factors include variations in the serotonin‐transporter‐linked promoter region (5‐HTTLPR) on chromosome 17 where the short allele has been shown to be more prevalent in men with PE compared to controls (Ozbek 2011). It is likely that PE is multifactorial and that psychological and somatic factors and psychological stress contribute (Buvat 2011). Developmental factors such as history of sexual abuse, negative attitudes towards sex or individual psychological factors such as a negative body image, depression and performance anxiety may also play a role at times (Althof 2014).
Epidemiology
There have been largely variable estimates of PE prevalence because of the contention in the exact definition. Historical data from The USA National Health and Social Life Survey estimated that nearly one‐third of all adult males under 60 years of age in 1992 had PE (Laumann 1999). However, it is thought this is a gross overestimate given the number of men that present for medical attention. Contemporary data estimates the prevalence of lifelong and acquired PE as 5% of the general population (Althof 2014).
Diagnosis
Diagnosis of PE is predominantly based on the medical and sexual history of the man (Shabsigh 2006). Specifically, clinicians should ask patients how long they have had PE; how often it occurs; whether it happens during all sexual encounters and with all partners; whether the degree of sexual stimulation matters and how often they engage in sexual activity including masturbation, foreplay and intercourse. Clinicians should also ask the patient to estimate their intravaginal ejaculatory latency time (IELT), ideally with corroboration of this information by a partner if present. While assessing IELT with a stopwatch is widely used in clinical trials, it is not routinely used in clinical practice due to the intrusive nature of this measurement method and because it has been shown to be relatively comparable to self‐estimated IELT (Althof 2014; Rosen 2007a).
It is also helpful to ask the patient to define his perceived control over ejaculation, the perceived degree of bother related to PE and the impact it has on his relationship(s). Kempeneers 2013 reported that sexual satisfaction and distress better reflected the feeling of control than self‐estimated IELT. There are several questionnaires that have been developed to diagnose PE and characterize its effect on quality of life. These include the Premature Ejaculation Diagnostic Tool (PEDT) (Symonds 2007), Arabic Index of Premature Ejaculation (Arafa 2007), Premature Ejaculation Profile (PEP) (Patrick 2009), and Male Sexual Health Questionnaire Ejaculatory Dysfunction (Rosen 2007b).
It is important to distinguish between PE and erectile dysfunction (ED), recognizing that some men with ED may develop secondary PE. Vice versa, men with lifelong PE may develop ED as they age. Furthermore, possible acquired (secondary) causes of PE should be explored in an attempt to define the relevant subtype. Although physical examination is an essential part of the patient evaluation, it is unusual to find anything that explains the etiology of the patient's PE (Shabsigh 2006).
Treatment
Treatment approaches to PE, other than selective serotonin re‐uptake inhibitors (SSRIs), can be broadly categorized into behavioral therapy, oral agents and topical agents (Althof 2014; Castiglione 2016). We have introduced the most widely used treatment options below.
Behavioral therapy
Behavioral psychosexual therapies predate the use of pharmacologic agents by decades (Cooper 2015).
-
One early approach was referred to as the 'stop‐start' technique (Semans 1956). It involves partner stimulation of the man's penis until the sensation of near climaxing at which time stimulation is abruptly stopped until the sensation of imminent orgasm disappears. This exercise is repeated until the patient learns to voluntarily control his ejaculations.
-
Masters and Johnson reported a similar maneuver in which the partner squeezes the penis and stops penile stimulation (Melnik 2011). After a short interval, the female partner restarts the stimulation. This is referred to as the 'squeeze' technique.
The common feature of both approaches is distraction and the reduction of sexual excitement. It is intended to help men recognize the early signs for ejaculation/orgasm and work with their partner in improving self‐control.
Oral agents
-
Clomipramine: a tricyclic antidepressant that inhibits the uptake of norepinephrine and serotonin. Findings of several randomized controlled trials (RCTs) summarized in systematic reviews and meta‐analyses indicate that the daily use of clomipramine increases IELT (Choi 2019; Cooper 2015; Kim 2018; McMahon 2011).
-
Tramadol: a synthetic opiate analgesic that is primarily used for pain control. Its mechanism of action in PE is not fully understood. Several RCTs and reviews suggest that it results in an increase in IELT (Kirby 2015; Martyn‐St James 2015; Safarinejad 2006a; Salem 2008).
-
Phosphodiesterase‐5 inhibitors: the primary role of this therapy is in treating ED. However, ED is also common among men with PE and there appears to be a benefit with sildenafil or tadalafil treatment (El‐Hamd 2018; Martyn‐St James 2017)
-
Alfa‐adrenoreceptor antagonists: this drug class is primarily used to treat lower urinary tract symptoms associated with benign prostatic hyperplasia, but there are studies that have shown that it can improve PE (Cavallini 1995).
Topical agents
Topical agents decrease the sensitivity of the penis to sexual stimulation. Perceived advantages of these agents are the absence of systemic adverse effects.
-
Lidocaine‐prilocaine (marketed as EMLA) is a local anesthetic cream for topical use that can anesthetize intact skin. Several trials indicate an increase in IELT (Martyn‐St James 2016; Pu 2013; Xia 2013). Adverse effects include some loss of penile sensitivity, ED and female genital anesthesia.
Description of the intervention
SSRIs are oral drugs primarily used to treat depression. Their effect on delaying ejaculation was first identified as an adverse effect in this setting (Althof 2014; Buvat 2009). Depending on the type of agent and its half‐life, these drugs are used either daily or on‐demand.
Adverse effects of the intervention
The adverse effects of SSRIs are fairly well understood through their widespread and long‐term use in people with depression.
-
The most common short‐term adverse effects are reported to be drowsiness, weight gain, dry mouth, insomnia, fatigue and nausea (Cascade 2009).
-
Sexual adverse effects such as reduced libido and new‐onset or worsening ED have been reported (Cascade 2009).
-
Stopping long‐term treatment of SSRIs may lead to 'SSRI discontinuation syndrome,' beginning one to three days after drug cessation and possibly continuing for more than one week. Symptoms include nausea, vomiting, dizziness, headache, ataxia, drowsiness, anxiety and insomnia. Therefore, it is recommended that SSRIs be gradually withdrawn over several weeks (Mulhall 2012).
-
Multiple drug interactions exist and can potentially lead to 'serotonin syndrome,' a group of serious, persistent symptoms including myoclonus, hyper‐reflexia, sweating, shivering, and motor co‐ordination and mental status changes (Iqbal 2012).
-
Studies of depressed people treated with SSRIs have indicated a small increase in the risk of suicide ideation or suicide attempts, especially in younger age groups, but the evidence remains weak (Pompili 2010). Nonetheless, caution is urged in younger people with PE and concomitant depression or suicidal ideation, or both. Based on current guidelines, patients should also be advised to avoid sudden cessation or rapid dose reduction of daily dose SSRIs.
How the intervention might work
The role of 5‐hydroxytryptamine (5‐HT) (also known as serotonin) in the process of ejaculation appears to be inhibitory. SSRIs work by the blockage of serotonin transporters at the level of the synapse resulting in increased concentrations (Fuller 1994; Giuliano 2006; Waldinger 2005a). Based on a study of monkeys, administration of sertraline 20 mg/kg (an SSRI) resulted in the serotonin concentration in cerebrospinal fluid increasing by nearly 300% within hours of administration (Anderson 2005). Due to increased serotonin levels in the synapse, 5‐HT1A and 5‐HT1B receptors on the postsynaptic and presynaptic membranes become activated, causing a reduction in secretion of serotonin into the synapse (Waldinger 2005a). These receptors ultimately become desensitized, resulting in the serotonin release into the synapse, but this time because of transport inhibition by the SSRI, the synaptic serotonin levels remain high, causing persistent activation of postsynaptic receptors, which is thought to mediate the clinical effects of SSRI including the prolongation of IELT (Sprouse 2001).
Why it is important to do this review
SSRIs are among the most widely used drugs for PE (Althof 2014), but others have also argued that PE is not a disease at all (Puppo 2014), or have raised the notion that the fairly recent availability of pharmacologic treatment of PE, including SSRIs, has reinforced stereotypes of 'normal' sexual conduct and thereby reinforced social norms that cause men distress (Soderfeldt 2017). While most use of these agents is off‐label, dapoxetine, a short‐acting SSRI, is also approved for the treatment of PE in many countries outside the USA. Therefore, it is important for clinicians to fully understand both the benefits and potential harms associated with these agents as Feys 2014 raised the concern that dapoxetine may be a costly and dangerous placebo. Although multiple systematic reviews have been conducted on the treatment of PE, including the use of SSRIs (Castiglione 2016; Cooper 2015; Feys 2014; Russo 2016; Waldinger 2004; Yue 2015), these have not been performed in a methodologically rigorous manner. This review distinguishes itself by virtue of a published, a priori protocol governing all aspects of this study (New Reference), a comprehensive search of the literature not limited by publication status or language and its focus on patient‐important outcomes with rating of the certainty of evidence using the GRADE approach on a per‐outcome basis. Cochrane Reviews such as ours are also governed by a strict conflict of interest policy. Therefore, we expect this review to provide important, evidence‐based information for patients, clinicians, guideline developers and health policy makers.
Objectives
To assess the effects of SSRIs in the treatment of PE in adult men.
Methods
Criteria for considering studies for this review
Types of studies
We included RCTs in which participants were allocated to receive either SSRI or placebo/no treatment. We also included cross‐over clinical trials because we believed that this would be a suitable design to test interventions in PE as this is a relatively stable condition and SSRIs have a short half‐life (Elbourne 2002). We did not consider cluster‐RCTs as they did not appear applicable to this particular clinical question.
Types of participants
We included studies of men aged ≥ 18 years with lifelong PE only (from first sexual experience). We excluded men with PE secondary to other known conditions such as prostatitis or PE as a medication side effect (acquired PE).
Diagnostic criteria for premature ejaculation
Since a standardized definition was developed by the International Society of Sexual Medicine in 2014 (see Description of the condition), we included studies whether they used this definition or not (but recorded all definitions used).
Types of interventions
We investigated the following comparisons of intervention versus control/comparator.
Intervention
-
SSRI.
Comparator
-
Placebo.
-
No treatment (but we found no trials with no treatment as the comparator).
Concomitant interventions were the same in both the intervention and comparator groups to establish fair comparisons.
For trials with multiple arms, we included any arm that met the inclusion criteria in the review and listed all arms in the Characteristics of included studies table).
We did not consider agents classified as serotonin‐norepinephrine re‐uptake inhibitors such as duloxetine.
Minimum duration of intervention and follow‐up
-
Four weeks.
We defined the trial duration according to the number of weeks over which the interventions and comparators were conducted and only included trials in the analyses with treatments that lasted at least four weeks.
Exclusion criteria
-
Males aged less than 18 years.
-
Men with known conditions thought to cause PE or in whom PE was thought to be secondary to other medications.
Types of outcome measures
We did not exclude trials because one or several of our primary or secondary outcome measures were not reported in the publication. In case none of our primary or secondary outcomes were reported, we were unable to include such trials in the analysis but provided information for these trials in Table 1 and Table 2.
| Study | Intervention(s) (route, frequency, total dose/day) | Comparator(s) (route, frequency, total dose/day) |
|---|---|---|
| I1: fluoxetine 20 mg daily for first 1 week and 40 mg daily for remaining 5 weeks after breakfast | C1: placebo daily | |
| I1: duloxetine 20 mg daily for 1 week followed by 40 mg daily | C1: placebo daily | |
| I1: citalopram 20 mg daily up to 60 mg | C1: placebo daily up to 3 tablets | |
| I1: sertraline 50 mg daily | C1: placebo daily | |
| I1: dapoxetine 30 mg on‐demand I2: dapoxetine 60 mg on‐demand | C1: placebo daily C2: placebo daily | |
| I1: citalopram 20 mg on‐demand | C1: placebo on‐demand | |
| I1: paroxetine 20 mg on‐demand + lubricating jelly | C1: placebo on‐demand + lubricating jelly | |
| I1: paroxetine 20 mg daily | C1: placebo | |
| I1: tramadol 50 mg I2: paroxetine 20 mg | C1: placebo daily | |
| I1: fluoxetine 20 mg daily | C1: placebo daily | |
| I1: dapoxetine 60 mg on‐demand | C1: placebo daily | |
| I1: paroxetine 20 mg I2: paroxetine 20 mg 2–3 hours before intercourse | C1: placebo daily | |
| I1: fluoxetine 40 mg daily for 1 week then 80 mg for 3 weeks I2: sertraline 100 mg for 1 week then 200 mg for 3 weeks | C1: placebo daily C2: placebo daily | |
| I1: fluoxetine 90 mg daily I2: fluoxetine 90 mg daily + tadalafil 20 mg on‐demand | C1: placebo daily C2: placebo + tadalafil 20 mg on‐demand | |
| I1: sertraline 50 mg daily | C1: placebo daily | |
| I1: paroxetine 20 mg I2: paroxetine as needed 3–4 hours before planned sexual intercourse I3: paroxetine 10 mg for 3 weeks then 20 mg paroxetine as needed for 4 weeks | C1: placebo daily for 3 weeks then placebo daily for 4 weeks | |
| I1: dapoxetine 30 mg daily I2: dapoxetine 60 mg daily | C1: placebo daily C2: placebo daily | |
| I1: dapoxetine 30 mg on‐demand, from week 4 up to 60 mg if tolerated + PDE5 inhibitor | C1: placebo on‐demand + PDE5 inhibitor | |
| I1: sertraline 50 mg daily that could be titrated up to 200 mg daily | C1: placebo daily | |
| I1: sertraline 50 mg at night that could be titrated up to 100 mg daily | C1: placebo daily | |
| I1: fluoxetine 20 mg daily | C1: placebo daily | |
| I1: dapoxetine 30 mg on‐demand I2: dapoxetine 60 mg on‐demand | C1: placebo on‐demand 1–3 hours before anticipated sexual activity | |
| I1: dapoxetine 60 mg daily I2: paroxetine 20 mg daily | C1: placebo daily | |
| I1: citalopram 20 mg daily | C1: placebo daily | |
| I1: escitalopram 10 mg daily | C1: placebo daily | |
| I1: dapoxetine 30 mg twice daily | C1: placebo twice daily | |
| I1: citalopram 20 mg daily | C1: placebo daily | |
| I1: sertraline 50 mg nightly for 2 months | C1: placebo daily for 2 months | |
| I1: paroxetine 20 mg daily for 1 week and then 40 mg daily from week 2–6 | C1: placebo daily | |
| I1: fluoxetine 20 mg daily I2: fluvoxamine 100 mg daily I3: paroxetine 20 mg daily I4: sertraline 50 mg daily | C1: placebo daily | |
| I1: fluoxetine 20 mg daily | C1: placebo daily |
C: comparator; I: intervention; PDE5: phosphodiesterase‐5.
| Study | Intervention(s) and comparator(s) | Duration of intervention | Trial period | Country | Setting | Age in years (mean) | Baseline IELT in minutes (mean) | Number of participants with primary/secondary PE |
|---|---|---|---|---|---|---|---|---|
| I1: fluoxetine 20 mg daily for first 1 week and 40 mg daily for remaining 5 weeks after breakfast C1: placebo daily | 6 weeks | NR | South Korea | Outpatient | 39.8 (range 34–48) | 0.78 (range 0.17–2.0) | NA/NA | |
| 39.8 (range 34–48) | 0.78 (range 0.17–2.0) | NA/NA | ||||||
| I1: duloxetine 20 mg daily for 1 week followed by 40 mg daily C1: placebo daily | 12 weeks | NR | Greece | Academic | 31.35 (SD 8.23) | 0.63 (SD 0.27) | NA/NA | |
| 32.65 (SD 7.49) | 0.58 (SD 0.30) | NA/NA | ||||||
| I1: citalopram 20 mg daily up to 60 mg C1: placebo daily | 8 weeks | NR | Turkey | Outpatient | Range 24–46 | 0.55 (SD 0.29) | NA/NA | |
| Range 24–46 | 0.50 (SD 0.24) | NA/NA | ||||||
| I1: sertraline 50 mg C1: placebo daily | 4 weeks | 1995–1997 | Turkey | Outpatient | NR | 0.68 (SD 0.21) | NA/NA | |
| NR | 0.72 (SD 0.33) | NA/NA | ||||||
| I1: dapoxetine 30 mg on‐demand I2: dapoxetine 60 mg on‐demand C1: placebo daily | 24 weeks | 2004–2006 | France | Academic | 39.6 (SD 9.53) | 0.9 (SD 0.50) | NA/NA | |
| 40.5 (SD 9.62) | 0.9 (SD 0.49) | NA/NA | ||||||
| 40.1 (SD 9.98) | 0.9 (SD 0.51) | NA/NA | ||||||
| I1: citalopram 20 mg on‐demand C1: placebo daily | 4 weeks | 2006–2007 | Iran | Outpatient | 34.28 (SD 6.67) | 1.11 (SD 0.61) | NA/NA | |
| 33.76 (SD 5.93) | 1.10 (SD 0.56) | NA/NA | ||||||
| I1: paroxetine 20 mg on‐demand + lubricating jelly C1: placebo on‐demand + lubricating jelly | 4 weeks | 2009–2012 | Egypt | Outpatient | NR | 0.16 (SD 0.47) | NA/NA | |
| I1: paroxetine 20 mg daily C1: placebo daily | 30 days | NR | China | likely outpatient | 26.8 (SD 5.5) | 0.89 (SD 0.21) | NA/NA | |
| 29.2 (SD 6.7) | 0.97 (SD 0.18) | |||||||
| I1: tramadol 50 mg I2: paroxetine 20 mg C1: placebo | 12 weeks | NR | Iran | Outpatient | NR | NR | NA/NA | |
| NR | NR | NA/NA | ||||||
| NR | NR | NA/NA | ||||||
| I1: fluoxetine 20 mg daily C1: placebo daily | NR | NR | Turkey | Outpatient | Range 15–50 | 0.42 (SD 0.21) | NA/NA | |
| Range 15–50 | 0.5 (SD 0.14) | NA/NA | ||||||
| I1: dapoxetine 60 mg on‐demand C1: placebo on‐demand | 9 weeks | NR | USA and Canada | Outpatient | 41.8 (SD 9.80) | NR | NA/NA | |
| 40.98 (SD 9.71) | NR | NA/NA | ||||||
| I1: paroxetine 20 mg I2: paroxetine 20 mg 2–3 hours before intercourse C1: placebo | 4 weeks | NR | Georgia | Academic | 22.7 (range 19–39) | NR | NA/NA | |
| 22.7 (range 19–39) | NR | NA/NA | ||||||
| 22.7 (range 19–39) | NR | NA/NA | ||||||
| I1: fluoxetine 40 mg daily for 1 week then 80 mg for 3 weeks I2: sertraline 100 mg for 1 week then 200 mg for 3 weeks C1: placebo daily | 16 weeks | NR | South Korea | Academic | 44 (range 30–60) | 0.77 (SD 0.68) | NA/NA | |
| 44 (range 30–60) | 0.77 (SD 0.68) | NA/NA | ||||||
| 44 (range 30–60) | 0.77 (SD 0.68) | NA/NA | ||||||
| I1: fluoxetine 90 mg daily I2: fluoxetine 90 mg daily + tadalafil 20 mg on‐demand C1: placebo daily C2: placebo + tadalafil 20 mg on‐demand | 12 weeks | NR | Brazil | Academic | 50 (SD 8.51) | 0.94 (SD 0.31) | NA/NA | |
| 42.81 (SD 7.73) | 0.83 (SD 0.43) | NA/NA | ||||||
| 45.93 (SD 9.96) | 0.83 (SD 0.31) | NA/NA | ||||||
| 43.2 (SD 11.3) | 0.83 (SD 0.32) | NA/NA | ||||||
| I1: sertraline 50 mg C1: placebo daily | 12 weeks | NR | Australia | Academic | 41 (range 19–70) | 0.3 | NA/NA | |
| 41 (range 19–70) | 0.3 | NA/NA | ||||||
| Study 1: I1: paroxetine 20 mg C1: paroxetine as needed 3–4 hours before planned sexual intercourse | 17 weeks | NR | Australia | Academic | 39.5 | 0.3 | 19/7 | |
| 39.5 | 0.3 | 19/7 | ||||||
| Study 2: I2: paroxetine 10 mg for 3 weeks then 20 mg paroxetine as needed for 4 weeks C2: placebo daily for 3 weeks then placebo daily for 4 weeks | 40.5 | 0.5 | 32/10 | |||||
| 40.5 | 0.5 | 32/10 | ||||||
| I1: dapoxetine 30 mg on‐demand I2: dapoxetine 60 mg on‐demand C1: placebo daily | 12 weeks | 2005–2006 | Multicenter in Asia/Pacific | Academic | 41.2 (SD 10.74) | 3.9 | 92 (42.2%)/NA | |
| 41.0 (SD 10.78) | 4.2 | 92 (42.2%)/NA | ||||||
| 40.6 (SD 9.71) | 2.4 | 96 (45.9%)/NA | ||||||
| I1: dapoxetine 30 mg on‐demand, from week 4 up to 60 mg if tolerated + PDE5 inhibitor taken 1–3 hours prior to sexual intercourse C1: placebo daily + PDE5 inhibitor taken 1–3 hours prior to intercourse | 12 weeks | 2010–2011 | Australia | Academic | 49.5 (SD 11.23) | NR | 92 (42.2%)/NA | |
| 47.9 (SD 11.96) | NR | 96 (45.9%)/NA | ||||||
| I1: sertraline 50 mg daily that could be titrated up to 200 mg daily C1: placebo daily | 10 weeks | NR | USA | Academic | NR | 0.98 (SD 1.15) | NA/NA | |
| NR | 1.10 (SD 1.35) | NA/NA | ||||||
| I1: sertraline 50 mg at night that could be titrated up to 100 mg daily C1: placebo daily | 6 weeks | NR | South Korea | Academic | NR | NR | NA/NA | |
| NR | NR | |||||||
| I1: fluoxetine 20 mg C1: placebo daily | 20 weeks | 1998–2000 | Brazil | Academic | 37.4 (SD 10.7) | 1.01 (SD 0.86) | NA/NA | |
| 37.4 (SD 10.7) | 1.05 (SD 1.07) | NA/NA | ||||||
| I1: dapoxetine 30 mg on‐demand 1–3 hours before anticipated sexual activity I2: dapoxetine 60 mg on‐demand 1–3 hours before anticipated sexual activity C1: placebo on‐demand 1–3 hours before anticipated sexual activity | 12 weeks | 2003–2004 | USA | Academic | 40.3 (SD 9.10) | 0.90 (SD 0.47) | 563/227 | |
| 40.9 (SD 9.09) | 0.92 (SD 0.50) | 571/234 | ||||||
| 40.3 (SD 9.55) | 0.91 (SD 0.48) | 560/248 | ||||||
| I1: dapoxetine 60 mg daily I2: paroxetine 20 mg daily C1: placebo daily | 12 weeks | 2003–2005 | Iran | Academic | 33.4 (range 20–50) | 0.63 | 64 (61.5%)/NA | |
| 34.6 (range 21–49) | 0.52 | 63 (60.0%)/NA | ||||||
| 34.3 (range 21–50) | 0.57 | 11 (44.0%)/NA | ||||||
| I1: citalopram 30 mg C1: placebo daily | 6 months | NR | Iran | Academic | 32 (21–49) | 0.53 | 10/16 | |
| 34 (21–49) | 0.47 | 11/14 | ||||||
| I1: escitalopram 10 mg daily C1: placebo daily | 12 weeks | 2003–2005 | Iran | Academic | 33.5 (range 21–44) | NR | 87 (70%)/NA | |
| 33.3 (range 19–46) | NR | 88 (69.8%)/NA | ||||||
| I1: dapoxetine 30 mg daily C1: placebo daily | 12 weeks | 2004–2006 | Iran | Academic | 35.7 (range 21–54) | 0.37 | 40 (37.7%)/NA | |
| 36.3 (range 19–56) | 0.48 | 43 (40.6%)/NA | ||||||
| I1: citalopram 20 mg daily C1: placebo daily | 4 weeks | 2011–2012 | China | Academic | 39.1 (SD 2.5) | 0.91 (SD 0.18) | NA/NA | |
| 37.8 (SD 2.8) | 0.95 (SD 0.17) | |||||||
| I1: sertraline 50 mg nightly for 2 months C1: placebo daily | 8 weeks | NR | Turkey | Academic | 36.9 (median) (SD 6.9) | NR | NA/NA | |
| 34.9 (median) (SD 9.0) | NR | NA/NA | ||||||
| I1: paroxetine 20 mg daily for 1 week and then 40 mg daily from week 2–6 C1: placebo daily | 6 weeks | NR | The Netherlands | Outpatient | 41 (range 27–48) | NR | 7/8 (87.5%)/NA | |
| 38 (range 30–47) | NR | 7/9 (77.7%)/NA | ||||||
| I1: fluoxetine 20 mg daily I2: fluvoxamine 100 mg daily I3: paroxetine 20 mg daily I4: sertraline 50 mg daily C1: placebo daily | 6 weeks | NR | The Netherlands | Outpatient | 38 (SD 7.0) | 0.3 (SD 0.22) | NA/NA | |
| 44 (SD 10.0) | 0.3 (SD 0.22) | NA/NA | ||||||
| 41 (SD 8.0) | 0.3 (SD 0.22) | NA/NA | ||||||
| 40 (SD 9.0) | 0.3 (SD 0.22) | NA/NA | ||||||
| 45 (SD 4.0) | 0.3 (SD 0.22) | NA/NA | ||||||
| I1: fluoxetine 20 mg daily C1: placebo | 1 month | 1997–1997 | Turkey | Academic | 36.5 (range 22–56) | 1.2 (SD 1.0) | NA/NA | |
| 37.3 (range 24–58) | 1.1 (SD 1.1) | NA/NA |
C: comparator; I: intervention; IELT: intravaginal ejaculatory latency time; NA: not available; NR: not reported; PDE5: phosphodiesterase‐5; PE: premature ejaculation; SD: standard deviation.
Primary outcomes
We focused on outcomes of direct patient importance that are directly applicable to routine clinical practice using instruments that have undergone validation.
-
Participant perception of change with treatment.
-
Participant satisfaction with intercourse.
-
Study withdrawal due to adverse events.
We assessed participant perception of change using the Clinical Global Impression of Change (CGIC) questionnaire, which is a validated instrument that is administered after treatment (Althof 2010). We recorded the number of participants describing the change as 'better' or 'much better' after treatment in a dichotomous manner. An event was considered 'good' as it represented 'better' or 'much better' symptoms after treatment. No minimal clinically important difference (MCID) has been reported; we considered a 10% difference between groups as clinically meaningful. This was a participant self‐reported outcome.
We assessed participant satisfaction with intercourse using the PEP questionnaire (Patrick 2009), a validated instrument that addresses four domains. We recorded the number of participants describing their satisfaction as 'good' or 'very good' before and after treatment (for satisfaction and control) in a dichotomous manner. An event was considered 'good' as it represented 'good' or 'very good' satisfaction after treatment.
We recorded the number of participants withdrawing from the trial due to adverse events in a dichotomous manner. We considered a 5% difference between groups as clinically meaningful. This was an investigator‐assessed outcome.
For study withdrawals due to adverse events, we considered a 2% absolute difference as clinically meaningful.
In the absence of any reported MCIDs for these three outcomes, all thresholds were informed by the clinical expertise and experience of the clinical authors. We did not formally involve any external stakeholders (such as men with PE) in this process. This also applies to the secondary outcomes (listed below).
Secondary outcomes
-
Perceived control over ejaculation.
-
Participant distress about PE.
-
Relationship difficulties.
-
Adverse events.
-
IELT.
-
Depression.
We also used the PEP questionnaire to assess participant satisfaction with control over ejaculation, distress about PE and relationship difficulties (Patrick 2009). We recorded the number of participants describing their satisfaction as 'good' or 'very good' before and after treatment (for satisfaction and control). An event was good as it represented 'good' or 'very good' control after treatment. This was measured in a dichotomous manner. For distress and relationship difficulties, we recorded the number of participants describing their distress 'a little bit' or 'not at all.' An event was considered good as it represented 'a little bit' or 'not at all' relationship difficulties/distress after treatment. This was also measured in a dichotomous manner. No MCID has been reported; we considered a 10% difference between groups as clinically meaningful. All of these were participant self‐reported outcomes.
We further assessed the cumulative number of adverse events in a dichotomous manner. We considered a 5% difference between groups as clinically meaningful. This was an investigator‐assessed outcome. We also provided descriptive information on the most common adverse events contributing to this analysis.
We assessed IELT as measured using a stopwatch in minutes (Waldinger 2005b). Although this method of measurement is not routinely used in clinical practice, it represents the best current method for assessing the fundamental issue that defines PE. This was measured as a continuous outcome. No MCID has been reported in the literature. Therefore, we assumed a one‐minute difference as the smallest difference between groups to be clinically meaningful. This was based on the mean IELT; we did not use the geometric mean IELT, which has been proposed as an alternative measure more robust to non‐normal distributions (Waldinger 2008).
We recorded the incidence of new symptoms of depression in participants in a dichotomous manner. We looked for information using validated instruments such as the Beck Depression Inventory questionnaire (Novaretti 2002), but also recorded other types of information as collected by the investigators. No MCID has been reported; we considered a 10% difference between groups as clinically meaningful. This may have been a participant self‐reported or investigator‐assessed outcome.
Search methods for identification of studies
A dedicated information specialist (JL) conducted all systematic searches. We applied no restrictions regarding language or publication status.
Electronic searches
We searched the following sources from the inception of each database. Complete search strategies for each resource are available in the Appendices.
-
Cochrane Central Register of Controlled Trials (CENTRAL) via the Cochrane Library (2020, Issue 4) (Appendix 1).
-
PubMed MEDLINE (from 1946) (Appendix 2).
-
Embase via Elsevier (from 1947) (Appendix 3).
-
Cumulative Index of Nursing and Allied Health Literature (CINAHL) via EBSCOhost (from 1981) (Appendix 4)
-
Latin American and Caribbean Health Sciences Literature (LILACS) via BIREME‐PAHO‐WHO (from 1982) (Appendix 5).
-
Scopus via Elsevier (from 1970) (Appendix 6).
-
US National Institutes of Health ClinicalTrials.gov Registry (clinicaltrials.gov) (Appendix 7).
-
World Health Organization (WHO) International Clinical Trials Registry Platform (ICTRP) (apps.who.int/trialsearch/) (Appendix 8).
-
ProQuest Dissertations & Theses (PQDT; from 1861) (Appendix 9).
-
OCLC WorldCat Dissertations and Theses (Appendix 10).
We applied publication type filters as follows. For CENTRAL, we selected only clinical trials via the Cochrane Library results interface. For PubMed, we applied the Cochrane Highly Sensitive Search Strategy for identifying RCTs in MEDLINE: sensitivity‐maximizing version (2008 revision); PubMed format from the Cochrane Handbook for Systematic Reviews of Interventions (accessed 16 June 2017). For Embase, we translated the RCT filter from SIGN (Scottish Intercollegiate Guidelines Network) (accessed from www.sign.ac.uk/search-filters.html on 19 June 2017) to appropriate syntax for Embase‐Elsevier. For CINAHL, we used the RCT filter from SIGN (accessed from www.sign.ac.uk/search-filters.html on 19 June 2017). We applied no filter for LILACS due to a low yield. For Scopus, as a published or validated filter was not available, the Cochrane Urology Assistant Information Specialist developed one based loosely on the CINAHL filter. No filter was needed for PQDT. For WorldCat, we selected Content Type: Thesis/Dissertation. We applied no other filters or limits to the searches. The search strategies were peer reviewed by a second Cochrane Urology Assistant Information Specialist, and recommendations were incorporated into the final strategies.
We applied a PubMed (MEDLINE) email alert through 1 May 2020 to identify newly published trials using the same search strategy as described for MEDLINE (see Appendix 2 for search strategy). After we submitted the final review draft for editorial approval, the Information Specialist on our review team performed a complete search update (1 May 2020) on all databases and sent the results to the review authors. New trials were evaluated and we incorporated the findings from the new trials into our review for all included trials.
If we detected additional relevant keywords during any electronic or other searches, we modified the electronic search strategies to incorporate these terms and documented the changes.
Searching other resources
We identified other potentially eligible trials or ancillary publications by searching the reference lists of included trials, as well as related systematic reviews, meta‐analyses and health technology assessment reports. We also contacted authors of included trials to identify additional information on the retrieved trials and any trials that we might have missed.
We included studies presented in abstract form only as well, focusing on these relevant meetings from 2017 to 2020. For these years, abstract proceedings from can be searched and identified through electronic searches of the journals identified and captured through our electronic MEDLINE search. This included the following meetings:
-
American Urological Association (AUA); Journal of Urology;
-
European Urology Association (EAU); European Urology Supplements;
-
International Society of Sexual Medicine (ISSM); Journal of Sexual Medicine;
-
World Association for Sexual Health (WASH); Journal of Sexual Medicine;
-
European Society for Sexual Medicine (ESSM); Journal of Sexual Medicine;
-
World Meeting on Sexual Medicine (WMSM); Journal of Sexual Medicine;
-
Sexual Medicine Society of North America (SMSNA); Journal of Sexual Medicine.
Data collection and analysis
Selection of studies
At least two of four review authors (RM, AS, JB, SS) independently scanned the abstract, title, or both of every record we retrieved in the literature searches, to determine which trials we should assess further. We obtained the full text of all potentially relevant records. We resolved any disagreements through consensus or by recourse to a third review author (PD). If we could not resolve a disagreement, we categorized the trial as a 'study awaiting classification' and contacted the trial authors for clarification. We presented an adapted PRISMA flow diagram to show the process of trial selection (Liberati 2009).
Data extraction and management
For trials that fulfilled our inclusion criteria, at least two of four review authors (RM, AS, JB, SS) independently extracted key participant and intervention characteristics. We reported data on efficacy outcomes and adverse events using standardized data extraction sheets from the Cochrane Metabolic and Endocrine Disorders Group. We resolved any disagreements by discussion or, if required, by consultation with a third review author (PD).
We provided information about potentially relevant ongoing trials, including the trial identifier, in the Characteristics of ongoing studies table. We attempted to find the protocol for each included trial and reported primary, secondary and other outcomes.
We emailed all authors of included trials to ask if they were willing to answer questions regarding their trials. Thereafter we requested relevant missing information on the trial from the primary trial author(s).
Dealing with duplicate and companion publications
In the event of duplicate publications, companion documents or multiple reports of a primary trial, we maximized the information yielded by collating all available data and used the most complete data set aggregated across all known publications. We listed duplicate publications, companion documents, multiple reports of a primary trial and trial documents of included trials (such as trial registry information) as secondary references under the study ID of included trials. Furthermore, we listed duplicate publications, companion documents, multiple reports of a trial and trial documents of excluded trials (such as trial registry information) as secondary references under the study ID of excluded trials.
Data from clinical trial registers
If data of included trials were available as study results in clinical trial registers such as ClinicalTrials.gov, we made full use of this information and extracted the data. If there is also a full publication of the trial, we collated and critically appraised all available data. If an included trial was marked as a completed study in a clinical trial register but no additional information was available, we added this trial to the Characteristics of studies awaiting classification table.
Assessment of risk of bias in included studies
Two review authors (RM, SS) independently assessed the risk of bias of each included trial. We resolved any disagreements by consensus or by consulting a third review author (PD). In case of disagreement, we consulted the rest of the group and made a judgment based on consensus. If adequate information was not available from trial authors, trial protocols, or both, we contacted the trial authors for missing data on 'Risk of bias' items.
We used the Cochrane 'Risk of bias' assessment tool and judged 'Risk of bias' criteria as low, high or unclear risk (Higgins 2011a; Higgins 2011b). We evaluated individual bias items as described in the Cochrane Handbook for Systematic Reviews of Interventions according to the criteria and associated categorizations contained therein (Higgins 2011a).
Random sequence generation (selection bias due to inadequate generation of a randomized sequence) – assessment at trial level
For each included trial, we described the method used to generate the allocation sequence in sufficient detail to allow an assessment of whether it should produce comparable groups.
-
Low risk of bias: the trial authors achieved sequence generation using computer‐generated random numbers or a random numbers table. Drawing of lots, tossing a coin, shuffling cards or envelopes, and throwing dice were adequate if an independent person performed this who was not otherwise involved in the trial. We considered the use of the minimization technique as equivalent to being random.
-
Unclear risk of bias: insufficient information about the sequence generation process.
-
High risk of bias: the sequence generation method was non‐random or quasi‐random (e.g. sequence generated by odd or even date of birth; sequence generated by some rule based on date (or day) of admission; sequence generated by some rule based on hospital or clinic record number; allocation by judgment of the clinician; allocation by preference of the participant; allocation based on the results of a laboratory test or a series of tests; or allocation by availability of the intervention).
Allocation concealment (selection bias due to inadequate concealment of allocation prior to assignment) – assessment at trial level
We described for each included trial the method used to conceal allocation to interventions prior to assignment and assessed whether intervention allocation could have been foreseen in advance of or during recruitment, or changed after assignment.
-
Low risk of bias: central allocation (including telephone, interactive voice‐recorder, web‐based and pharmacy‐controlled randomization); sequentially numbered drug containers of identical appearance; sequentially numbered, opaque, sealed envelopes.
-
Unclear risk of bias: insufficient information about the allocation concealment.
-
High risk of bias: using an open random allocation schedule (e.g. a list of random numbers); assignment envelopes were used without appropriate safeguards; alternation or rotation; date of birth; case record number; any other explicitly unconcealed procedure.
We also evaluated trial baseline data to incorporate assessment of baseline imbalance into the 'Risk of bias' judgment for selection bias (Corbett 2014). Chance imbalances may also affect judgments on the risk of attrition bias. In case of unadjusted analyses, we distinguished between studies we rated at low risk of bias on the basis of both randomization methods and baseline similarity, and studies we rated at low risk of bias on the basis of baseline similarity alone (Corbett 2014). We reclassified judgments of unclear, low or high risk of selection bias.
Blinding of participants and study personnel (performance bias due to knowledge of the allocated interventions by participants and personnel during the trial) – assessment at outcome level
We evaluated the risk of detection bias separately for each outcome (Hróbjartsson 2013). We noted whether endpoints were self‐reported, investigator assessed or adjudicated outcome measures (see below).
-
Low risk of bias: blinding of participants and key study personnel was ensured, and it was unlikely that the blinding could have been broken; no blinding or incomplete blinding, but we judged that the outcome was unlikely to have been influenced by lack of blinding.
-
Unclear risk of bias: insufficient information about the blinding of participants and study personnel; the trial did not address this outcome.
-
High risk of bias: no blinding or incomplete blinding, and the outcome was likely to have been influenced by lack of blinding; blinding of trial participants and key personnel attempted, but likely that the blinding could have been broken, and the outcome was likely to have been influenced by lack of blinding.
Blinding of outcome assessment (detection bias due to knowledge of the allocated interventions by outcome assessors) – assessment at outcome level
We evaluated the risk of detection bias separately for each outcome (Hróbjartsson 2013). We noted whether endpoints were self‐reported, investigator assessed or adjudicated outcome measures (see below).
-
Low risk of bias: blinding of outcome assessment was ensured, and it was unlikely that the blinding could have been broken; no blinding of outcome assessment, but we judged that the outcome measurement was unlikely to have been influenced by lack of blinding.
-
Unclear risk of bias: insufficient information about the blinding of outcome assessors; the trial did not address this outcome.
-
High risk of bias: no blinding of outcome assessment, and the outcome measurement was likely to have been influenced by lack of blinding; blinding of outcome assessment, but likely that the blinding could have been broken, and the outcome measurement was likely to be influenced by lack of blinding.
Incomplete outcome data (attrition bias due to amount, nature, or handling of incomplete outcome data) – assessment at outcome level
For each included trial for each outcome, we described the completeness of data, including attrition and exclusions from the analyses. We stated whether the trial reported attrition and exclusions, and the number of participants included in the analysis at each stage (compared with the number of randomized participants per intervention/comparator groups). We also noted if the trial reported the reasons for attrition or exclusion and whether missing data were balanced across groups or were related to outcomes. We considered the implications of missing outcome data per outcome such as high dropout rates (e.g. above 15%) or disparate attrition rates (e.g. difference of 10% or more between trial arms).
-
Low risk of bias: no missing outcome data; reasons for missing outcome data unlikely to be related to true outcome (for survival data, censoring unlikely to introduce bias); missing outcome data balanced in numbers across intervention groups, with similar reasons for missing data across groups; for dichotomous outcome data, the proportion of missing outcomes compared with observed event risk was not enough to have a clinically relevant impact on the intervention effect estimate; for continuous outcome data, plausible effect size (mean difference (MD) or standardized mean difference (SMD)) among missing outcomes was not enough to have a clinically relevant impact on observed effect size; appropriate methods such as multiple imputation were used to handle missing data.
-
Unclear risk of bias: insufficient information to assess whether missing data in combination with the method used to handle missing data were likely to introduce bias; the trial did not address this outcome.
-
High risk of bias: reason for missing outcome data was likely to be related to true outcome, with either imbalance in numbers or reasons for missing data across intervention groups; for dichotomous outcome data, the proportion of missing outcomes compared with observed event risk enough to induce clinically relevant bias in intervention effect estimate; for continuous outcome data, plausible effect size (MD or SMD) among missing outcomes enough to induce clinically relevant bias in observed effect size; 'as‐treated' or similar analysis done with substantial departure of the intervention received from that assigned at randomization; potentially inappropriate application of simple imputation.
Selective reporting (reporting bias due to selective outcome reporting) – assessment at trial level
We assessed outcome reporting bias by comparing the published data to the study protocol (if available).
-
Low risk of bias: the trial protocol was available and all of the trial's prespecified (primary and secondary) outcomes that were of interest in the review were reported in the prespecified way; the study protocol was unavailable, but it was clear that the published reports included all expected outcomes (Outcome Reporting Bias in Trials (ORBIT) classification).
-
Unclear risk of bias: insufficient information about selective reporting.
-
High risk of bias: not all of the trial's prespecified primary outcomes were reported; one or more primary outcomes were reported using measurements, analysis methods or subsets of the data (e.g. subscales) that were not prespecified; one or more reported primary outcomes were not prespecified (unless clear justification for their reporting was provided, such as an unexpected adverse effect); one or more outcomes of interest in the Cochrane Review were reported incompletely so that we could not enter them in a meta‐analysis; the trial report failed to include results for a key outcome that would have been expected to have been reported for such a trial (ORBIT classification).
Other bias (bias due to problems not covered elsewhere) – assessment at trial level
-
Low risk of bias: the trial appeared free of other sources of bias.
-
Unclear risk of bias: insufficient information to assess whether an important risk of bias existed; insufficient rationale or evidence that an identified problem introduced bias.
-
High risk of bias: the trial had a potential source of bias related to the specific trial design used; the trial was claimed to have been fraudulent; or the trial had some other serious problem.
We presented a 'Risk of bias' graph and a 'Risk of bias' summary figure.
We distinguished between self‐reported, investigator assessed, objective and adjudicated outcome measures.
We accepted the following outcomes as self‐reported.
-
Participant perception of change with treatment.
-
Participant satisfaction with intercourse.
-
Perceived control over ejaculation.
-
Participant distress about PE.
-
Relationship difficulties.
-
Depression.
We required the following outcomes to be investigator assessed.
-
Study withdrawal due to adverse events.
-
Adverse events.
We classified the following outcome as objective.
-
IELT.
We did not anticipate encountering any adjudicated outcome measures.
Summary assessment of risk of bias
Risk of bias for a trial across outcomes
Some 'Risk of bias' domains such as selection bias (sequence generation and allocation sequence concealment) affect the risk of bias across all outcome measures in a trial. In case of high risk of selection bias, we marked all endpoints investigated in the associated trial as high risk. Otherwise, we did not perform a summary assessment of the risk of bias across all outcomes for a trial.
Risk of bias for an outcome within a trial and across domains
We assessed the risk of bias for an outcome measure by including all entries relevant to that outcome (i.e. both trial‐level entries and outcome‐specific entries). We considered low risk of bias to denote a low risk of bias for all key domains; unclear risk to denote an unclear risk of bias for one or more key domains; and high risk to denote a high risk of bias for one or more key domains.
Risk of bias for an outcome across trials and across domains
These are our main summary assessments, which we incorporated into our judgments about the certainty of evidence in a 'Summary of findings' table. We defined outcomes as low risk of bias when most information came from trials at low risk of bias; unclear risk when most information came from trials at low or unclear risk of bias; and high risk when a sufficient proportion of information came from trials at high risk of bias.
Measures of treatment effect
When at least two included trials were available for a comparison and a given outcome, we expressed dichotomous data as a risk ratio (RR) with 95% confidence interval (CI) for ease of interpretation rather than using odds ratios (ORs). For continuous outcomes measured on the same scale (e.g. weight loss in kilograms), we estimated the intervention effect using the MD with 95% CI. For continuous outcomes measuring the same underlying concept (e.g. health‐related quality of life) but using different measurement scales, we calculated the SMD with 95% CI.
Unit of analysis issues
We took into account the level at which randomization occurred, such as cross‐over trials, and multiple observations for the same outcome. If more than one comparison from the same trial was eligible for inclusion in the same meta‐analysis, we either combined groups to create a single pair‐wise comparison or appropriately reduced the sample size so that the same participants did not contribute multiple times (e.g. by splitting the 'shared' group into two or more groups). While the latter approach offers some solutions to adjusting the precision of the comparison, it does not account for correlation arising from the same set of participants being in multiple comparisons (Higgins 2011a). When we included cross‐over trials, we only included data from the first period to mitigate any confounding effect from carry‐over.
Dealing with missing data
We obtained missing data from the authors of the included trials. We carefully evaluated important numerical data such as screened, randomly assigned participants as well as intention‐to‐treat, as‐treated and per‐protocol populations. We investigated attrition rates (e.g. dropouts, losses to follow‐up, withdrawals) and critically appraised issues concerning missing data and use of imputation methods (e.g. last observation carried forward).
In trials where the standard deviation of the outcome was not available at follow‐up or could not be re‐created, we standardized by the mean of the pooled baseline standard deviation from those trials in which this information was reported.
Where included trials did not report means and standard deviations for outcomes and we were unable to obtain the required information from trial authors, we imputed these values by estimating the mean and variance from the median, range and the size of the sample (Hozo 2005). We investigated the impact of imputation on meta‐analyses by performing sensitivity analyses and reported per outcome which trials were included with imputed standard deviations.
Assessment of heterogeneity
In the event of excessive clinical or methodologic heterogeneity, we would not have reported trial results as the pooled effect estimate in a meta‐analysis.
We identified heterogeneity (inconsistency) by visually inspecting the forest plots and by using a standard Chi² test with a significance level of α = 0.1. In view of the low power of this test, we also considered the I² statistic, which quantifies inconsistency across trials, to assess the impact of heterogeneity on the meta‐analysis.
We interpreted the I² statistic as follows (Higgins 2002; Higgins 2003; Higgins 2011a).
-
0% to 40%: may not be important.
-
30% to 60%: may indicate moderate heterogeneity.
-
50% to 90%: may indicate substantial heterogeneity.
-
75% to 100%: considerable heterogeneity.
When we found heterogeneity, we attempted to determine the possible reasons for it by examining individual trial and subgroup characteristics.
Assessment of reporting biases
If we included 10 or more trials that investigated a particular outcome, we used funnel plots to assess small‐trial effects. Several explanations can account for funnel plot asymmetry, including true heterogeneity of effect with respect to trial size, poor methodologic design (and hence bias of small trials) and publication bias. Therefore, we carefully interpreted the results (Sterne 2011).
Data synthesis
We undertook (or displayed) a meta‐analysis only if we judged participants, interventions, comparisons and outcomes to be sufficiently similar to ensure an answer that was clinically meaningful. Unless good evidence showed homogeneous effects across trials, we primarily summarized data at low risk of bias using a random‐effects model (Wood 2008). We interpreted random‐effects meta‐analyses with due consideration to the whole distribution of effects, ideally by presenting a prediction interval (Higgins 2009). A prediction interval specifies a predicted range for the true treatment effect in an individual trial (Riley 2011). For rare events such as event rates below 1%, we planned to use the Peto's OR method, provided that there was no substantial imbalance between intervention and comparator group sizes, and intervention effects were not exceptionally large. We performed statistical analyses according to the statistical guidelines presented in the Cochrane Handbook for Systematic Reviews of Interventions (Higgins 2011a).
Subgroup analysis and investigation of heterogeneity
We expected the following characteristics to introduce clinical heterogeneity, and carried out the following subgroup analyses including investigation of interactions.
-
Long‐acting SSRIs (e.g. paroxetine, fluoxetine, sertraline, citalopram and fluvoxamine) versus short‐acting (on‐demand type) SSRIs (e.g. dapoxetine). We compared the long‐ versus short‐acting SSRIs because not only may there be a difference in efficacy, but the incidence of adverse effects may vary by taking SSRIs daily rather than on‐demand.
-
Among the long‐acting SSRIs, comparison of individual agents (e.g. paroxetine versus fluoxetine versus sertraline versus citalopram versus fluvoxamine). We compared these agents because although they are from the same class, there is evidence to suggest that they have varying efficacy and adverse effect profile (Sanchez 2014)
-
If applicable, different dose levels (e.g. dapoxetine 30 mg versus 60 mg). Dose levels are compared because the use of SSRIs in PE is an off‐label indication and there is no clear evidence on the optimal dosage for the best trade‐off of benefit versus risk.
Sensitivity analysis
We performed a sensitivity analysis to explore the influence of the following factors (when applicable) on effect sizes by restricting analysis to the following.
-
Taking into account risk of bias, as specified in the Assessment of risk of bias in included studies section, by removing studies judged at high risk of bias.
Summary of findings and assessment of the certainty of the evidence
We presented the overall certainty of the evidence for each outcome according to the GRADE approach, which takes into account issues related to internal validity (risk of bias, inconsistency, imprecision, publication bias) and external validity, such as directness of results. Two review authors (RM, PD) independently rated the certainty of the evidence for each outcome.
We presented a summary of the evidence in a 'Summary of findings' table, which provides key information about the best estimate of the magnitude of the effect, in relative terms and as absolute differences, for each relevant comparison of alternative management strategies, numbers of participants and trials addressing each important outcome, and rating of overall confidence in effect estimates for each outcome. We created the 'Summary of findings' table based on the methods described in the Cochrane Handbook for Systematic Reviews of Interventions by means of the table editor in Review Manager 5 (Review Manager 2014). We used GRADEpro GDT software and present evidence profile tables as an appendix (GRADEpro GDT 2015). We presented results for the outcomes as described in the Types of outcome measures section. If meta‐analysis was not possible, we presented the results in a narrative format in the 'Summary of findings' table. We justified all decisions to downgrade the certainty of studies using footnotes, and made comments to aid the reader's understanding of the Cochrane Review where necessary.
The 'Summary of findings' table includes following outcomes, listed according to priority.
-
Participant perception of change with treatment.
-
Participant satisfaction with intercourse.
-
Study withdrawal due to adverse events.
-
Perceived control over ejaculation.
-
Participant distress about PE.
-
Adverse events.
-
IELT.
Although we did not include relationship difficulties and depression as outcomes in the 'Summary of findings' table (due to a limit of seven outcomes), we provided the same type of analysis in the Results section and also rated the certainty of the evidence using GRADE for these outcomes.
Results
Description of studies
We presented details of included studies in the Characteristics of included studies and Table 1 and Table 2.
Results of the search
Our search of multiple electronic databases up to May 2020 yielded 1218 references (Figure 1). After exclusion of duplicates, we screened 922 references at the title/abstract stage. Subsequently after screening titles/abstracts, 124 unique studies entered the full‐text screening stage. We included 31 studies (40 records) in the quantitative analyses. We summarized reasons for exclusion at the full‐text stage in the PRISMA flow diagram (Figure 1), and we provided further details Characteristics of excluded studies table.
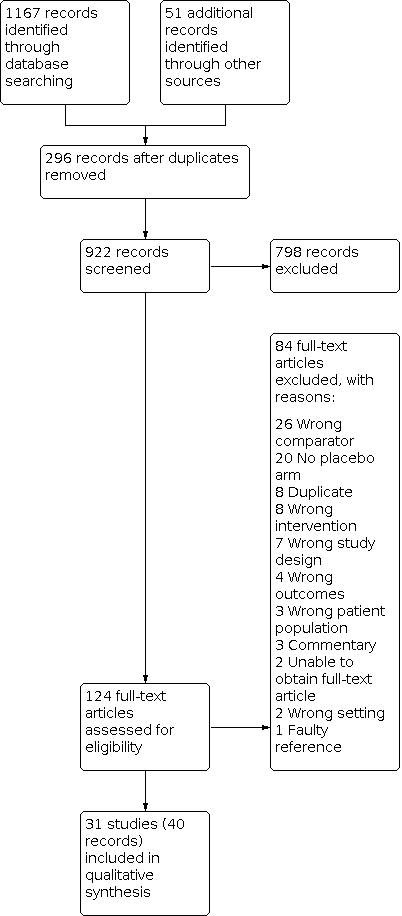
Study flow diagram.
Included studies
Source of data
We included 29 studies published in full‐text and two additional studies only available as abstract proceedings (Hamidi Madani 2016; Khelaia 2012), for a total of 31 unique studies. Two studies were published in Korean (Ahn 1996; Na 1996), and two studies were published in Chinese (Gong 2011; Shang 2012). One review author (ECH) translated the Korean studies into English and Dr Yu Xie translated the Chinese studies into English. The remaining 27 studies were published in English.
Study design and settings
Four studies were cross‐over trials (Kim 1998; McMahon 1998; McMahon 1999; Novaretti 2002), and remaining studies were parallel, RCTs. All studies were likely conducted in an outpatient clinic setting.
Participants
We included 8254 randomized participants (SSRI 4990, placebo 2928, other drug 131). Two studies did not report the number of participants in each arm (Hamidi Madani 2016; Novaretti 2002). All studies included sexually active men aged over 18 years with PE.
Interventions and comparators
Studies used a range of SSRIs with different doses. Seven studies used fluoxetine (Ahn 1996; Kara 1996; Kim 1998; Mattos 2008; Novaretti 2002; Waldinger 1998; Yilmaz 1999), one used duloxetine (Athanasios 2007), three used citalopram (Atmaca 2002; Farnia 2009; Shang 2012), seven used sertraline (Biri 1998; Kim 1998; McMahon 1998; Mendels 1995; Na 1996; Tuncel 2008; Waldinger 1998), seven used dapoxetine (Buvat 2009; Kaufman 2009; McMahon 2010; McMahon 2013; Pryor 2006; Safarinejad 2006b; Safarinejad 2008), eight used paroxetine (Gameel 2013; Gong 2011; Hamidi Madani 2016; Khelaia 2012; McMahon 1999; Safarinejad 2006c; Waldinger 1994; Waldinger 1998), one used escitalopram (Safarinejad 2007), and one used fluvoxamine (Waldinger 1998).
All studies used placebo as the comparator.
Outcomes
For our predefined primary outcomes, six studies reported participant perception of change with treatment (Athanasios 2007; Atmaca 2002; Buvat 2009; Kaufman 2009; McMahon 2010; McMahon 2013), three reported participant satisfaction with intercourse (Kaufman 2009; McMahon 2010; Pryor 2006), and 20 studies reported study withdrawal due to adverse events (Athanasios 2007; Atmaca 2002; Biri 1998; Buvat 2009; Gameel 2013; Gong 2011; Kara 1996; Kaufman 2009; McMahon 2010; McMahon 2013; Mendels 1995; Pryor 2006; Safarinejad 2006b; Safarinejad 2006c; Safarinejad 2007; Safarinejad 2008; Shang 2012; Waldinger 1994; Waldinger 1998; Yilmaz 1999).
In terms of predefined secondary outcomes, three studies reported perceived control over ejaculation (Kaufman 2009; McMahon 2010; Pryor 2006), 17 reported adverse events (Ahn 1996; Athanasios 2007; Atmaca 2002; Biri 1998; Buvat 2009; Kara 1996; Kaufman 2009; Mattos 2008; McMahon 2010; McMahon 2013; Mendels 1995; Safarinejad 2006b; Safarinejad 2007; Safarinejad 2008; Shang 2012; Tuncel 2008; Yilmaz 1999), 20 reported IELT (Ahn 1996; Athanasios 2007; Atmaca 2002; Biri 1998; Buvat 2009; Gameel 2013; Gong 2011; Kara 1996; Mattos 2008; McMahon 1998; McMahon 1999; McMahon 2010; McMahon 2013; Mendels 1995; Pryor 2006; Safarinejad 2006c; Shang 2012; Waldinger 1994; Waldinger 1998; Yilmaz 1999), and one reported depression (Kara 1996). One study reported participant distress about PE and relationship difficulties (Kaufman 2009)
Please refer to Analysis 1.1 through Analysis 1.9.
Funding sources and conflicts of interest
Four studies reported no funding source (Gameel 2013; Mattos 2008; Safarinejad 2007; Safarinejad 2008), and pharmaceutical companies supported seven studies (Buvat 2009; Kaufman 2009; McMahon 2010; McMahon 2013; Novaretti 2002; Pryor 2006; Waldinger 1998). The remaining studies did not address their funding source.
Two studies reported no conflicts of interest (Gameel 2013; Safarinejad 2008), and six studies reported investigators having relationships with pharmaceutical companies (Buvat 2009; Kaufman 2009; McMahon 2010; McMahon 2013; Mendels 1995; Pryor 2006). The remaining studies did not address conflicts of interest.
Excluded studies
We excluded 84 records after evaluation of the full‐text publications for which we presented details in the Characteristics of excluded studies table.
Studies awaiting classification
We found one study awaiting classification that has not provided usable outcome data at this time (Kolomazník 2002; see Characteristics of studies awaiting classification table).
Ongoing trials
We identified no ongoing studies.
Risk of bias in included studies
A summary of the risk of bias in included studies are provided graphically in Figure 2 and Figure 3.

Risk of bias graph: review authors' judgments about each risk of bias item presented as percentages across all included studies.

Risk of bias summary: review authors' judgments about each risk of bias item for each included study.
Allocation
Random sequence generation
Eleven of 31 studies were at low risk of bias because they employed an appropriate method of generating a random sequence (Buvat 2009; Gameel 2013; Mattos 2008; McMahon 2013; Mendels 1995; Pryor 2006; Safarinejad 2006b; Safarinejad 2006c; Safarinejad 2007; Safarinejad 2008; Waldinger 1998). The remaining 20 studies were at unclear risk because they did not explicitly describe the method of random sequence generation (Figure 2; Figure 3).
Allocation concealment
Eight of 31 studies were at low risk of bias because they implemented appropriate mechanisms to ensure that individuals enrolling participants were unaware of the upcoming group assignment for that participant (Buvat 2009; Mattos 2008; McMahon 2013; Novaretti 2002; Pryor 2006; Safarinejad 2006b; Safarinejad 2007; Safarinejad 2008). The 23 remaining studies were at unclear risk because they did not explicitly describe the methods utilized to ensure allocation concealment (Figure 2; Figure 3).
Blinding
Blinding of participants and personnel
Fifteen of 31 studies appropriately blinded both participants and personnel and were at low risk of bias (Ahn 1996; Atmaca 2002; Biri 1998; Kaufman 2009; Mattos 2008; McMahon 2013; Mendels 1995; Novaretti 2002; Pryor 2006; Safarinejad 2006b; Safarinejad 2006c; Safarinejad 2007; Safarinejad 2008; Waldinger 1994; Waldinger 1998). Twelve studies were at unclear risk of bias because they did not clearly describe which party was blinded (Athanasios 2007; Buvat 2009; Farnia 2009; Gong 2011; Hamidi Madani 2016; Kara 1996; Khelaia 2012; Kim 1998; McMahon 2010; Na 1996; Shang 2012; Yilmaz 1999). Four studies were at high risk of bias because they were single‐blind in which personnel were not blinded (Gameel 2013; McMahon 1998; McMahon 1999; Tuncel 2008). (Figure 2; Figure 3).
Blinding of outcome assessment
For participant‐reported outcomes, 26 studies were at low risk of bias because participants appeared to adequately blinded and five studies were at unclear risk of bias (Buvat 2009; Farnia 2009; Hamidi Madani 2016; Khelaia 2012; Na 1996). No study was at high risk (Figure 2; Figure 3).
For investigator‐assessed outcomes, seven studies were at low risk of bias because the outcome assessors were adequately blinded (Ahn 1996; Biri 1998; McMahon 2013; Novaretti 2002; Pryor 2006; Safarinejad 2006b; Safarinejad 2007). Twenty studies were at unclear risk because it was not clearly described whether outcome assessors were blinded (Athanasios 2007; Atmaca 2002; Buvat 2009; Farnia 2009; Gong 2011; Hamidi Madani 2016; Kara 1996; Kaufman 2009; Khelaia 2012; Kim 1998; Mattos 2008; McMahon 2010; Mendels 1995; Na 1996; Safarinejad 2006c; Safarinejad 2008; Shang 2012; Waldinger 1994; Waldinger 1998; Yilmaz 1999) Four studies were at high risk of bias because the investigators were not blinded (Gameel 2013; McMahon 1998; McMahon 1999; Tuncel 2008). (Figure 2; Figure 3).
All studies were at low risk of bias for the IELT outcome because this is an objectively assessed measure that would have been expected to be affected by blinding or lack thereof in terms of detection bias (Figure 2; Figure 3).
Incomplete outcome data
We assessed the risk of attrition bias on a per‐outcome basis but then collapsed these rating into one group since all judgments were identical. Twelve studies were at low risk of bias (Ahn 1996; Gameel 2013; Gong 2011; Mattos 2008; McMahon 1998; McMahon 1999; Novaretti 2002; Pryor 2006; Safarinejad 2006b; Safarinejad 2007; Shang 2012; Tuncel 2008). Thirteen studies were at unclear risk of bias as the proportion of randomized participants not included in the analyses was not clearly reported and the risk of attrition bias could not be estimated (Athanasios 2007; Atmaca 2002; Biri 1998; Farnia 2009; Hamidi Madani 2016; Kaufman 2009; Khelaia 2012; McMahon 2013; Mendels 1995; Safarinejad 2006c; Safarinejad 2008; Waldinger 1998; Yilmaz 1999). Six studies were at high risk of bias because large proportions of participants were excluded from the final analysis (Buvat 2009; Kara 1996; Kim 1998; McMahon 2010; Na 1996; Waldinger 1994).
Selective reporting
Four studies were at low risk of bias as they reported all outcomes according to their protocol and conducted their analyses according to their a priori plans (Buvat 2009; McMahon 2010; McMahon 2013; Pryor 2006). Twenty‐five studies were at unclear risk of bias because the no study protocols were available (Ahn 1996; Athanasios 2007; Atmaca 2002; Biri 1998; Farnia 2009; Gameel 2013; Gong 2011; Hamidi Madani 2016; Kara 1996; Khelaia 2012; Kim 1998; Mattos 2008; McMahon 1998; McMahon 1999; Mendels 1995; Na 1996; Novaretti 2002Safarinejad 2006b; Safarinejad 2006c; Safarinejad 2007; Safarinejad 2008; Shang 2012; Tuncel 2008; Waldinger 1994; Yilmaz 1999). Two studies were at high risk of bias because one did not complete report outcomes on one of their group (Kaufman 2009), and another did not completely report on side effects (Waldinger 1998) (Figure 2; Figure 3).
Other potential sources of bias
Twenty‐seven studies were at low risk of bias (Ahn 1996; Athanasios 2007; Atmaca 2002; Biri 1998; Buvat 2009; Farnia 2009; Gameel 2013; Gong 2011; Kara 1996; Kaufman 2009; Kim 1998; McMahon 1998; McMahon 1999; McMahon 2010; McMahon 2013; Na 1996; Novaretti 2002; Pryor 2006; Safarinejad 2006b; Safarinejad 2006c; Safarinejad 2007; Safarinejad 2008; Shang 2012; Tuncel 2008; Waldinger 1994; Waldinger 1998; Yilmaz 1999). Three studies were at unclear risk of bias because there was imbalance in the baseline characteristics (Mendels 1995), or they were only reported in abstract form and there was insufficient information to make a judgment (Hamidi Madani 2016; Khelaia 2012). One study was at high risk of bias because it only evaluated specific adverse effects (Mattos 2008) (Figure 2; Figure 3).
Effects of interventions
See: Summary of findings 1 SSRI compared to placebo for premature ejaculation
Primary outcomes
1.1 Participant perception of change with treatment
SSRI treatment probably results in an improvement in PE‐related symptoms defined as a rating of 'better' or 'much better' using the CGIC questionnaire compared to placebo (RR 1.92, 95% CI 1.66 to 2.23; I² = 24%; studies = 6, participants = 3260; Analysis 1.1; Figure 4). Compared to placebo and a baseline risk of 220 per 1000 men, this corresponds to 202 more men per 1000 (95% CI 145 more to 270 more) perceiving that their condition as 'better' or 'much better' with SSRIs.

Forest plot of comparison: 1 SSRI versus placebo, outcome: 1.1 Participant perception of change with treatment.
We rated the certainty of evidence as moderate, downgrading one level due to serious study limitations given that of the six studies included in this analysis, four had an unclear risk of selection bias, three had an unclear risk of performance bias and one had an unclear risk of detection bias. In addition, two were at high risk for attrition bias.
1.2 Participant satisfaction with intercourse
SSRI treatment probably improves satisfaction with intercourse defined as a rating of 'good' or 'very good' using the CGIC questionnaire compared to placebo (RR 1.63, 95% CI 1.42 to 1.87; I² = 53%; studies = 3, participants = 4273; Analysis 1.2; Figure 5). Compared to placebo and a baseline risk of 278 per 1000 men, this corresponds to 175 more men per 1000 (95% CI 117 more to 242 more) describing their satisfaction with intercourse as being 'good' or 'very good' with SSRIs.

Forest plot of comparison: 1 SSRI versus placebo, outcome: 1.2 Participant satisfaction with intercourse.
We rated the certainty of evidence as moderate, downgrading one level due to serious study limitations. Two of three included studies were at unclear risk of selection bias, one was at unclear risk of performance bias and one study that contributed a weight of 61.6% to the analysis was at high risk of attrition bias. However, we did not downgrade for the I² statistic of 53% since we did not judge the observed inconsistency to be clinically relevant.
1.3 Study withdrawal due to adverse events
SSRI treatment may result in an increase in the number of treatment cessations due to adverse events compared to placebo (RR 3.80, 95% CI 2.61 to 5.51; I² = 0%; studies = 20, participants = 7367; Analysis 1.3; Figure 6). Compared to placebo and a baseline risk of 11 per 1000 men, this corresponds to 30 more men per 1000 (95% CI 17 more to 49 more) stopping treatment due to adverse events due to SSRI treatment.

Forest plot of comparison: 1 SSRI versus placebo, outcome: 1.3 Study withdrawal due to adverse events.
We rated the certainty of evidence as low, downgrading two levels due to very serious study limitations because more than half the included studies were at unclear risk of selection bias or performance bias, or both. Four studies were at high risk of attrition bias for this outcome and two studies were at high risk of selective reporting bias.
Secondary outcomes
1.4 Perceived control over ejaculation
SSRI treatment probably improves participants' control over ejaculation defined as a rating of 'good' or 'very good' based on the PEP questionnaire compared to placebo (RR 2.29, 95% CI 1.72 to 3.05; I² = 75%; studies = 3, participants = 4273; Analysis 1.4). Compared to placebo and a baseline risk of 132 per 1000 men, this corresponds to 170 more men per 1000 (95% CI 95 more to 270 more) describing their control over ejaculation as being 'good' or 'very good' with SSRIs.
We rated the certainty of evidence as moderate, downgrading one level due to serious study limitations. Two of three studies had an unclear risk of selection bias, one had an unclear risk of performance bias and one had a high risk of attrition bias.
1.5 Participant distress about premature ejaculation
SSRI treatment probably decreases PE‐related distress defined as 'a little bit' or 'not at all' distressing based on the PEP questionnaire compared to placebo (RR 1.54, 95% CI 1.26 to 1.88; studies = 1, participants = 652; Analysis 1.5). Compared to placebo and a baseline risk of 353 per 1000 men, this corresponds to 191 men more per 1000 (95% CI 92 more to 311 more) reporting their distress about PE as being only 'a little bit' or 'not at all' with SSRIs.
We rated the certainty of evidence as moderate, downgrading one level due to serious study limitations because the only included study had unclear risk of selection bias, an unclear risk of attrition bias and a high risk of selective reporting bias.
1.6 Relationship difficulties
SSRI treatment may reduce relationship difficulties to only 'a little bit' or 'not at all' based on the PEP questionnaire compared to placebo (RR 1.20, 95% CI 1.07 to 1.34; studies = 1, participants = 652; Analysis 1.6). Compared to placebo, this corresponds to 129 men more per 1000 (95% CI 45 more to 218 more) reporting their relationship difficulties as being only 'a little bit' or 'not at all' with SSRIs.
We rated the certainty of evidence as low, downgrading one level each for serious study limitations and imprecision. The only included study had an unclear risk of selection bias, an unclear risk of attrition bias and a high risk of selective reporting bias. We perceived the absolute effect size to cross the threshold for a clinically important difference of 10% and, therefore, downgraded a further level for imprecision.
1.7 Adverse events
SSRI treatment probably increases adverse events substantially compared to placebo (RR 1.71, 95% CI 1.48 to 1.99; I² = 41%; studies = 17, participants = 4624; Analysis 1.7). Compared to placebo and a baseline risk of 243 per 1000, this corresponds to 173 more adverse events per 1000 men (95% CI 117 more to 241 more).
We rated the certainty of evidence as moderate, downgrading one level due to serious study limitations because more than half the included studies were rated as unclear risk for selection bias or performance bias, or both. Two studies had a high risk of attrition bias and over half had an unclear risk of selective reporting bias.
1.8 Intravaginal ejaculatory latency time
SSRI treatment may increase IELT compared to placebo (MD 3.09 minutes longer, 95% CI 1.94 longer to 4.25 longer; I² = 99%; studies = 20, participants = 5872; Analysis 1.8).
We rated the certainty of evidence as low, downgrading one level due to serious study limitations; most studies had an unclear or high risk of selection, performance, attrition and reporting bias. We also downgraded one level for serious concerns about inconsistency. These may in part be attributable to the duration of action (long versus short acting; Analysis 3.4) and type of SSRI (Analysis 3.4).
1.9 Depression
We are very uncertain whether SSRI treatment compared to placebo increases depression (RR 2.00, 95% CI 0.23 to 17.34; studies = 1, participants = 14; Analysis 1.9). We rated the certainty of evidence as very low, downgrading due to serious study limitations (unclear risk of selection and performance bias, high risk of attrition bias and unclear risk of selective reporting bias) and very serious imprecision.
Subgroup analyses
2 Long‐acting versus short‐acting SSRIs
2.1 Participant perception of change with treatment
The RR for participant perception of change with treatment as being 'better' or 'much better' was 8.48 (95% CI 2.21 to 32.51) for long‐acting SSRIs and 1.87 (95% CI 1.66 to 2.10) for short‐acting SSRIs (Analysis 2.1). The test for interaction was significant (P = 0.03; I² = 79.3%).
2.2 Participant satisfaction with intercourse
There were no studies of long‐acting SSRIs that evaluated participant satisfaction with intercourse.
2.3 Study withdrawal due to adverse events
The RR for study withdrawal due to adverse events was 2.00 (95% CI 0.92 to 4.34) for long‐acting SSRIs and 4.33 (95% CI 2.60 to 7.23) for short‐acting SSRIs (Analysis 2.3). The test for interaction was not significant (P = 0.10; I² = 62.4%).
2.4 Perceived control over ejaculation
There were no studies of long‐acting SSRIs that evaluated perceived control over ejaculation.
2.5 Participant distress about premature ejaculation
There were no studies of long‐acting SSRIs that evaluated participant distress about PE.
2.6 Relationship difficulties
There were no studies of long‐acting SSRIs that evaluated relationship difficulties.
2.7 Adverse events
The RR for adverse events was 1.90 (95% CI 1.37 to 2.64) for long‐acting SSRIs and 1.70 (95% CI 1.42 to 2.03) for short‐acting SSRIs (Analysis 2.7). The test for interaction was not significant (P = 0.54; I² = 0%).
2.8 Intravaginal ejaculatory latency time
The MD for IELT was 3.36 minutes (95% CI 1.62 to 5.10) for long‐acting SSRIs and 1.52 minutes (95% CI 1.27 to 1.77) for short‐acting SSRIs (Analysis 2.8). The test for interaction was significant (P = 0.04; I² = 76.2%).
2.9 Depression
There were no studies of short‐acting SSRIs that evaluated depression.
3 Types of long‐acting SSRIs
3.1 Participant perception of change with treatment
We found one study of citalopram (Atmaca 2002) and one of duloxetine (Athanasios 2007), which evaluated participant perception of change with treatment. The RR for participant perception of change with treatment as being 'better' or 'much better' was 9.00 (95% CI 1.32 to 61.24) for citalopram and 8.00 (95% CI 1.21 to 52.69) for duloxetine (Analysis 3.1). The test for interaction was not significant (P = 0.93; I² = 0%).
3.2 Participant satisfaction with intercourse
There were no studies of long‐acting SSRIs that evaluated participant satisfaction with intercourse.
3.3 Study withdrawal due to adverse events
We found 14 studies of long‐acting SSRIs that evaluated this outcome.
The RR for study withdrawal due to adverse events was 3.00 (95% CI 0.13 to 70.74) for citalopram, 7.64 (95% CI 0.99 to 58.71) for dapoxetine, not estimable for duloxetine, 2.00 (95% CI 0.37 to 10.74) for escitalopram, 2.59 (95% CI 0.34 to 19.59) for fluoxetine, 1.54 (95% CI 0.09 to 25.86) for fluvoxamine, 1.76 (95% CI 0.35 to 8.91) for paroxetine and 0.43 (95% CI 0.05 to 3.56) for sertraline (Analysis 3.2). The test for interaction was not significant (P = 0.69; I² = 0%).
3.4 Perceived control over ejaculation
There were no studies of long‐acting SSRIs that evaluated perceived control over ejaculation.
3.5 Participant distress about premature ejaculation
There were no studies of long‐acting SSRIs that evaluated participant distress about PE.
3.6 Relationship difficulties
There were no studies of long‐acting SSRIs that evaluated relationship difficulties.
3.7 Adverse events
We found 13 studies of long‐acting SSRIs that evaluated adverse effects. The RR for adverse effects was 3.00 (95% CI 0.51 to 17.57) for citalopram, 4.40 (95% CI 1.06 to 18.32) for clomipramine, 2.54 (95% CI 1.34 to 4.81) for dapoxetine, 3.00 (95% CI 0.37 to 24.17) for duloxetine, 1.69 (95% CI 0.69 to 4.15) for escitalopram, 2.50 (95% CI 1.29, to 4.86) for fluoxetine, 2.50 (95% CI 0.91 to 6.90) for paroxetine and 1.33 (95% CI 0.74 to 2.39) for sertraline (Analysis 3.3). The test for interaction was not significant (P = 0.71; I² = 0%).
3.8 Intravaginal ejaculatory latency time
We found 14 studies of long‐acting SSRIs that evaluated IELT. The MD for IELT was 4.85 (95% CI 3.14 to 6.56) for citalopram, 1.52 (95% CI 0.80 to 2.24) for duloxetine, 2.46 (95% CI 1.51 to 3.39) for fluoxetine, 0.59 (95% CI –0.35 to 1.53) for fluvoxamine, 6.51 (95% CI 0.33 to 12.68) for paroxetine and 2.55 (95% CI 1.54 to 3.56) for sertraline (Analysis 3.4). The test for interaction was significant (P < 0.001, I² = 80.0%).
3.9 Depression
We only found one study using long‐acting fluoxetine that evaluated depression and were unable to perform any secondary analyses (Kara 1996).
4 Different doses: dapoxetine
4.1 Participant perception of change with treatment
We found four studies that administered dapoxetine at the following doses: 30 mg daily (McMahon 2010), 30 mg on‐demand (Buvat 2009; McMahon 2013), 60 mg daily (McMahon 2010), and 60 mg on‐demand (Buvat 2009; Kaufman 2009). The RR for participant perception of change with treatment as being 'better' or 'much better' was 1.87 (95% CI 1.37 to 2.54) with 30 mg daily, 2.00 (95% CI 1.33 to 3.01) with 30 mg on‐demand, 1.68 (95% CI 1.23 to 2.30) with 60 mg daily and 1.98 (95% CI 1.58 to 2.48) with 60 mg on‐demand (Analysis 4.1). The test for interaction was not significant (P = 0.85; I² = 0%).
4.2 Participant satisfaction with intercourse
We found three studies that administered dapoxetine at the following doses: 30 mg daily (McMahon 2010), 30 mg on‐demand (Pryor 2006), 60 mg daily (McMahon 2010), and 60 mg on‐demand (Kaufman 2009). The RR for participant satisfaction with intercourse defined as a rating of 'good' or 'very good' was 1.41 (95% CI 1.08 to 1.85) with 30 mg daily, 1.59 (95% CI 1.33 to 1.90) with 30 mg on‐demand, 1.39 (95% CI 1.07 to 1.82) with 60 mg daily and 1.61 (95% CI 1.32 to 1.98) with 60 mg on‐demand (Analysis 4.2). The test for interaction was not significant (P = 0.74; I² = 0%).
4.3 Study withdrawal due to adverse events
We found three studies that administered dapoxetine at the following doses: 30 mg daily (McMahon 2010), 30 mg on‐demand (Buvat 2009; McMahon 2013; Pryor 2006), 60 mg daily (McMahon 2010; Safarinejad 2006b; Safarinejad 2008), and 60 mg on‐demand (Buvat 2009; Kaufman 2009; Pryor 2006). The RR for study withdrawal due to adverse events was 3.03 (95% CI 0.37 to 25.01) with 30 mg daily, 2.44 (95% CI 1.06 to 5.59) with 30 mg on‐demand, 8.76 (95% CI 2.10 to 36.49) with 60 mg daily and 6.51 (95% CI 3.64 to 11.66) with 60 mg on‐demand (Analysis 4.3). The test for interaction was not significant (P = 0.22, I² = 33%).
4.4 Perceived control over ejaculation
We found three studies that administered dapoxetine at the following doses: 30 mg daily (McMahon 2010), 30 mg on‐demand (Pryor 2006), 60 mg daily (McMahon 2010), and 60 mg on‐demand (Kaufman 2009; Pryor 2006). The RR of participants' control over ejaculation defined as a rating of 'good' or 'very good' was 1.79 (95% CI 1.26 to 2.53) with 30 mg daily, 3.70 (95% CI 2.72 to 5.04) with 30 mg on‐demand, 1.78 (95% CI 1.26 to 2.52) with 60 mg daily and 2.28 (95% CI 1.65 to 3.16) with 60 mg on‐demand (Analysis 4.4). The test for interaction was significant (P = 0.004; I² = 77.2%).
4.5 Participant distress about premature ejaculation
We found one study that administered dapoxetine 60 mg on‐demand (Kaufman 2009). The RR for PE‐related distress defined as a rating of its severity of only 'a little bit' or 'not at all' was 1.54 (95% CI 1.26 to 1.88; Analysis 4.5). We could not test for subgroup differences.
4.6 Relationship difficulties
We found one study that administered dapoxetine 60 mg on‐demand (Kaufman 2009). The RR for reducing relationship difficulties to only 'a little bit' or 'not at all' with this study was 1.20 (95% CI 1.07 to 1.34; Analysis 4.6). We could not test for subgroup differences.
4.7 Adverse events
We found five studies that administered dapoxetine at the following doses: 30 mg daily (McMahon 2010; McMahon 2013), 30 mg on‐demand (Buvat 2009), 60 mg daily (McMahon 2010; Safarinejad 2006b; Safarinejad 2008), and 60 mg on‐demand (Buvat 2009; Kaufman 2009). The RR for adverse events was 1.64 (95% CI 1.30 to 2.07) with 30 mg daily, 1.47 (95% CI 1.20 to 1.79) with 30 mg on‐demand, 2.73 (95% CI 2.03 to 3.66) with 60 mg daily and 1.56 (95% CI 1.23 to 1.99) with 60 mg on‐demand (Analysis 4.7). The test for interaction was significant (P = 0.006; I² = 76.2%).
4.8 Intravaginal ejaculatory latency time
We found four studies that administered dapoxetine as the following doses: 30 mg daily (McMahon 2010), 30 mg on‐demand (Buvat 2009; McMahon 2013; Pryor 2006), 60 mg daily (McMahon 2010), and 60 mg on‐demand (Buvat 2009; Pryor 2006). The MD for IELT was 1.80 (95% CI 1.27 to 2.33) with 30 mg daily, 1.37 (95% CI 0.86 to 1.89) with 30 mg on‐demand, 1.50 (95% CI 0.98 to 2.02) with 60 mg daily and 1.53 (95% CI 1.09 to 1.97) with 60 mg on‐demand (Analysis 4.8). The test for interaction was not significant (P = 0.71, I² = 0%).
4.9 Depression
We found no studies using dapoxetine that evaluated depression.
5 Different doses: fluoxetine
5.1 Participant perception of change with treatment
We found no studies using fluoxetine that evaluated participant perception of change with treatment.
5.2 Participant satisfaction with intercourse
We found no studies using fluoxetine that evaluated participant satisfaction with intercourse.
5.3 Study withdrawal due to adverse events
We found three studies that administered fluoxetine 20 mg daily (Kara 1996; Waldinger 1998; Yilmaz 1999). The RR for study withdrawal due to adverse events using this dose was 2.09 (95% CI 0.26 to 16.82; Analysis 5.1). We could not test for subgroup differences.
5.4 Perceived control over ejaculation
We found no studies using fluoxetine that evaluated perceived control over ejaculation.
5.5 Participant distress about premature ejaculation
We found no studies using fluoxetine that evaluated participant distress about PE.
5.6 Relationship difficulties
We found no studies using fluoxetine that evaluated relationship difficulties.
5.7 Adverse events
We found four studies that administered fluoxetine at the following doses: 20 mg daily (Kara 1996; Yilmaz 1999), 40 mg daily (Ahn 1996), and 90 mg daily (Mattos 2008). The RR for adverse events was 9.32 (95% CI 1.88 to 46.26) with 20 mg daily, 2.29 (95% CI 0.55 to 9.49) with 40 mg daily and 1.78 (95% CI 0.76 to 4.17) with 90 mg daily (Analysis 5.2). The test for interaction was not significant (P = 0.2; I² = 37.9%).
5.8 Intravaginal ejaculatory latency time
We found five studies that administered fluoxetine at the following doses: 20 mg daily (Kara 1996; Waldinger 1998; Yilmaz 1999), 40 mg daily (Ahn 1996), and 90 mg daily (Mattos 2008). The MD for IELT was 2.87 (95% CI 1.26 to 4.48) with 20 mg daily, –0.54 (95% CI –3.54 to 2.46) with 40 mg daily and 2.72 (95% CI 1.83 to 3.61) with 90 mg daily (Analysis 5.3). The test for interaction was not significant (P = 0.11, I² = 54.1%).
5.9 Depression
We found one study that administered fluoxetine 20 mg daily (Kara 1996). The RR for depression in this study was 2.00 (95% CI 0.23 to 17.34; Analysis 5.4). We could not test for subgroup differences.
Discussion
Summary of main results
We included 31 RCTs with 8254 participants and found that compared to placebo, SSRI treatment for PE probably improves perception of change with treatment, satisfaction with intercourse, perceived control over ejaculation, participant distress about PE, relationship difficulties and IELT. However, the administration of SSRIs may increase study withdrawals due to adverse events and probably increases adverse events.
Overall completeness and applicability of evidence
-
This review included 31 RCTs of 8254 participants with PE with diverse clinical characteristics that, therefore, likely reflect the population encountered in day‐to‐day clinical practice. They also included a range of SSRI drugs and dosing schedules utilized in the included trials.
-
The review did not include any active comparators and, therefore, is unable to address how these drugs compare to other management approaches such as topical anesthetics, tramadol or α1‐adrenoreceptor antagonists, which are recommended as treatment alternatives in the recent AUA guideline (Shindel 2020).
-
A specific concern in the use of SSRI for depression is the potential risk of promoting suicidal ideation, although this remains an issue of controversy (Khan 2003; Sharma 2016). The reported adverse events and study withdrawals of the included studies did not provide a signal for this outcome, but we also recognize that the overall number of participants and the relatively short follow‐up of these studies limit the ability to identify infrequent outcomes that might be associated with long‐term use.
Quality of the evidence
We consistently downgraded the certainty of evidence by one or two steps to moderate or low. Our confidence in the estimates of effect were primarily limited by study limitations and heterogeneity. Most studies were classified at unclear or high risk of bias for multiple domains and, therefore, the potential biases in those studies introduced a degree of uncertainty in the calculated summary estimates.
Potential biases in the review process
-
Despite a comprehensive search strategy without any publication or language restrictions, there is a possibility that we may have missed studies published in a language other than English, published in non‐indexed journals or unpublished.
-
There were fewer than 10 studies included for most outcomes and, therefore, we were unable to generate funnel plots thus possibly underestimating the risk of publication bias.
-
We contacted authors of each of the studies for further information, but only one responded to these requests (Mattos 2008), and this may be a further source of bias.
-
One author contributing several individual studies to this review, which were all at unclear risk of selective bias (as most included studies of this review) has had six studies on men's sexual health retracted due to alleged fraud (Retractionwatch 2015). Since none of the included studies were involved (Safarinejad 2006b; Safarinejad 2006c; Safarinejad 2007; Safarinejad 2008), we included these studies in this review. However, it does underscore the issue of how important a priori trial registration is (Roberts 2015).
Agreements and disagreements with other studies or reviews
There is a limited number of reviews that have compared SSRIs with placebo for PE. In contrast to our review, which focused on outcome of direct patient importance, they typically used IELT as a primary outcome. Also, none applied the same methodologic rigor as we applied in this review.
-
Castiglione 2016 assessed various pharmacologic interventions for PE using IELT as the primary outcome found that SSRIs prolonged IELT compared to placebo based on the 14 included trials.
-
Zhang 2019 found that paroxetine was more effective than fluoxetine and escitalopram in delaying ejaculation. The review also found that paroxetine combined with tadalafil or behavior therapy was more effective than paroxetine alone. This is consistent with Sun 2017, which reported that the pooled effects of SSRIs were superior to placebo in prolonging IELT in men with PE but found that SSRI alone was inferior to combination treatment of SSRI and phosphodiesterase‐5 inhibitors. However, there was no difference in IELT between paroxetine, tramadol, sertraline, phosphodiesterase 5 inhibitors, topical lidocaine gel, behavioral therapy or dapoxetine (Zhang 2019). These assessments were outside the scope of this review which focused on the comparison with placebo/no intervention.
-
Again using IELT as the primary outcome, one network meta‐analysis reported that a range of SSRI agents outperformed placebo (Jian 2018). However, this study reported that topical anesthetics or phosphodiesterase‐5 inhibitors plus SSRIs were likely to be the most efficacious treatment strategies for PE.
-
Another network meta‐analysis of 44 studies including a range of pharmacologic agents for PE reported that dapoxetine was likely to be the most efficacious (Sridharan 2018). Similar to this review, Sridharan 2018 also found that dapoxetine, venlafaxine and fluoxetine all increased the incidence of adverse events.
Other relevant document are currently available guidelines on this topic. These use varying methodology when it comes not only to the framework of moving from evidence to recommendations but also to what extent these are supported by rigorous systematic reviews.
-
The European Association for Urology (EAU) guidelines on ED, PE, penile curvature and priapism recommend pharmacotherapy as first‐line therapy of lifelong PE (grade A) states that on‐demand dapoxetine (as the only approved pharmacologic therapy for PE) or other off‐label antidepressants such as daily SSRIs (Hatzimouratidis 2010). This report was supported by a literature search; then "… the panel reviewed and selected the articles with the highest evidence available." The EAU did not perform its own meta‐analysis.
-
The International Society of Sexual Medicine's Guidelines for the Diagnosis and Treatment of PE states that there is "robust evidence to support the efficacy and safety of on‐demand dosing of dapoxetine for the treatment of lifelong and acquired PE" and to "support the efficacy and safety of off‐label daily dosing of the SSRIs paroxetine sertraline, citalopram, fluoxetine" (Althof 2014). These recommendations were supported by a comprehensive literature search and a consensus‐based process.
-
Guidelines of the AUA are the most recent; they are also the most methodologically rigorous supported by a systematic review conducted by the Pacific Northwest Evidence‐based Practice Centre that was up‐to‐date up to March 2019 (Shindel 2020). This document makes a strong recommendation that "clinicians should recommend daily SSRIs; on‐demand clomipramine or dapoxetine (where available) … as first‐line pharmacotherapies in the treatment of PE." However, the guideline group did not conduct their meta‐analysis or own update meta‐analyses from previously published reviews systematic reviews.

Study flow diagram.

Risk of bias graph: review authors' judgments about each risk of bias item presented as percentages across all included studies.

Risk of bias summary: review authors' judgments about each risk of bias item for each included study.

Forest plot of comparison: 1 SSRI versus placebo, outcome: 1.1 Participant perception of change with treatment.

Forest plot of comparison: 1 SSRI versus placebo, outcome: 1.2 Participant satisfaction with intercourse.

Forest plot of comparison: 1 SSRI versus placebo, outcome: 1.3 Study withdrawal due to adverse events.

Comparison 1: SSRI versus placebo, Outcome 1: Participant perception of change with treatment

Comparison 1: SSRI versus placebo, Outcome 2: Participant satisfaction with intercourse

Comparison 1: SSRI versus placebo, Outcome 3: Study withdrawal due to adverse events

Comparison 1: SSRI versus placebo, Outcome 4: Perceived control over ejaculation

Comparison 1: SSRI versus placebo, Outcome 5: Participant distress about PE

Comparison 1: SSRI versus placebo, Outcome 6: Relationship difficulties

Comparison 1: SSRI versus placebo, Outcome 7: Adverse events

Comparison 1: SSRI versus placebo, Outcome 8: Intravaginal ejaculatory latency time

Comparison 1: SSRI versus placebo, Outcome 9: Depression

Comparison 2: Subgroup analysis: long‐acting versus short‐acting SSRI, Outcome 1: Participant perception of change with treatment

Comparison 2: Subgroup analysis: long‐acting versus short‐acting SSRI, Outcome 2: Participant satisfaction with intercourse

Comparison 2: Subgroup analysis: long‐acting versus short‐acting SSRI, Outcome 3: Study withdrawal due to adverse events

Comparison 2: Subgroup analysis: long‐acting versus short‐acting SSRI, Outcome 4: Perceived control over ejaculation

Comparison 2: Subgroup analysis: long‐acting versus short‐acting SSRI, Outcome 5: Participant distress about PE

Comparison 2: Subgroup analysis: long‐acting versus short‐acting SSRI, Outcome 6: Relationship difficulties

Comparison 2: Subgroup analysis: long‐acting versus short‐acting SSRI, Outcome 7: Adverse events

Comparison 2: Subgroup analysis: long‐acting versus short‐acting SSRI, Outcome 8: Intravaginal ejaculatory latency time

Comparison 2: Subgroup analysis: long‐acting versus short‐acting SSRI, Outcome 9: Depression

Comparison 3: Subgroup analysis: comparison of long‐acting agents, Outcome 1: Participant perception of change with treatment

Comparison 3: Subgroup analysis: comparison of long‐acting agents, Outcome 2: Study withdrawal due to adverse events

Comparison 3: Subgroup analysis: comparison of long‐acting agents, Outcome 3: Adverse events

Comparison 3: Subgroup analysis: comparison of long‐acting agents, Outcome 4: Intravaginal ejaculatory latency time

Comparison 3: Subgroup analysis: comparison of long‐acting agents, Outcome 5: Depression

Comparison 4: Subgroup analysis: different doses of dapoxetine, Outcome 1: Participant perception of change with treatment

Comparison 4: Subgroup analysis: different doses of dapoxetine, Outcome 2: Participant satisfaction with intercourse

Comparison 4: Subgroup analysis: different doses of dapoxetine, Outcome 3: Study withdrawal due to adverse events

Comparison 4: Subgroup analysis: different doses of dapoxetine, Outcome 4: Perceived control over ejaculation

Comparison 4: Subgroup analysis: different doses of dapoxetine, Outcome 5: Participant distress about PE

Comparison 4: Subgroup analysis: different doses of dapoxetine, Outcome 6: Relationship difficulties

Comparison 4: Subgroup analysis: different doses of dapoxetine, Outcome 7: Adverse events

Comparison 4: Subgroup analysis: different doses of dapoxetine, Outcome 8: Intravaginal ejaculatory latency time

Comparison 5: Subgroup analysis: different doses of fluoxetine, Outcome 1: Study withdrawal due to adverse events

Comparison 5: Subgroup analysis: different doses of fluoxetine, Outcome 2: Adverse events

Comparison 5: Subgroup analysis: different doses of fluoxetine, Outcome 3: Intravaginal ejaculatory latency time

Comparison 5: Subgroup analysis: different doses of fluoxetine, Outcome 4: Depression
| SSRI compared to placebo for premature ejaculation in adult men | ||||||
| Patient or population: adult men with premature ejaculation | ||||||
| Outcomes | № of participants | Certainty of the evidence | Relative effect | Anticipated absolute effects* (95% CI) | What happens | |
|---|---|---|---|---|---|---|
| Risk with placebo | Risk difference with SSRI | |||||
| Participant perception of change with treatment | 3260 | ⊕⊕⊕⊝ | RR 1.92 | Study population | SSRI probably results in perceived improvement compared to placebo. | |
| 220 per 1000 | 202 more per 1000 | |||||
| Participant satisfaction with intercourse | 4273 | ⊕⊕⊕⊝ | RR 1.63 | Study population | SSRI probably results in improved satisfaction with intercourse compared to placebo. | |
| 278 per 1000 | 175 more per 1000 | |||||
| Study withdrawal due to adverse events | 7367 | ⊕⊕⊝⊝ | RR 3.80 | Study population | SSRI may result in more withdrawals due to adverse events compared to placebo. | |
| 11 per 1000 | 30 more per 1000 | |||||
| Perceived control over ejaculation | 4273 | ⊕⊕⊕⊝ | RR 2.29 | Study population | SSRI probably results in improved perceived control over ejaculation compared to placebo. | |
| 132 per 1000 | 170 more per 1000 | |||||
| Participant distress about PE | 652 | ⊕⊕⊕⊝ | RR 1.54 | Study population | SSRI probably results in increased numbers of men not distressed about PE compared to placebo. | |
| 353 per 1000 | 191 more per 1000 | |||||
| Adverse events | 4624 | ⊕⊕⊕⊝ | RR 1.71 | Study population | SSRI probably results in increased adverse events compared to placebo. | |
| 243 per 1000 | 173 more per 1000 | |||||
| IELT | 5872 | ⊕⊕⊝⊝ | — | The mean IELT was 1.41 minutes | MD 3.09 minutes higher | SSRI probably results in extended IELT compared to placebo. |
| *The risk in the intervention group (and its 95% confidence interval) is based on the assumed risk in the comparison group and the relative effect of the intervention (and its 95% CI). CI: confidence interval; IELT: intravaginal ejaculatory latency time; MD: mean difference; PE: premature ejaculate; RCT: randomized controlled trial; RR: risk ratio; SSRI: selective serotonin reuptake inhibitor. | ||||||
| GRADE Working Group grades of evidence | ||||||
| aDowngraded one level for study limitations: most studies had an unclear or high risk of selection, performance and detection bias. | ||||||
| Study | Intervention(s) (route, frequency, total dose/day) | Comparator(s) (route, frequency, total dose/day) |
|---|---|---|
| I1: fluoxetine 20 mg daily for first 1 week and 40 mg daily for remaining 5 weeks after breakfast | C1: placebo daily | |
| I1: duloxetine 20 mg daily for 1 week followed by 40 mg daily | C1: placebo daily | |
| I1: citalopram 20 mg daily up to 60 mg | C1: placebo daily up to 3 tablets | |
| I1: sertraline 50 mg daily | C1: placebo daily | |
| I1: dapoxetine 30 mg on‐demand I2: dapoxetine 60 mg on‐demand | C1: placebo daily C2: placebo daily | |
| I1: citalopram 20 mg on‐demand | C1: placebo on‐demand | |
| I1: paroxetine 20 mg on‐demand + lubricating jelly | C1: placebo on‐demand + lubricating jelly | |
| I1: paroxetine 20 mg daily | C1: placebo | |
| I1: tramadol 50 mg I2: paroxetine 20 mg | C1: placebo daily | |
| I1: fluoxetine 20 mg daily | C1: placebo daily | |
| I1: dapoxetine 60 mg on‐demand | C1: placebo daily | |
| I1: paroxetine 20 mg I2: paroxetine 20 mg 2–3 hours before intercourse | C1: placebo daily | |
| I1: fluoxetine 40 mg daily for 1 week then 80 mg for 3 weeks I2: sertraline 100 mg for 1 week then 200 mg for 3 weeks | C1: placebo daily C2: placebo daily | |
| I1: fluoxetine 90 mg daily I2: fluoxetine 90 mg daily + tadalafil 20 mg on‐demand | C1: placebo daily C2: placebo + tadalafil 20 mg on‐demand | |
| I1: sertraline 50 mg daily | C1: placebo daily | |
| I1: paroxetine 20 mg I2: paroxetine as needed 3–4 hours before planned sexual intercourse I3: paroxetine 10 mg for 3 weeks then 20 mg paroxetine as needed for 4 weeks | C1: placebo daily for 3 weeks then placebo daily for 4 weeks | |
| I1: dapoxetine 30 mg daily I2: dapoxetine 60 mg daily | C1: placebo daily C2: placebo daily | |
| I1: dapoxetine 30 mg on‐demand, from week 4 up to 60 mg if tolerated + PDE5 inhibitor | C1: placebo on‐demand + PDE5 inhibitor | |
| I1: sertraline 50 mg daily that could be titrated up to 200 mg daily | C1: placebo daily | |
| I1: sertraline 50 mg at night that could be titrated up to 100 mg daily | C1: placebo daily | |
| I1: fluoxetine 20 mg daily | C1: placebo daily | |
| I1: dapoxetine 30 mg on‐demand I2: dapoxetine 60 mg on‐demand | C1: placebo on‐demand 1–3 hours before anticipated sexual activity | |
| I1: dapoxetine 60 mg daily I2: paroxetine 20 mg daily | C1: placebo daily | |
| I1: citalopram 20 mg daily | C1: placebo daily | |
| I1: escitalopram 10 mg daily | C1: placebo daily | |
| I1: dapoxetine 30 mg twice daily | C1: placebo twice daily | |
| I1: citalopram 20 mg daily | C1: placebo daily | |
| I1: sertraline 50 mg nightly for 2 months | C1: placebo daily for 2 months | |
| I1: paroxetine 20 mg daily for 1 week and then 40 mg daily from week 2–6 | C1: placebo daily | |
| I1: fluoxetine 20 mg daily I2: fluvoxamine 100 mg daily I3: paroxetine 20 mg daily I4: sertraline 50 mg daily | C1: placebo daily | |
| I1: fluoxetine 20 mg daily | C1: placebo daily | |
| C: comparator; I: intervention; PDE5: phosphodiesterase‐5. | ||
| Study | Intervention(s) and comparator(s) | Duration of intervention | Trial period | Country | Setting | Age in years (mean) | Baseline IELT in minutes (mean) | Number of participants with primary/secondary PE |
|---|---|---|---|---|---|---|---|---|
| I1: fluoxetine 20 mg daily for first 1 week and 40 mg daily for remaining 5 weeks after breakfast C1: placebo daily | 6 weeks | NR | South Korea | Outpatient | 39.8 (range 34–48) | 0.78 (range 0.17–2.0) | NA/NA | |
| 39.8 (range 34–48) | 0.78 (range 0.17–2.0) | NA/NA | ||||||
| I1: duloxetine 20 mg daily for 1 week followed by 40 mg daily C1: placebo daily | 12 weeks | NR | Greece | Academic | 31.35 (SD 8.23) | 0.63 (SD 0.27) | NA/NA | |
| 32.65 (SD 7.49) | 0.58 (SD 0.30) | NA/NA | ||||||
| I1: citalopram 20 mg daily up to 60 mg C1: placebo daily | 8 weeks | NR | Turkey | Outpatient | Range 24–46 | 0.55 (SD 0.29) | NA/NA | |
| Range 24–46 | 0.50 (SD 0.24) | NA/NA | ||||||
| I1: sertraline 50 mg C1: placebo daily | 4 weeks | 1995–1997 | Turkey | Outpatient | NR | 0.68 (SD 0.21) | NA/NA | |
| NR | 0.72 (SD 0.33) | NA/NA | ||||||
| I1: dapoxetine 30 mg on‐demand I2: dapoxetine 60 mg on‐demand C1: placebo daily | 24 weeks | 2004–2006 | France | Academic | 39.6 (SD 9.53) | 0.9 (SD 0.50) | NA/NA | |
| 40.5 (SD 9.62) | 0.9 (SD 0.49) | NA/NA | ||||||
| 40.1 (SD 9.98) | 0.9 (SD 0.51) | NA/NA | ||||||
| I1: citalopram 20 mg on‐demand C1: placebo daily | 4 weeks | 2006–2007 | Iran | Outpatient | 34.28 (SD 6.67) | 1.11 (SD 0.61) | NA/NA | |
| 33.76 (SD 5.93) | 1.10 (SD 0.56) | NA/NA | ||||||
| I1: paroxetine 20 mg on‐demand + lubricating jelly C1: placebo on‐demand + lubricating jelly | 4 weeks | 2009–2012 | Egypt | Outpatient | NR | 0.16 (SD 0.47) | NA/NA | |
| I1: paroxetine 20 mg daily C1: placebo daily | 30 days | NR | China | likely outpatient | 26.8 (SD 5.5) | 0.89 (SD 0.21) | NA/NA | |
| 29.2 (SD 6.7) | 0.97 (SD 0.18) | |||||||
| I1: tramadol 50 mg I2: paroxetine 20 mg C1: placebo | 12 weeks | NR | Iran | Outpatient | NR | NR | NA/NA | |
| NR | NR | NA/NA | ||||||
| NR | NR | NA/NA | ||||||
| I1: fluoxetine 20 mg daily C1: placebo daily | NR | NR | Turkey | Outpatient | Range 15–50 | 0.42 (SD 0.21) | NA/NA | |
| Range 15–50 | 0.5 (SD 0.14) | NA/NA | ||||||
| I1: dapoxetine 60 mg on‐demand C1: placebo on‐demand | 9 weeks | NR | USA and Canada | Outpatient | 41.8 (SD 9.80) | NR | NA/NA | |
| 40.98 (SD 9.71) | NR | NA/NA | ||||||
| I1: paroxetine 20 mg I2: paroxetine 20 mg 2–3 hours before intercourse C1: placebo | 4 weeks | NR | Georgia | Academic | 22.7 (range 19–39) | NR | NA/NA | |
| 22.7 (range 19–39) | NR | NA/NA | ||||||
| 22.7 (range 19–39) | NR | NA/NA | ||||||
| I1: fluoxetine 40 mg daily for 1 week then 80 mg for 3 weeks I2: sertraline 100 mg for 1 week then 200 mg for 3 weeks C1: placebo daily | 16 weeks | NR | South Korea | Academic | 44 (range 30–60) | 0.77 (SD 0.68) | NA/NA | |
| 44 (range 30–60) | 0.77 (SD 0.68) | NA/NA | ||||||
| 44 (range 30–60) | 0.77 (SD 0.68) | NA/NA | ||||||
| I1: fluoxetine 90 mg daily I2: fluoxetine 90 mg daily + tadalafil 20 mg on‐demand C1: placebo daily C2: placebo + tadalafil 20 mg on‐demand | 12 weeks | NR | Brazil | Academic | 50 (SD 8.51) | 0.94 (SD 0.31) | NA/NA | |
| 42.81 (SD 7.73) | 0.83 (SD 0.43) | NA/NA | ||||||
| 45.93 (SD 9.96) | 0.83 (SD 0.31) | NA/NA | ||||||
| 43.2 (SD 11.3) | 0.83 (SD 0.32) | NA/NA | ||||||
| I1: sertraline 50 mg C1: placebo daily | 12 weeks | NR | Australia | Academic | 41 (range 19–70) | 0.3 | NA/NA | |
| 41 (range 19–70) | 0.3 | NA/NA | ||||||
| Study 1: I1: paroxetine 20 mg C1: paroxetine as needed 3–4 hours before planned sexual intercourse | 17 weeks | NR | Australia | Academic | 39.5 | 0.3 | 19/7 | |
| 39.5 | 0.3 | 19/7 | ||||||
| Study 2: I2: paroxetine 10 mg for 3 weeks then 20 mg paroxetine as needed for 4 weeks C2: placebo daily for 3 weeks then placebo daily for 4 weeks | 40.5 | 0.5 | 32/10 | |||||
| 40.5 | 0.5 | 32/10 | ||||||
| I1: dapoxetine 30 mg on‐demand I2: dapoxetine 60 mg on‐demand C1: placebo daily | 12 weeks | 2005–2006 | Multicenter in Asia/Pacific | Academic | 41.2 (SD 10.74) | 3.9 | 92 (42.2%)/NA | |
| 41.0 (SD 10.78) | 4.2 | 92 (42.2%)/NA | ||||||
| 40.6 (SD 9.71) | 2.4 | 96 (45.9%)/NA | ||||||
| I1: dapoxetine 30 mg on‐demand, from week 4 up to 60 mg if tolerated + PDE5 inhibitor taken 1–3 hours prior to sexual intercourse C1: placebo daily + PDE5 inhibitor taken 1–3 hours prior to intercourse | 12 weeks | 2010–2011 | Australia | Academic | 49.5 (SD 11.23) | NR | 92 (42.2%)/NA | |
| 47.9 (SD 11.96) | NR | 96 (45.9%)/NA | ||||||
| I1: sertraline 50 mg daily that could be titrated up to 200 mg daily C1: placebo daily | 10 weeks | NR | USA | Academic | NR | 0.98 (SD 1.15) | NA/NA | |
| NR | 1.10 (SD 1.35) | NA/NA | ||||||
| I1: sertraline 50 mg at night that could be titrated up to 100 mg daily C1: placebo daily | 6 weeks | NR | South Korea | Academic | NR | NR | NA/NA | |
| NR | NR | |||||||
| I1: fluoxetine 20 mg C1: placebo daily | 20 weeks | 1998–2000 | Brazil | Academic | 37.4 (SD 10.7) | 1.01 (SD 0.86) | NA/NA | |
| 37.4 (SD 10.7) | 1.05 (SD 1.07) | NA/NA | ||||||
| I1: dapoxetine 30 mg on‐demand 1–3 hours before anticipated sexual activity I2: dapoxetine 60 mg on‐demand 1–3 hours before anticipated sexual activity C1: placebo on‐demand 1–3 hours before anticipated sexual activity | 12 weeks | 2003–2004 | USA | Academic | 40.3 (SD 9.10) | 0.90 (SD 0.47) | 563/227 | |
| 40.9 (SD 9.09) | 0.92 (SD 0.50) | 571/234 | ||||||
| 40.3 (SD 9.55) | 0.91 (SD 0.48) | 560/248 | ||||||
| I1: dapoxetine 60 mg daily I2: paroxetine 20 mg daily C1: placebo daily | 12 weeks | 2003–2005 | Iran | Academic | 33.4 (range 20–50) | 0.63 | 64 (61.5%)/NA | |
| 34.6 (range 21–49) | 0.52 | 63 (60.0%)/NA | ||||||
| 34.3 (range 21–50) | 0.57 | 11 (44.0%)/NA | ||||||
| I1: citalopram 30 mg C1: placebo daily | 6 months | NR | Iran | Academic | 32 (21–49) | 0.53 | 10/16 | |
| 34 (21–49) | 0.47 | 11/14 | ||||||
| I1: escitalopram 10 mg daily C1: placebo daily | 12 weeks | 2003–2005 | Iran | Academic | 33.5 (range 21–44) | NR | 87 (70%)/NA | |
| 33.3 (range 19–46) | NR | 88 (69.8%)/NA | ||||||
| I1: dapoxetine 30 mg daily C1: placebo daily | 12 weeks | 2004–2006 | Iran | Academic | 35.7 (range 21–54) | 0.37 | 40 (37.7%)/NA | |
| 36.3 (range 19–56) | 0.48 | 43 (40.6%)/NA | ||||||
| I1: citalopram 20 mg daily C1: placebo daily | 4 weeks | 2011–2012 | China | Academic | 39.1 (SD 2.5) | 0.91 (SD 0.18) | NA/NA | |
| 37.8 (SD 2.8) | 0.95 (SD 0.17) | |||||||
| I1: sertraline 50 mg nightly for 2 months C1: placebo daily | 8 weeks | NR | Turkey | Academic | 36.9 (median) (SD 6.9) | NR | NA/NA | |
| 34.9 (median) (SD 9.0) | NR | NA/NA | ||||||
| I1: paroxetine 20 mg daily for 1 week and then 40 mg daily from week 2–6 C1: placebo daily | 6 weeks | NR | The Netherlands | Outpatient | 41 (range 27–48) | NR | 7/8 (87.5%)/NA | |
| 38 (range 30–47) | NR | 7/9 (77.7%)/NA | ||||||
| I1: fluoxetine 20 mg daily I2: fluvoxamine 100 mg daily I3: paroxetine 20 mg daily I4: sertraline 50 mg daily C1: placebo daily | 6 weeks | NR | The Netherlands | Outpatient | 38 (SD 7.0) | 0.3 (SD 0.22) | NA/NA | |
| 44 (SD 10.0) | 0.3 (SD 0.22) | NA/NA | ||||||
| 41 (SD 8.0) | 0.3 (SD 0.22) | NA/NA | ||||||
| 40 (SD 9.0) | 0.3 (SD 0.22) | NA/NA | ||||||
| 45 (SD 4.0) | 0.3 (SD 0.22) | NA/NA | ||||||
| I1: fluoxetine 20 mg daily C1: placebo | 1 month | 1997–1997 | Turkey | Academic | 36.5 (range 22–56) | 1.2 (SD 1.0) | NA/NA | |
| 37.3 (range 24–58) | 1.1 (SD 1.1) | NA/NA | ||||||
| C: comparator; I: intervention; IELT: intravaginal ejaculatory latency time; NA: not available; NR: not reported; PDE5: phosphodiesterase‐5; PE: premature ejaculation; SD: standard deviation. | ||||||||
| Outcome or subgroup title | No. of studies | No. of participants | Statistical method | Effect size |
| 1.1 Participant perception of change with treatment Show forest plot | 6 | 3260 | Risk Ratio (M‐H, Random, 95% CI) | 1.92 [1.66, 2.23] |
| 1.2 Participant satisfaction with intercourse Show forest plot | 3 | 4273 | Risk Ratio (M‐H, Random, 95% CI) | 1.63 [1.42, 1.87] |
| 1.3 Study withdrawal due to adverse events Show forest plot | 20 | 7367 | Risk Ratio (M‐H, Random, 95% CI) | 3.80 [2.61, 5.51] |
| 1.4 Perceived control over ejaculation Show forest plot | 3 | 4273 | Risk Ratio (M‐H, Random, 95% CI) | 2.29 [1.72, 3.05] |
| 1.5 Participant distress about PE Show forest plot | 1 | 652 | Risk Ratio (M‐H, Random, 95% CI) | 1.54 [1.26, 1.88] |
| 1.6 Relationship difficulties Show forest plot | 1 | 652 | Risk Ratio (M‐H, Random, 95% CI) | 1.20 [1.07, 1.34] |
| 1.7 Adverse events Show forest plot | 17 | 4624 | Risk Ratio (M‐H, Random, 95% CI) | 1.71 [1.48, 1.99] |
| 1.8 Intravaginal ejaculatory latency time Show forest plot | 20 | 5872 | Mean Difference (IV, Random, 95% CI) | 3.09 [1.94, 4.25] |
| 1.9 Depression Show forest plot | 1 | 14 | Risk Ratio (M‐H, Random, 95% CI) | 2.00 [0.23, 17.34] |
| Outcome or subgroup title | No. of studies | No. of participants | Statistical method | Effect size |
| 2.1 Participant perception of change with treatment Show forest plot | 6 | 3260 | Risk Ratio (M‐H, Random, 95% CI) | 1.92 [1.66, 2.23] |
| 2.1.1 Long‐acting SSRI | 2 | 46 | Risk Ratio (M‐H, Random, 95% CI) | 8.48 [2.21, 32.51] |
| 2.1.2 Short‐acting SSRI | 4 | 3214 | Risk Ratio (M‐H, Random, 95% CI) | 1.87 [1.66, 2.10] |
| 2.2 Participant satisfaction with intercourse Show forest plot | 3 | 4273 | Risk Ratio (M‐H, Random, 95% CI) | 1.63 [1.42, 1.87] |
| 2.2.1 Short‐acting SSRI | 3 | 4273 | Risk Ratio (M‐H, Random, 95% CI) | 1.63 [1.42, 1.87] |
| 2.3 Study withdrawal due to adverse events Show forest plot | 20 | 7367 | Risk Ratio (M‐H, Random, 95% CI) | 3.71 [2.56, 5.38] |
| 2.3.1 Long‐acting SSRI | 14 | 1315 | Risk Ratio (M‐H, Random, 95% CI) | 2.00 [0.92, 4.34] |
| 2.3.2 Short‐acting SSRI | 6 | 6052 | Risk Ratio (M‐H, Random, 95% CI) | 4.33 [2.60, 7.23] |
| 2.4 Perceived control over ejaculation Show forest plot | 3 | 4273 | Risk Ratio (M‐H, Random, 95% CI) | 2.29 [1.72, 3.05] |
| 2.4.1 Short‐acting SSRI | 3 | 4273 | Risk Ratio (M‐H, Random, 95% CI) | 2.29 [1.72, 3.05] |
| 2.5 Participant distress about PE Show forest plot | 1 | 652 | Risk Ratio (M‐H, Random, 95% CI) | 1.54 [1.26, 1.88] |
| 2.5.1 Short‐acting SSRI | 1 | 652 | Risk Ratio (M‐H, Random, 95% CI) | 1.54 [1.26, 1.88] |
| 2.6 Relationship difficulties Show forest plot | 1 | 652 | Risk Ratio (M‐H, Random, 95% CI) | 1.20 [1.07, 1.34] |
| 2.6.1 Short‐acting SSRI | 1 | 652 | Risk Ratio (M‐H, Random, 95% CI) | 1.20 [1.07, 1.34] |
| 2.7 Adverse events Show forest plot | 17 | 4624 | Risk Ratio (M‐H, Random, 95% CI) | 1.71 [1.48, 1.99] |
| 2.7.1 Long‐acting SSRI | 13 | 1162 | Risk Ratio (M‐H, Random, 95% CI) | 1.90 [1.37, 2.64] |
| 2.7.2 Short‐acting SSRI | 4 | 3462 | Risk Ratio (M‐H, Random, 95% CI) | 1.70 [1.42, 2.03] |
| 2.8 Intravaginal ejaculatory latency time Show forest plot | 19 | 5804 | Mean Difference (IV, Random, 95% CI) | 2.74 [1.57, 3.92] |
| 2.8.1 Long‐acting SSRI | 14 | 576 | Mean Difference (IV, Random, 95% CI) | 3.36 [1.62, 5.10] |
| 2.8.2 Short‐acting SSRI | 5 | 5228 | Mean Difference (IV, Random, 95% CI) | 1.52 [1.27, 1.77] |
| 2.9 Depression Show forest plot | 1 | 14 | Risk Ratio (M‐H, Random, 95% CI) | 2.00 [0.23, 17.34] |
| 2.9.1 Long‐acting SSRI | 1 | 14 | Risk Ratio (M‐H, Random, 95% CI) | 2.00 [0.23, 17.34] |
| Outcome or subgroup title | No. of studies | No. of participants | Statistical method | Effect size |
| 3.1 Participant perception of change with treatment Show forest plot | 2 | 46 | Risk Ratio (M‐H, Random, 95% CI) | 8.48 [2.21, 32.51] |
| 3.1.1 Citalopram | 1 | 26 | Risk Ratio (M‐H, Random, 95% CI) | 9.00 [1.32, 61.24] |
| 3.1.2 Duloxetine | 1 | 20 | Risk Ratio (M‐H, Random, 95% CI) | 8.00 [1.21, 52.69] |
| 3.2 Study withdrawal due to adverse events Show forest plot | 14 | 1315 | Risk Ratio (M‐H, Random, 95% CI) | 2.00 [0.92, 4.34] |
| 3.2.1 Citalopram | 3 | 164 | Risk Ratio (M‐H, Random, 95% CI) | 3.00 [0.13, 70.74] |
| 3.2.2 Dapoxetine | 2 | 383 | Risk Ratio (M‐H, Random, 95% CI) | 7.64 [0.99, 58.71] |
| 3.2.3 Duloxetine | 1 | 20 | Risk Ratio (M‐H, Random, 95% CI) | Not estimable |
| 3.2.4 Escitalopram | 1 | 276 | Risk Ratio (M‐H, Random, 95% CI) | 2.00 [0.37, 10.74] |
| 3.2.5 Fluoxetine | 3 | 72 | Risk Ratio (M‐H, Random, 95% CI) | 2.59 [0.34, 19.59] |
| 3.2.6 Fluvoxamine | 1 | 15 | Risk Ratio (M‐H, Random, 95% CI) | 1.54 [0.09, 25.86] |
| 3.2.7 Paroxetine | 4 | 281 | Risk Ratio (M‐H, Random, 95% CI) | 1.76 [0.35, 8.91] |
| 3.2.8 Sertraline | 3 | 104 | Risk Ratio (M‐H, Random, 95% CI) | 0.43 [0.05, 3.56] |
| 3.3 Adverse events Show forest plot | 13 | 1204 | Risk Ratio (M‐H, Random, 95% CI) | 2.00 [1.44, 2.78] |
| 3.3.1 Citalopram | 2 | 106 | Risk Ratio (M‐H, Random, 95% CI) | 3.00 [0.51, 17.57] |
| 3.3.2 Clomipramine | 1 | 42 | Risk Ratio (M‐H, Random, 95% CI) | 4.40 [1.06, 18.32] |
| 3.3.3 Dapoxetine | 2 | 356 | Risk Ratio (M‐H, Random, 95% CI) | 2.54 [1.34, 4.81] |
| 3.3.4 Duloxetine | 1 | 20 | Risk Ratio (M‐H, Random, 95% CI) | 3.00 [0.37, 24.17] |
| 3.3.5 Escitalopram | 1 | 254 | Risk Ratio (M‐H, Random, 95% CI) | 1.69 [0.69, 4.15] |
| 3.3.6 Fluoxetine | 4 | 140 | Risk Ratio (M‐H, Random, 95% CI) | 2.50 [1.29, 4.86] |
| 3.3.7 Paroxetine | 1 | 155 | Risk Ratio (M‐H, Random, 95% CI) | 2.50 [0.91, 6.90] |
| 3.3.8 Sertraline | 3 | 131 | Risk Ratio (M‐H, Random, 95% CI) | 1.33 [0.74, 2.39] |
| 3.4 Intravaginal ejaculatory latency time Show forest plot | 14 | 576 | Mean Difference (IV, Random, 95% CI) | 3.36 [1.62, 5.10] |
| 3.4.1 Citalopram | 3 | 157 | Mean Difference (IV, Random, 95% CI) | 4.85 [3.14, 6.56] |
| 3.4.2 Duloxetine | 1 | 20 | Mean Difference (IV, Random, 95% CI) | 1.52 [0.80, 2.24] |
| 3.4.3 Fluoxetine | 5 | 149 | Mean Difference (IV, Random, 95% CI) | 2.46 [1.52, 3.39] |
| 3.4.4 Fluvoxamine | 1 | 12 | Mean Difference (IV, Random, 95% CI) | 0.59 [‐0.35, 1.53] |
| 3.4.5 Paroxetine | 3 | 107 | Mean Difference (IV, Random, 95% CI) | 6.51 [0.33, 12.68] |
| 3.4.6 Sertraline | 4 | 131 | Mean Difference (IV, Random, 95% CI) | 2.55 [1.54, 3.56] |
| 3.5 Depression Show forest plot | 1 | 14 | Risk Ratio (M‐H, Random, 95% CI) | 2.00 [0.23, 17.34] |
| 3.5.1 Fluoxetine | 1 | 14 | Risk Ratio (M‐H, Random, 95% CI) | 2.00 [0.23, 17.34] |
| Outcome or subgroup title | No. of studies | No. of participants | Statistical method | Effect size |
| 4.1 Participant perception of change with treatment Show forest plot | 4 | 3214 | Risk Ratio (M‐H, Random, 95% CI) | 1.87 [1.66, 2.10] |
| 4.1.1 Dapoxetine 30 mg daily | 1 | 508 | Risk Ratio (M‐H, Random, 95% CI) | 1.87 [1.37, 2.54] |
| 4.1.2 Dapoxetine 30 mg on‐demand | 2 | 1021 | Risk Ratio (M‐H, Random, 95% CI) | 2.00 [1.33, 3.01] |
| 4.1.3 Dapoxetine 60 mg daily | 1 | 500 | Risk Ratio (M‐H, Random, 95% CI) | 1.68 [1.23, 2.30] |
| 4.1.4 Dapoxetine 60 mg on‐demand | 2 | 1185 | Risk Ratio (M‐H, Random, 95% CI) | 1.98 [1.58, 2.48] |
| 4.2 Participant satisfaction with intercourse Show forest plot | 3 | 2968 | Risk Ratio (M‐H, Random, 95% CI) | 1.53 [1.37, 1.71] |
| 4.2.1 Dapoxetine 30 mg daily | 1 | 500 | Risk Ratio (M‐H, Random, 95% CI) | 1.41 [1.08, 1.85] |
| 4.2.2 Dapoxetine 30 mg on‐demand | 1 | 1309 | Risk Ratio (M‐H, Random, 95% CI) | 1.59 [1.33, 1.90] |
| 4.2.3 Dapoxetine 60 mg daily | 1 | 507 | Risk Ratio (M‐H, Random, 95% CI) | 1.39 [1.07, 1.82] |
| 4.2.4 Dapoxetine 60 mg on‐demand | 1 | 652 | Risk Ratio (M‐H, Random, 95% CI) | 1.61 [1.32, 1.98] |
| 4.3 Study withdrawal due to adverse events Show forest plot | 7 | 6378 | Risk Ratio (M‐H, Random, 95% CI) | 4.54 [2.89, 7.14] |
| 4.3.1 Dapoxetine 30 mg daily | 1 | 533 | Risk Ratio (M‐H, Random, 95% CI) | 3.03 [0.37, 25.01] |
| 4.3.2 Dapoxetine 30 mg on‐demand | 3 | 2390 | Risk Ratio (M‐H, Random, 95% CI) | 2.44 [1.06, 5.59] |
| 4.3.3 Dapoxetine 60 mg daily | 3 | 916 | Risk Ratio (M‐H, Random, 95% CI) | 8.76 [2.10, 36.49] |
| 4.3.4 Dapoxetine 60 mg on‐demand | 3 | 2539 | Risk Ratio (M‐H, Random, 95% CI) | 6.51 [3.64, 11.66] |
| 4.4 Perceived control over ejaculation Show forest plot | 3 | 4273 | Risk Ratio (M‐H, Random, 95% CI) | 2.29 [1.72, 3.05] |
| 4.4.1 Dapoxetine 30 mg daily | 1 | 500 | Risk Ratio (M‐H, Random, 95% CI) | 1.79 [1.26, 2.53] |
| 4.4.2 Dapoxetine 30 mg on‐demand | 1 | 1305 | Risk Ratio (M‐H, Random, 95% CI) | 3.70 [2.72, 5.04] |
| 4.4.3 Dapoxetine 60 mg daily | 1 | 507 | Risk Ratio (M‐H, Random, 95% CI) | 1.78 [1.26, 2.52] |
| 4.4.4 Dapoxetine 60 mg on‐demand | 2 | 1961 | Risk Ratio (M‐H, Random, 95% CI) | 2.28 [1.65, 3.16] |
| 4.5 Participant distress about PE Show forest plot | 1 | 652 | Risk Ratio (M‐H, Random, 95% CI) | 1.54 [1.26, 1.88] |
| 4.5.1 Dapoxetine 60 mg on‐demand | 1 | 652 | Risk Ratio (M‐H, Random, 95% CI) | 1.54 [1.26, 1.88] |
| 4.6 Relationship difficulties Show forest plot | 1 | 652 | Risk Ratio (M‐H, Random, 95% CI) | 1.20 [1.07, 1.34] |
| 4.6.1 Dapoxetine 60 mg on‐demand | 1 | 652 | Risk Ratio (M‐H, Random, 95% CI) | 1.20 [1.07, 1.34] |
| 4.7 Adverse events Show forest plot | 6 | 3818 | Risk Ratio (M‐H, Random, 95% CI) | 1.74 [1.46, 2.07] |
| 4.7.1 Dapoxetine 30 mg daily | 2 | 1028 | Risk Ratio (M‐H, Random, 95% CI) | 1.64 [1.30, 2.07] |
| 4.7.2 Dapoxetine 30 mg on‐demand | 1 | 581 | Risk Ratio (M‐H, Random, 95% CI) | 1.47 [1.20, 1.79] |
| 4.7.3 Dapoxetine 60 mg daily | 3 | 891 | Risk Ratio (M‐H, Random, 95% CI) | 2.73 [2.03, 3.66] |
| 4.7.4 Dapoxetine 60 mg on‐demand | 2 | 1318 | Risk Ratio (M‐H, Random, 95% CI) | 1.56 [1.23, 1.99] |
| 4.8 Intravaginal ejaculatory latency time Show forest plot | 4 | 5173 | Mean Difference (IV, Random, 95% CI) | 1.48 [1.20, 1.75] |
| 4.8.1 Dapoxetine 30 mg daily | 1 | 502 | Mean Difference (IV, Random, 95% CI) | 1.80 [1.27, 2.33] |
| 4.8.2 Dapoxetine 30 mg on‐demand | 3 | 2329 | Mean Difference (IV, Random, 95% CI) | 1.37 [0.86, 1.89] |
| 4.8.3 Dapoxetine 60 mg daily | 1 | 504 | Mean Difference (IV, Random, 95% CI) | 1.50 [0.98, 2.02] |
| 4.8.4 Dapoxetine 60 mg on‐demand | 2 | 1838 | Mean Difference (IV, Random, 95% CI) | 1.53 [1.09, 1.97] |
| Outcome or subgroup title | No. of studies | No. of participants | Statistical method | Effect size |
| 5.1 Study withdrawal due to adverse events Show forest plot | 3 | 72 | Risk Ratio (M‐H, Random, 95% CI) | 2.09 [0.26, 16.82] |
| 5.1.1 Fluoxetine 20 mg daily | 3 | 72 | Risk Ratio (M‐H, Random, 95% CI) | 2.09 [0.26, 16.82] |
| 5.2 Adverse events Show forest plot | 4 | 140 | Risk Ratio (M‐H, Random, 95% CI) | 2.50 [1.29, 4.86] |
| 5.2.1 Fluoxetine 20 mg daily | 2 | 57 | Risk Ratio (M‐H, Random, 95% CI) | 9.32 [1.88, 46.26] |
| 5.2.2 Fluoxetine 40 mg daily | 1 | 23 | Risk Ratio (M‐H, Random, 95% CI) | 2.29 [0.55, 9.49] |
| 5.2.3 Fluoxetine 90 mg daily | 1 | 60 | Risk Ratio (M‐H, Random, 95% CI) | 1.78 [0.76, 4.17] |
| 5.3 Intravaginal ejaculatory latency time Show forest plot | 5 | 149 | Mean Difference (IV, Random, 95% CI) | 2.46 [1.52, 3.39] |
| 5.3.1 Fluoxetine 20 mg daily | 3 | 66 | Mean Difference (IV, Random, 95% CI) | 2.87 [1.26, 4.48] |
| 5.3.2 Fluoxetine 40 mg daily | 1 | 23 | Mean Difference (IV, Random, 95% CI) | ‐0.54 [‐3.57, 2.49] |
| 5.3.3 Fluoxetine 90 mg daily | 1 | 60 | Mean Difference (IV, Random, 95% CI) | 2.72 [1.83, 3.61] |
| 5.4 Depression Show forest plot | 1 | 14 | Risk Ratio (M‐H, Random, 95% CI) | 2.00 [0.23, 17.34] |
| 5.4.1 Fluoxetine 20 mg daily | 1 | 14 | Risk Ratio (M‐H, Random, 95% CI) | 2.00 [0.23, 17.34] |